biannual multilingual - swarnim gujarat sports university ... · studying students get many...
TRANSCRIPT


Biannual Multilingual
International Journal of Physical Education and Sports Sciences
ISSN: 2349- 3992 Volume 3, No.1 July, 2016
Peer Reviewed and Referred Journal
Editor
Dr. Sudhir Kumar Sharma
Swarnim Gujarat
Sports University
Sports Performance
Sports Culture
Experts
Teacher Education Program
High Performance
Training Program
Applied Sports Science
Education Program
Technical Official
Training Program
Coach Education Program
Vyayam Setu

Volume: 3, Issue: 1, July 2016 ISSN –2349- 3992
Vyayam Setu: International Journal of Physical Education and Sports Sciences
ii
About University
The Gujarat Govt. has taken a praiseworthy initiative by establishing Swarnim Gujarat Sports
University (SGSU) in Gandhinagar for the bright future of the sporting world. A strong and healthy
atmosphere for sports has been created in Gujarat through events like Khel Mahakumbh and new
sports schools/academies. The establishment of Swarnim Gujarat Sports University has opened up
doors for a wide range of opportunities for students of Physical education and sports sciences for
making career in sports industry. The greatest advantage of studying sports is that alongside
studying students get many opportunities of becoming a sports person. Sports persons nowadays
get great amount of financial help as well as international reputation due to the encouraging
policies of the government. Many renowned players have established their own training academies
and have succeeded in the professional field as well. At SGSU a number of career oriented courses
will be offered. Until now, the activities of sports and physical education were limited only to
school and colleges due to which sports coaches and teachers could avail limited job opportunities.
In recent times, there are several opportunities both in public and private sectors. In private sectors,
many recreation clubs, five star hotels, entertainment theme parks, corporate societies, modern
townships and private residential buildings with world class facilities have come into existence
wherein facilities for sporting activities is accorded prime importance. As a result, new
opportunities have arisen for building careers as sports coordinator, swimming pool attendant, gym
coach, recreation manager etc. Besides, today many private international and national day schools
have been established in which there are requirements of sports coordinators and physical
educators. There are some other fields which are still unfamiliar and untried by the students such
as Adventure Sports, Sports Management, Sports Event Management, Sports Tourism, Sports
Law, Sports Journalism, Sports Nutrition, Sports Physiotherapy, Sports Massage etc. Career in
these fields can earn name, fame and money. SGSU will commence new courses like “P.G.
Diploma in Sports Tourism” and “P.G. Diploma in Adventure Sports Administration” so as to
prepare experts who can organize national and international level adventure sports activities. At
present there is a lack of experts in the aforementioned fields, as a result of which, programmes of
international standards cannot be organized. In fitness industry as well fields like Sports
Physiotherapy, Sports Nutrition and Medicine, Sports Massage and Sports Exercise therapy etc.
lacks experts. SGSU will offer one year course “P.G. Diploma in Disability Sports” to prepare
experts in this field.
About the Journal
Vyayam Setu is a Referred Biannual and Multilingual International Journal of Physical Education
and Sports Sciences. It promotes interdisciplinary perspective to significant national and
international issues related to sports and physical education. Its regular features include research
book editorial correspondence. All the research papers are subject to a double – blind referring
process and published on the recommendations of referees and the editors. As far as the research
papers are concerned, the views or statements expressed in the research papers are solely of the
author and the editors are not responsible for the same.

Volume: 3, Issue: 1, July 2016 ISSN –2349- 3992
Vyayam Setu: International Journal of Physical Education and Sports Sciences
iii
Editorial Board
Patron
Prof. Jatin Soni
Vice Chancellor,
Swarnim Gujarat Sports University,
Editor
Dr. Sudhir Kumar Sharma
Co-Editor’s
Dr. Om Prakash Mishra
Ms. Smiti Padhi
Advisory Board
Dr. C. B. Kagthara
Dr. K. J. Gohil
Dr. J. K. Savalia
Dr. Dilip T. Jaiswal
Dr. Inder Mohan Datta
Dr. Nagendra Sharma
Dr. Sushma Ghildyal
Dr. Niraj Silavat
Mr. Ravindra Singh Rajpurohit
Mr. Y. L. Jethwa
Referee’s Board
Prof. R. Thirumalaisamy (India)
Prof. M Chandra Kumar (India)
Prof. Dr. G. L. Khanna (India)
Dr.(Mrs.) A. Shenbagavalli(India)
Dr. Youd Vir Singh (India)
Dr. Oleksandr Krasilshchikov (Malaysia)
Dr. D. Maniazhagu (India)
Dr. Nagendra Sharma (India)
Dr. J. K. Thakur (India)
Dr. Alia Sultangalie
Dr. G D Ghai
Dr. Deepak Mehta
Dr. Thirumalaikumar Subramanian
Dr. Y. Kishore
All correspondence related to the Journal should be addressed to:-
Editor,
Vyayam Setu,
Swarnim Gujarat Sports University,
Sector 15, Gandhinagar, 382015
Ph: 079-23288364, Mob: 08733934430
Website: www.sgsu.gujarat.gov.in
Email: [email protected]

Volume: 3, Issue: 1, July 2016 ISSN –2349- 3992
Vyayam Setu: International Journal of Physical Education and Sports Sciences
iv
GUIDELINES FOR AUTHORS
VYAYAM SETU welcomes articles of interest representing original work, analytical Papers and
papers based on review of extensive literature on Physical Education and Sports Sciences .All
communications should be addressed to the Editor, Vyayam Setu, Swarnim Gujarat Sports
University, Sector 15, Gandhinagar, Gujarat 382015.
Declaration: Each article should be accompanied with a declaration by all the authors that I/They
am/are the authors of the article in the order in which listed and the article is original, has not been
published or submitted for publication elsewhere. It is the author’s responsibility to obtain
permission in writing for the use of all previously published material, and not of the editor or
publisher.
Manuscript: Manuscripts should be type/written (double spacing) on one side of the white A4
paper. These should normally consist of five to eight thousand words. The length of the full paper
must be 4-6 single spaced (Books typed) pages. Please use Time New Roman Font with 12pt. size.
(In adobe Page Maker), Papers in Hindi language should be typed in Krutidev 40, 12pt. size in
adobe PageMaker (Book Styled), Papers in Gujarati language should be typed in Shruti, 12 pt.
Size in Adobe Page Maker (Book Styled). Abstract: The first page of the article should contain
an abstract of the article not exceeding 200 words. Reference: The author should follow the APA
style of reference writing. The reference list at the end should provide complete information
necessary to identify and retrieve each source. References sited in the text must appear in the
reference list; conversely, each entry in the reference list must be cited in the text, both should be
identical in spelling and year. Submission of Articles: Articles should be sent by post or e-mail
along with your brief bio-data and email Id. One hard copy along with the CD should be sent.
Review System: Every Article will be reviewed by a masked peer review by two referees. The
criteria used for acceptance of articles are contemporary relevance, contribution to knowledge,
clear and logical analysis, and sound methodology of research articles. The Editor reserves the
right to reject any manuscript as unsuitable in topic, style or form without requesting external
review. Copyright: The author owns the copyright of the article until it is accepted by the Editor
for publication. After the acceptance communication, the copyright of the article is owned by the
VYAYAM SETU, and should not be reproduced elsewhere without the written permission of the
Editor and the authors of the article.
Important Information
a) Acceptance of the paper will be sent through e-mail.
b) For getting the copies of “Reprints”, kindly inform before the publication of the Journal. In this
regard, the fees will be charged from the author.
c) Authors should submit their research paper/Article along with processing fee @ Rs.1,000/= per
paper. The editorial board has the power to wave the fee.
d) Research Papers will be reviewed and will be published on the recommendations of the
members of the referee Board, the advisory board and experts of the subjects and the discretion of
the editor.

Volume: 3, Issue: 1, July 2016 ISSN –2349- 3992
Vyayam Setu: International Journal of Physical Education and Sports Sciences
v
Editorial
“From the time of Upanishads, persons with knowledge have
been respected through the aes. We are now in the information
age. Even today, knowledge is the best guiding light”
Hon’ble Prime Minister Shri Narendra Modi
It gives me the immense pleasure to introduce the first issue of the third volume of Vyayam
Setu, which is the official research journal of the Swarnim Gujarat Sports University. Founded in
2014 with a vision to provide platform to the young research scholars and supervisors in the field
of Physical Education, Sports Management, Engineering and Technology, it publishes quality
international articles on sports. The Journal intends to fill the niche area which lies between
physical education and allied sports science and aims to bridge the gap between analysis of the
equipment and the athlete. The Journal acts as a forum where research, industry and the sports
sector can exchange knowledge and ideas.
In this first issue of the third volume, 15 papers have been included. Out of fifteen 7 papers
are in the in the regional language (Gujarati) which highlights the research work going in the
regional language also which can spread the research to the sports lovers and common man lives
in the region and 8 papers are in English.
With a distinguished editorial board, Vyayam Setu is dedicated to maintaining high
academic standards, integrity, and excellence by publishing scholarly work of the highest quality
in the sub-disciplines of Physical Education, Sports Management, Adventure Sports, Health and
Yogic Sciences.
Dr. Sudhir Kumar Sharma
Editor

Volume: 3, Issue: 1, July 2016 ISSN –2349- 3992
Vyayam Setu: International Journal of Physical Education and Sports Sciences
vi
CONTENTS Sr. No. Title Page No.
1. હોકી ખેલાડીઓના માનસિક સ્વાસ્્ય અન ે જીવન િતંોષનો તલુનાત્મક અભ્યાિ
અલારખ ગ. કુરેશી અને ડૉ. જયકિશન સતંોષી
1-3
2. આંતર સવશ્વસવદ્યાલય કક્ષાએ ભાગ લીધેલ બાસ્કેટબોલ, વોલીબોલ અન ે
હને્ડબોલ રમતના ખેલાડીઓની માનસિક સ્વાસ્્ય પર થતીઅિરનો અભ્યાિ
જીગર ર. આગજા અને ડૉ. િે.જે. ગોકિલ
4-6
3. તરણ પ્રવસૃિ િાથે જોડાયેલા સવદ્યાથીઓ અને અન્ય રમત પ્રવસૃિ િાથે જોડાયેલા સવદ્યાથીઓની ઝડપ અને ચપળતાનો તલુનાત્મક અભ્યાિ
મનનષ પટેલ અને ડૉ. િે. જે. ગોકિલ
7-10
4. યોગાિન અને પ્રાણાયામની ક્રિયા દ્વારા માનસિક સ્વાસ્્ય ઉપર થતી અિરોનો અભ્યાિ
મોિંમદ િા. બાદી
11-13
5. િઘં વ્યાયામની પ્રવસૃિઓ દ્વારા મેદસ્વીતા ધરાવતા બાળકોની શ્વાિ રોકવાની શક્તત પર થતી અિરોનો અભ્યાિ
મોિસીનઆઝાદ કુરેશી અને ડૉ. જગદીશચદં્ર ગોઠી
14-16
6. આંતર યસુનવસિિટી કક્ષાએ પિદંગી પામેલ હને્ડબોલ રમતના ખેલાડી ભાઈઓના માનસિક સ્વાસ્્યનો તલુનાત્મક અભ્યાિ
સગંીતા દુ. વાળા
17-19
7. યોગાિન અને સયૂય નમસ્કારની ક્રિયા દ્વારા માનસિક સ્વાસ્્ય ઉપર થતી અિરોનો અભ્યાિ
નવષ્ણ ુજ. ચૌધરી અને ડૉ. જગદીશચદં્ર િે. સાવલલયા
20-22
8. MENTAL HEALTH AND SELF CONFIDENCE OF TRACK
AND FIELD ATHLETES OF AMITY UNIVERSITY – A
COMPARATIVE STUDY
Dr. Poonam Singh
23-25
9. A COMPERATIVE STUDY OF COMPETITIVE BEHAVIOR
AMONG THE SPORTS MAN OF INDIVIDUAL AND TEAM
GAMES OF GUJARAT
Mr. Ravi Bhadoria
26-30

Volume: 3, Issue: 1, July 2016 ISSN –2349- 3992
Vyayam Setu: International Journal of Physical Education and Sports Sciences
vii
10. INFLUENCE OF DIFFERENT RESISTANCE TRAINING
PROTOCOLS ON SELECTED PHYSIOLOGICAL AND
BIOCHEMICAL VARIABLES OF COLLEGE MEN STUDENTS
Surender Pratap Singh and Dr. Sudhir Kumar Sharma
31-33
11. EFFECT OF TRAINING WITH AEROBICS AND SPECIAL
EXERCISE ON BODY COMPOSITION OF WORKING
WOMEN
Meeta R .Vyas and Prof. Jamnadas K. Savaliya
34-43
12. EFFECT OF DIFFERENT DRILLS AND EXERCISE ON
MOTOR COMPONENT OF TABLE TENNIS PLAYERS
Mohammed Hasam Dhupli and Dr. N. K. Datta
44-49
13. COMPARATIVE STUDY OF AGGRESSION BETWEEN
CRICKET AND KABADDI MALE PLAYERS
Honey Bhatia and Dr. Vivek B. Sathe
50-52
14. EFFECT OF VISUALIZATION AND IMAGERY TRAINING ON
SPORTS PERFORMANCE USING SPORTS HYPNOSIS
Imran I. Kagzi
53-58
15. COMPARATIVE ANALYSIS OF SELECTED
PSYCHOLOGICAL AND SOCIO ECONOMICAL VARIABLES
AMONG VARIOUS ZONES OF ALL INDIA INTER
UNIVERSITY
Manoj Sethi and Dr. Sudhir Kumar Sharma
59-62

Volume: 3, Issue: 1, July 2016 ISSN –2349- 3992
Vyayam Setu: International Journal of Physical Education and Sports Sciences 1
હોકી ખેલાડીઓના માનસિક સ્વાસ્્ય અને જીવન િતંોષનો તલુનાત્મક અભ્યાિ
અલારખ ગ. કુરેશી ડૉ. જયકકશન િતંોષી પીએચ.ડી. સ્કોલર એસોશિયેટ પ્રોફેસર
સ્વર્ણિમ ગજુરાત સ્પોટટસ યશુિવશસિટી, જ્યોશતબાફુલે ફફર્િકલ એજ્યકેુિિ કોલેજ,
સેક્ટર ૧૫, ગાાંધીિગર ૩૮૨૦૧૬. િાગપરુ, મહારાષ્ટ્રI ૪૪૧૨૦૩.
ટ ંકિાર: આ સાંિોધિ અભ્યાસિો હતે ુહોકીિી ખેલાડી બહિેો િા માિશસક સ્વાસ્્ય અિે જીવિ સાંતોષિો તલુિાત્મક અભ્યાસ કરવાિો હતો. આ સાંિોધિ અભ્યાસ માટે આંતર કોલેજ કક્ષાએ કમાણી સાયન્સ અિે પ્રતાપરાય આટટસ કોલેજ, અમરેલીિી 12 તથા એલ. ડી. ધાિાણી આટટસ કોલેજ, અમરેલીિી 12 એમ કુલ 24 હોકી રમતમાાં ભાગ લીધેલ ખેલાડી બહિેોિે શવષયપાત્રો તરીકે પસાંદ કરવામાાં આવી હતી. માિશસક સ્વાસ્્યિા માપિ માટે ડૉ. ડી. જી. ભટ્ટ અિે જી. આર. ગીડા રર્ચત પ્રશ્નાવર્લ કસોટી અિે જીવિ સાંતોષિા માપિ માટે ક્ય.ુ જી. આલમ અિે રામજી શ્રીવાસ્તવ રર્ચત કસોટીિા આંકડાઓનુાં એકત્રીકરણ કરી બાંિે જૂથોિા પ્રાપતાાંકો પર ‘t’ કસોટી લાગ ુપાડી 0.05 કક્ષાએ સાથટકતા ચકાસતા બાંિે જૂથોિા માિશસક સ્વાસ્્ય અિે જીવિ સાંતોષમાાં સાથટક તફાવત જોવા મળ્યો િ હતો. પ્રસ્તાવનાાઃ
માિશસક સ્વાસ્્ય જો સારુાં હોય તો માિવી સારી રીતે શવચારી િકે છે અિે તેિામાાં શિણટયો લેવાિી િક્ક્ત પણ સારી હોય છે. દરેક પફરક્સ્થશતમાાં ઉત્તમ કાયટ કરી િકે છે દુશિયા માાં જે મોટા યદુ્ધો થાય છે તેમાાં િારીફરક તાકાત કાંઇક અંિે જવાબદાર હિે પરાંત ુમાત્ર િારીફરક બળ થી કડી શવજેતા બિી િકાત ુાં િથી. િારીફરક તાકાત એ માિશસક સ્ૂશતિ શવિા અધરુી છે. માત્ર પાિવી િારીફરક િારીફરક તાકાત ધરાવતી વ્યક્ક્તિે તેિા કરતા અડધી િારીફરક તાકાત ધરાવતા કરાટે, ટેક્વેન્ડો, કુાંગ ૂ વગેરે જેવી કળામાાં શિષ્ટ્ણાાંત વ્યક્ક્ત પણ મહાત કરી િકે છે, કેવળ િારીફરક તાકાત તો પશમુાાં પણ હોય છે એટલ ેિારીફરક તાકાત િે જ્યાાં સધુી માિશસક તાકાતિો સાથ િ મળે ત્યાાં સધુી તેિી અસર અધરુી રહ ેછે. એટલે જ બળ અિે બદુ્ધદ્ધિો સમન્વય કરવો પડ ેછે.
જીવિસાંતોષ અંગેિા અધ્યયિિો ઈશતહાસ ઘણો જ જુિો માિવામાાં આવે છે, કારણ કે જીવિસાંતોષ અંગેિી સાંકલ્પિા મિોશવજ્ઞાિિી જેમ જ તફાવત માાંથી મળી આવે છે. ન્યાય શવિેષકિા માટે સખુ અિે દુ:ખ એકબીજાથી સ્વતાંત્ર અિે શવરોધી લાગણીઓ છે તે ઇચ્છિીય અિે ઈચ્છિીય પદાથટિા જ્ઞાિમાાંથી ઉત્પન્ન થય છે.સખુ એ સાનકુુળતા િી લાગણી છે અિે આ અનકુુળતા િી લાગણી સાંતોષિે શિધાટફરત કરે છે. મહાિ િરીરિાસ્ત્રી ચરકિા મતે સાંતોષ એ િારીફરક રાસાયર્ણક દ્રવ્યોિી સમતલુા અસમતલુા પરથી શિધાટફરત થય છે તેઓિા મત પ્રમાણ ેસખુ દુ:ખિી લાગણી િરીરમાાં રાસાયર્ણક દ્રવ્યોિી અસમતલુા માાંથી ઉત્પન્ન થય છે મિ અિે િરીર બાંિે માાંથી અનકુ્રમે િારીફરક અિે માિશસક, સખુ દુ:ખ ઉદભવે છે. ચરક િો સખુ – દુ:ખ િો શસદ્ધાાંત જીવિ સાંતોષિો માાંિોવેજ્ઞાિીક આધાર રજુ કરે છે.

Volume: 3, Issue: 1, July 2016 ISSN –2349- 3992
Vyayam Setu: International Journal of Physical Education and Sports Sciences 2
અભ્યાિનો હતેાુઃ આ સાંિોધિ અભ્યાસિો હતે ુહોકી રમતિી ખેલાડી બહિેો વચ્ચે માિશસક સ્વાસ્્યિી તલુિા
કરવાિો હતો. આ સાંિોધિ અભ્યાસિો હતે ુહોકી રમતિી ખેલાડી બહિેો વચ્ચે જીવિ સાંતોષિી તલુિા
કરવાિો હતો. સવષપાત્રોની પિદંગીાઃ
આ સાંિોધિ અભ્યાસ માટે આંતર કોલેજ કક્ષાએ ભાગ લીધેલ કમાણી સાયન્સ અિ ેપ્રતાપરાય આટટસ કોલેજ, અમરેલીિી 12 તથા એલ. ડી. ધાિાણી આટટસ કોલેજ, અમરેલીિી 12 એમ કુલ 24 હોકી રમતિી ખેલાડી બહિેો િે જ શવષયપાત્રો તરીકે પસાંદ કરવામાાં આવી હતી. માપનના ધોરણોાઃ
માિશસક સ્વાસ્્યિા માપિ માટે ડૉ. ડી. જી. ભટ્ટ અિે જી. આર. ગીડા રર્ચત પ્રશ્નાવર્લ કસોટી અિે જીવિ સાંતોષિા માપિ માટે ક્ય.ુ જી. આલમ અિે રામજી શ્રીવાસ્તવ રર્ચત પ્રશ્નાવર્લિો ઉપયોગ કરવામાાં આવ્યો હતો. આંકડાકીય પ્રકિયાાઃ
માિશસક સ્વાસ્્ય અિે જીવિ સાંતોષિી કસોટીિા આંકડાઓનુાં એકત્રીકરણ કરી બાંિે જૂથોિા પ્રાપતાાંકો પર ‘t’ કસોટી લાગ ુપાડી 0.05 કક્ષાએ સાથટકતા ચકાસવામાાં આવી હતી. અભ્યાિના પકરણામોાઃ
િીચેિી સારણીઓ પરથી અભ્યાસિા પફરણામો સ્પષ્ટ્ટ થાય છે. િારણી-1 હોકીના ખેલાડીઓની માનસિક સ્વાસ્્ય કિોટીના મધ્યક, મધ્યક તફાવત અને ‘t’ રેસશયો દશાાવતી િારણી
જ થ સવષયપાત્રોની
િખં્યા મધ્યક
પ્રમાણણત સવચલન
મધ્યક તફાવત
‘t’
કમાણી સાયન્સ અિે પ્રતાપરાય આટટસ કોલેજ
12 91.833 6.322
3.583 1.145 એલ. ડી. ધાિાણી આટટસ
કોલેજ 12 95.417 8.795
*સાથટકતાનુાં ધોરણ 0.05 કક્ષાએ ‘t’ = (22) 2.074
સારણી-1 પરથી માલમુ પડ ેછે કે માિશસક સ્વાસ્્ય કસોટીમાાં કમાણી સાયન્સ અિે પ્રતાપરાય આટટસ કોલેજિી હોકી રમતિી ખલેાડી બહિેોિો મધ્યક 91.833 અિે એલ. ડી.ધાિાણી આટટસ કોલેજિી હોકી રમતિી ખેલાડી બહિેોિો મધ્યક 95.417 જોવા મળ્યો હતો. જેિો મધ્યક તફાવત 3.583 જોવા મળ્યો હતો. તમેજ પ્રાપત થયલે ‘t’ રેશિયો 1.145 જોવા મળ્યો હતો. જે 0.05 કક્ષાએ સાથટક જોવા મળ્યો િ હતો. આથી સ્પષ્ટ્ટ થાય છે કે, કમાણી સાયન્સ અિે પ્રતાપરાય આટટસ કોલેજ અિે એલ. ડી. ધાિાણી આટટસ કોલેજિી હોકી

Volume: 3, Issue: 1, July 2016 ISSN –2349- 3992
Vyayam Setu: International Journal of Physical Education and Sports Sciences 3
રમત સાથ ેજોડાયેલા ખલેાડી બહિેોિા માિશસક સ્વાસ્્યમાાં કોઈપણ પ્રકારિો તફાવત જોવા મળ્યો િ હતો. આથી બાંિે જૂથોિા માિશસક સ્વાસ્્યમાાં સમાિતા જોવા મળી હતી. િારણી-2
હોકી રમતની ખેલાડી બહનેોની જીવન િતંોષ કિોટીના મધ્યક, મધ્યક તફાવત અને ‘t’ રેસશયો દશાાવતી િારણી
જ થ સવષયપાત્રોની
િખં્યા મધ્યક
પ્રમાણણત સવચલન
મધ્યક તફાવત
‘t’
કમાણી સાયન્સ અિે પ્રતાપરાય આટટસ કોલેજ
12 40.333 5.757
3 1.301 એલ. ડી. ધાિાણી આટટસ
કોલેજ 12 37.333 5.532
*સાથટકતાનુાં ધોરણ 0.05 કક્ષાએ ‘t’ = (22) 2.074
સારણી-2 પરથી માલમુ પડ ેછે કે જીવિ સાંતોષ કસોટીમાાં કમાણી સાયન્સ અિે પ્રતાપરાય આટટસ કોલેજિી હોકી રમતિી ખેલાડી બહિેોિો મધ્યક 40.333 અિે એલ. ડી. ધાિાણી આટટસ કોલેજિા હોકી રમતિી ખલેાડી બહિેો િો મધ્યક 37.333 જોવા મળ્યો હતો. જેિો મધ્યક તફાવત 3 જોવા મળ્યો હતો. તેમજ પ્રાપત થયલે ‘t’ રેશિયો 1.301 જોવા મળ્યો હતો. જે 0.05 કક્ષાએ સાથટક જોવા મળ્યો િ હતો. આથી સ્પષ્ટ્ટ થાય છે કે, કમાણી સાયન્સ અિે પ્રતાપરાય આટટસ કોલેજ અિે એલ. ડી. ધાિાણી આટટસ કોલજેિી હોકી રમત સાથે જોડાયેલ ખેલાડી બહિેોિા જીવિ સાંતોષમાાં કોઈપણ પ્રકારિો તફાવત જોવા મળ્યો િ હતો. આથી બાંિે જૂથોિા જીવિ સાંતોષમાાં સમાિતા જોવા મળી હતી.
િારાશંાઃ કમાણી સાયન્સ અિે પ્રતાપરાય આટટસ કોલેજ અિ ેએલ. ડી. ધાિાણી આટટસ કોલેજિી હોકી
રમત સાથે જોડાયેલ ખેલાડી બહિેોિા માિશસક સ્વાસ્્યમાાં કોઈપણ પ્રકારિો તફાવત જોવા મળ્યો િ હતો.
કમાણી સાયન્સ અિે પ્રતાપરાય આટટસ કોલેજ અિ ેએલ. ડી. ધાિાણી આટટસ કોલેજિી હોકી રમત સાથે જોડાયેલ ખેલાડી બહિેોિાિા જીવિ સાંતોષમાાં કોઈપણ પ્રકારિો તફાવત જોવા મળ્યો િ હતો.
િદંર્ાગ્રથં શત્રવેદી ,ફદવ્યેિ(1997) ,સેલ્ફ મેિેજમેન્ટ” સફળતાિા સમીકરણ ,અમદાવાદ: િવભારત સાફહત્ય માંફદર,
કોઠારી ,મધભુાઈ ,(1998) વૈયક્ક્તક સમાયોજિનુાં મિોશવજ્ઞાિ , અમદાવાદઃ અંબાણી પ્રકાિિ,
વમાટ ,પ્રકાિ જે (2000) . એ ટેક્ષબકુ ઓિ સ્પોટટસ સ્ટેટીસ્ટીક્સ , ગ્વાર્લયરઃ શવિસ પબ્લલકેિિ.

Volume: 3, Issue: 1, July 2016 ISSN –2349- 3992
Vyayam Setu: International Journal of Physical Education and Sports Sciences 4
આંતર સવશ્વસવદ્યાલય કક્ષાએ ર્ાગ લીધેલ બાસ્કેટબોલ, વોલીબોલ અને
હને્ડબોલ રમતના ખેલાડીઓની માનસિક સ્વાસ્્ય
પર થતીઅિરનો અભ્યાિ
જીગર ર. આગજા ડૉ. કે.જે. ગોકહલ (ફરસચટ સ્કોલર) (એસોિીયેટ પ્રોફેસર) સ્વર્ણિમ ગજુરાત સ્પોર્ટટસ યશુિવસીટી, સી.પી. ડીગ્રી કોલેજ ઓફ ફફિીકલ એજ્યકેુિિ સેક્ટર ૧૫, ગાાંધીિગર ૩૮૨૦૧૬ રાજપીપળા, િમટદા િીલ્લા, ગજુરાત ૩૯૩૧૪૫
ટ ંકિાર: આ સાંિોધિ અભ્યાસિો હતે ુઆંતર શવશ્વ શવદ્યાલય કક્ષાએ ભાગ લીધેલ બાસ્કેટબોલ, વોલીબોલ અિ ે
હને્ડબોલ રમતિા ખલેાડીઓિી માિશસક સ્વાસ્્ય પર થતી અસર જાણવાિો હતો. આ સાંિોધિ અભ્યાસ માટે
ગજૂરાત શવદ્યાપીઠિી બાસ્કેટબોલ, હને્ડબોલ અિ ેવોલીબોલ રમતિા 36 શવષયપાત્રોિ ેપસાંદ કરી ડૉ. ડી.જે. ભટ્ટ અિ ેજી. આર. ગીડા રર્ચત માિશસક સ્વાસ્્યિી પ્રશ્નાવલીિે માપિિા ધોરણ તરીકે પસાંદ કરી આંકડાઓનુાં કરી ત્રણેય જૂથોિા પ્રાપતાાંકો પર ‘F’ ટેસ્ટ લાગ ુપાડી 0.05 કક્ષાએ સાથટકતા ચકાસતા ત્રણેય રમત જૂથોિી માિશસક સ્વાસ્્યમાાં કોઈ િોંધિીય તફાવત જોવા મળ્યો િા હતો.
પ્રસ્તાવના (Introduction) :
માિશસક સ્વાસ્્ય શવજ્ઞાિિો િલદિઃ અથટ કરીએ તો મિિા સ્વાસ્્ય અંગેનુાં શવજ્ઞાિ, માિશસક સ્વાસ્્ય
અંગેિી જાણકારી આપત ુિાસ્ત્ર એવો કરી િકાય. આ િાસ્ત્રિી જાણકારી એટલે સ્વચ્છ વાતાવરણમાાં રહવે ુાં. િારીફરક
સ્વચ્છતા પ્રત્ય ેસજાગતા, સમતોલ આહાર, રોગોિા જ ાંતઓુથી સાવચેત રહવે ુાં. આરોગ્યિા શિયમોનુાં પાલિ કરવુાં. રોગ થાય તો તેિી સારવાર અિ ેઅટકાવવાિાાં ઉપાયો કરવા વગેરે િારીફરક સ્વાસ્્યિા શિયમોનુાં પાલિ કયાટ પછી જો માણસ માાંદો રહ ેતો તેનુાં કારણ માિશસક સ્વાસ્્યમાાં અભાવિે ગણી િકાય. માિશસક સ્વાસ્્ય, તણાવ,
ભય, વાતાવરણમાાં ગસુ્સે થઈ જવુાં, હતાિા, શિરાિા વગરેે કારણોથી માણસ પોતાનુાં સ્વાસ્્ય ગમુાવે છે. માિશસક
અસ્વસ્થતા મનષુ્ટ્યિા િારીફરક સ્વાસ્્યિે પણ અસર કરે છે. મનષુ્ટ્યિે સાંપણૂટ સ્વસ્થ ત્યારે જ કહી િકાય, જ્યારે
તે માિશસક અિ ેિારીફરક એમ બાંિ ેરીતે સ્વસ્થ હોય. બાંિ ેએકબીજાિ ેઅસર કરે છે. માિશસક માિશસક સ્વાસ્્ય એ
સ્વાસ્્યિ ેબગાડ ેછે અિ ેિારીફરક માાંદગી મિમાાં અિેક પ્રકારિી માિશસક સ્વાસ્્યઓ પેદા કરે છે. એટલે માત્ર
િારીફરક સ્વાસ્્ય પ્રત્ય ેઘ્યાિ આપવાથી માણસ સ્વસ્થ િથી રહી િકતો. તે માિશસક રીતે પણ સ્વસ્થ હોવો જ
જોઈએ.
અભ્યાિના હતેઓુ (Objectives of Research) :
આંતર શવશ્વ શવદ્યાલય કક્ષાએ ભાગ લીધલે બાસ્કેટબોલ, વોલીબોલ અિ ેહને્ડબોલ રમતિા ખેલાડીઓિી માિશસક સ્વાસ્્ય પર થતી અસર જાણવાિો અસર જાણવાિો હતે.ુ
માપનના ધોરણો (Criterion Measures) :
ડૉ. ડી.જે. ભટ્ટ અિે જી. આર. ગીડા રર્ચત માિશસક સ્વાસ્્યિી પ્રશ્નાવલીિે માપિિા ધોરણ તરીકે
પસાંદ કરવમાાં આવી હતી.

Volume: 3, Issue: 1, July 2016 ISSN –2349- 3992
Vyayam Setu: International Journal of Physical Education and Sports Sciences 5
અભ્યાિની યોજના (Method and Material) :
ગજૂરાત શવદ્યાપીઠમાાં આંતર શવશ્વશવદ્યાલય કક્ષાએ પસાંદ થયેલ બાસ્કેટબોલ, વોલીબોલ અિ ેહને્ડબોલ
રમતમાાં કુલ 36 શવષયપાત્રોિે પસાંદ કરવામાાં આવ્યા હતા. અિ ેતમેિા માિશસક સ્વાસ્્ય કસોટી લાગ ુપાડી માિશસક સ્વાસ્્યિા પ્રપતાાંકો મેળવવામાાં આવ્યા હતા. આંકડાકીય પ્રકિયા (Statistical Analysis) :
આંતર શવશ્વ શવદ્યાલય કક્ષાએ ભાગ લીધેલ બાસ્કેટબોલ, વોલીબોલ અિ ેહને્ડબોલ રમતિા ખેલાડીઓિી માિશસક સ્વાસ્્ય પર થતી અસર જાણવાિો અસર જાણવા શવચરણ પ ૃ્ થકરણ (ANOVA) લાગ ુપડી 0.05 કક્ષાએ
સાથટકતા ચકાસતા િીચે મજુબિા પફરણામો પ્રાપત થયા હતા. અભ્યાિના પકરણામો (Result of the Study) :
િીચે આપલેી સારણીઓ પરથી અભ્યાસિા પફરણામો સ્પષ્ટ્ટ થાય છે.
િારણી – 1, માનસિક સ્વાસ્્ય કિોટી દેખાવના બાસ્કેટબોલ, વોલીબોલ, અને હને્ડબોલ રમત જ થોનુ ં સવચરણ
પ ૃ્ થકરણ.
જ થ
સવચરણ િહ સવચરણ પ ૃ્ થકરણ (ANOVA, ANCOVA TABLE)
સવષયપત્રોની િખં્યા
મધ્યક વગોનો િરવાળો
(SS)
સ્વતતં્ર માત્રા (df)
મધ્યક સવચરણ
(MSS) ‘F’
બાસ્કેટબોલ 12 23 A 6 2 3
0.276 વોલીબોલ 12 23.5
W 358 33 10.848 હને્ડબોલ 12 22.5
*િાથાકતનુ ંધોરણ 0.05 કક્ષાએ ‘F’ = 0.05 (2, 33) = 3.284
સારણી-1 માાં બાસ્કેટબોલ રમતિો મધ્યક 23 જોવા મળેલ હતો, વોલીબોલ કસોટીિો મધ્યક 23.5 જોવા મળેલ હતો અિ ેહને્ડબોલ કસોટીિો મધ્યક 22.5 જોવા મળેલ હતો. જેિો ‘F’ રેશિયો 0.276 જોવા મળેલ હતો. જે
0.05 કક્ષાએ અસાથટક જોવા મળેલ હતો. આલેખ – 1, માનસિક સ્વાસ્્ય કિોટી દેખાવના બાસ્કેટબોલ, વોલીબોલ અને હને્ડબોલ રમત જ થના મધ્યકો દશાાવતો આલેખ
23 23.5 22.5
0
5
10
15
20
25
બાસ્કેટબોલ વોલીબોલ હને્ડબોલ

Volume: 3, Issue: 1, July 2016 ISSN –2349- 3992
Vyayam Setu: International Journal of Physical Education and Sports Sciences 6
િારાશં (Conclusion) :
આંતર શવશ્વશવદ્યાલય કક્ષાએ પસાંદ થયેલ બાસ્કેટબોલ, વોલીબોલ અિે હને્ડબોલ રમતિા ખેલાડીઓિી માિશસક સ્વાસ્્યમાાં કોઈ તફાવત જોવા મળ્યો િ હતો.
િદંર્ા ગ્રથં (Bibliography) :
વમાટ,પ્રકાિ જે., (2000) એ ટેક્ષબકુ ઓિ સ્પોટટસ સ્ટેટેસ્ટીક્સ, ગ્વાર્લયરઃ શવિસ પબ્લલકેિિ,. સોલાંકી ,દેવેન્દ્રશસિંહ બી. અિે પટેલ આત્મારામ જે (૧૯૯૭) રમત-મિોશવજ્ઞાિ, અમદાવાદ : ભારત પ્રકાિિ

Volume: 3, Issue: 1, July 2016 ISSN –2349- 3992
Vyayam Setu: International Journal of Physical Education and Sports Sciences 7
તરણ પ્રવસૃિ િાથે જોડાયેલા સવદ્યાથીઓ અને અન્ય રમત પ્રવસૃિ િાથે જોડાયેલા સવદ્યાથીઓની ઝડપ અને ચપળતાનો તલુનાત્મક અભ્યાિ
મસનષ પટેલ ડૉ. કે. જે. ગોકહલ
(ફરસચટ સ્કોલર) (એસોિીયેટ પ્રોફેસર) સ્વર્ણિમ ગજુરાત સ્પોર્ટટસ યશુિવસીટી, સી.પી. ડીગ્રી કોલેજ ઓફ ફફિીકલ એજ્યકેુિિ સેક્ટર ૧૫, ગાાંધીિગર ૩૮૨૦૧૬ રાજપીપળા, િમટદા િીલ્લા, ગજુરાત ૩૯૩૧૪૫ ટ ંકિાર: આ સાંિોધિ અભ્યાસિો હતે ુ તરણ પ્રવશૃત્ત સાથે જોડાયેલા શવદ્યાથીઓ અિે અન્ય પ્રવશૃત્ત સાથે જોડાયેલા શવદ્યાથીઓિી િડપ અિે ચપળતાિો તલુિાત્મક અભ્યાસ કરવાિો હતો. આ સાંિોધિ અભ્યાસ માટે સર્ચવાલય જીમખાિામા તરણ પ્રવશૃતિી તાલીમ લેતા 30 શવદ્યાથી ભાઈઓ અિે અન્ય રમત પ્રવશૃત્ત જેવીકે સ્કેફટિંગ, ટેશિસ, બેડશમન્ટિ, સ્નકુર, ટેબલ-ટેશિસ, વગેરેિી તાલીમ લેતા 30 શવદ્યાથી ભાઈઓ િે શવષયપાત્રો તરીકે પસાંદ કરવામાાં આવ્યા હતા. િડપ કસોટીિા િા માપિ માટે 50 વાર િડપી દોડ એિ ચપળતા કસોટીિા માપિ માટે 30 ફુટ િટલ રિ માપિ ધોરણ તરીકે પસાંદ કરી આંકડાઓનુાં એકત્રીકરણ કરી બાંિે જૂથોિા પ્રાપતાાંકો પર ‘t’ ટેસ્ટ લાગ ુપાડી 0.05 કક્ષાએ સાથટકતા ચકાસતા બાંિે જૂથો િા િડપ અિે ચપળતાિા ઘટકોમાાં સાથટક તફાવત જોવા િ મળ્યો હતો. પ્રસ્તાવના ( Introduction) :
પ્રાર્ચિ કાળથી રમત માિવીિા જીવિ ક્રમિા એક અંગ તરીકે પ્રસ્થાશપત થયેલી છે. માિવીિા ઉત્પશત્તકાળથી તેિી મખુ્ય અિે મોટી ગશતઓ હાથિી પગિી તથા પીઠિી છે. પગથી ત ેચાલ ેછે, દોડ ેછે, કદેૂ છે, ઉંચ ેતરે છે. અિે પેટે સરકે છે, હાથથી તે ચીજોિ ેિીલે છે, ફેંકે છે, ઉછાળે છે, ખેંચ ેછે અિે ધકેલ ેછે. પીઠથી તે જ જમણી કે ડાબી બાજુએ અિે આગળ તથા પાછળ તેમજ િીચ ેવળે છે અિ ેકમર આગળથી િરીરિે ફેરવે છે, આ બધી ગશતઓ અિે એિા જીવિ માટે જરૂરી છે, ખોરાક મળેવવાિા તથા દુશ્મિથી બચાવવાિા શવશવધ પ્રયાયો તેવી ગશત વગર થઈ િકતા િથી. માસ પેિીઓ રૂપી ઘોડાઓિે મગજરૂપી સારશથ િાડીઓ રૂપી લગામો વડ ેહાકે છે અિે એમ માિવ િરીરિો રથ ચાલ ેછે. આ બધી ગશતઓ માિવજાત જેટલી જૂિી છે અિે માિવીિા જીવિમાાં ક્સ્થર યવુાિોિે ગમે છે, રમતો રમવાથી બાળકોિે તેમજ યવુાિોિે ગમે છે, રમતો બાળકોિે અિે યવુાિોિે આિાંદ થાય છે તથા તેમિો િરીર શવકાસ સધાય છે. આમ સહજેે સમજી િકાય છે.
બાળકિા િારીફરક, માિશસક અિે સામાજજક શવકાસ માટે રમતો અશિવાયટ છે.
સવાાંગી શવકાસિા પાયામાાં કસરત એ એક અગત્યિી બાબત છે. િરીરિો ઉઠાવ, િમિીયતા, ચપળતા, સમતોલિ, ગશત સમેુળ, બળ અિે સહિિક્ક્ત વગેરેિો તે ઉત્તમ રીતે શવકાસ કરે છે. િરીરિા આંતફરક તાંત્રો કસરતથી સધુરે છે. સામાન્ય ફક્રયાઓ ઉત્તેજજત થાય છે. શ્વાસોચ્છવાસ અનકુળૂ બિે છે.
સ્િાયઓુિો શવકાસ થાય છે. અશત િાિી ધમિીઓ અિે સકૂ્ષ્મ ગરમી વધે છે. ત્વચાનુાં શવસ્તરણ થાય છે. જેિ ેલઈિે ગરમીનુાં શિયાંત્રણ સધુરે છે તથા િરીરમાાં પ્રબળ કાયોિે અનકુળૂ રાસાયર્ણક ફેરફારો થાય છે.
કેટલીક કસરતો અિે પ્રવશૃત્ત વષટિી અમકુ ઋતમુાાં અિે આબોહવામાાં અનકુળૂ રહ ેછે. પરાંત ુફદવસિા કયા સમયે કસરત કરવી તિેો આધાર સામાન્ય રીતે વ્યક્ક્તગત વલણઃ ફુરસદિો સમય અિે બીજા કેટલાક શિણટયાત્મક સાંજોગો પર રહલેો છે આરોગ્યિી દૃષ્ષ્ટ્ટએ સવારે પછી સાાંજિા પાાંચ વાગ્યા પછીિો સમય કસરતો

Volume: 3, Issue: 1, July 2016 ISSN –2349- 3992
Vyayam Setu: International Journal of Physical Education and Sports Sciences 8
માટે યોગ્ય અિે ફહતાવહ ગણાય. આખા ફદવસિા કામ બાદ ઉત્પન્ન થયલેો કચરો કસરત કરવાથી દૂર થાય છે તથા િરીરિા તાંત્રો ઉત્તેજજત થાય છે.
અભ્યાિના હતેઓુ (Objectives of Research) : તરણ પ્રવશૃત્ત સાથ ેજોડાયેલા શવદ્યાથીઓ અિ ેઅન્ય રમત પ્રવશૃત્ત સાથ ેજોડાયેલા શવદ્યાથીઓિી િડપિો
તલુિા કરવાિો હતે.ુ તરણ પ્રવશૃત્ત સાથ ે જોડાયેલા શવદ્યાથીઓ અિ ે અન્ય રમત પ્રવશૃત્ત સાથે જોડાયેલા શવદ્યાથીઓિી
ચપળતાિો તલુિા કરવાિો હતે.ુ સવષયપાત્રોની પિદંગી (Selection of Subject) :
આ સાંિોધિ અભ્યાસ માટે સર્ચવાલય જીમખાિામા તરણ પ્રવશૃતિી તાલીમ લતેા 30 શવદ્યાથી ભાઈઓ અિ ેઅન્ય રમત પ્રવશૃત્તિી તાલીમ લતેા 30 શવદ્યાથી ભાઈઓ િે શવષયપાત્રો તરીકે પસાંદ કરવામાાં આવ્યા હતા. માપનના ધોરણો (Criterion Measures) :
િડપ કસોટીિા માપિ માટે 50 વાર દોડ કસોટી અિ ેચપળતાિા માપિ 30 ફુટ િટલરિ કસોટીિે માપિ ધોરણ તરીકે પસાંદ કરવામાાં આવી હતી. આંકડાકીય પ્રકિયા (Statistical Analysis) : તરણ પ્રવશૃત્ત સાથે જોડાયેલ શવદ્યાથીઓ અિે અન્ય રમત પ્રવશૃતઓ સાથે જોડાયેલ શવદ્યાથીઓિા જૂથોિી પ્રાપત કરેલ માફહતી પર ‘t’ કસોટી લાગ ુપાડી મધ્યકો વચ્ચેિા તફાવતોિી 0.05 કક્ષાએ સાથટકતા ચકાસવામાાં આવી હતી પકરણામો અને ચચાા (Result of the Study) : િીચેિી સારણીઓ પરથી અભ્યાસિા પફરણામો સ્પષ્ટ્ટ થાય છે. િારણી – 1, તરણ પ્રવસૃિ િાથે જોડાયેલા સવદ્યાથીઓ અને અન્ય રમત પ્રવસૃિ િાથે જોડાયેલા સવદ્યાથીઓની ઝડપનો મધ્યક, મધ્યક તફાવત અને ‘t’ રેસશયો દશાાવતી િારણી
જૂથ શવષયપત્રોિી સાંખ્યા મધ્યક સરેરાિ શવચલિ મધ્યક તફાવત ‘t’ તરણ પ્રવશૃત્ત 30 8.078 ૦.742
૦.240 1.158 અન્ય રમત પ્રવશૃત્ત 30 7.838 ૦.862
*સાથટકતાનુાં ધોરણ 0.05 કક્ષાએ ‘t’ = (58) = 2.00 ઉપરોક્ત સારણી - 1 પરથી માલમુ પડ ેછે કે િડપમાાં તરણ પ્રવશૃત્ત સાથ ેજોડાયેલ શવદ્યાથીઓિો
મધ્યક 8.078 હતો અિ ેઅન્ય રમત પ્રવશૃત્ત સાથ ેજોડાયેલ શવદ્યાથીઓિો મધ્યક 7.838 હતો. જેિો મધ્યક તફાવત ૦.240 તેમજ પ્રાપત થયેલ ‘t’ રેશિયો 1.158 હતો. જે 0.05 કક્ષાએ અસાથટક થાય છે. આથી સ્પષ્ટ્ટ થાય છે કે તરણ પ્રવશૃત્ત સાથ ેજોડાયેલ શવદ્યાથીઓ અિ ેઅન્ય રમત પ્રવશૃત્ત સાથ ેજોડાયેલ શવદ્યાથીઓિા િડપમાાં સાથટક તફાવત માલમુ પડતો િથી.

Volume: 3, Issue: 1, July 2016 ISSN –2349- 3992
Vyayam Setu: International Journal of Physical Education and Sports Sciences 9
આલેખ – 1, તરણ પ્રવસૃિ િાથે જોડાયેલા સવદ્યાથીઓ અને અન્ય રમત પ્રવસૃિ િાથે જોડાયેલા સવદ્યાથીઓની ઝડપના મધ્યકો દશાાવતો આલેખ
િારણી – 2, તરણ પ્રવસૃિ િાથે જોડાયેલા સવદ્યાથીઓ અને અન્ય રમત પ્રવસૃિ િાથે જોડાયેલા સવદ્યાથીઓની ચપળતાનો મધ્યક, મધ્યક તફાવત અને ‘t’ રેસશયો દશાાવતી િારણી
જૂથ શવષયપત્રોિી સાંખ્યા મધ્યક સરેરાિ શવચલિ મધ્યક તફાવત ‘t’ તરણ પ્રવશૃત્ત 30 11.624 2.051
0.772 1.671 અન્ય રમત પ્રવશૃત્ત 30 12.397 1.484
*સાથટકતાનુાં ધોરણ 0.05 કક્ષાએ ‘t’ = (58) = 2.00 ઉપરોક્ત સારણી - 2 પરથી માલમુ પડ ેછે કે િડપમાાં તરણ પ્રવશૃત્ત સાથે જોડાયેલ શવદ્યાથીઓિો
મધ્યક 11.624 હતો અિ ેઅન્ય રમત પ્રવશૃત્ત સાથ ેજોડાયેલ શવદ્યાથીઓિો મધ્યક 12.397 હતો. જેિો મધ્યક તફાવત 0.772 તેમજ પ્રાપત થયેલ ‘t’ રેશિયો 1.671 હતો. જે 0.05 કક્ષાએ અસાથટક થાય છે. આથી સ્પષ્ટ્ટ થાય છે કે તરણ પ્રવશૃત્ત સાથ ેજોડાયેલ શવદ્યાથીઓ અિ ેઅન્ય રમત પ્રવશૃત્ત સાથ ેજોડાયેલ શવદ્યાથીઓિા િડપમાાં સાથટક તફાવત માલમુ પડતો િથી.
8.0787.838
0
1
2
3
4
5
6
7
8
9
તરણ પ્રવશૃત્ત અન્ય રમત પ્રવશૃત્ત
િડપ
તરણ પ્રવશૃત્ત અન્ય રમત પ્રવશૃત્ત

Volume: 3, Issue: 1, July 2016 ISSN –2349- 3992
Vyayam Setu: International Journal of Physical Education and Sports Sciences 10
આલેખ – 2, તરણ પ્રવસૃિ િાથે જોડાયેલા સવદ્યાથીઓ અને અન્ય રમત પ્રવસૃિ િાથે જોડાયેલા સવદ્યાથીઓની ચપળતાના મધ્યકો દશાાવતો આલેખ
િારાશં (Conclusion) :
તરણ પ્રવશૃત્ત સાથે જોડાયલેા અિે અન્ય રમત પ્રવશૃત્ત સાથ ેજોડાયેલા શવદ્યાથીઓિી િડપમાાં કોઈ સાથટક તફાવત માલમુ પડતો િ હતો.
તરણ પ્રવશૃત્ત સાથે જોડાયેલા અિે અન્ય રમત પ્રવશૃત્ત સાથ ે જોડાયેલા શવદ્યાથીઓિી ચપળતામાાં કોઈ સાથટક તફાવત માલમુ પડતો િ હતો.
િદંર્ા ગ્રથં (Bibliography) : પટેલ અંબાલાલ કે (૨૦૦૦) િારીફરક શિક્ષણ અિ ેઅન્ય સાધિ કૌિલ્ય કલા, અમદાવાદ : ધવલ પ્રકાિિ વમાટ પ્રકાિ જે (૨૦૦૦) એ ટેક્ષબકુ ઓિ સ્પોટટસ સ્ટેટેષ્સ્ટકસ, ગ્વાર્લયર : શવિસ પલલીકેિિ
11.62412.397
0
2
4
6
8
10
12
14
તરણ પ્રવશૃત્ત અન્ય રમત પ્રવશૃત્ત
ચપળતા
તરણ પ્રવશૃત્ત અન્ય રમત પ્રવશૃત્ત

Volume: 3, Issue: 1, July 2016 ISSN –2349- 3992
Vyayam Setu: International Journal of Physical Education and Sports Sciences 11
યોગાસિ અિે પ્રાણાયામિી ફક્રયા દ્વારા માિશસક સ્વાસ્્ય ઉપર થતી અસરોિો અભ્યાસ
મોહંમદ હા. બાદી (ફરસચટ સ્કોલર) સ્વર્ણિમ ગજુરાત સ્પોટટસ યશુિવસીટી, સેકટર - ૧૫ ગાાંધીિગર - ૩૮૨૦૧૬. ટ ંકિાર : આ સાંિોધિ અભ્યાસિો હતે ુપ્રાયોર્ગક તાલીમ જુથ પર યોગાસિ અિે પ્રાણાયામિી ફક્રયા દ્વારા થતી અસરો ચકાસવાિો હતો .આ સાંિોધિ અભ્યાસ માટે સહયોગ શવદ્યાલય ,પાંચાશિયાિા પ્રાયોર્ગક તાલીમ જુથિા 20 શવદ્યાથીઓ અિે શિયાંશત્રત જુથિા 20 શવદ્યાથીઓિે શવષયપાત્રો તરીકે પસાંદ કરી ડૉ .ડી.જે .ભટ્ટ અિે જી .આર .ગીડા રર્ચત માિશસક સ્વાસ્્યિી પ્રશ્નાવલીિે માપિિા ધોરણ તરીકે પસાંદ કરી આંકડાઓનુાં એકત્રીકરણ કરી બાંિે જુથોિા પ્રાપતાાંકો પર (ANCOVA) ટેસ્ટ લાગ ુપાડી 05.0 કક્ષાએ સાથટકતા ચકાસતા પ્રાયોર્ગક તાલીમ જુથનુાં માિશસક સ્વાસ્્ય શિયાંશત્રત જુથ કરતા વધ ુસાથટક સાર્બત થયુાં હત ુાં.
પ્રસ્તાવના પ્રાચીિ કાળમાાં યોગ શવજ્ઞાિ શવષયનુાં જ્ઞાિ ઋશષમિુીઓ પાસ ેજ હત ુાં. સાધારણ વ્યક્ક્ત જો યોગનુાં જ્ઞાિ પ્રાપત કરી લે, તેઓ સમાજમાાં એિે માિ થી જોવામાાં આવતો. કાલ સધુી ર્બિઉપયોગી ગણાતો યોગ આજ જ્ઞાિ ચક્ષઓુિે પ્રભાશવત કરવા લાગ્યો છે. યોગ શવજ્ઞાિમાાં યમ અિ ે શિયમ િામિા યોગિા પ્રથમ બે અંગ ેવ્યક્ક્તનુાં માિશસક સાંતલુિ બિાવવામાાં મહત્વિો ફાળો આપે છે. યોગાસિ અિે પ્રાણાયામ શ્રમિા અભાવિે દૂર કરી અશધુ્ધ્ધઓિો િાિ કરે છે. યોગિ ેલીધે િરીરિા પ્રત્યેક અંગ કાયટરત થાય છે. કારણ કે, યોગાસિોિી રચિા િરીરિા બધા જ અંગો અિે તેિી બિાવટ િે ધ્યાિમાાં રાખીિે જ કરવામાાં આવે છે. સ્થળૂ વ્યાયામ, સકુ્ષ્મ વ્યાયામ, સયૂટ િમસ્કાર, ચક્રભેદિ, વગેરે યોર્ગક ફક્રયાઓ સાંપણૂટ િરીરિ ેપ્રભાશવત કરવા માટે જ બિાવવામાાં આવી છે.
આપણામાાંિા ઘણાખરા લોકો માિશસક સ્વાસ્્ય કે માિશસક તાંદુરસ્તી અંગ ેખોટો ખ્યાલ ધરાવ ે છે .ઘણા ખરા લોકો એમ માિે છે કે માિશસક સ્વાસ્્ય અિે માિશસક બીમારી એ તદ્દિ શવરોધી બાબતો છે અિ ેઆથી જ જે વ્યક્ક્ત માિશસક રીત ેબીમાર િથી તે માિશસક રીત ેસ્વસ્થ છે ,માિશસક રોગોિા અભાવવાળી પફરક્સ્થશત એટલ ેમાિશસક સ્વાસ્્ય .આમ શિષેધક રીતે માિશસક સ્વાસ્્યિ ે સમજાવી િકાય િહીં .માિશસક સ્વાસ્્ય સસુમાયોજિ ,અસરકારક સમાયોજિ ,વ્યક્ક્તત્વિા શવકાસ માટેિી શવધાયક પફરક્સ્થશતિો શિદેિ કરે છે .
માિશસક સ્વાસ્્યિી મહત્વિી વ્યાખ્યાઓ િીચ ેપ્રમાણ ેછે :

Volume: 3, Issue: 1, July 2016 ISSN –2349- 3992
Vyayam Setu: International Journal of Physical Education and Sports Sciences 12
(1) ‘માિશસક સ્વાસ્્ય એટલે માિવીઓનુાં જગત સાથેનુાં તેમજ એકબીજા સાથેિો મહત્તમ અસરકારક અિે સખુપ્રદ સમાયોજિ’
- કાલટ મેશિન્જર અભ્યાિના હતેઓુ 1. યોગાસિ અિે પ્રાણાયામિી તાલીમ દ્વારા માિશસક સ્વાસ્્ય પર થતી અસર ચકાસવાિો હતે.ુ માપનના ધોરણો માિશસક સ્વાસ્્યિી કસોટી માટે ડો. ડી. જી. ભટ્ટ અિે જી. આર. ગીડા રર્ચત પ્રશ્નાવર્લિ ેમાપિિા ધોરણ તરીકે પસાંદ કરવામાાં આવી હતી. અભ્યાિની યોજના: કુલ 40 શવષયપાત્રોિે યાદધ્ચ્છક પદ્ધશતથી પસાંદ કરવામાાં આવ્યા હતા. એક જુથમાાં 20 શવષયપાત્રો પસાંદ કરવામાાં આવ્યા હતા. કુલ બે જૂથો બિાવવામાાં આવ્યા હતા. જેમાાં પ્રાયોર્ગક જુથ િે યોગ અિે પ્રાણાયામિી તાલીમ આપવામાાં આવી હતી જયારે શિયાંશત્રત જુથ િે યોગ અિ ેપ્રાણાયામિી તાલીમથી મકુ્ત રાખવામાાં આવ્યુાં હત ુાં. 4 અઠવાડીયાિા તાલીમ કાયટક્રમિી િરૂઆત કરતા પેહલા પવૂટ કસોટી અિે તાલીમ કાયટક્રમ પણૂટ થયા પછી અંશતમ કસોટી દ્વારા આંકડાઓનુાં એકશત્રકરણ કરવામાાં આવ્યુાં હત ુાં. આંકડાકીય પ્રકિયા યોગ અિે પ્રાણાયામ તાલીમિી શવષય પાત્રોિા માિશસક સ્વાસ્્ય પર થતી અસરો ચકાસવા શવચરણ સહશવચરણ પ ૃ્ થકરણ (ANCOVA) ટેસ્ટ લાગ ુપાડી 0.05 કક્ષાએ સાથટકતા ચકાસતા િીચ ેમજુબિા પફરણામો પ્રાપત થયા હતા. િારણી-1, પ્રાયોણગક અને સનયસંત્રત જુથનુ ંસવચરણ િહ સવચરણ પ ૃ્ થકરણ.
કસોટી (Test)
જુથ (Group) સહ શવચરણ કોષ્ટ્ટક (ANCOVA Table) પ્રાયોર્ગક જુથ (Practical Group)
શિયાંશત્રત જુથ (Control Group)
વગોિો સરવાળો (SS)
સ્વતાંત્ર માત્રા (df)
મધ્યક શવચરણ (MSS)
‘F’
પવૂટ કસોટી મધ્યક (Pree Test Mean)
25.7 25.6 B 0.1 1 0.1
0.011 W 333 38 8.763
અંશતમ કસોટી મધ્યક (Post Test Mean)
30.05 26.55 B 122.5 1 122.5
16.397* W 283.9 38 7.471
સધુારેલ મધ્યક (Adjusted Mean)
30.018 26.581 B 118.054 1 118.054 29.254
* W 149.314 37 4.035 *િાથાકતાનુ ંધોરણ 0.05 કક્ષાએ ‘F’ = 0.05 (1,38) = 4.084 & (1,37) = 4.084

Volume: 3, Issue: 1, July 2016 ISSN –2349- 3992
Vyayam Setu: International Journal of Physical Education and Sports Sciences 13
સારણી-1 માાં પવૂટકસોટીિો ‘F’ રેશિયો 0.011 જોવા મળેલ હતો. જે 0.05 કક્ષાએ અસાથટક જોવા મળેલ હતો. જયારે બાંિે જુથિો અંશતમ કસોટીિો ‘F’ રેશિયો 16.397 જોવા મળેલ હતો. જે 0.05 કક્ષાએ સાથટક જોવા મળેલ હતો. અિે સધુારેલ મધ્યકિો ‘F’ રેશિયો 29.254 જોવા મળેલ હતો. જે 0.05 કક્ષાએ સાથટક જોવા મળ્યો હતો.
આલેખ – 1, માનસિક સ્વાસ્્ય કિોટીના પ્રાયોણગક અને એક સનયસંત્રત જુથની પ વા કિોટી મધ્યક, અંસતમ
કિોટી મધ્યક અને સધુારેલ મધ્યક દશાાવતો આલેખ
િારાશં
પ્રાયોર્ગક જુથનુાં માિશસક સ્વાસ્્ય શિયાંત્રીત જુથ કરતા વધ ુસાથટક જોવા મળે છે. િદંર્ા ગ્રથં િાહ ફદપક (૧૯૯૦), અસાધારણ મિોશવજ્ઞાિ, અમદાવાદ: સી. જમિાદાસ કાંપિી. સરીિ એિ (૧૯૯૫) યોગશિક્ષા એવાં યોગ દ્વારા રોગ શિવારણ, ફદલ્હી : ખેલ સાફહત્ય કેન્દ્ર. વમાટ પ્રકાિ જે (૨૦૦૦) સ્ટેટેષ્સ્ટકસ એ ટેક્ષબકુ ઓિ સ્પોટટસ, ગ્વાર્લયર : શવિસ પલલીકેિિ
0
5
10
15
20
25
30
35
પ્રાયોર્ગક જુથ શિયાંશત્રત જુથપવૂટ કસોટી મધ્યક અંશતમ કસોટી મધ્યક સધુારેલ મધ્યક

Volume: 3, Issue: 1, July 2016 ISSN –2349- 3992
Vyayam Setu: International Journal of Physical Education and Sports Sciences 14
સાંઘ વ્યાયામિી પ્રવશૃત્તઓ દ્વારા મેદસ્વીતા ધરાવતા બાળકોિી શ્વાસ રોકવાિી િક્ક્ત પર થતી અસરોિો અભ્યાસ
મોહિીનઆઝાદ કુરેશી ડૉ. જગદીશચદં્ર ગોઠી (ફરસચટ સ્કોલર) (એસોશસયેટ પ્રોફેસર) િારીફરક શિક્ષણ અિે રમત શવજ્ઞાિશવદ્યાિાખા િારીફરક શિક્ષણ અિે રમત શવજ્ઞાિશવદ્યાિાખા સાદરા, ગાાંધીિગર -૩૮૨૩૨૦ સાદરા, ગાાંધીિગર -૩૮૨૩૨૦ ટ ંકિાર : આ સાંિોધિ અભ્યાસિો હતે ુ પ્રાયોર્ગક તાલીમ જુથ પર સાંઘ વ્યાયામિી પ્રવશૃત્તઓ દ્વારા મેદસ્વીતા ધરાવતા બાળકોિી શ્વાસ રોકવાિી િક્ક્ત પર થતી અસરો ચકાસવાિો હતો .આ સાંિોધિ અભ્યાસ માટે એસ .એમ .જી .કે .હાઇસ્કુલિા 5 થી 8 ધોરણિા પ્રાયોર્ગક તાલીમ જુથિા 20 શવદ્યાથીઓ અિે શિયાંશત્રત જુથિા 20 શવદ્યાથીઓિે શવષયપાત્રો તરીકે પસાંદ કરી કેટલો સમય શ્વાસ રોકી િકે છે તે સમયમાાં માપી આંકડાઓનુાં એકત્રીકરણ કરી બાંિે જુથોિા પ્રાપતાાંકો પર શવચરણ સહ શવચરણ પ ૃ્ થકરણ કસોટી લાગ ુપાડી 05.0 કક્ષાએ સાથટકતા ચકાસતા પ્રાયોર્ગક તાલીમ જુથિી શ્વાસ રોકવાિી ક્ષમતા શિયાંશત્રત જુથ કરતા વધ ુસાથટક સાર્બત થઈ હતી.
પ્રસ્તાવના સામાન્ય લોકો રોજજિંદા જીવિમાાં િારીફરક તાલીમનુાં મહત્વ સમજી રહ્યા છે અિ ેતેનુાં પફરણામ
એ છે કે કોઈિ ેકોઈ સ્વરૂપે િારીફરક શ્રમ કરીિે પોતાિા િરીરિે સ્વસ્થ રાખવા પ્રયત્િિીલ થયા છે .એક જમાિમાાં કહવેાત ુાં હત ુાં કે,“પઢોગ ેલીખોગે તો બિોગે િવાબ ઔર ખલેોગ ેકદૂોગે તો બિોગે ખરાબ’’. પરાંત ુહવ ેઆ કહવેત જાણ ેશવતેલા જમાિાિી વાત થઈ ગઈ છે .હવે લોકો કહ ેછે કે,“પઢોગ ેલીખોગે તો બિોગે િવાબ ઔર ખેલોગે કદૂોગે તો બિોગે લાજવાબ’’. લોકો પોતાિા બાળકોિે અઘરીમાાં અઘરી િારીફરક તાલીમ દ્વારા મજબતૂ અિ ેકોઈ િે કોઈ રમતમાાં શિપણુ બિાવવા માાંગ ેછે .જેથી તે જીવિમાાં પ્રગશત કરી િકે .આધશુિક સમયમાાં િારીફરક તાલીમ ફક્ત સૈશિક અિે ખેલાડીઓ પરૂતી સીશમત િથી .પરાંત ુિાળા, મહાશવદ્યાલયો અિે ઔધોર્ગક એકમોિા કમટચારીઓિે પણ િારીફરક શ્રમ માટે પ્રોત્સાફહત કરવામાાં આવી રહ્યા છે .આ જ કારણ છે કે,િાળાઓ અિે મહાશવદ્યાલયોમાાં જરૂરી શવષયિા ભાગરૂપ ેભણાવવામાાં આવે છે .િારીફરક તાલીમિો શવસ્તાર વધતો રહ્યો છે અિે એક મહત્વપણૂટ શિક્ષણ પધ્ધશતિા રૂપમાાં સન્માિ અિે માન્યતા મેળવી ચકેૂલ છે. અભ્યાિના હતેઓુ 1. સાંઘ વ્યાયામિી પ્રવશૃત્તઓ દ્વારા મેદસ્વીતા ધરાવતા બાળકોિી રૂશધરાર્ભસરણ સહિિક્ક્ત પર
થતી અસરો ચકાસવાિો હતે.ુ માપનના ધોરણો
શ્વાસ રોકવાિી ક્ષમતા માટે શવદ્યાથીએ કેટલો સમય શ્વાસ રોકી રાખ્યો છે તેિા સમયિ ેમાપિિા ધોરણ તરીકે લેવામાાં આવ્યુાં હત ુાં.

Volume: 3, Issue: 1, July 2016 ISSN –2349- 3992
Vyayam Setu: International Journal of Physical Education and Sports Sciences 15
અભ્યાિની યોજના: આ સાંિોધિ અભ્યાસ માટે એસ. એમ. જી. કે. હાઇસ્કુલિા 5 થી 8 ધોરણિા કુલ 40 શવષયપાત્રોિ ેયાદધ્ચ્છક પદ્ધશતથી પસાંદ કરવામાાં આવ્યા હતા. એક જુથમાાં 20 શવષયપાત્રો પસાંદ કરવામાાં આવ્યા હતા. કુલ બે જૂથો બિાવવામાાં આવ્યા હતા. જેમાાં પ્રાયોર્ગક જુથ િે સાંઘ વ્યાયામિી પ્રવશૃત્તઓ કરવવામાાં આવી હતી જયારે શિયાંશત્રત જુથ િે સાંઘ વ્યાયામિી પ્રવશૃત્તઓથી મકુ્ત રાખવામાાં આવ્યુાં હત ુાં. 8 અઠવાડીયાિા તાલીમ કાયટક્રમિી િરૂઆત કરતા પેહલા પવૂટ કસોટી અિે તાલીમ કાયટક્રમ પણૂટ થયા પછી અંશતમ કસોટી દ્વારા આંકડાઓનુાં એકશત્રકરણ કરવામાાં આવ્યુાં હત ુાં. આંકડાકીય પ્રકિયા સાંઘ વ્યાયામિી પ્રવશૃત્તઓિી શવષયપાત્રોિા શ્વાસ રોકવાિી ક્ષમતા પર થતી અસરો ચકાસવા શવચરણ સહશવચરણ પ ૃ્ થકરણ કસોટી લાગ ુપડી 0.05 કક્ષાએ સાથટકતા ચકાસતા િીચ ેમજુબિા પફરણામો પ્રાપત થયા હતા. િારણી-1, શ્વાિ રોકવાની ક્ષમતાના પ્રાયોણગક અને સનયસંત્રત જુથનુ ંસવચરણ િહ સવચરણ પ ૃ્ થકરણ.
કસોટી
જુથ શવચરણ સહ શવચરણ પ ૃ્ થકરણ કોષ્ટ્ટક પ્રાયોર્ગક જુથ (Practical Group)
શિયાંશત્રત જુથ (Control Group)
વગોિો સરવાળો (SS)
સ્વતાંત્ર માત્રા (df)
મધ્યક શવચરણ (MSS)
‘F’
પવૂટ કસોટી મધ્યક (Pre Test Mean)
30.35 29.215 B 12.882 1 12.882
0.265 W 1840.755 38 48.440
અંશતમ કસોટી મધ્યક (Post Test Mean)
40.47 30.93 B 910.116 1 910.116
17.677* W 1956.444 38 51.485
સધુારેલ મધ્ક (Adjusted Mean)
39.976 31.423 B 726.550 1 726.550
47.492* W 566.039 37 15.298
*સાથટકતાનુાં ધોરણ 0.05 કક્ષાએ ‘F’ = 0.05 (1, 38) = 4.084 & (1, 37) = 4.084
સારણી-1 માાં રૂશધરાર્ભસરણ સહિિક્ક્તિા પવૂટકસોટીિો ‘F’ રેશિયો 0.265 જોવા મળેલ હતો. જે 0.05 કક્ષાએ અસાથટક જોવા મળેલ હતો. જયારે બાંિે જુથિો અંશતમ કસોટીિો ‘F’ રેશિયો 17.677 જોવા મળેલ હતો. જે 0.05 કક્ષાએ સાથટક જોવા મળેલ હતો. અિે સધુારેલ મધ્યકિો ‘F’ રેશિયો 47.492 જોવા મળેલ હતો. જે 0.05 કક્ષાએ સાથટક જોવા મળ્યો હતો.

Volume: 3, Issue: 1, July 2016 ISSN –2349- 3992
Vyayam Setu: International Journal of Physical Education and Sports Sciences 16
આલેખ – 1, શ્વાિ રોકવાની ક્ષમતાના પ્રાયોણગક જુથ અને સનયસંત્રત જુથના મધ્યકો દશાાવતો આલેખ
િારાશં
પ્રાયોર્ગક જુથિી શ્વાસ રોકવાિી ક્ષમતા શિયાંત્રીત જુથ કરતા વધ ુસાથટક જોવા મળી હતી. િદંર્ા ગ્રથં વમાટ,પ્રકાિ જે (૨૦૦૦) એ ટેક્ષબકુ ઓિ સ્પોટટસ સ્ટેટેસ્ટીક્સ, ગ્વાર્લયરઃ શવિસ પબ્લલકેિિ. ફદર્ક્ષત સરેુિ (૨૦૦૭), િારીફરક શિક્ષાકે શસધ્ધાાંત, િવી ફદલ્હી સ્પોટટસ પલલીકેિિ.
30.35 29.215
40.47
30.93
39.976
31.423
0
10
20
30
40
50
પ્રાયોર્ગક જૂથ શિયાંશત્રત જૂથ
પવૂટ કસોટી મધ્યક અંશતમ કસોટી મધ્યક સધુારેલ મધ્યક

Volume: 3, Issue: 1, July 2016 ISSN –2349- 3992
Vyayam Setu: International Journal of Physical Education and Sports Sciences 17
આંતર યસુનવસિિટી કક્ષાએ પિદંગી પામેલ હને્ડબોલ રમતના ખેલાડી ર્ાઈઓના માનસિક સ્વાસ્્યનો તલુનાત્મક અભ્યાિ
િગંીતા દુ. વાળા એમ.ફફલ. સ્કોલર, હમેચાંદ્ર આચાયટ ઉત્તર ગજુરાત યિુીવસીટી, પાટણ, ગજુરાત – ૩૮૪૨૬૫. ટ ંકિાર : આ સાંિોધિ અભ્યાસિો હતે ુઆંતર યશુિવશસિટી કક્ષાએ પસાંદગી પામલે હને્ડબોલ રમતિા ખેલાડી ભાઈઓિા માિશસક સ્વાસ્્યિો તલુિા કરવાિો હતો .આ સાંિોધિ અભ્યાસ માટે આંતર યશુિવશસિટી કક્ષાએ હને્ડબોલ રમતિા કુલ 36 ખેલાડીઓ ભાઈઓ પસાંદ કરવામાાં આવ્યા હતા .જેમાાં સૌરાષ્ટ્ર યશુિવશસિટીિા 12 , ગજુરાત શવદ્યાપીઠિા 12 અિે ભાવિગર યશુિવશસિટીિા 12 ખેલાડી ભાઈઓ શવષય પાત્રો તરીકે પસાંદ કરવામાાં આવ્યા હતા .શવષયપાત્રો તરીકે પસાંદ ડૉ .ડી.જે .ભટ્ટ અિે જી.આર .ગીડા રર્ચત માિશસક સ્વાસ્્યિી પ્રશ્નાવલીિ ેમાપિિા ધોરણ તરીકે પસાંદ કરી આંકડાઓનુાં એકત્રીકરણ કરી ત્રણેય જૂથોિા પ્રાપતાાંકો પર શવચરણ પ ૃ્ થકરણ કસોટી લાગ ુ પાડી 05.0 કક્ષાએ સાથટકતા ચકાસતા સૌરાષ્ટ્ર યશુિવશસિટી ,ગજુરાત શવદ્યાપીઠ ,અિે ભાવિગર યશુિવશસિટીિા હને્ડબોલિા ખેલાડીઓિા માિશસક સ્વાસ્્યમાાં સાથટક તફાવત જોવા મળ્યો િ હતો .
પ્રસ્તાવના ( Introduction) :
આધશુિક ટેકિોલોજીિા નતૂિયગુમાાં િવા પડકારો અિે િવી તકો શવશ્વ સમક્ષ ઉભી થતી જાય છે. સમદૃ્ધદ્ધ વધતી જાય છે. અણયુગુમાાં િવી પ્રજા ઉછરી રહી છે. કોમ્પપયટુર, ટેર્લશવિિ વ્યક્ક્ત સ્વાતાંત્ર્યિી િાંખિા સામાજજક શિયાંત્રણો અદ્યતિ જીવિ પદ્ધશત આ બધાિી અસરો હઠેળ ઘડાતી આવતી યવુા પ્રજાિ ેઆજીશવકા માટે િારીફરક શ્રમ ઓછો કરવો પડે. પણ સારી રીત ેજીવિ જીવવા માટે િારીફરક કેળવણી તો અપિાવવી જ પડિ.ે
માિશસક સ્વસ્થતાિો ખ્યાલ જટીલ છે. માિશસક સ્વસ્થ વ્યક્ક્ત કોિે કહવેી તે જાણ્યા શવિા સ્વસ્થ વ્યક્ક્તિો ખ્યાલ મેળવવો મશુ્કેલ છે. કોઈપણ જાતિી પીડા દુઃખ કે ર્બમારી શવિા વ્યક્ક્ત પોતાનુાં કાયટ હાથ પગ કે િરીરિા અંગો વડે કાયો કરે છે તો તેિ ેઆપણે િારીફરક રીતે સ્વસ્થ માિીએ છીએ. િારીફરક સ્વસ્થતા પારખી િકાય છે. તેટલી િડપથી માિશસક સ્વસ્થતા પારખી િકાતી િથી.
માિશસક સ્વસ્થતાિો પ્રશ્ન એ આધશુિક યગુિો જટીલ પ્રશ્ન છે. માિવી ખરેખર સખુી અિે સરળ બિવા માાંગતો હિ ેતો તેણે સ્વસ્થ રહવેાિી કળા િીખવી પડિ.ે માિશસક રીત ેસ્વસ્થ વ્યક્ક્ત

Volume: 3, Issue: 1, July 2016 ISSN –2349- 3992
Vyayam Setu: International Journal of Physical Education and Sports Sciences 18
પોતાિી જાતિ ેઓળખી િકે છે. સમજી િકે છે. વ્યાપ ખરેખર બહુ શવિાળ છે. તેમા ધમટ, સમાજ, વ્યવસ્થા, રહણેી-કરણી વગેરેિો પણ સમાવેિ થઈ જાય છે. સ્વસ્થતા મખુ્ય ચાર ઘટકોમાાં માિશસક સ્વાસ્્ય કેન્દ્રમાાં રહ ેછે. તેનુાં સ્થાિ આગવુાં છે. અભ્યાિના હતેઓુ (Objectives of Research) : 1. આ અભ્યાસિો હતે ુસૌરાષ્ટ્ર યશુિવશસિટી, ગજુરાત શવદ્યાપીઠ, અિે ભાવિગર યશુિવશસિટીિા
હને્ડબોલ રમતિા ખેલાડી ભાઈઓિી માિશસક સ્વાસ્્યિો અભ્યાસ કરવાિો હતો. માપનના ધોરણો (Criterion Measures) : ડૉ. ડી.જે. ભટ્ટ અિે જી.આર. ગીડા રર્ચત માિશસક સ્વાસ્્યિી પ્રશ્નાવલીિે માપિિા ધોરણ તરીકે પસાંદ કરવમાાં આવી હતી. સવષયપાત્રોની પિદંગી (Selection of Subjects)
આ સાંિોધિ અભ્યાસમાાં આંતર યશુિવશસિટી કક્ષાએ હને્ડબોલ રમતિા કુલ 36 ખેલાડીઓ ભાઈઓ પસાંદ કરવામાાં આવ્યા હતા. જેમાાં સૌરાષ્ટ્ર યશુિવશસિટીિા 12, ગજુરાત શવદ્યાપીઠિા 12 અિ ેભાવિગર યશુિવશસિટીિા 12 ખેલાડી ભાઈઓ શવષય પાત્રો તરીકે પસાંદ કરવામાાં આવ્યા હતા. આંકડાકીય પ્રકિયા (Statistical Analysis) : સૌરાષ્ટ્ર યશુિવશસિટી, ગજુરાત શવદ્યાપીઠ, અિે ભાવિગર યશુિવશસિટીિા હને્ડબોલિા ખેલાડીઓિા માિશસક સ્વાસ્્ય ચકાસવા શવચરણ પ ૃ્ થકરણ (ANOVA) લાગ ુપડી 0.05 કક્ષાએ સાથટકતા ચકાસતા િીચે મજુબિા પફરણામો પ્રાપત થયા હતા. અભ્યાિના પકરણામો (Result of the Study) :
િીચ ેઆપેલી સારણીઓ પરથી અભ્યાસિા પફરણામો સ્પષ્ટ્ટ થાય છે. િારણી – 1, િૌરાષ્ટ્ર યસુનવસિિટી, ગજુરાત સવદ્યાપીઠ, અને ર્ાવનગર યસુનવસિિટીના હને્ડબોલના ખેલાડીઓના માનસિક સ્વાસ્્યનો ‘F’ રેસશયો
કિોટી (Test)
જ થ સવચરણ પ ૃ્ થકરણ મધ્યક (Mean)
સવષય પાત્રો (Subject)
વગોનો િરવાળો (SS)
સ્વતતં્ર માત્રા (df)
મધ્યક સવચરણ (MSS)
‘F’
સૌરાષ્ટ્ર યશુિવશસિટી
25.5 12
A 50.388 2 A 25.194
1.495 ગજુરાત શવદ્યાપીઠ
22.75 12
ભાવિગર યશુિવશસિટી
23.333 12 W 555.916 33 W 16.846
*િાથાકતનુ ંધોરણ 0.05 કક્ષાએ ‘F’ = 0.05 (233) = 3.284

Volume: 3, Issue: 1, July 2016 ISSN –2349- 3992
Vyayam Setu: International Journal of Physical Education and Sports Sciences 19
સારણી-1 માાં સૌરાષ્ટ્ર યશુિવશસિટીિા ખેલાડીઓિા માિશસક સ્વસ્થિો મધ્યક 25.5, ગજુરાત શવદ્યાપીઠિા ખેલાડીઓિા માિશસક સ્વસ્થિો મધ્યક 22.75 અિે ભાવિગર યશુિવશસિટીિા ખેલાડીઓિા માિશસક સ્વસ્થિો મધ્યક 23.333 જોવા મળ્યો હતો. બધા જૂથોિા વગોિો સરવાળો 50.388 જોવા મળ્યો હતો અિે બધા પ્રપતાાંકો વચ્ચ ેવગોિો સરવાળો 555.916 જોવા મળ્યો હતો. બધા જૂથોનુાં મધ્યક શવચરણ 25.194 જોવા મળ્યુાં હતો અિે બધા પ્રપતાાંકો નુાં મધ્યક શવચરણ 16.846 જોવા મળ્યુાં હત ુાં. જયારે ‘F’ રેશિયો 1.495 જોવા મળેલ હતો. જે 0.05 કક્ષાએ અસાથટક જોવા મળ્યો હતો. આલેખ – 1, િૌરાષ્ટ્ર યસુનવસિિટી, ગજુરાત સવદ્યાપીઠ, અને ર્ાવનગર યસુનવસિિટીના હને્ડબોલના ખેલાડીઓના માનસિક સ્વાસ્્યના મધ્યકો દશાાવતો આલેખ
િારાશં (Conclusion) :
સૌરાષ્ટ્ર યશુિવશસિટી, ગજુરાત શવદ્યાપીઠ, અિ ે ભાવિગર યશુિવશસિટીિા હને્ડબોલિા ખેલાડીઓિા માિશસક સ્વાસ્્યમાાં સાથટક તફાવત જોવા મળ્યો િ હતો. આથી ત્રણેય યશુિવસીટીિા હને્ડબોલિા ખેલાડીઓિા માિશસક સ્વાસ્્યમાાં સમાિતા જોવા મળી હતી.
િદંર્ા ગ્રથં (Bibliography) : પટેલ રજિીકાાંત અિે િેઠ બાલમકુુાંદ (૧૯૯૦) વ્યવહારલક્ષી મિોશવજ્ઞાિ, અમદાવાદ : સી. જમિાદાસ કાંપિી. વમાટ,પ્રકાિ જે (૨૦૦૦) એ ટેક્ષબકુ ઓિ સ્પોટટસ સ્ટેટેસ્ટીક્સ, ગ્વાર્લયરઃ શવિસ પબ્લલકેિિ.
25.522.75 23.333
0
5
10
15
20
25
30
સૌરાષ્ટ્ર યશુિવશસિટી ગજુરાત શવદ્યાપીઠ ભાવિગર યશુિવશસિટી
માિશસક સ્વાસ્્ય
Volume: 3, Issue: 1, July 2016 ISSN –2349- 3992
Vyayam Setu: International Journal of Physical Education and Sports Sciences 20
યોગાિન અને સ યા નમસ્કારની કિયા દ્વારા માનસિક સ્વાસ્્ય ઉપર થતી અિરોનો અભ્યાિ
સવષ્ટ્ણ ુજ. ચૌધરી ડૉ. જગદીશચદં્ર કે. િાવણલયા (પીએચ. ડી. સ્કોલર) (એસોશસયેટ પ્રોફેસર) સ્વર્ણિમ ગજુરાત સ્પોર્ટટસ યિુીવસીટી, િારીફરક શિક્ષણ અિ ેરમત શવજ્ઞાિશવદ્યાિાખા સેક્ટર ૧૫, ગાાંધીિગર -૩૮૨૦૧૬ સાદરા, ગાાંધીિગર -૩૮૨૩૨૦ ટ ંકિાર: આ સાંિોધિ અભ્યાસિો હતે ુપ્રાયોર્ગક તાલીમ જુથ પર યોગાસિ અિે સયૂટ િમસ્કારિી ફક્રયા દ્વારા થતી અસરો ચકાસવાિો હતો .આ સાંિોધિ અભ્યાસ માટે પાિોલ પ્રાથશમક િાળાિા પ્રાયોર્ગક તાલીમ જુથિા 15 શવદ્યાથીઓ અિે શિયાંશત્રત જુથિા 15 શવદ્યાથીઓિે શવષયપાત્રો તરીકે પસાંદ કરી ડૉ .ડી.જે .ભટ્ટ અિે જી .આર .ગીડા રર્ચત માિશસક સ્વાસ્્યિી પ્રશ્નાવલીિે માપિિા ધોરણ તરીકે પસાંદ કરી આંકડાઓનુાં એકત્રીકરણ કરી બાંિે જુથોિા પ્રાપતાાંકો પર ‘F’(ANCOVA) ટેસ્ટ લાગ ુપાડી 05.0 કક્ષાએ સાથટકતા ચકાસતા પ્રાયોર્ગક તાલીમ જુથનુાં માિશસક સ્વાસ્્ય શિયાંશત્રત જુથ કરતા વધ ુસાથટક સાર્બત થયુાં હત ુાં.
પ્રસ્તાવના યોગિ ેલીધે િરીરિા પ્રત્યેક અંગ કાયટરત થાય છે. કારણ કે, યોગાસિોિી રચિા િરીરિા બધા જ અંગો અિે તેિી બિાવટ િે ધ્યાિમાાં રાખીિે જ કરવામાાં આવે છે. સ્થળૂ વ્યાયામ, સકુ્ષ્મ વ્યાયામ, સયૂટ િમસ્કાર, ચક્રભેદિ, વગેરે યોર્ગક ફક્રયાઓ સાંપણૂટ િરીરિ ેપ્રભાશવત કરવા માટે જ બિાવવામાાં આવી છે.
આપણામાાંિા ઘણાખરા લોકો માિશસક સ્વાસ્્ય કે માિશસક તાંદુરસ્તી અંગ ેખોટો ખ્યાલ ધરાવ ે છે .ઘણા ખરા લોકો એમ માિે છે કે માિશસક સ્વાસ્્ય અિે માિશસક બીમારી એ તદ્દિ શવરોધી બાબતો છે અિ ેઆથી જ જે વ્યક્ક્ત માિશસક રીત ેબીમાર િથી તે માિશસક રીત ેસ્વસ્થ છે ,માિશસક રોગોિા અભાવવાળી પફરક્સ્થશત એટલ ેમાિશસક સ્વાસ્્ય .આમ શિષેધક રીતે માિશસક સ્વાસ્્યિ ે સમજાવી િકાય િહીં .માિશસક સ્વાસ્્ય સસુમાયોજિ ,અસરકારક સમાયોજિ ,વ્યક્ક્તત્વિા શવકાસ માટેિી શવધાયક પફરક્સ્થશતિો શિદેિ કરે છે .
માિશસક સ્વાસ્્યિી મહત્વિી વ્યાખ્યાઓ િીચ ેપ્રમાણ ેછે : (2) ‘માિશસક સ્વાસ્્ય એટલે માિવીઓનુાં જગત સાથેનુાં તેમજ એકબીજા સાથેિો મહત્તમ
અસરકારક અિે સખુપ્રદ સમાયોજિ’ - કાલટ મેશિન્જર
અભ્યાિના હતેઓુ 1. યોગાસિ અિ ેસયૂટ િમસ્કારિી તાલીમ દ્વારા માિશસક સ્વાસ્્ય પર થતી અસર ચકાસવાિો હતે.ુ

Volume: 3, Issue: 1, July 2016 ISSN –2349- 3992
Vyayam Setu: International Journal of Physical Education and Sports Sciences 21
માપનના ધોરણો માિશસક સ્વાસ્્યિી કસોટી માટે ડો. ડી. જી. ભટ્ટ અિે જી. આર. ગીડા રર્ચત પ્રશ્નાવર્લિ ેમાપિિા ધોરણ તરીકે પસાંદ કરવામાાં આવી હતી. અભ્યાિની યોજના: કુલ 30 શવષયપાત્રોિે યાદધ્ચ્છક પદ્ધશતથી પસાંદ કરવામાાં આવ્યા હતા. એક જુથમાાં 15 શવષયપાત્રો પસાંદ કરવામાાં આવ્યા હતા. કુલ બે જૂથો બિાવવામાાં આવ્યા હતા. જેમાાં પ્રાયોર્ગક જુથ િે યોગ અિે સયૂટ િમસ્કારિી તાલીમ આપવામાાં આવી હતી જયારે શિયાંશત્રત જુથ િે યોગ અિે સયૂટ િમસ્કારિી તાલીમથી મકુ્ત રાખવામાાં આવ્યુાં હત ુાં. 6 અઠવાડીયાિા તાલીમ કાયટક્રમિી િરૂઆત કરતા પેહલા પવૂટ કસોટી અિે તાલીમ કાયટક્રમ પણૂટ થયા પછી અંશતમ કસોટી દ્વારા આંકડાઓનુાં એકશત્રકરણ કરવામાાં આવ્યુાં હત ુાં. આંકડાકીય પ્રકિયા યોગ અિે સયૂટ િમસ્કાર તાલીમિી શવષય પાત્રોિા માિશસક સ્વાસ્્ય પર થતી અસરો ચકાસવા શવચરણ સહશવચરણ પ ૃ્ થકરણ ‘F’ (ANCOVA) ટેસ્ટ લાગ ુપાડી 0.05 કક્ષાએ સાથટકતા ચકાસતા િીચ ેમજુબિા પફરણામો પ્રાપત થયા હતા. િારણી-1, પ્રાયોણગક અને સનયસંત્રત જુથનુ ંસવચરણ િહ સવચરણ પ ૃ્ થકરણ.
કસોટી (Test)
જુથ (Group) સહ શવચરણ કોષ્ટ્ટક (ANCOVA Table) પ્રાયોર્ગક જુથ (Practical Group)
શિયાંશત્રત જુથ (Control Group)
વગોિો સરવાળો (SS)
સ્વતાંત્ર માત્રા (df)
મધ્યક શવચરણ (MSS)
‘F’
પવૂટ કસોટી મધ્યક (Pree Test Mean)
25 25.75 B 5.625 1 5.625
0.506 W 421.75 38 421.75
અંશતમ કસોટી મધ્યક (Post Test Mean)
28.6 25.45 B 99.225 1 99.225
14.188* W 265.75 38 265.75
સધુારેલ મધ્યક (Adjusted Mean)
28.682 25.367 B
108.383
1 108.383 16.33*
W 245.57
2 37 245.572
*િાથાકતાનુ ંધોરણ 0.05 કક્ષાએ ‘F’ = 0.05 (1,38) = 4.196 & (1,37) = 4.084
સારણી-1 માાં પવૂટકસોટીિો ‘F’ રેશિયો 0.506 જોવા મળેલ હતો. જે 0.05 કક્ષાએ અસાથટક જોવા મળેલ હતો. જયારે બાંિે જુથિો અંશતમ કસોટીિો ‘F’ રેશિયો 14.188 જોવા મળેલ હતો. જે 0.05 કક્ષાએ સાથટક જોવા મળેલ હતો. અિે સધુારેલ મધ્યકિો ‘F’ રેશિયો 16.33 જોવા મળેલ હતો. જે 0.05 કક્ષાએ સાથટક જોવા મળ્યો હતો.

Volume: 3, Issue: 1, July 2016 ISSN –2349- 3992
Vyayam Setu: International Journal of Physical Education and Sports Sciences 22
િારણી – 2, LSD Test, (List Significant Different Test) મધ્યક (Mean)
મધ્યક તફાવત (Mean Different)
સધુારેલ મધ્યકિો ક્રાાંશતક તફાવત (CD)
પ્રાયોર્ગક જુથ (Practical Group)
શિયાંશત્રત જુથ (Control Group) 3.314*
1.650
26.682 25.367
*િાથાકતનુ ંધોરણ 0.05 કક્ષાએ
સારણી-2 મજુબ LSD કસોટી લાગ ુપડતા પ્રાયોર્ગક જુથમાાં ખબુજ સાથટક (3.314) કક્ષાએ સધુારો જોવા મળેલ હતો. શિયાંત્રીત જુથિી તલુિામાાં પ્રાયોર્ગક જુથ પર યોગ અિે સયૂટ િમસ્કાર તાલીમિી માવજત વધ ુઅસર કારક જોવા મળેલ હતી. આલેખ – 1, માનસિક સ્વાસ્્ય કિોટીના પ્રાયોણગક અને એક સનયસંત્રત જુથની પ વા કિોટી મધ્યક, અંસતમ
કિોટી મધ્યક અને સધુારેલ મધ્યક દશાાવતો આલેખ
િારાશં
પ્રાયોર્ગક જુથનુાં માિશસક સ્વાસ્્ય શિયાંત્રીત જુથ કરતા વધ ુસાથટક જોવા મળે છે. િદંર્ા ગ્રથં િાહ, દીપક (૧૯૯૦) અસાધારણ મિોશવજ્ઞાિ, અમદાવાદઃ સી .જમિાદાસ કાંપિી. સરીિ, એિ. (૧૯૯૫) યોગશિક્ષા એવાં યોગ દ્વારા રોગ શિવારણ, ફદલ્હી : ખેલ સાફહત્ય કેન્દ્ર. વમાટ,પ્રકાિ જે (૨૦૦૦) એ ટેક્ષબકુ ઓિ સ્પોટટસ સ્ટેટેસ્ટીક્સ, ગ્વાર્લયરઃ શવિસ પબ્લલકેિિ.
25 25.7528.6
25.45
28.682
25.367
0
5
10
15
20
25
30
35
પ્રાયોર્ગક જુથ શિયાંશત્રત જુથપવૂટ કસોટી મધ્યક અંશતમ કસોટી મધ્યક સધુારેલ મધ્યક

Volume: 3, Issue: 1, July 2016 ISSN –2349- 3992
Vyayam Setu: International Journal of Physical Education and Sports Sciences 23
MENTAL HEALTH AND SELF CONFIDENCE OF TRACK AND FIELD
ATHLETES OF AMITY UNIVERSITY – A COMPARATIVE STUDY
Dr. Poonam Singh,
Assistant Professor,
ASPESS, Block – J2, Amity University Campus Sector-125, Noida – 201313 (UP)
ABSTRACT
Exercise and Sports Psychology, as applied sciences has played an important role in helping sports
persons to train systematically and made them capable of putting up good performance during competitions.
It is important that teachers of physical education and coaches, in addition to bringing about complete
physical preparation, also emphasize on complete psychological preparation. In view of this the two
important psychological variable s namely mental health and self-confidence are to be given due importance
in the training process of sports persons.
The purpose of the study was the comparison between the track and field athletes studying in
different departments of Amity University, Noida who participated in SANGATHAN – Amity Inter
Institution Sports Meet - 2013, in mental health and self-confidence. The subjects for the study were 69
athletes who were classified in two groups namely humanities group and sciences group. The number of
subjects in the humanities group was 46 and that in the sciences group was 23.In order to collect relevant
data the following tools were employed: Mental health was assessed using Mental Health Check List
constructed and standardized by Mr. Pramod Kumar. Self-confidence was evaluated using the Self
Confidence Inventory constructed and standardized by Dr. M. Basavanna. Means and Standard deviations
were computed for data on both the variables in respect of the subjects belonging to the humanities and the
sciences groups. In order to compute significance of difference in the means of the two groups, t- test was
employed. From the analysis of data it was revealed that there was no significant difference in mental health
and self-confidence in the humanities and the sciences groups. The t ratios obtained were 0.30 for the mental
health and 1.16 for self-confidence.
Key Words: Mental Health, Self Confidence
INTRODUCTION
Sports play a predominant role in the man making process. Sports person are experiencing
difficulties in facing many challenges for reaching higher level of performance. Self confidences
and mental health is the two important attributes which are required for the successful life and for
advancing both personal and career goals. World Health Organization defines Mental health is as
a state of well being in which the individual realizes his or her own abilities to cope with the normal
stresses of life, can work productively and fruitfully, and is able to make a contribution to his or
her community. WHO stresses that mental health is not just the absence of mental disorder,
positive mental health is linked to a range of development outcomes, including better health status,
higher educational achievement, improved interpersonal relationships, closer social connection
and improved quality of life. Positive mental health is also fundamental to coping with adversity.
On the other hand, poor mental health impedes an individual's capacity to realize their potential,
work productivity and make a contribution to their community. Mental health is very important
for the proper development of an individual. If we want to lead a very qualitative life we should
have no stress and with stress approach we can contribute not for our working organization but
also for the community too. Evidence from the World Health Organization suggests that nearly
half of the world's population is affected by mental illness with an impact on their self-esteem,
relationships and ability to function in everyday life. An individual's emotional health can also
impact physical health and poor mental health can lead to problems such as abuse. Self confidence
is the confidence you have in yourself. It is a key to succeed in any types of work. It is extremely
important in almost every aspect of our life. It plays an important role in our life about who we are
and how we are carrying ourselves. People who lack self-confidence are less likely to achieve their

Volume: 3, Issue: 1, July 2016 ISSN –2349- 3992
Vyayam Setu: International Journal of Physical Education and Sports Sciences 24
goals and it becomes a barrier between them and their success. It also has a major impact on the
social life of the individual. Self confidence is a person's belief that he or she has the ability to
succeed. Athletes who are self confident and expect to succeed often achieve their goal. Players
must always look at the positive side of things, be correctly prepared, and remain committed to
situation that poses challenges to them. In the light of the above it is important that physical
education teachers and coaches evaluate their sports persons in psychological variables and
especially in respect of mental health and self confidence so that their status with regard to
psychological preparation can be correctly assessed.
METHODOLOGY AND ANALYSIS
Sixty nine students studying in different departments of Amity University, Noida, who
participated in track and field events in SANGATHAN – Amity Inter Institution Sports Meet -
2013, were selected as subjects for the study. Subjects were arranged in group’s i.e. Humanities
group and Sciences group. The number of subjects in the above two groups were as follows:
Humanities Group=46, Sciences Group=23.For the selected variables namely mental health and
self confidence, the following tools were used: Mental health of the subjects was assessed using
Mental Health Check- List constructed and standardized by Mr. Promod Verma.Self confidence
of the subjects was assessed using Self Confidence Inventory constructed and standardized by Dr.
M. Basavanna.
The analysis of data pertaining to mental health and self confidence is presented in
Tables 1 and Table 2.
Table 1, SIGNIFICANCE OF DIFFERENCE BETWEEN THE MEANS OF TRACK AND
FIELD ATHLETES BELONGING TO THE HUMANITIES AND SCIENCES GROUPS IN
MENTAL HEALTH
Group Mean Mean Diff. S.D. S.E. t-ratio
Humanities group 30.74 5.50
00.03 1.44 0.03*
Sciences group 30.78 5.93
*Not Significant at 0.05 level
The Table 1 shows that disparity in the means of the humanities and the sciences groups in
mental health are statistically not significant at 0.05 level of confidence. The t value of 0.03 is less
than the table value of 2.00 with 67 degrees of freedom.
Table 2, SIGNIFICANCE OF DIFFERENCE BETWEEN THE MEANS OF TRACK AND
FIELD ATHLETES BELONGING TO THE HUMANITIES AND SCIENCES GROUPS IN
SELF CONFIDENCE
Group Mean Mean Diff. S.D. S.E. t-ratio
Humanities group 52.41 4.62
00.93 0.80 1.16*
Sciences group 51.48 1.56
*Not Significant at 0.05 level
Table 2 shows that the difference of 0.93 between the means of humanities and sciences
groups with respect to self confidence is statistically not significant at 0.05 level of confidence.
The t value of 1.16 is less than the Table value of 2.00 with 67 degrees of freedom.

Volume: 3, Issue: 1, July 2016 ISSN –2349- 3992
Vyayam Setu: International Journal of Physical Education and Sports Sciences 25
FINDINGS AND CONCLUSION
The analysis of data shows that the difference in the means in respect of mental health and
self confidence of track and field athletes studying in humanities and sciences departments of
Amity University, Noida are statistically not significant.
The t-values obtained for both the psychological variables are less than the table value with
67 degrees of freedom.
Mental health is an index which shows the extent to which the individual has been able to
meet his individual environmental demands that are classified in three categories namely social,
emotional and physical.
No statistically significant difference between track and field athletes participating in
different events could be due to the fact that this important psychological variable equally
influences all categories of athletes.
In addition to self confidence, mental health also plays a significant role in social life of
the individual. Players must always look at the positive side of things, be correctly prepared, and
remain committed to situation that poses challenges to them. The scholar is of the view that this
variable plays a significant role in case attainment of goals is to be guaranteed. Therefore,
irrespective of the athletic event in which a person participates self confidence is of great
importance and this variable affects every athlete in the same manner. Due to this reason no
significant difference has been obtained in this variable.
Within the delimitations of the present study, the following conclusions have been drawn:
1. The students of different departments of Amity University, Noida, who participated in
track and field events in SANGATHAN – Amity Inter Institution Sports Meet - 2013, did
not significantly differ in mental health.
2. With respect to self-confidence also significant difference was not found in humanities and
sciences students of different departments of Amity University, Noida who participated in
track and field in SANGATHAN – Amity Inter Institution Sports Meet - 2013.
REFERENCES:
1. Gahlawat O. P. & Gahlawat P. (2012). A Comparative Study of Players and Non Players in
relation to Mental Health, Journal of Exercise Science and Physiotherapy. Volume 8, Pages
43-47

Volume: 3, Issue: 1, July 2016 ISSN –2349- 3992
Vyayam Setu: International Journal of Physical Education and Sports Sciences 26
A COMPERATIVE STUDY OF COMPETITIVE BEHAVIOR AMONG THE SPORTS
MAN OF INDIVIDUAL AND TEAM GAMES OF GUJARAT
Mr. Ravi Bhadoria, PET
The Aditya Birla Public School,
Kharach, Bharuch, Gujarat 394120
ABSTRACT
The purpose of the present study is to initially investigate the competitive behaviour
between the team game and individual game players. The importance of competition for sports
training hardly be overestimated competition represent a special type of physical load which is
indispensable for performance improvement? Due to psychic factor the load during a competition
is much more than during the training the main aim of modern sports competition is to detect and
diagnose the human ability at an early stage of life and channelize it in the right direction to realize
the achievement at in particular sport game. Since long time competition has been considered in
pedagogic and psychology to be a stimulating factor for a person‘s active. The stimulating effect
of competition has been studies thought a number of psychology investigation. In the condition of
actual sports activity .the stimulating factor of competition must be considered and given weight
age in process of the training.
INTRODUCTION
Sports is both a social and economic phenomenon to deeply comprehend it requires a
multiscientific approach arising from different sectors of research. in sports fan interest is
generated when what why they witness is exciting without knowing the final outcome.
Groot (2008) proposes that a line needs to be drawn between static and dynamic
competitive balance. Static competitive balance refers to the equilibrium between teams at the end
of one championship season while dynamic competitive balance defines what happen from season
to season.
Competition in sports as always connected with the aspiration of individual for activity
higher goals. In high class competition one always plans to create a new record of the becoming
champion in a particular sports.
Participation in competition always has a social significant as the team or an individual
represent the city. State or the country his performance is there fore bound to be evaluated by other
people .This leads to the participation in competition has a great responsibility on his shoulders.
The higher the category of competition the greater the significant it has.
Human being is by nature competitive and ambitions for excellence in all athletic
performance .Not only men but all nation want to show their but all nations want to show their
supremacy .thus challenge stimulating inspires and motivates all the nations to sweat . Strive to
run faster jump higher. Throw further and exhibit greater strength endurance and skills in the
present competitive world of sports .this is only possible by canalizing their energy to appropriate
games and sport according to their potentialities.
Behaviour is this simple sense is not merely the movement of the limbs and organs of the
body it is much more than that. It has morphological connotation and functional implication .the
central core of psychology is the study of behaviour and the general aim of all education is. The
modification of behaviour .In fact all action reaction and interaction of an organism which are
product of the forces of heredity and environment may. In a way, comprise behaviour. Behaviour
is a product of a number of forces and that is why it is extremely complex in nature.

Volume: 3, Issue: 1, July 2016 ISSN –2349- 3992
Vyayam Setu: International Journal of Physical Education and Sports Sciences 27
Individual difference among the athletes has made the study of behaviour more complex
than ever. Wide variety of situations are encountered by the athlete while competing against the
equally good athletes and frequent change in the situation force in to behave in a different manner
along with the problem which arise from the situation under the high tensed atmosphere.
Mental preparation for competition is not normally something that the night before a by
event. Rather, it is a general philosophy that should influence almost everything you do in your
overall preparation. Preparation the key to success and there really are not any short cuts to
becoming a champion athlete. When individual make the all important from bring someone who
promise to someone who make commitments, then. They are likely to fulfil potential until them
the chances of success are limited.
Sports and games are competitive in mature and meant for a specific age group. The
participation is only enjoyed by the talented and gifted younger’s. So the process of canalization
of athlete into various sports and games should be according to their ability and interest, after
various investigation are made by the sports institution .This is an important phenomenon may
build a great stumbling. Block in the progress of the sports in the country because it has been seen
that population in India remains aloof from competitive sports.
Competitive behaviour is an important parameter for a player’s performance and
participating teams as it mutually beneficial for both .having some knowledge of the competitive
behaviour is like knowing the environment and conditions the team play in. This is an important
issue for every sports manager, but also for owner and coaches.
The setting of high standard is an integral part of elite sport, and often beneficial for the
athlete‘s performance. However individuals who are characterizes by frequent cognitions about
the attainment of ideal, perfectionist standard, have been shown to be likely to experience
heightened level of anxiety , due to discrepancies between ideal and current self / situation . This
could of course be detrimental to their sport performance. The aim study was to investigate the
relationship between different patterns to perfectionist dimensions and sport – related competitive
anxiety and self confidence self –esteem and perfectionism differs depending on which dimensions
of self – esteem and perfectionism that are being considered. Athletes with self – esteem based on
a respect and love for themselves had more positive patterns of perfectionism , whereas athletes
who have a self – esteem that is dependent on competence aspects shoed a more negative
perfectionism . Further negative patterns of perfectionism were in the present study related to
higher levels of cognitive anxiety and lower levels of self confidence. Hence, it seems that sport
related anxiety is positively associated to certain patterns of perfections patterns that are more
common in individual with specific self – esteem strategies.
The study we present here. Which concentrates on analyzing the efficacy of the verbal
behaviour of coaches, aims of define an intervention protocol for volleyball coaches during
competition? The research was carried out by means of questionnaire given to 25 volleyball
experts (university volleyball teachers and volley ball coaches with experience at top national
level).
The variable analyzed consists of the study of the content of information transmitted by the
coaches in according with each moment of the game in which communication with the players
occurs.
As for the result obtained, and taking into account that the there are differences between
different moment of the game, it should be stressed that the overall information must be mainly
tactical and refer to both the opponents and one‘s own team in equal measure. It must be positive
and should not include more than three pieces of information.
This thesis investigated whether a relationship exists between the intra competition
psychological and psycho physiological arousal level of basketball coaches and their behaviour
during the match. Study one examined the relationship between coaches behaviour and arousal
level. Trait anxiety was measured at the commencement of the study using the sport competition

Volume: 3, Issue: 1, July 2016 ISSN –2349- 3992
Vyayam Setu: International Journal of Physical Education and Sports Sciences 28
Anxiety test (SCAT.) study 2 was designed and measured particularly with regard to specific event
in the game that might be deemed stressful to coach the aim of study 3 was to use the views and
interpretation of individual coaches of their thought and behaviour about selected game situations
to elucidate the patterns observed in study.
METHODS
The study examined the subjects selected randomly from, Gujarat. 150 subjects shall be
taken from team games and 150 will be from individual games. The level of sportsman will be
national level. The age of all subjects shall range between 18-28 years.
The purpose of the current investigation was test the utility of a videotaped observation
(VO) approach on the study of aggressive behaviour, and to compare the result with previous
findings. Subjects were male varsity hocked (n=79) players competing at a neutral location where
two video cameras had been placed to record the action. The competing tapes were coded by two
independent observers using a validated operational list, with high inter –rater reliability (>90%).
The VO design accounted for significantly, more aggressive infractions [X2 (1, N=74) =28.60, P
<.001]; thus, highlighting is ability to overcome previous limitations. Furthermore, this more
inclusive sample of behaviours provided substantially different result when tested according to the
score differential. Period, players position methodological differences, Imitations of the vo design
are discussed and its future value of the study of aggressive Behaviour sport in highlighted.
SCORING OF QUESTIONNAIRE
The answers of the questionnaire will be one from three point scale:-
ALWAYS, SOMETIME, NEVER
The scoring of the question no:-
1,2,3,4,5,6,7,8,9,10,11,12,13,14,15,16,17,18,19,20,21,22,23,24,25,26,27,28,29,30,31,32,
33,34,35,36,37,38,39,is follows.
ALWAYS--- - - -3, sometime- - - - - - - 2, NEVER- - - - -1
And the scoring of the question no:-
7,15,16,17,22,21,23,24,26,27,29,30,31,32,34,39,40
ALWAYS- - --- - - 1, SOMETIMES- -- -- - - - 2NEVER----- --- - - - 3
Interpretation of score will be done as per the manual of questionnaire.
STATISTICAL ANALYSIS
The responses obtained from sports man and comates will be analyzed in terms of means
and standard deviation. Latter’s’ test will be used to compare behavior of individual game and
team games. Statistical analysis will be perform using SPSS (Stastical Package for the Social
Sciences) version19, a product of IBM. The level of significance difference will be set at 0.05
RESULT AND DISCUSSION MENTAL PERSISTENCE
Descriptive analysis on various variables of mental persistence for team and individual
games
VARIABLES GAME GENDER MEAN Std.Deviation N
Motivation Team Male 32.44 4.123 24
Female 33.21 5.342 14
Total 32.82 4.732 38
Individual Male 34.67 5.123 24
Female 33.12 3.656 18
Total 33.89 4.389 42

Volume: 3, Issue: 1, July 2016 ISSN –2349- 3992
Vyayam Setu: International Journal of Physical Education and Sports Sciences 29
Total Male 33.55 4.623 48
Female 33.16 4.499 32
Total 33.35 4.561 80
Self
confidence
Team Male 27.23 4.112 24
Female 27.20 4.219 16
Total 27.21 4.165 40
Individual Male 27.70 3.122 23
Female 27.45 3.525 18
Total 55.15 3.323 41
Total Male 27.46 3.617 47
Female 27.32 3.872 34
Total 27.39 3.744 81
Attention Team Male 35.12 6.752 24
Female 33.88 3.826 15
Total 34.5 5.289 39
Individual Male 34.85 4.160 23
Female 33.21 4.123 16
Total 34.03 4.141 39
Total Male 34.98 5.456 47
Female 33.54 3.974 31
Total 34.26 4.715 78
Goal Setting Team Male 33.56 7.97 24
Female 30.28 6.766 16
Total 31.92 7.368 40
Individual Male 30.98 7.098 25
Female 27.19 4.823 17
Total 29.08 5.960 42
Total Male 32.27 7.534 49
Female 28.73 5.794 33
Total 30.5 6.664 82
Aggression Team Male 21.85 2.097 24
Female 19.87 3.125 15
Total 20.86 2.611 39
Individual Male 24.17 3.087 24
Female 20.45 4.252 18
Total 22.31 3.669 42
Total Male 23.01 2.592 48
Female 20.16 3.688 33
Total 21.58 3.14 81
Over view of sample means and standard deviation of mental persistence
Variables Mean S.D. N
Motivation 33.35 4.561 80
Self confidence 27.39 3.744 81
Attention 34.26 4.715 78
Goal setting 30.52 6.664 82
Aggression 21.58 3.14 81

Volume: 3, Issue: 1, July 2016 ISSN –2349- 3992
Vyayam Setu: International Journal of Physical Education and Sports Sciences 30
CONCLUSIONS
With the limitations of the study following conclusions were drawn:
No significance difference was found in the variables of mental persistence between team
and individual games.
The variable of attention, goal setting, and aggression was found to be significant in context
of gender i.e. between male and female players in team and individual game viz, the value
for attention=4.715,goal setting=6.664 and aggression=03.14.were found significant at
0.04 level of significance and other variables were insignificant at the .05 level of
significance.
There was an insignificant difference between gender and games at .05 level of
significance.
REFERENCES
1. Sharma Lalit (2007) “Attribution in Physical Education” Delhi; sports
publication
2. Kamlesh M.L. (2012) “Psychology in Physical Education and Sports“, Delhi;
Khel Sahitya Kendra
3. www.slideshare.net/malika sharma3/comparative study on psychological
variables.

Volume: 3, Issue: 1, July 2016 ISSN –2349- 3992
Vyayam Setu: International Journal of Physical Education and Sports Sciences 31
INFLUENCE OF DIFFERENT RESISTANCE TRAINING PROTOCOLS
ON SELECTED PHYSIOLOGICAL AND BIOCHEMICAL VARIABLES
OF COLLEGE MEN STUDENTS
Surender Pratap Singh,
Research Scholar,
Department of Physical Education,
Swarnim Gujarat Sports University,
Sector 15, Gandhinagar, Gujarat 382016
Dr. Sudhir Kumar Sharma,
Associate Professor and Supervisor,
Department of Physical Education,
Swarnim Gujarat Sports University,
Sector 15, Gandhinagar, Gujarat 382016.
ABSTRACT
The purpose of this study was to find out the influence of different Resistance Training
Protocols on selected Physiological and Biochemical Variables of college men students, One
hundred twenty male college students from University of Delhi were selected as subjects at random
and their age was between Eighteen to Twenty Two years.
The selected subjects were randomly divided into three equal groups of forty each (n=40).
Group I and II were treated as Experimental Group and Group-III was considered as Control
Group. All the subjects were given basic Strength Training Exercises without Weight and with
minimal Weight for three weeks prior to pre-test and training in order to get initial adaptation for
undergoing Resistance Training during their training period. Initial tests were taken for all the
subjects on Physiological Variable such as VO2 Max. It was concluded from the results of the
study that there was significant difference in the pre-test and post-test of the three Experimental
Groups. It was also concluded from the study that there was significant difference in the adjusted
post-test means.
Keyword: Physiological Variables, Bio-chemical Variables, VO2 Max
INTRODUCTION:
Training is a planned and systematic process progressively given for a long duration in
which individuals are graded. Training aims at moulding the human’s Psychological and
Physiological functions in order to meet demanding task.
Physiological Variables may be defined as the scales that measure the function of human
systems. In human being a variety of Physiological Functions such as Resting Pulse Rate, Breath
Holding Time, Vital Capacity and VO2 Max show distinct changes in the course of training, with
the values falling to their lowest during rest. This phenomenon is accepted only in sports field.
These changes in physiological functions have been found to be associated with changes in
performance.
Blood stream carries the main forms of fat called cholesterol and triglycerides. These fats
are lipids come partly from food, partly from the body’s own production in the liver. Fats are not
water soluble and hence cannot travel through the blood easily. With the help of lipoproteins,
digested fat from the liver is carried to various parts of the body by the blood vessels. The
cholesterol returns to the liver and repeats its job.
The lipoproteins are packages of cholesterol placed in liver. Lipoproteins are made from
Lipids and Proteins. There are mainly four kinds of Lipoprotein Packages namely Chylomicrons,
Very Low Density of Lipoproteins (VLDL), Low Density of Lipoproteins (LDL), High Density
of Lipoproteins (HDL), High Density of Lipoproteins has more Protein content. (Sri Lakshmi,
2005).
METHODOLOGY:
To find out the influence of different Resistance Training Protocols on selected Physiological
and Biochemical variables of college men students, One hundred twenty male college students

Volume: 3, Issue: 1, July 2016 ISSN –2349- 3992
Vyayam Setu: International Journal of Physical Education and Sports Sciences 32
from University of Delhi were selected as subjects at random and their age was between Eighteen
to Twenty Two years.
The selected subjects were randomly divided into three equal groups of forty each (n=40).
Group I and II were treated as Experimental Group and Group-III was considered as Control
Group. All the subjects were given basic Strength Training Exercises without Weight and with
minimal Weight for three weeks prior to pre-test and training in order to get initial adaptation for
undergoing Resistance Training during their Training period. Initial tests were taken for all the
subjects on Physiological Variable such as VO2 Max. All the two experimental groups were given
training for a period of sixteen weeks. For the first twelve weeks the subjects were trained for three
non-consecutive days per week and for the next four weeks the subjects were trained on alternate
days.
Experimental Group I was given resistance training with low intensity and high volume.
Experimental Group II performed resistance training with medium intensity and low volume.
Experimental Group III served as Control Group. The subjects were tested on selected Criterion
Variables prior and immediately after the sixteen weeks of training programme as pre and post-
tests respectively. The collected data were analyzed statistically by using ANCOVA.
RESULTS:
Table 1, ANALYSIS OF COVARIANCE OF PRE-TEST AND POST TEST AND
ADJUSTED POST TEST ON VO2 MAX OF TWO EXPERIMENTAL GROUPS AND
CONTROL GROUP, (Scores in Mts.) Test Exp.
Group I Exp.
Group II Control Group
SV SS df MS O’F’
Pre-test mean
1689.00 1685.00 1558.37 B 441503.750 2 220751.875
144.996*
S.D. 35.70 53.49 20.76 W 178129.375 117 1522.473
Post-test Mean
1853.25 1899.75 1553.75 B 2821046.667
2 1410523.333
1041.453*
S.D. 23.79 55.26 21.05 W 158462.500 117 1354.380
Adjusted Post-Test Mean
1848.231 1895.178 1563.341 B 787135.326 2 393567.663
292.214*
W 156234.031 116 1346.845
*Significant at .05 level of confidence
(The table value required at .05 level of confidence for 2 and 117 and 2 and 116 are 3.09 and 3.09
respectively).
Table 1 shows the analyzed data on VO2 Max. The pre-test means of VO2 Max were
1689.00 for Experimental Group I, 1685.00 for Experimental Group II and 1558.37 for Control
Group. The obtained “F” ratio of 144.99 was greater than the table F-ratio 3.09. Hence, the pre-
test was significant at 0.05 level of confidence for the degrees of freedom 2 and 117.
The post-test means of VO2 Max were 1853.25 for Experimental Group I, 1899.75 for
Experimental Group II and 1553.75 for Control Group. The obtained “F” ratio of 1041.45 was
greater than the table F-ratio 3.09. Hence, the post-test was significant at 0.05 level of confidence
for the degrees of freedom 2 and 117.
The adjusted post-test means of VO2 Max were 1848.23 for Experimental Group I,
1895.17 for and Experimental Group II and 1563.34 for Control Group. The obtained “F” ratio of
292.21 was greater than the table F-ratio 3.09. Whenever the obtained ‘F’ ratio for Adjusted
Posttest was found to be significant, the Scheffe’s Post Hoc Test was used to find out the paired
mean differences. It was presented in Table 1 (a).

Volume: 3, Issue: 1, July 2016 ISSN –2349- 3992
Vyayam Setu: International Journal of Physical Education and Sports Sciences 33
Table 1 (a), Scheffe’s post hoc test mean differences on VO2 MAX among three groups
(Scores in Mts.)
Experimental
Group I
Experimental
Group II
Control
Group
MD CD
1848.231 1895.178 -- 46.947
219.514 1848.231 -- 1563.341 284.89*
-- 1895.178 1563.341 331.837*
*Significant at 0.05 Level of Confidence
Table 1(a) shows the Scheffe’s Post Hoc test results. The ordered adjusted final mean
difference for VO2 Max of Experimental Group I, II and Control Group were tested for
significance at 0.05 Level of Confidence against Critial Difference Value. The mean differences
between Experimental Group I and Control Group and Experimental Group II and Control Group
was 284.89 and 321.28 respectively. The obtained Mean Differences of these groups was greater
than the Critical Difference Value 219.514 which shows that the comparisons was significant.
The obtained Adjusted Mean Difference between Experimental Group I and Experimental
Group II was 46.94 which was lesser than the Critical Difference Value 219.514. Hence the above
comparison was not significant.
CONCLUSION: It was concluded from the results of the study that there was significant difference in the
pre-test and post-test of the three experimental groups. It was also concluded from the study that
there was significant difference in the adjusted post-test means of both the Experimental Group
and Control Group.
REFERENCES:
1. Uppal, A. K.(2009) Science of Sports Training, New Delhi; Friends Publications
2. Wuest, Deborah and Bucher, Charles A. (2010) Foundations of Physical Education
Exercise Science and Sport, New Delhi; Tata McGraw Hill
3. Singh Hardayal , (1995) Science of Sports Training, New Delhi; D.V.S Publications,
4. Kraemer W J et al, (2002) Resistance Training for Health and Performance, Current Sports
Medicine Reports,
5. Sri Lakshmi, B (2005) Dietetics, New Delhi; New Age International (P) Limited
Publishers,
6. Bompa, Tudor O. (1999) Periodization: Theory and Methodology of Training
Champaign, Illinois: Human Kinetics Publishers

Volume: 3, Issue: 1, July 2016 ISSN –2349- 3992
Vyayam Setu: International Journal of Physical Education and Sports Sciences 34
EFFECT OF TRAINING WITH AEROBICS AND SPECIAL EXERCISE
ON BODY COMPOSITION OF WORKING WOMEN
Meeta R. Vyas,
Ph.D. Research Scholar,
Swarnim Gujarat Sports University,
Sector 15, Gandhinagar, Gujarat 382016
Prof. Jamnadas K. Savaliya,
Dean,
Faculty of Phy. Edu. & Sports,
Gujarat Vidhyapith, Sadara, Gandhinagar,
Gujarat 382320 .
ABSTRACT
The purpose of this study is to see effects of training with aerobics and special various
exercises on the Body Composition of working women.To know the status of body composition
of working women.To know the effect of aerobics and special exercise on body composition. To
know the overall effects of aerobics and special exercise on working women for this study
women’s from Gandhinagar district were selected. The age group was between 30-45 years in this
research work Body composition tested by Tanita body composition analyzer machine.For this
study there were three groups Group A – Aerobics 2) Group B- Specific 3) Group –Ccontrol. For
this study program of exercise was 12 weeks.To find out the effect of aerobics on body composition
of working women “F’ test was taken for analysis From this research analysis shows that effect of
aerobics and special exercise on body composition was significant then control group .
Key Words:-Aerobics, Body Composition B.M.I, B.M.R, Total Body water, Fat Mass
INTRODUCTION
The several benefits that are derived from the regular physical fitness workouts. Workout
chalked out in correspondence to the physical needs of the body, if observed regularly, may help
the body get into the desired shape and develop resistance power in the body. The major benefits
derived from fitness training programs are bringing down the weight of the bulky body to right
proportion, increases the resistance power in the body which results in decreasing the risks of
getting attacked by diseases, helps in cutting down the fat from the body and finally gives the body
a toned shape. The study of human body composition has been several decades. The body
composition assessment is generally linked to the determination of the relative amount of in the
fat body having application in several fields of study such as medicine, public health, nutrition,
health and fitness, and exercise science The body mass index (BMI) is a person's weight in
kilograms (kg) divided by their height in meters (m) squared. The rate at which heat is produced
by an individual in a resting state is called B.M.R and The sum of intracellular water and extra
cellular water (volume); about 60% of body weight is called total body water.
STATEMENT OF PROBLEM
The purpose of this study is to see Effects of training with aerobics and special exercises
on the Body Composition of working women.
OBJECTIVES
1) To know the status of body composition of working women
2) To know the effect of aerobics and special exercise on body composition
3) To know the overall effects of Aerobics and special exercise on working women
METHOD
60 women of Gandhinagar district were selected randomly. There wasThree groups.1)
Group A – Aerobics 2) Group B- Specific exercise 3) Group –C Control Group A was given

Volume: 3, Issue: 1, July 2016 ISSN –2349- 3992
Vyayam Setu: International Journal of Physical Education and Sports Sciences 35
aerobics training; Group B was given special excises of Butt, Belly and Thigh. Following
physiological aspects was selected for this study.
1) Age
2) Weight (kg)
3) Body Mass index
4) Basal Metabolic rate
5) Fat Mass
6) Total Body water
The equipment’s was taken in use for this study of Body Composition Analyzer- Machine,
were procured from registered standard equipments suppliers. All these equipments were tested in
the physical experimental laboratory of Mahadev Desai Physical Education College, Sadra,
District-Gandhinagar
For Exercise training and Aerobics training there will be 12 week program as per under
Group A was given Aerobics training whole body exercise with music and Group B was given
special exercise. Group A was given training on Monday, Wednesday and Friday. Group B was
given special exercise on Tuesday, Thursday and Saturday
RESULT AND DISCUSSION
For this research work data was collected as pre test and post test. Data was collected before
training and after 12 weeks training. Statistical Analysis was done from collected data. To check
Mean difference. Analysis of variance (ANOVA) and Analysis co-variance (ANCOVA) To check
signification level between four group LSD was taken as 0.05 significant level The level of
significance chosen to study the significance of difference between means obtained by using mean
difference method and analysis of variance was set at 0.05 level of confidence, and “F” ratio was
considered adequate for the purpose of the study.To see the Effect of Special exercise and Aerobics
on body composition and Anthropometric measurements Analysis has been shown in tables and
graph thoroughly.
Table-1 Weight, Analysis of variance and co-variance of mean for Aerobic Group, Special
Exercise Group, and Control Group in the Performance of weight
(Test)
Group ANCOVA TABLE
A B C (SS) (df) (MSS) ‘F’
(Pre Test
Mean) 67.315 64.65 66.94
A 83.246 2 41.623 0.438
W 5409.643 57 94.906
(Post Test
Mean) 64.725 61.765 68.14
A 407.096 2 203.548 3.248*
W 3571.191 57 62.652
(Adjusted
Mean) 63.91 63.08 67.62
A 233.100 2 116.550 61.605*
W 105.945 56 1.891
* Significant level of 0.05 F = (2, 57) 3.15
The analysis of the data shown in table-1 Pre-test mean of groups A, B and C are 67.31,
64.65 and 66.94 respectively. The ‘F’ ratio of Pre-test is 0.438, which is not significant at 0.05
level of confidence. Its Indicates that the average initial differences between the groups is not
significant.
The post-test mean is 64.72, 61.76 and 68.14 subsequently and the pos-test ‘F’ ratio is
3.248, which is significant at 0.05 level of confidence .Its indicates that there are significant
difference between groups in posttest.

Volume: 3, Issue: 1, July 2016 ISSN –2349- 3992
Vyayam Setu: International Journal of Physical Education and Sports Sciences 36
The Adjusted mean is 63.91, 63.08 and 67.62 subsequently and the adjusted mean ‘F’ ratio
is 61.605, which is significant at 0.05 level of confidence. It indicates that there are significant
differences between groups in Adjusted Mean.
As the post-test ‘F’ ratio found significant post-hoc LSD test was applied.
Graph -1, Pretest and Posttest mean and Adjusted Mean for Aerobics Group, Special
Exercise Group, and Control Group in the Performance of weight
Table -2, Mean difference and critical difference of Aerobics group, Special Exercise group,
and control group in performance of weight
(Mean) (MD) (CD)
A B C
63.913 63.086 0.827 0.869
63.913 67.629 3.715*
63.086 67.629 4.542*
Necessary value at 0.05 level (C.D.) = 0.869.
It is shown from table-2 that there is significant difference between A-C and B-C, where
as there is no significant difference between groups A-B.
Here shown that the difference between group A-C and B-C is 3.71 and 4.54. Which is
more than critical difference 0.869. Here group B prove more significant than group A.
Pretest mean
Posttest mean
Adjusted mean
58
59
60
61
62
63
64
65
66
67
68
69
Group AGroup B
Group C
67.315
64.65
66.94
64.725
61.76
68.14
63.91
63.08
67.62
Pretest mean
Posttest mean
Adjusted mean

Volume: 3, Issue: 1, July 2016 ISSN –2349- 3992
Vyayam Setu: International Journal of Physical Education and Sports Sciences 37
Table-3, Body Mass Index, Analysis of variance and co-variance of mean for Aerobic
Group,Special Exercise Group, and Control Group in the Performance of B.M.I.
(Test)
Group ANCOVA TABLE
A B C (SS) (df) (MSS) ‘F’
(Pre Test
Mean) 26.61 26.17 26.67
A 2.981 2 1.490 0.102
W 825.462 57 14.481
(Post Test
Mean) 25.535 25.025 27.385
A 61.681 2 30.840 3.462*
W 507.729 57 8.907
(Adjusted
Mean) 25.43 25.264 27.242
A 47.913 2 23.956 51.373*
W 26.114 56 0.466
* Significant level of 0.05 F = (2, 57) 3.15
The analysis of the data shown in table-3 Pre test mean of groups A, B and C are 26.61,
26.17 and 26.67 respectively. The ‘F’ ratio of Pretest is 0.102, which is not significant at 0.05 level
of confidence. Its Indicates that the average initial differences between the groups is not
significant.
The post-test mean is 25.53, 25.02 and 27.38 subsequently and the post-test ‘F’ ratio is
3.462, which is significant at 0.05 level of confidence. It’s Indicates that there are significant
differences between groups in post-test.
The Adjusted mean is 25.43, 25.26 and 27.24 subsequently and the adjusted mean ‘F’ ratio
is 51.373, which is significant at 0.05 level of confidence. It’s Indicates that there are significant
differences between groups in Adjusted Mean.
As the post-test ‘F’ ratio found significant post-hoc LSD test was applied.
Graph -2, Pretest and Posttest mean and Adjusted Mean for Aerobic Group, SpecialExercise
Group, and Control Group in the Performance of B.M.I
Pretest mean
Posttest mean
Adjusted mean
23.5
24
24.5
25
25.5
26
26.5
27
27.5
Group AGroup B
Group C
26.61
26.1726.67
25.53
25.02
27.38
25.43
25.26
27.24
Pretest mean
Posttest mean
Adjusted mean

Volume: 3, Issue: 1, July 2016 ISSN –2349- 3992
Vyayam Setu: International Journal of Physical Education and Sports Sciences 38
Table -4, Mean difference and critical difference of Aerobics group, Special Exercise group,
and Control group in performance of B.M.I.
(Mean) (MD) (CD)
A B C
25.438 25.264 0.173 0.431
25.438 27.242 1.804*
25.264 27.242 1.978*
Necessary value at 0.05 level (C.D.) = 0.431.
It is shown from table-4 that there is significant difference between A-C and B-C, where
as there is no significant difference between groups A-B.
Here shown that the difference between group A-C and B-C is 1.80 and 1.97. Which is
more than critical difference 0.431 .Here group B prove more significant than group A.
Table-5, Basal Metabolic Rate, Analysis of variance and co-variance of mean for Aerobic
Group,Special Exercise Group, and Control Group in the Performance of B.M.R
(Test)
Group ANCOVA TABLE
A B C (SS) (df) (MSS) ‘F’
(Pre Test
Mean) 1411.85 1408.6 1441.65
A 13272.7 2 6636.35 0.515
W 734219.9 57 12881.0509
(Post Test
Mean) 1374.35 1375.95 1451.15
A 77038.9333 2 38519.4667 3.288*
W 667666.05 57 11713.4395
(Adjusted
Mean) 1382.68 1387.35 1431.41
A 28414.9428 2 14207.4714 50.164*
W 15860.1833 56 283.217558
* Significant level of 0.05 F = (2, 57) 3.15
The analysis of the data shown in table-5 Pre test mean of groups A, B and C are 1411.85,
1408.6 and 1441.65 respectively. The ‘F’ ratio of Pretest is 0.515, which is not significant at 0.05
level of confidence. Its Indicates that the average initial differences between the groups is not
significant.
The post-test mean is 1374.35, 1375.95 and 1451.15 subsequently and the post-test ‘F’
ratio is 3.288, which is significant at 0.05 level of confidence. It indicates that there are significant
differences between groups in posttest.
The Adjusted mean is 1382.68, 1387.35 and 1431.41 subsequently and the adjusted mean
‘F’ ratio is 50.164, which is significant at 0.05 level of confidence. It indicates that there are
significant differences between groups in Adjusted Mean.
As the post-test ‘F’ ratio found significant post-hoc LSD test was applied.

Volume: 3, Issue: 1, July 2016 ISSN –2349- 3992
Vyayam Setu: International Journal of Physical Education and Sports Sciences 39
Graph -3, Pretest and Posttest mean and Adjusted Mean for Aerobic Group, Special
Exercise Group and Control Group in the Performance of B.M.R
Table -6, Mean difference and critical difference of Aerobics group, Special Exercise group,
and Control group in performance of B.M.R.
(Mean) (MD) (CD)
A B C
1382.688 1387.350 4.662
10.643
1382.688 1431.410 48.722*
1387.350 1431.410 44.060*
Necessary value at 0.05 level (C.D.) = 10.643.
It is shown from table-6 that there is significant difference between A-C and B-C, where
as there is no significant difference between groups A-B.
Here shown that the difference between group A-C and B-C is 48.722 and 44.060. which
is more than critical difference 10.643. Here group B prove more significant than group A.
Pretest mean
Posttest mean
Adjusted mean
1320
1340
1360
1380
1400
1420
1440
1460
Group AGroup B
Group C
1411.85
1408.6
1441.65
1374.351375.95
1451.15
1382.68 1387.35
1431.41
Pretest mean
Posttest mean
Adjusted mean
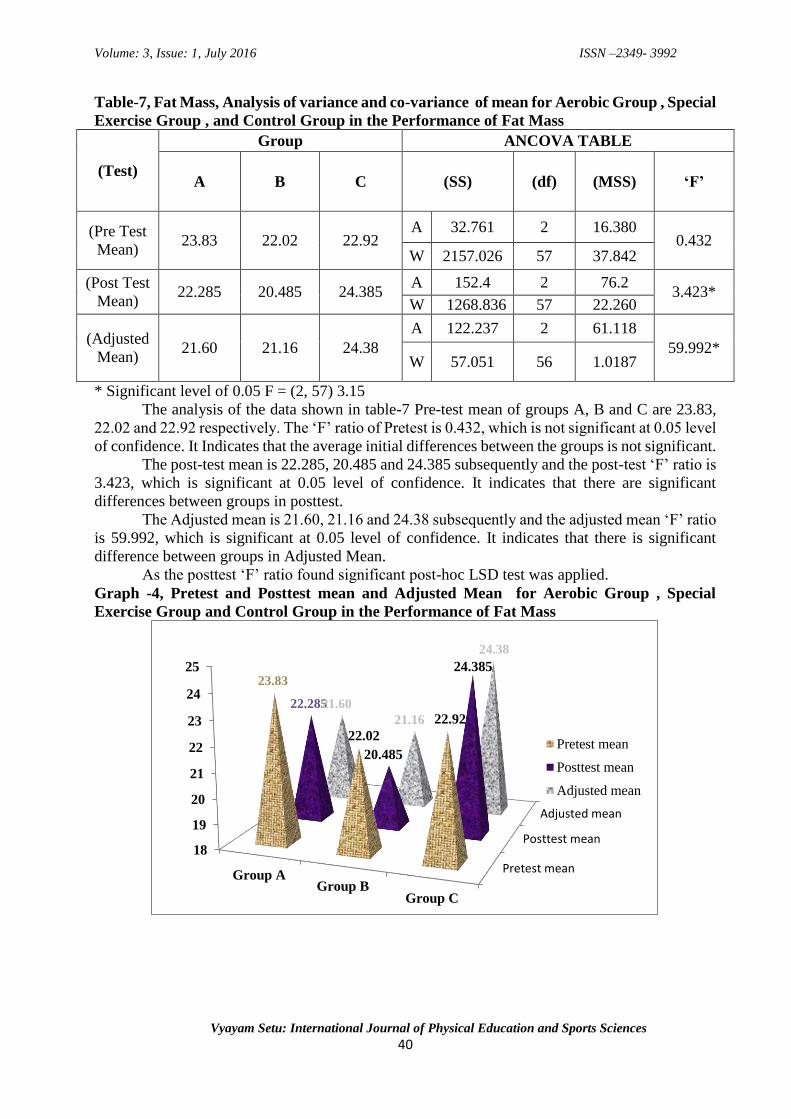
Volume: 3, Issue: 1, July 2016 ISSN –2349- 3992
Vyayam Setu: International Journal of Physical Education and Sports Sciences 40
Table-7, Fat Mass, Analysis of variance and co-variance of mean for Aerobic Group , Special
Exercise Group , and Control Group in the Performance of Fat Mass
(Test)
Group ANCOVA TABLE
A B C (SS) (df) (MSS) ‘F’
(Pre Test
Mean) 23.83 22.02 22.92
A 32.761 2 16.380 0.432
W 2157.026 57 37.842
(Post Test
Mean) 22.285 20.485 24.385
A 152.4 2 76.2 3.423*
W 1268.836 57 22.260
(Adjusted
Mean) 21.60 21.16 24.38
A 122.237 2 61.118
59.992* W 57.051 56 1.0187
* Significant level of 0.05 F = (2, 57) 3.15
The analysis of the data shown in table-7 Pre-test mean of groups A, B and C are 23.83,
22.02 and 22.92 respectively. The ‘F’ ratio of Pretest is 0.432, which is not significant at 0.05 level
of confidence. It Indicates that the average initial differences between the groups is not significant.
The post-test mean is 22.285, 20.485 and 24.385 subsequently and the post-test ‘F’ ratio is
3.423, which is significant at 0.05 level of confidence. It indicates that there are significant
differences between groups in posttest.
The Adjusted mean is 21.60, 21.16 and 24.38 subsequently and the adjusted mean ‘F’ ratio
is 59.992, which is significant at 0.05 level of confidence. It indicates that there is significant
difference between groups in Adjusted Mean.
As the posttest ‘F’ ratio found significant post-hoc LSD test was applied.
Graph -4, Pretest and Posttest mean and Adjusted Mean for Aerobic Group , Special
Exercise Group and Control Group in the Performance of Fat Mass
Pretest mean
Posttest mean
Adjusted mean
18
19
20
21
22
23
24
25
Group AGroup B
Group C
23.83
22.02
22.9222.285
20.485
24.385
21.60
21.16
24.38
Pretest mean
Posttest mean
Adjusted mean

Volume: 3, Issue: 1, July 2016 ISSN –2349- 3992
Vyayam Setu: International Journal of Physical Education and Sports Sciences 41
Table -8, Mean difference and critical difference of Aerobics group, Special Exercise group,
and control group in performance of Fat Mass
(Mean) (MD) (CD)
A B C
21.605 21.162 0.443
0.638
21.605 24.387 2.782*
21.162 24.387 3.225*
Necessary value at 0.05 level (C.D.) = 0.638.
It is shown from table-8 that there is significant difference between A-C and B-C, where
as there is no significant difference between group A-B.
Here shown that the difference between group A-C and B-C is 2.782 and 3.225. Which is
more than critical difference 0.638. Here group B prove more significant than group A.
Table-9, Total Body water, Analysis of variance and co-variance of mean for Aerobic Group,
Special Exercise Group and Control Group in the Performance of Total Body water
(Test)
Group ANCOVA TABLE
A B C (SS) (df) (MSS) ‘F’
(Pre Test
Mean) 31.78 31.15 31.93
A 6.852 2 3.426 0.409
W 477.084 57 8.369
(Post Test
Mean) 31.815 29.845 31.98
A 56.442 2 28.221
3.853*
W 417.447 57 7.323
(Adjusted
Mean) 31.68 30.21 31.73
A 29.245 2 14.622
7.142* W 114.642 56 2.047
* Significant level of 0.05 F = (2, 57) 3.15
The analysis of the data shown in table-9 Pre-test mean of groups A, B and C are 31.78,
31.15 and 31.93 respectively. The ‘F’ ratio of Pretest is 0.409, which is not significant at 0.05 level
of confidence. It Indicates that the average initial differences between the groups is not significant.
The post-test mean is 31.815, 29.845 and 31.98 subsequently and the post-test ‘F’ ratio is
3.853, which is significant at 0.05 level of confidence. It indicates that there are significant
difference between groups in posttest.
The Adjusted mean is 31.68, 30.21 and 31.73 subsequently and the adjusted mean ‘F’ ratio
is 7.142, which is significant at 0.05 level of confidence. It indicates that there are significant
differences between groups in Adjusted Mean.
As the posttest ‘F’ ratio found significant post-hoc LSD test was applied.

Volume: 3, Issue: 1, July 2016 ISSN –2349- 3992
Vyayam Setu: International Journal of Physical Education and Sports Sciences 42
Graph -5, Pretest and Posttest mean and Adjusted Mean for Aerobic Group, Special
Exercise Group and Control Group in the Performance of Total Body Water
Table -10, Mean difference and critical difference of Aerobics group, Special Exercise group
and control group in performance of Total Body water
(Mean) (MD) (CD)
A B C
31.687 30.219 1.468*
0.904
31.687 31.733 0.045
30.219 31.733 1.513*
Necessary value at 0.05 level (C.D.) = 0.904.
It is shown from table-2 that there is significant difference between A-B and B-C, where
as there is no significant difference between group A-C.
Here shown that the difference between group A-B and B-C is 1.468 and 1.513. Which is
more than critical difference 0.904. Here group B prove more significant than group A.
CONCLUSION
From this study it shows that in body composition like weight, B M I , B.M.R, Fat Mass,
Total body water group of Aerobics and Special exercise was significant.
In control group there was not significantly in body composition.
REFERENCE
1) Illinois American College of Sports Medicine (1992) Fitness Book Leisure Press
champaign p 1-8 2) Webster, Brenda L. and Barr, Susain I. (1993), Illinois “Body Composition Analysis of
Female Adolescent Athletes” Medicine and Science in Sports and Exercise 25: p 648-652.
3) Splitler, D.L. et al. (1987), “Body Composition and Physiological Characteristics of Law
Enforcement Officers” British Journal if Sports Medicine 21 (1987): p 154.
Pretest mean
Posttest mean
Adjusted mean
28.5
29
29.5
30
30.5
31
31.5
32
Group AGroup B
Group C
31.78
31.15
31.93
31.815
29.845
31.98031.68
30.21
31.73
Pretest mean
Posttest mean
Adjusted mean

Volume: 3, Issue: 1, July 2016 ISSN –2349- 3992
Vyayam Setu: International Journal of Physical Education and Sports Sciences 43
4) Ross, James G. et al. (1987); “Changes in the Body Composition of Children” JOEPERD
p 74 – 77.
5) Parr, Richard B., Saltareu William and Harnak James, (1995) “Comparison of Percent
Body Fat to BMI and Waist to Hip Ratio with in Various Categories of Obesity” Research
Quarterly for Exercise and Sports 66 a-26.
6) Fleck, Steven J. (1983) “Body Composition of Elite American Athletes” American Journal
of Sports Medicine 11: p 398.
7) Lohman, T.G. (1987), “The Use of Skin Fold Estimate Body Fatness on Children and
Youth” JOPERD: p 98-102.
8) Cooper, Kenneth H., (1977) The aerobics way New York; Bantam books
9) Diagram Group (1979) The complete Book of Exercise London, Diagram Group
10) Sinning, Wayne E and Wilson, Judy R. (1984) “Validity of Generalized Equations for
Body Composition Analysis in women Athletes” Research Quarterly for Exercise and
Sports 55: p 153-160.

Volume: 3, Issue: 1, July 2016 ISSN –2349- 3992
Vyayam Setu: International Journal of Physical Education and Sports Sciences 44
EFFECT OF DIFFERENT DRILLS AND EXERCISE ON MOTOR
COMPONENT OF TABLE TENNIS PLAYERS
Mohammed Hasam Dhupli Dr. N. K. Datta
Research Scholar Head,
Swarnim Gujarat Sports University S.V. National Institute of Technology,
Sector 15, Gandhinagar, Gujarat 382016 Surat, Gujarat 395007
ABSTRACT
Objective: The aim of the study was to compare the Effect of Different Drills and Exercise on Motor
Component of Table Tennis Players.
Methodology: The investigator had selected fifteen male students of age between 8 to 12 years from
the Euro Star Table Tennis Academy of Surat Gujarat. A series of different drills and exercises was
employed to the players for 4-weeks and their effect was studied for the efficiency enhancement. The
tests items were selected 30 meter Run, Standing broad jump, Sit & Reach Test, 50 meter Run to
measure acceleration speed, explosive strength of leg muscles, flexibility and locomotor speed
respectively. t-test was used to analyse the data. Results: The results of the study revealed that there
is significant change in the pre-test and post-test means of 30 meter sprint test and sit & Reach Test
whereas there is insignificant change in the pre-test and post-test means of 50 meter sprint test and
standing broad jump test. Conclusion: It is concluded that there is significant improvement in
acceleration speed and flexibility with the particular training program.
KEYWORDS: speed, acceleration, flexibility, explosive strength, table tennis
INTRODUCTION
Sports training is an educational process. It aims at improving the sports performance as
well as education of the sportsman. It is not easy to define education. In simple words it is the
process of development of personality to its maximum potential. In a narrow sense education is
acquisition of knowledge and development of abilities and skills. But in a wider sense education
includes all aspects and elements of personality. When most adults think about exercise, they
imagine working out in the gym on a treadmill or lifting weights. But for kids, exercise means
playing and being physically active. Kids exercise when they have P.T. Class at school, during
recess, at dance class or soccer practice, while riding bikes, or when playing games in street. So
how do you get kids motivated to be active, especially those who aren't natural athletes? It will be
done by Scientific and Systematic child fitness training by different drills, exercises and games.
Kids can be fit even if they're not winning sports trophies. The key is finding activities they enjoy.
The options are many - from table tennis and basketball to tennis and swimming etc. When kids
find an activity that's fun, they'll do it a lot, get better at it, feel accomplished, and want to do it
even more. Likewise, if they're pushed into activities they don't like, they're unlikely to want to
participate and will end up frustrated and will feel like exercising is a chore. High sports
performances are possible after a regular and systematic training of about 8-10 years. As the age
of high performance in most of the sports begins at about 18 years, therefore, systematic sports
training must begin at 10 years or even earlier. This has brought into sharp focus on the science of
growth and development as the training of children has to be based on the principles of growth
and development, especially motor development the study of growth and development is an inter-
disciplinary study as different aspects are studied by different sciences. The study of motor
development is the responsibility of training science and physical education. As the factors studied
by motor development are the direct aim of sports training, therefore the training of children and
youth has to be based on the principles of motor development with due consideration to the other

Volume: 3, Issue: 1, July 2016 ISSN –2349- 3992
Vyayam Setu: International Journal of Physical Education and Sports Sciences 45
aspects of growth and development. The motor development of a child and youth are most
important aspect of sports training. The phases of growth and development of children and youth
are divided as first three years of life, early childhood, middle childhood, late childhood,
pubescence, adolescence and adulthood.
Middle childhood phase is from 7-10 years of age. This phase is characterized by rapid
motor, mental and social development. The development of strength, especially maximum
strength, takes place at a slow pace. The development is faster if child is physically active. The
strength of lower extremities is better than that of arms. The speed abilities develop at a very fast
pace in middle childhood. Reaction ability improves at a rapid pace. Similar pace of development
is observed in case of movement frequency. Children need to learn fundamental movement skills
before they learn fundamental sport skills. If they are introduced to sport skills before movement
skills, they often struggle to learn the sport skills. Sometimes they get discouraged and quit.
Fundamental movement skills are basic movements such as, running, jumping, hopping, throwing,
kicking and catching. Fundamental sport skills are these movement skills applied to a sport
situation: for example, kicking a soccer ball, running a sprint, jumping up for a basketball rebound,
catching a baseball. Children will struggle if they are forced to learn fundamental sport skills
before they have learned fundamental movement skills. Children may also feel inadequate and
discouraged if they see their friends and classmates mastering the same sport skills faster than
them (because they have already developed fundamental movement skills).
Important Movements in Sports are Sprint, Lateral Movement, Hopping, Cross Over,
Reaction, Acceleration, Catching, Kicking, Stopping, Shuffle, Back Pedal, Change of Direction,
Skipping, Jumping and Landing mechanics, Multi Directional Movements, Jump with Turn
(180,360) Deceleration etc.
METHODOLOGY Subjects: For the purpose of this study fifteen (15) male table tennis players were selected. All
the subjects were selected from “Rander Islam Gymkhana during Summer Fitness Camp of Euro
Star Table Tennis Academy Surat” at same point of time. The age of the subjects was ranged
between 8 to 12 years. The subjects were evaluated for their motor component.
Tools: Different Drills and exercises training were given to children are Ladder Drills, Agility
Hurdle Drills, Marker Drills, Stretching exercise, Corn Drills, Line Drills, Dots Drills, Quickness
and Acceleration Drills, Sprinting Technique, Speed Drills with Change in Direction, Recreational
Games with above drills and exercise. Before training was given a test will be taken to note initial
ability of the group. After completion of training period for 4-weeks, the post-test was conducted
to measure the effects of the training on development of motor component of the players.
The criterion measures, acceleration speed, explosive strength of leg muscles, flexibility
and locomotor speed were respectively measured by 30 meter Run, Standing broad jump, Sit &
Reach Test, 50 meter Run to measure. The exercise was taken up on the Rander Islam Gymkhana
ground with proper equipment. The exercises were made systematically with proper rectification
and supervision.
ANALYSIS OF DATA AND RESULTS OF THE STUDY
The obtained data were statistically computed and Mean, S.D. and t-ratio was calculated
to find out significant difference between pre-test and post-test on the motor components i.e.,
acceleration speed, acceleration locomotors, Flexibility and explosive strength. The results are
depicted with the help of table1-4.
Table – 1, Comparisons of pre-test and post-test for 30 Meter Sprint (Second)
Test N Mean S.D t- value
Pre- test 15 7.18 0.32 2.579
Post-test 15 7.07 0.45
*Significant at 0.05 level, Tabulated t-value required to be significant at (14) = 2.145

Volume: 3, Issue: 1, July 2016 ISSN –2349- 3992
Vyayam Setu: International Journal of Physical Education and Sports Sciences 46
It is thus, evident from the Table-1 that, the calculated t-value (2.579 ) is more than the
tabulated t-value (2.145), which means that, there is significant difference between the mean scores
of pre-test and post-test in relation to 30 meter sprint.
Further, the difference in mean and Standard Deviation of pre-test and post-test has been
illustrated with the help of figure-1.
Figure-1, Graphical Representation of Mean and S.D. Score of 30 Meter Sprint (Second)
Further, the data collected were analyzed to find out the significant difference between the
pre-test and post-test in relation to Sit & Reach Test (centimeter) and the results pertaining to
this are presented with the help of table-2.
TABLE 2, Comparisons of pre-test and post-test for Sit & Reach Test (centimeter)
Test N Mean S.D t- value
Pre-test 15 5.60 3.12 2.347
Post-test 15 6.40 8.18
*Significant at 0.05 level, Tabulated t-value required to be significant at (14) = 2.145
It is evident from Table-2 that, the calculated t-value (2.347) is more than the tabulated t-
value (2.145) which means that there is significant difference between the mean scores of pre-test
and post-test in relation to Sit & Reach Test.
Further, the difference in mean and Standard Deviation of two groups has been illustrated
with the help of figure-2.
0
1
2
3
4
5
6
7
8
9
pre-test post-test
mean
s.d.

Volume: 3, Issue: 1, July 2016 ISSN –2349- 3992
Vyayam Setu: International Journal of Physical Education and Sports Sciences 47
Figure – 2, Graphical Representation of Mean and S.D. Score of Sit & Reach Test
(Centimeter)
Further, the data collected were analyses to find out the significant difference between the
pre-test and post-test in relation to50 Meter Sprint (Second) and the results pertaining to this are
presented with the help of table-3.
TABLE 3, Comparisons of pre-test and post-test for 50 Meter Sprint (Second)
Test N Mean S.D t- value
Pre-test 15 10.96 0.13 1.172
Post-test 15 10.38 0.23
*Significant at 0.05 level, Tabulated t-value required to be significant at (14) = 2.145
It is evident from Table-3 that the calculated t-value (1.172) is less than the tabulated t-
value (2.145) which means that there is no significant difference between the mean scores of pre-
test and post-test in relation to 50 Meter Sprint.
Further, the difference in mean and Standard Deviation of two groups has been illustrated
with the help of figure-3.
Figure-3, Graphical Representation of Mean and S.D. Score of 50 Meter Sprint
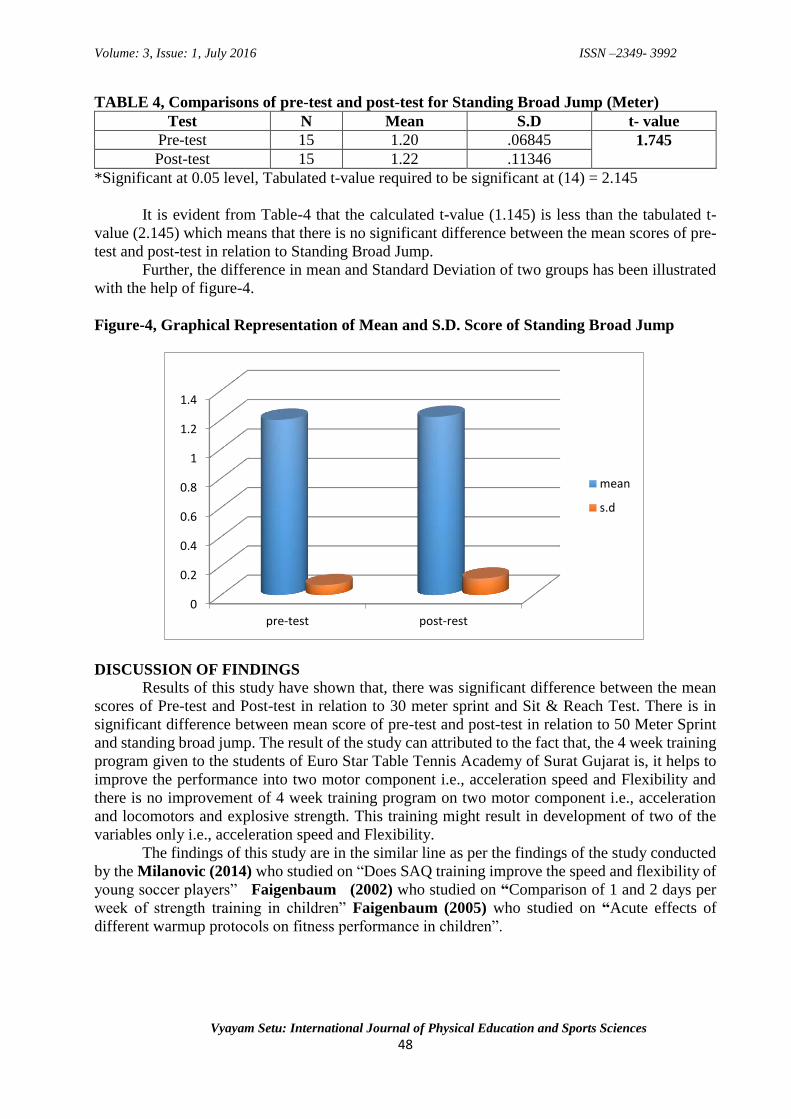
Volume: 3, Issue: 1, July 2016 ISSN –2349- 3992
Vyayam Setu: International Journal of Physical Education and Sports Sciences 48
TABLE 4, Comparisons of pre-test and post-test for Standing Broad Jump (Meter)
Test N Mean S.D t- value
Pre-test 15 1.20 .06845 1.745
Post-test 15 1.22 .11346
*Significant at 0.05 level, Tabulated t-value required to be significant at (14) = 2.145
It is evident from Table-4 that the calculated t-value (1.145) is less than the tabulated t-
value (2.145) which means that there is no significant difference between the mean scores of pre-
test and post-test in relation to Standing Broad Jump.
Further, the difference in mean and Standard Deviation of two groups has been illustrated
with the help of figure-4.
Figure-4, Graphical Representation of Mean and S.D. Score of Standing Broad Jump
DISCUSSION OF FINDINGS
Results of this study have shown that, there was significant difference between the mean
scores of Pre-test and Post-test in relation to 30 meter sprint and Sit & Reach Test. There is in
significant difference between mean score of pre-test and post-test in relation to 50 Meter Sprint
and standing broad jump. The result of the study can attributed to the fact that, the 4 week training
program given to the students of Euro Star Table Tennis Academy of Surat Gujarat is, it helps to
improve the performance into two motor component i.e., acceleration speed and Flexibility and
there is no improvement of 4 week training program on two motor component i.e., acceleration
and locomotors and explosive strength. This training might result in development of two of the
variables only i.e., acceleration speed and Flexibility.
The findings of this study are in the similar line as per the findings of the study conducted
by the Milanovic (2014) who studied on “Does SAQ training improve the speed and flexibility of
young soccer players” Faigenbaum (2002) who studied on “Comparison of 1 and 2 days per
week of strength training in children” Faigenbaum (2005) who studied on “Acute effects of
different warmup protocols on fitness performance in children”.
0
0.2
0.4
0.6
0.8
1
1.2
1.4
pre-test post-rest
mean
s.d

Volume: 3, Issue: 1, July 2016 ISSN –2349- 3992
Vyayam Setu: International Journal of Physical Education and Sports Sciences 49
CONCLUSION
The following conclusions of the study are as follows:
1. There is a significant difference between the mean scores of Pre-test and Post-test in
relation to 30 meter sprint.
2. There is a significant difference between the mean scores of Pre-test and Post-test in
relation to Sit & Reach Test.
3. There is an insignificant difference between mean score of pre-test and post-test in relation
to 50 Meter Sprint.
4. There is an insignificant difference between mean score of pre-test and post-test in relation
to standing broad jump.
The collected data were analyzed and the result was summarized with the help of facts also
supported by other studies has revealed that there is a significant difference between the mean
scores of Pre-test and Post-test in relation to 30 meter sprint and Sit & Reach Test and there is an
insignificant difference between mean score of pre-test and post-test in relation to 50 Meter Sprint
and standing broad jump. Which means that there is significant improvement in acceleration speed
and Flexibility by the training.
REFERENCE:
1. Kansal Devender K., (1996) Test and Measurement in Sports & Physical Education, New
Delhi; DVS Publications,
2. Kansal Devender K., (2008) Textbook of Applied Measurement Evaluation & Sports
Selection New Delhi: SSS Publications,
3. Singh Ajmer, (2012) Essentials of Physical Education New Delhi; Kalyani Publishers,
4. Singh, Hardayal (1991), Science of sports training, Delhi: D.V.S. Publications.
5. Verma J.P. (2009), A Text Book on Sports Statistics New Delhi, Sports Publication

Volume: 3, Issue: 1, July 2016 ISSN –2349- 3992
Vyayam Setu: International Journal of Physical Education and Sports Sciences 50
COMPARATIVE STUDY OF AGGRESSION BETWEEN CRICKET AND
KABADDI MALE PLAYERS
Honey Bhatia, Dr. Vivek B. Sathe
Research Scholar, Assistant Professor
School of Physical Education School of Physical Education
Devi Ahilayabai Vishwa Vidyalaya, Devi Ahilayabai Vishwa Vidyalaya,
Indore (M.P.), India Pin- 452 001. Indore (M.P.), India Pin- 452 001.
ABSTRACT
The purpose of the study was to compare the degree of aggression between cricketers and
kabbadi players of Apollo International School. Thirty male Kabaddi (N=30) and thirty male
cricket (N=30) players chosen from the sports specialization groups of Apollo International
School, Delhi-NCR which were participated in inter-school district competition organized by
District sports department, Sonepat in September, 2013. Samples were selected randomly for the
purpose of this study. The age of the sample were ranging 14 to 18 years. The tool chosen to test
the hypothesis was the scores obtained in Sports Aggression Inventory by Anand Kumar and Prem
Sankar Shukla. For the purpose of the analysis of data‘t’ test was employed to compare the degree
of aggression between cricketers and kabbadi player. The result of the study shows that the
significant difference between the mean scores of the cricket player and the kabaddi players on the
scores of aggression since the obtained value of ‘t’ (3.82) was less then tabulated - t value (2.01)
at 0.05 (58) level of significance.
Key words: Aggression, Behaviour, Cricket, Kabaddi.
INTRODUCTION
Aggression is one of the psychological term refers to a range of behaviors that can result
in both physical and psychological harm to oneself, other or objects in the environment. The
expression of aggression can occur in a number of ways, including verbally, mentally and
physically.
Kabaddi is a 4,000 year old team sport originated in India and played by many South Asian
nations. It is a team sport, which requires both skill and power, and combines the characteristics
of wrestling and rugby. Kabaddi is popular not only in India but it is a National Game of
Bangladesh as well. Most of the Indian states do play this game, but it is far more popular in the
villages of Punjab, Tamil Nadu, Andhra Pradesh, Uttar Pradesh, Bihar, Maharashtra, Madhya
Pradesh and Gujarat.
Cricket is one of the oldest games in the world and it continues to thrive today. The game
is said to have originated in the 16th century with international matches being played since 1844.
Today, Cricket is still a major sport that still attracts players, spectators and even media interest as
well. From its very simple form, cricket has emerged in highly organized activity of Indian society
and it has become a complex social and cultural phenomenon.
In sport, aggression is a characteristic that can have many negative as well as positive
effects on performance. Aggression is defined as “any form of behaviour directed toward the goal
of harming of injuring another lived being who is motivated to avoid such treatment” (Baron &
Richardson, 1994). In sport, aggression has been defined into two categories: hostile aggression
and instrumental aggression (Silva, 1983). Hostile aggression is when the main aim is to cause
harm or injury to your opponent. Instrumental aggression is when the main aim is to be non-
aggressive but to win the ball.
In a player’s career they will come across a number of high-pressured situations where they
will have to deal with many stressors. These can range from personal stressors such as worry and
anxiety, to situational stressors such as team-related problems.

Volume: 3, Issue: 1, July 2016 ISSN –2349- 3992
Vyayam Setu: International Journal of Physical Education and Sports Sciences 51
OBJECTIVES OF THE STUDY
(i) To characterize the level of aggression among cricket and kabaddi players.
(ii) To compare the aggression between cricket and kabaddi players.
METHODOLOGY
Thirty male Kabaddi (N=30) and thirty male cricket (N=30) players chosen from the sports
specialization groups of Apollo International School, Delhi-NCR which were participated in inter-
school district competition organized by District sports department, Sonepat in September, 2013.
Subjects were selected randomly for the purpose of this study. The age of the subject were ranging
14 to 18 years. The tool chosen to test the hypothesis was the scores obtained in Sports Aggression
Inventory by Anand Kumar and Prem Sankar Shukla. Sports Aggression Inventory consists of 25
items in which 13 items are keyed “YES” and 12 are keyed “NO”. The statements which are keyed
“YES” are 1,4,5,6,9,12,14,16,18,21,22,24 and 25 and the statement which are keyed “NO” are
2,3,7,8,10,11,13,17,19,20 and 23.
ANALYSIS AND RESULT
For analyzing the data collected from this study the descriptive statistics (i.e. Mean and
Standard Deviation) and t - ratio was employed to compare the degree of aggression between male
cricket and kabaddi players.
Table – 1, Significant Difference of Mean between Cricket and Kabaddi Players In Relation
To Aggression
Variable Group Mean Standard
Deviation
Mean
Difference t - ratio
Aggression Kabaddi 15.89 5.86
5.38 3.82*
Cricket 10.51 4.73
*Significance at 0.05 level of confidence, T 0.05 (58) = 2.00
Table – 1 reveals that significant difference was found between cricket and kabaddi players
in relation to aggression because calculated - t value = 3.82 is less than tabulated - t value (2.00)
at 0.05 level of significance.
Figure 1, Comparison of Mean Scores between Male Cricket and Kabaddi Players
0
5
10
15
20
Cricket Kabaddi
Mean
Mean

Volume: 3, Issue: 1, July 2016 ISSN –2349- 3992
Vyayam Setu: International Journal of Physical Education and Sports Sciences 52
CONCLUSION
1. There was significant difference found between the mean scores of cricket and kabaddi
players in relation to aggression. The aggression level of kabaddi players is higher than the
cricket players, which may be due to the nature of their body contact game and the
characteristics of wrestling and rugby.
2. There was significant difference found between the mean scores of cricket and kabaddi
players in relation to aggression because cricket players use equipments i.e. Bat, ball,
stumps, gloves, pad, etc during competitive situation whereas in kabaddi the player never
use any kind of equipment.
3. There was significant difference found between the mean scores of cricket and kabaddi
players in relation to aggression because in kabaddi the players show real aggression in
game situation whereas cricket players show false aggression.
REFERENCES
1. http://www.psychology.about.com/od/aindex/g/aggression.htm
2. http://www.zingari-net.net
3. http://www.defenceforumindia.com/forum/sports/23631-introduction-kabaddi.html
4. http:// www.thesportinmind.com/articles/aggression-in-sport

Volume: 3, Issue: 1, July 2016 ISSN –2349- 3992
Vyayam Setu: International Journal of Physical Education and Sports Sciences 53
EFFECT OF VISUALIZATION AND IMAGERY TRAINING ON SPORTS
PERFORMANCE USING SPORTS HYPNOSIS
Imran I. Kagzi, M. Phil., M.P.E., Certified Hypnotist,
Head of the Department, Physical Education,
D. R. Patel and R. B. Patel Commerce College,
Bharthana (Vesu), Surat, Gujarat 395017
ABSTRACT
This value of imagery in sports is widely acknowledged. The contribution of hypnosis to
enhancing athletes’ performance is also recognized, but the value of hypnosis in enhancing
imagery has little recognition. To examine the effect of imagery technique using hypnotic state on
performance, primary data has been collected through Martens questionnaire. Experimental
research has been carried out to collect the data. The experiment has been performed on 22 cricket
team players of two colleges of Surat and Bharuch city. The data has been analyzed by applying
one sample t-test and regression analysis. From the analysis, it has been concluded that after the
experiment of imagery technique using hypnotic state, the performance of cricket team players has
been improved. It has been also found that imaging competing situation is more affective
component on performance followed by practicing with others, watching team mate and practicing
alone.
Key Words: Hypnosis, Imagery Technique, Cricket-Team Players
INTRODUCTION
Imagery involves making mental images, seeing and feeling you playing and performing a
certain behavior, without actually doing the behavior. Hypnosis and sports performance is one of
the fastest growing markets in Hypnotherapy. Sports Hypnosis is one of the easiest, most
rewarding, and goal oriented short term therapies that you can do. Mental imagery is widely
accepted by sport psychologists, coaches, and athletes to be a useful psychological technique in
the training of athletes for if imagery training is to be maximally effective, practitioners need to
establish an understanding of the athletes' ability to image. Achieve this, it is necessary to assess
imagery ability in a reliable, valid, and comprehensive manner.
Serious sport person are often determined to find anything that will give them an edge over
their competition, as well as help them perform optimally. Hypnosis and imagery have been
utilized by many such athletes to improve their game. While some regard hypnosis as some
mystical or magical form of mind control, it is actually a legitimate form of treatment which has
proven to be effective in bringing about positive change, developing new habits and behaviors,
and releasing unhealthy or unproductive emotions, habits and behaviors. Many well-known
athletes have worked with highly trained hypnotherapists to achieve significant gains in their
personal performance, regardless of their sport.
Since the unconscious mind is really the driving force between most of our beliefs and
behaviors, it makes sense that a technique which elicits change at the unconscious level can be
highly effective. Hypnosis is such a technique. Hypnosis can help a sport person overcome issues
of self-doubt which may be keeping him from moving to the next level. It can help an athlete hone
his skills, fine-tune a technique, and have a level of self-belief and confidence which will enable
him to excel beyond what he may have previously thought possible. Hypnosis can also help an
athlete acquire the intense focus required to be at the top in his sport. Hypnosis can help an athlete
overcome performance anxiety or pre-game jitters which can make the difference between winning
a gold medal and coming in 6th place.

Volume: 3, Issue: 1, July 2016 ISSN –2349- 3992
Vyayam Setu: International Journal of Physical Education and Sports Sciences 54
REVIEW OF LITERATURE
Sanna M. Nordin and Jennifer Cumming (2008) have studied on types and functions of
athletes' imagery. They have considered 155 athletes from 32 sports. They have taken materials
included a chart for rating imagery effectiveness constructed specifically for the study as well as
a modified version of the Sport Imagery Questionnaire. Their results supported the predictions for
cognitive but not motivational imagery types, and MG-M imagery was perceived to be the most
effective imagery type for motivational functions. Significant differences existed between imagery
types regarding frequency and ease of imaging. They have found that the relationship between
frequency and effectiveness was not moderated by imagery ability or perspective, and athletes who
imaged more frequently found imagery more effective and easier to do.
Junayd M. Abdin (2010) has studied on imagery for sport performance. He has not only
focused on imagery as one aspect of mental practice, but also its influence on various mental skills
(e.g., confidence, arousal, concentration). Additionally, imagery has been effectively used for
rehearsing general strategies, learning sport specific skills, and facilitating effective responses to
competitive scenarios and stressful emotions. He has concluded that recent research has indicated
that imagery can be helpful for non-athletes in exercise settings as well. He has noted earlier, as
the field continues to advance, sport psychology practitioners may be presented with numerous
opportunities to assess how imagery can help individuals in a variety of ways and settings.
John Pates and Andrew Cowen (2013) have studied on the effect of a hypnosis intervention
on performance and flow state of an elite golfer. They have assessed the experimental effect during
11 competitive golf events. They have analyzed performance and flow data using a single-subject
design combined with a procedure to monitor the golfer’s internal experience. They have found
that there were two overlapping data points between baseline and intervention for his performance
score and one overlapping data point for his flow score. They have concluded that the qualitative
data revealed hypnosis may help golfers self-regulate on the golf course during competition.
Jamie B. Barker and Marc V. Jones (2013) have examined the use of hypnosis to Enhance
Self-Efficacy in Sport Performers. By drawing on neodissociation and nonstate theories of
hypnosis, they have established a combined theoretical basis to explain how hypnosis may be used
to influence sport performers’ sources of self-efficacy information. Furthermore, they have
examined that these theoretical postulations by presenting contemporary research evidence
exploring the effects of hypnosis on sport performers’ self-efficacy. They have concluded with
future research directions and suggestions for sport psychologists considering the use of hypnosis
within their practice.
Sharon Jalene and Gabriele Wulf (2014) have examined whether motor skill learning could
be enhanced through a hypnotic intervention. Their task involved throwing a tennis ball overhand
at a target. They have assigned to either a hypnosis or control group to the Participants. Both
groups first completed a pre-test of 20 throws. Prior to the second block of 20 throws (post-test),
the hypnosis group received a 10-minute hypnotic intervention. Participants were aroused from
the hypnotic state prior to the throwing task. The control group was asked to relax in the same
environment for the same length of time. Control group participants were told that focusing on the
target had been shown to increase accuracy. On the post-test, as well as on a retention test (20
throws), conducted 5-8 days after the post-test. They have observed that the hypnosis group
showed an increase in throwing accuracy relative to the pre-test and more effective performance
than the control group whose performance was similar to that on the pre-test. They have found that
hypnosis can have a positive impact on motor learning.
STATEMENT OF THE PROBLEM
Psychologists, coaches, and athletes typically accept that mental imagery is valuable
psychological technique in the training of athletes for excellence (Hall, Janssen & Sheikh, 1994).
If imagery training is to be maximally effective, practitioners need to establish an understanding

Volume: 3, Issue: 1, July 2016 ISSN –2349- 3992
Vyayam Setu: International Journal of Physical Education and Sports Sciences 55
of athletes' ability to image. To achieve this, it is necessary to assess imagery ability in a reliable,
valid, and comprehensive. Keeping this viewpoint, the problem statement has been framed as “is
Imagery technique using hypnotic state effects on performance?”
SIGNIFICANCE OF THE STUDY
This study will be beneficial for the coaches and trainers to choose the correct state of mind
using imagery techniques. This study will also create interest amongst sportsman and trainers to
experience the unique state of mind consciousness.
OBJECTIVES OF THE STUDY
1. To study the effect of Imagery technique using hypnotic state on performance.
2. To find most effective factor of imagery technique on performance.
HYPOTHESIS OF THE STUDY
H0: Imagery technique using hypnotic state does not affect performance.
H1: Imagery technique using hypnotic state affects performance
METHODOLOGY
The study is experimental based. The primary data has been collected through the Martens
sports imagery questionnaire. The Marten’s questionnaire consist the component namely
practicing alone, practicing with others, watching a team mate and Competing. The data has been
collected on five point likert scale starting from 1- No image present, 2- Not clear or Vivid, but
the recognizable image, 3-moderately clear or Vivid, 4-Clear and Vivid, 5- extremely clear and
Vivid. 11 cricket team players of D.R.B. Commerce College, Surat & 11 cricket team players of
S.V.M.I.T. Bharuch were considered as sample to commence the study. After the experiment of
imagery technique using hypnotic state, those opinions have been taken. The data has been
collected during first week of February, 2016. The data has been analyzed by applying one sample
t-test with 3 cut-off point and regression analysis.
SCOPE OF THE STUDY
1. The present study is limited to only cricket team players.
2. It is limited to Surat and Bharuch city only.
3. It covers only college cricket team players.
DATA ANALYSIS AND INTERPRETATION
The data has been analyzed by applying one sample t-test and regression analysis. T-test
has been used to find out the overall performance of cricket team players after imagery technique
using hypnotic state. Regression analysis has been applied to find out the effect of selected
variables on performance
ONE SAMPLE T-TEST
To analyze the overall performance, t-test has been applied. The t- test has been run with a
cut-off point of three (3). The hypothesis has been constructed as follows.
H0: Imagery technique using hypnotic state does not affect performance.
H1: Imagery technique using hypnotic state affects performance.

Volume: 3, Issue: 1, July 2016 ISSN –2349- 3992
Vyayam Setu: International Journal of Physical Education and Sports Sciences 56
Table No. 1
One-Sample Test
Test Value = 3
t N df
Sig.
(2-tailed)
Mean
Difference Mean
Null
Hypothesis
Performance 4.605 100 99 .000 .42 3.42 Rejected
From the table no. 5.29, it has been found that p value is less than 0.05 hence, the null
hypothesis is rejected and alternate hypothesis is accepted. Therefore, it can be concluded with
95% confidence that Imagery technique using hypnotic state affects performance. The mean of
performance is greater than three. This indicates that students performance really improve.
REGRESSION ANALYSIS
Performance as a dependent variable and practicing alone, practicing with others, watching
a team mate, competing as independent variables
y = α + β1 × x1 + β2 × x2 + β3 × x3 + β4 × x4 + e
Where, y= the dependent variable Performance, α is the y intercept which means the value
of y when all the x values are zero, x1= practicing alone, x2= practicing with others, x3= watching a
team mate, x4= competing, β= the coefficient of the independent variable, e= error
Performance = 0.022 + 0.052PA + 0.265PO + 0.142WTM + 0.523C + 0.335
EXPLORATORY POWER OF MODEL SUMMARY
H0: R2=0
H1: R2>0
Table No. 2 Exploratory Power of Model Summary
Model Summary
Model R R Square Adjusted R Square Std. Error of the Estimate
1 .928a .861 .861 .335
a. Predictors: (Constant), Practicing alone, Practicing with others, Watching a team mate, Competing
b. Dependent Variable: Performance
The value of the multi co-relation coefficients between independent variables and
dependent variable is 0.928. The value of R2 (0.861) shows that 86% variance in performance
comes due to these factors. In another words, it can be said that 14% variance in performance
comes due to other factors. The value of adjusted R2 (0.861) remains same which indicates that if
the model will be derived from the population instead of the sample, it may be possible that no
variation will be accorded.
ANOVA FOR F VALUE
H0: Independent variables (practicing alone, practicing with others, watching a team
mate, competing) collectively do not affect Performance
H1: Independent variables (practicing alone, practicing with others, watching a team
mate, competing) collectively affect Performance Table No. 3 Anova for F Value
Anovab
Model Sum of
Squares df Mean Square F Sig.
Null
Hypothesis
1
Regression 987.136 4 246.784 2.197E3 .000a
Rejected Residual 158.937 1415 .112
Total 1146.073 1419
a. Predictors: (Constant), Practicing alone, Practicing with others, Watching a team mate,
Competing
b. Dependent Variable: Performance

Volume: 3, Issue: 1, July 2016 ISSN –2349- 3992
Vyayam Setu: International Journal of Physical Education and Sports Sciences 57
Anova F- value is 2.261E3 which is significant (p≤0.05) means this model is fit for
regression. More over null hypothesis is rejected which implies that independent variables affect
performance. To know the level of affect of these independent variables, results of t-test has been
taken into consideration which shows in Table no.5.79
ESTIMATED BETA COEFFICIENTS
H0: β1=0, β2=0, β3=0, β4=0
H1: β1≠0, β2≠0, β3≠0, β4≠0
Table No. 4 Estimated Beta Coefficients
Coefficientsa
Model
Unstandardized
Coefficients
Standardized
Coefficients t Sig.
Null
Hypothesis Rank
B Std.
Error Beta
1
(Constant) .022 .043 0.508 .612
Practicing alone .053 .027 .052 01.99 .047 Rejected 4
Practicing with others .269 .023 .265 11.85 .000 Rejected 2
Watching a team mate .147 .019 .142 07.66 .000 Rejected 3
Competing .533 .024 .523 22.05 .000 Rejected 1
a. Dependent Variable: Performance
From table no.5.79, it has been found that practicing alone, practicing with others, watching
a team mate and competing all are significant. This implies that the null hypothesis for all
independent variables is rejected as p-value is less than 0.05. The standardized coefficients for the
independent Competing has the highest β4 (0.523) and so it has been concluded that it has the
strongest influence on the performance followed by Practicing with others (β2=0.265), Watching a
team mate (β3=0.142) and Practicing alone (β1=0.052)
CONCLUSION
It has been concluded that imagery technique using hypnosis induction affects the
performance. It has been found that the performance of cricket team players has been positively
improved. From the regression analysis, it has been found that imaging competing situation is
more affective component on performance followed by practicing with others, watching team mate
and practicing alone.
REFERENCES
1. Am J Clin Hypn (2000). Hypnosis substantially enhances imagery intensity and
effectiveness, https://columbiahypnosis.com, 43(2):p 1-49-57.
2. Am J Clin Hypn. (2000). Enhancing imagery through hypnosis: a performance aid for
athletes. https://www.ncbi.nlm.nih.gov, 43(2):149-57.
3. Barker, J. B., Jones, M. V., and Greenlees, I. (2005). Collegiate athletes’ perceptions and
attitudes towards hypnosis, Journal of Sports Sciences, 23, 1238-1239.
4. Collins, D., Doherty, M., & Talbot, S. (1993). Performance enhancement in motocross: A
case study of the sport science team in action. Sports Psychologist, 7(3), 290-297.
5. Hull, C. R., & Render, G. F. (1984). The effect of relaxation, fantasy journeys and free
imagery on control and vividness of imagery. Journal of Mental Imagery, 8: 61
6. Barker, Jamie B. and Jones, Marc V. (2013).Using Hypnosis to Enhance Self-Efficacy in
Sport Performers, Journal of Clinical Sport Psychology,7: 228-247.

Volume: 3, Issue: 1, July 2016 ISSN –2349- 3992
Vyayam Setu: International Journal of Physical Education and Sports Sciences 58
7. Pates John and Cowen Andrew (2013). The Effect of a Hypnosis Intervention on
Performance and Flow State of an Elite Golfer: A Single Subject Design, International
Journal of Golf Science, 43-53.
8. Pates John, Oliver Rachael and Maynard Ian (2010), The Effects of Hypnosis on Flow
States and Golf-Putting Performance, Journal of Applied Sport Psychology, (4):341-354.
9. Abdin, Junayd M. (2010). Imagery For Sport Performance: A Comprehensive Literature
Review, A research paper, The Graduate School In Partial Fulfilment Of The Requirements
for The Degree Master of Arts.
10. McMaster, N. (1993). Behaviour modification with hypnotic visualisation, the mental side
of golf: A case history, Australian Journal of Clinical Hypnotherapy and Hypnosis, 14(1),-
17-22.
11. Pates, J., Maynard, I., and Westbury, T. (2001). An investigation into the effects of
hypnosis on basketball performance, Journal of Applied Sport Psychology 13(1): 84-102.
12. Pates. J, and Westbury, T. (2000). The effects of hypnosis on free-throw performance,
Journal of Sport Sciences, 18: 56
13. Nordin, Sanna M., and Cumming Jennifer (2008). Types And Functions of Athletes'
Imagery: Testing Predictions from the Applied Model of Imagery Use by Examining
Effectiveness, Imagery Types, Functions, and Effectiveness, West Virginia University,
United States p 189-207.
14. Jalene, Sharon and Wulf, Gabriele (2014). Brief Hypnotic Intervention Increases Throwing
Accuracy, International Journal of Sports Science & Coaching, 9(1):199-205.
15. Taylor, J., Horevitz, R., and Balague, G. (1993). The use of hypnosis in applied sport
psychology, Sport Psychologist, 7(1):58-78.

Volume: 3, Issue: 1, July 2016 ISSN –2349- 3992
Vyayam Setu: International Journal of Physical Education and Sports Sciences 59
COMPARATIVE ANALYSIS OF SELECTED PSYCHOLOGICAL AND
SOCIO ECONOMICAL VARIABLES AMONG VARIOUS ZONES OF
ALL INDIA INTER UNIVERSITY
ABSTRACT
The purpose of the study was to find out the comparative analysis of selected psychological
and Socio Economical Variables among various zones of All India Inter University. For this study
Socio Economic Factors has been chosen as dependent variable and 100 Power lifters, 100
Weightlifters and 100 Bodybuilders come for participation in the All India Inter University
Tournament 2014-15 has been selected at random as subjects. The age of the selected subjects was
ranged from 18 to 28 years. The selected players have been asked to fill the questionnaire before
the competition. Socio Economic Factors data was collected through Srivastava’s Questionnaire.
The score was recorded in points. The results revealed that there was significant difference in socio
economic factors level among the West, East, North, South and Central zone players.
Keywords: Socio Economic Factors, Weightlifter, Power lifter, Bodybuilder, Inter University
INTRODUCTION
Socio-economic factor refers to social and economical standing. A person who has high
standing in the community and good quality and ample propositions is said to have good socio-
economic factor while a poorly educated laborer of small income who lives in a small town has
low economic factor. These are the extremes and between these most people can be classified.
Hence, is not bestowed on a person but achieved by him. In the attempt to achieve, this man enters
competition of various forms in life some achieve but fail to achieve.
An individual’s socio-economic factor may influence, his opportunity for participation, his/
her desire to excel in his choice of activity and his success. It is widely believed that only
performance count in sports. Most people see sports as open to everyone, and they see success in
sports as the result of individual abilities and hard work, not money and privilege. But when they
are formally organized sports depend on material resources. More than even before it now takes
money to play certain sports and obtain the coaching necessary to develop sports skills.
Moreover, the investigator has adequate knowledge experience and interest in the field The
investigator’s previous experience hails from participation at various levels namely inter school,
inter university, state and national championships in Weightlifting, Power lifting and
Bodybuilding. Among the many existing psychological variables, the researcher’s close proximity
to the event has urged him to select Socio Economic Factors in the present study.
METHODOLOGY
300 University level male (100 Weightlifters, 100 Power lifters and 100 Bodybuilders)
will be selected as subjects at random and their age will be 18 to 28 years. Socio Economic
Factors data was collected through Srivastava’s Questionnaire. The score was recorded in
points.
RESULTS
Table I shows the analysed data on Socio Economic Factors.
Factor “A” shows five categories of topography namely North, South, East, West and
Central zones.
Manoj Sethi,
Research Scholar,
Department of Physical Education,
Swarnim Gujarat Sports Unviersity,
Sector 15, Gandhinagar, Gujarat 382016
Dr. Sudhir Kumar. Sharma
Supervisor, Associate Professor
Department of Physical Education
Swarnim Gujarat Sports Unviersity,
Sector 15, Gandhinagar, Gujarat 382016

Volume: 3, Issue: 1, July 2016 ISSN –2349- 3992
Vyayam Setu: International Journal of Physical Education and Sports Sciences 60
Table No. I
Mean and Standard Deviation of Factor “A”
North South East West Central
Mean 20.40 17.61 21.96 19.45 18.30
S.D. 6.30631 7.37860 5.06890 6.93169 5.07002
N=60
Factor “B” shows three categories of players namely Weightlifting, Power lifting,
Bodybuilding.
Table No. I (A)
Mean and Standard Deviation of Factor “B”
Weightlifting Power Lifting Bodybuilding
Mean 19.60 19.80 19.24
S.D. 6.57974 6.26196 6.31995
N-100
Factor “A” and “B” shows five categories of topography and three categories of players.
Table I (B)
5 x 3 FACTORIAL ANALYSIS OF VARIANCE FOR SOCIO ECONOMIC FACTORS
OF UNIVERSITYWEIGHTLIFTING, POWERLIFTING AND BODYBUILDING AT
DIFFERENT TOPOGRAPHY
(Scores in Points)
Sources of
Variance
Sum of
Scores
Degrees of
Freedom
Mean
Scores
OF TF
Factor ‘A’ 712.487 4 178.095 4.573 2.41
Factor ‘B’ 16.107 2 8.053 0.207 3.04
A x B 65.660 8 8.207 0.206 1.98
Error 11344.200 285 39.804
Total 126760.00 300
*Significant at 0.05 level of confidence
The obtained ‘F’ ratio of Socio Economic Factors for factor ‘A’ was 4.573 and table ‘F’
ratio was 2.41. As the obtained ‘F’ ratio was greater than the table ‘F’ ratio, the study was
significant at 0.05 level of confidence for the degrees of freedom 4 and 285. As the factor “A” was
significant, the post hoc test was not followed as stated by Clarke and Clarke (1972).
The obtained ‘F’ ratio for factor ‘B’ was 0.207 and table ‘F’ ratio was 3.04. As the obtained
‘F’ ratio was lesser than the table ‘F’ ratio, the study was not significant at 0.05 level of confidence
for the degrees of freedom 2 and 285. As the factor “B” was not significant, the post hoc test was
followed.
The obtained ‘F’ ratio for factor ‘A’ and ‘B’ was 0.206 and table ‘F’ ratio was 1.98. As the
obtained ‘F’ ratio was lesser than the table ‘F’ ratio, the study was not significant at 0.05 level of
confidence for the degrees of freedom 8 and 285. As the obtained ‘F’ ratio is less, the simple effect
test was not applied to find out the overall cell mean significant difference as stated by Rothstein
(1985).

Volume: 3, Issue: 1, July 2016 ISSN –2349- 3992
Vyayam Setu: International Journal of Physical Education and Sports Sciences 61
TABLE I (C)
SCHEFFE’S POST HOC TEST PAIRED MEAN DIFFERENCE OF SOCIO ECONOMIC
FACTORS AT DIFERENT TOPOGRAPHY (NAMELY NORTH, SOUTH, EAST, WEST
AND CENTRAL) OF UNIVERSITY LEVEL WEIGHTLIFTERS, POWER LIFTERS
AND BODYBUILDERS FACTOR ‘A’
(Scores in Points)
North South East West Central MD CD
20.40 17.61 - - - 2.79
284.35
20.40 - 21.96 - - 1.56
20.40 - - 19.45 - 0.95
20.40 - - - 18.30 2.1
- 17.61 21.96 - - 4.35
- 17.61 - 19.45 - 1.84
- 17.61 - - 18.30 0.69
- - 21.96 19.45 - 2.51
- - 21.96 - 18.30 3.66
- - - 19.45 18.30 1.15
*Mean difference is Significant at 0.05 level of confidence
Table I (C) shows the Scheffe’s Post Hoc test for paired mean difference of Achievement
Motivation of different topography namely North, South, East, West and Central (Factor ‘A’). The
mean difference between North and South, North and East, North and West, North and Central,
South and East, South and West, South and Central, East and West, East and Central and West
and Central were 2.79, 1.56, 0.95, 2.1, 4.35, 1.84, 0.69, 2.51, 3.66 and 1.15. The Scheffe’s Critical
Difference Value was 284.35.
Hence the following comparisons were found not significant:
North and South, north and East, North and West, North and Central, South and East, South
and West, South and Central, East and West, East and Central and West and Central
MEAN DIFFERENCE OF SOCIO ECONOMIC FACTORS OF FIVE ZONE
UNIVERSITY MEN WEIGHLIFTERS, POWER LIFTERS AND BODYBUILDERS
Figure 1
0
5
10
15
20
25
North East South West Central
Weightlifters
Power Lifters
Bodybuilders

Volume: 3, Issue: 1, July 2016 ISSN –2349- 3992
Vyayam Setu: International Journal of Physical Education and Sports Sciences 62
CONCLUSION
1. It was concluded from the findings of the study that there was significant difference in
Socio Economic Status among University men Weightlifters, Power lifters and
Bodybuilders at different Topography such as North, South, East, West and Central zone
players.
2. It was concluded from the findings of the study that, when the Scheffe’s Post Hoc test was
applied for finding the paired mean difference of Socio Economic Status of different
topography namely North, South, East, West and Central (Factor ‘A’). The mean difference
between North and South, North and East, North and West, North and Central, South and
East, South and West, South and Central, East and West, East and Central and West and
Central were found lesser than the Scheffe’s critical difference value and the study was
found insignificant.
3. It was concluded from the findings of the study that the obtained ‘F’ ratio for factor ‘B’
was .207 and table ‘F’ ratio was 3.04. As the obtained ‘F’ ratio was found lesser than the
table ‘F’ ratio, the study was found not significant at 0.05 level of confidence for the
degrees of freedom 2 and 285. As the factor “B” was insignificant, the post hoc test was
not followed.
4. It was concluded from the findings of the study that the obtained ‘F’ ratio for factor ‘A x
B’ was .206 and table ‘F’ ratio was 1.98. As the obtained ‘F’ ratio was found lesser than
the table ‘F’ ratio, the study was found not significant at 0.05 level of confidence for the
degrees of freedom 8 and 285. As the obtained ‘F’ ratio was found lesser than the table ‘F’
ratio, the simple effect test was not applied to find out the overall cell mean significant
difference as stated by Rothstein (1985).
Over the years researchers have conducted studies on the impact of Socio Economic
Factors of a sportsman on his level of performance. Gupta and Sharma (2016), begum (1994),
Glad son (1993), Cratty (1986), Ponthieux and Barker (1984), Tigleman (1984), Brockhoff
(1972) and Scores of Indian researchers have studied sports profiles and concluded that socio
economic background paved the way to better determination and grit for achieving high goals in
sports. The present study also corroborated the past works, with its findings.
REFERENCES
Rothstein, Anne L. (1985) “Research Design and Statistics for Physical Education” New
Jersey,: Prentice Hall.
Bell (1983) Championship Thinking, Englewood Cliffs, New Jersey, Prentice Hall, Inc,
P.50.
Clarke, David H. and Clarke H. Harrison (1972) “Advanced Statistics with Application to
physical Education”, New Jersey : Prentice Hall
Clarke, David H. and Clarke H. Harrison (1984) Research Process in Physical Education,
New Jersey; Prentice Hall.
Fox and Mathews, (1981), “The Psychological basis of Physical Education and Athletics”
(Ed), 3. Philadelphia, W.B.Saunder’s Co.
Hockey R. V. (1985) “Physical Fitness: The Pathway to Healthful Living” St. Louis, Times
Mirror/ Mosby College Publishing.
Kamlesh M. L. (1983) Psychology of Physical Education and Sports, New Delhi,
Metropolitan Publishers.
Thirumalaisamy, R. (1985) Thesis and Dissertation Writing. Karaikudi, KPSV
Publications.
