bharat heavy electricals ltd q3 fy14 detail...
TRANSCRIPT

Recommend BUY CMP 195.15
Target Price 250.00
ISIN: INE257A01026 MARCH 26th
, 2014
BHARAT HEAVY ELECTRICALS LTD
Result Update: Q3 FY14
STOCK DETAILS
Sector Engineering
BSE Code 500103
Face Value 2.00
52wk. High / Low (Rs.) 207.90/100.35
Volume (2wk. Avg ) 357000
Market Cap ( Rs in mn ) 477649.14
Annual Estimated Results (A*: Actual / E*: Estimated)
Years FY13A FY14E FY15E
Net Sales 484247.00 366842.01 410863.05
EBITDA 105111.00 51353.97 77285.04
Net Profit 66147.00 28141.80 43657.61
EPS 27.03 11.50 17.84
P/E 7.22 16.97 10.94
Shareholding Pattern (%)
1 Year Comparative Graph
BHARAT HEAVY ELECTRICALS LTD BSE SENSEX
Highlights
BHEL reported Net Sales of Rs. 86348.50 million
against Rs.102197.10 million in the corresponding
quarter of previous year, a decrease of 15.51%.
Net Profit for the December quarter stood at Rs.
6948.10 million compared to Rs. 11818.50 million,
when compared with the prior year period.
Profit before interest, depreciation and tax is
Rs.12767.20 millions as against Rs.19664.40 millions
in the corresponding period of the previous year.
BHEL has bagged Rs.79000 mn, the EPC order for
setting up NTPC's 1,980 MW North Karanpura Super
Thermal Power Project (STPP)in Hazaribagh district
of Jharkhand State.
Bharat Heavy Electricals Ltd wins order for 206 MW
Hydro Electric Project in Punjab.
BHEL has bagged a prestigious order for the supply
of Turbine Generator (TG) Package for 2x500 MW
TPS at Neyveli, valued at Rs.10230 million.
Bharat Heavy Electricals Ltd has declared 65.5%
lnterim Dividend for fiscal 2013-14 on the enhanced
equity capital post-bonus.
A Joint Venture Company in Sambhar, Rajasthan with
equity participation from Bharat Heavy Electricals
Limited (26%), Solar Energy Corporation of India
(23%), Hindustan Salts Limited (16%), POWERGRID
(16%), Satluj Jal Vidyut Nigam Limited (16%) and
Rajasthan Electronics and Instruments Limited (3%)
for setting up 4,000 MW Ultra Mega Solar Power
Project. The equipment for the project will be
supplied by BHEL.
PEER GROUPS CMP MARKET CAP EPS P/E (X) P/BV(X) DIVIDEND
COMPANY NAME (Rs.) Rs. in Mn. (Rs.) Ratio Ratio (%)
BHEL Ltd 195.15 477649.14 27.03 7.22 1.57 270.00
ABB India Ltd 822.00 17,4188.70 8.47 97.05 6.27 150.00
Crompton Greaves Ltd 159.80 100530.20 7.99 20.00 3.29 60.00
ALSTOM India Ltd 383.00 25748.10 26.49 26.49 3.21 100.00
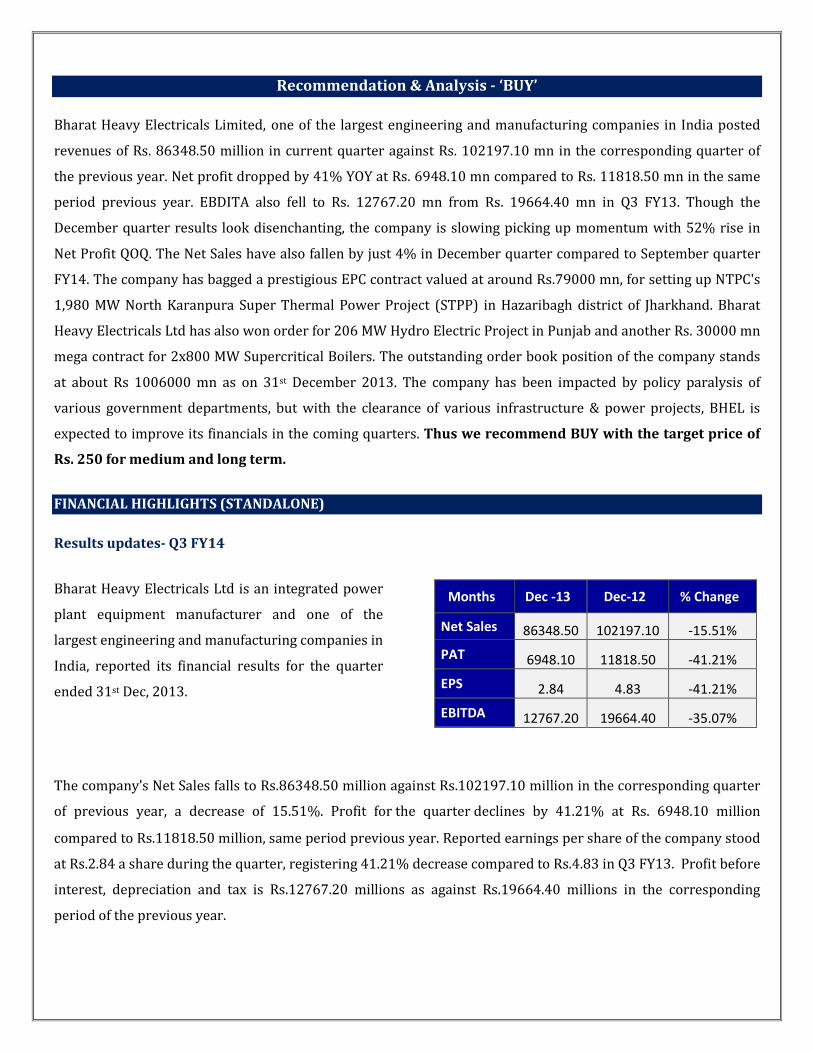
Recommendation & Analysis - ‘BUY’
Bharat Heavy Electricals Limited, one of the largest engineering and manufacturing companies in India posted
revenues of Rs. 86348.50 million in current quarter against Rs. 102197.10 mn in the corresponding quarter of
the previous year. Net profit dropped by 41% YOY at Rs. 6948.10 mn compared to Rs. 11818.50 mn in the same
period previous year. EBDITA also fell to Rs. 12767.20 mn from Rs. 19664.40 mn in Q3 FY13. Though the
December quarter results look disenchanting, the company is slowing picking up momentum with 52% rise in
Net Profit QOQ. The Net Sales have also fallen by just 4% in December quarter compared to September quarter
FY14. The company has bagged a prestigious EPC contract valued at around Rs.79000 mn, for setting up NTPC's
1,980 MW North Karanpura Super Thermal Power Project (STPP) in Hazaribagh district of Jharkhand. Bharat
Heavy Electricals Ltd has also won order for 206 MW Hydro Electric Project in Punjab and another Rs. 30000 mn
mega contract for 2x800 MW Supercritical Boilers. The outstanding order book position of the company stands
at about Rs 1006000 mn as on 31st December 2013. The company has been impacted by policy paralysis of
various government departments, but with the clearance of various infrastructure & power projects, BHEL is
expected to improve its financials in the coming quarters. Thus we recommend BUY with the target price of
Rs. 250 for medium and long term.
FINANCIAL HIGHLIGHTS (STANDALONE)
Results updates- Q3 FY14
Bharat Heavy Electricals Ltd is an integrated power
plant equipment manufacturer and one of the
largest engineering and manufacturing companies in
India, reported its financial results for the quarter
ended 31st Dec, 2013.
Months Dec -13 Dec-12 % Change
Net Sales 86348.50 102197.10 -15.51%
PAT 6948.10 11818.50 -41.21%
EPS 2.84 4.83 -41.21%
EBITDA 12767.20 19664.40 -35.07%
The company’s Net Sales falls to Rs.86348.50 million against Rs.102197.10 million in the corresponding quarter
of previous year, a decrease of 15.51%. Profit for the quarter declines by 41.21% at Rs. 6948.10 million
compared to Rs.11818.50 million, same period previous year. Reported earnings per share of the company stood
at Rs.2.84 a share during the quarter, registering 41.21% decrease compared to Rs.4.83 in Q3 FY13. Profit before
interest, depreciation and tax is Rs.12767.20 millions as against Rs.19664.40 millions in the corresponding
period of the previous year.

Break Up Of Expenditure
Segment Revenue
Rs. In Mn Q3 FY14 Q3 FY13 CHNG %
Power 73195.90 83029.60 -12%
Industry 15999.40 22365.40 -28%
Other Important Updates
• Bharat Heavy Electricals Ltd bagged Rs. 30000 mn mega contract for 2x800 MW Supercritical Boilers.
• Bharat Heavy Electricals Limited (BHEL) has bagged a prestigious EPC contract for setting up a power project
involving three coal-fired supercritical thermal units of 660 MW each. Valued at around Rs.79000 mn, the
EPC order for setting up NTPC's 1,980 MW North Karanpura Super Thermal Power Project (STPP) in
Hazaribagh district of Jharkhand State, has been won by BHEL against lnternational Competitive Bidding
(lCB).
• Bharat Heavy Electricals Ltd wins order for 206 MW Hydro Electric Project in Punjab.
• Bharat Heavy Electricals Ltd has declared 65.5% lnterim Dividend for fiscal 2013-14 on the enhanced equity
capital post-bonus. In value terms, dividend paid amounts to Rs. 3206.30 mn.
Rs. In Million Q3 FY14 Q3 FY13 CHG %
Cost of
Material 49395.90 55878.30 -12%
Other
Expenditure 12432.30 14119.40 -12%
Dep & Amortz 2416.10 2197.90 10%
Emply Benefit
Exp 15255.50 14373.10 6%

• Bharat Heavy Electricals Limited (BHEL) has achieved yet another milestone with its first supercritical set of
Barh Thermal Power Project (TPP) Stage II Unit 4 in Bihar attaining full load of 660 MW on 30th November
2013.
• BHEL has been conferred the India Pride Award 2013 for Excellence in Heavy Industries.
• Bharat Heavy Electricals Limited (BHEL) has bagged a prestigious order for the supply of Turbine Generator
(TG) Package for 2x500 MW TPS at Neyveli. Valued at Rs.10230 Million, the order has been secured by BHEL
from Neyveli Lignite Corporation Limited (NLC), for their upcoming 1,000 MW Neyveli New Thermal Power
Project (NNTPP) at Neyveli, Tamil Nadu.
• An Ultra Mega Solar Power Project (UMSPP) with a cumulative capacity of 4,000 MW will be set up in
Rajasthan in the Sambhar Salts Limited (SSL) area close to Sambhar Lake, about 75 kms. from Jaipur.
Significantly, with the commissionong of this plant and commercial utilisation of the harvested energy
therein, this would become the largest single location solar electricity generation project in the world. A Joint
Venture Company (JVC) will develop the Solar Power Project on the surplus land available with SSL in
Sambhar, Rajasthan with equity participation from Bharat Heavy Electricals Limited (26%), Solar Energy
Corporation of India (23%), Hindustan Salts Limited (16%), POWERGRID (16%), Satluj Jal Vidyut Nigam
Limited (16%) and Rajasthan Electronics and Instruments Limited (3%). The project set up on land provided
by SSL will have equipment supplied by BHEL, power evacuation by POWERGRID, sale of electricity by SECI,
O&M by REIL and project management by SJVNL. The plant shall be set up in two phases over a period of 7
years with Phase I comprising 1,000 MW and the balance 3,000 MW in subsequent phases. The JVC shall be
incorporated as a public limited company under the Companies Act, the JVC, under DHI and will have at its
registered office in Delhi/NCR.

Company Profile
Established in 1964, BHEL is India’s largest engineering and manufacturing company of its kind engaged in the
design, engineering, manufacture, construction, testing, commissioning and servicing of a wide range of products
and services for the core sectors of the economy, viz. Power, Transmission, Industry, Transportation, Renewable
Energy, Oil & Gas and Defence. The company has been earning profits continuously since 1971-72 and paying
dividends since 1976-77. In recognition of its consistent high performance, BHEL has been conferred with
‘Maharatna' status by Government of India on 1st February, 2013. It is now one among the seven Maharatna PSEs.
The company has 16 manufacturing divisions, two repair units, four regional offices, eight service centres, and 15
regional centres and currently operates at more than 150 project sites across India and abroad. The company has
enhanced its capability to deliver 20,000 MW p.a. of power equipment to address growing demand for power
generation equipment. BHEL research and development (R&D) efforts are aimed not only at improving the
performance and efficiency of existing products, but also at using state-of-the-art technologies and processes to
develop new products.
The high level of quality & reliability of products is due to adherence to international standards by acquiring and
adapting some of the best technologies from leading companies in the world including General Electric Company,
Alstom SA, Siemens AG and Mitsubishi Heavy Industries Ltd., together with technologies developed in the
company own R&D centres. Most of manufacturing units and other entities have been accredited to Quality
Management Systems (ISO 9001:2008), Environmental Management Systems (ISO 14001:2004) and
Occupational Health & Safety Management Systems (OHSAS 18001:2007).
BHEL have a share of around 57% in India's total installed generating capacity contributing 69% (approx.) to the
total power generated from utility sets (excluding non-conventional capacity) as of March 31, 2013. The
company has been exporting power and industry segment products and services for approximately 40 years.
BHEL have exported products and services to across 75 countries. The Company had cumulatively installed
capacity of over 9,000 MW outside of India in 21 countries, including Malaysia, Iraq, the UAE, Egypt and
NewZealand.
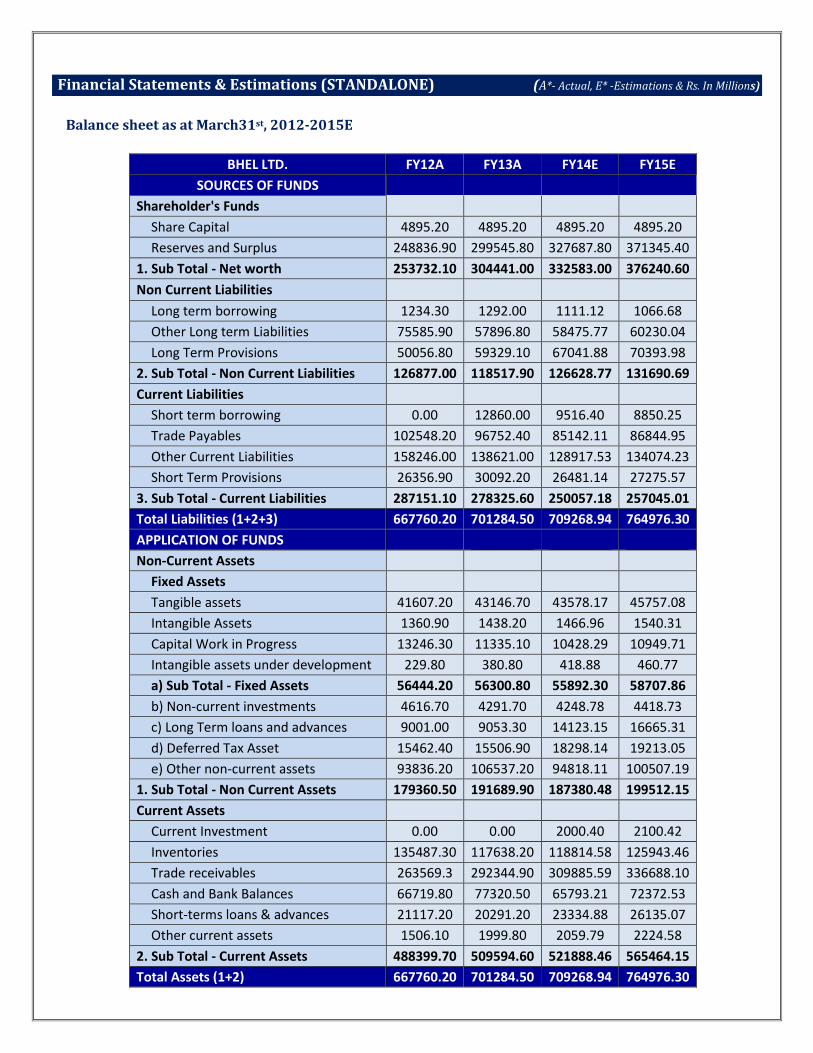
Financial Statements & Estimations (STANDALONE) (A*- Actual, E* -Estimations & Rs. In Millions)
Balance sheet as at March31st, 2012-2015E
BHEL LTD. FY12A FY13A FY14E FY15E
SOURCES OF FUNDS
Shareholder's Funds
Share Capital 4895.20 4895.20 4895.20 4895.20
Reserves and Surplus 248836.90 299545.80 327687.80 371345.40
1. Sub Total - Net worth 253732.10 304441.00 332583.00 376240.60
Non Current Liabilities
Long term borrowing 1234.30 1292.00 1111.12 1066.68
Other Long term Liabilities 75585.90 57896.80 58475.77 60230.04
Long Term Provisions 50056.80 59329.10 67041.88 70393.98
2. Sub Total - Non Current Liabilities 126877.00 118517.90 126628.77 131690.69
Current Liabilities
Short term borrowing 0.00 12860.00 9516.40 8850.25
Trade Payables 102548.20 96752.40 85142.11 86844.95
Other Current Liabilities 158246.00 138621.00 128917.53 134074.23
Short Term Provisions 26356.90 30092.20 26481.14 27275.57
3. Sub Total - Current Liabilities 287151.10 278325.60 250057.18 257045.01
Total Liabilities (1+2+3) 667760.20 701284.50 709268.94 764976.30
APPLICATION OF FUNDS
Non-Current Assets
Fixed Assets
Tangible assets 41607.20 43146.70 43578.17 45757.08
Intangible Assets 1360.90 1438.20 1466.96 1540.31
Capital Work in Progress 13246.30 11335.10 10428.29 10949.71
Intangible assets under development 229.80 380.80 418.88 460.77
a) Sub Total - Fixed Assets 56444.20 56300.80 55892.30 58707.86
b) Non-current investments 4616.70 4291.70 4248.78 4418.73
c) Long Term loans and advances 9001.00 9053.30 14123.15 16665.31
d) Deferred Tax Asset 15462.40 15506.90 18298.14 19213.05
e) Other non-current assets 93836.20 106537.20 94818.11 100507.19
1. Sub Total - Non Current Assets 179360.50 191689.90 187380.48 199512.15
Current Assets
Current Investment 0.00 0.00 2000.40 2100.42
Inventories 135487.30 117638.20 118814.58 125943.46
Trade receivables 263569.3 292344.90 309885.59 336688.10
Cash and Bank Balances 66719.80 77320.50 65793.21 72372.53
Short-terms loans & advances 21117.20 20291.20 23334.88 26135.07
Other current assets 1506.10 1999.80 2059.79 2224.58
2. Sub Total - Current Assets 488399.70 509594.60 521888.46 565464.15
Total Assets (1+2) 667760.20 701284.50 709268.94 764976.30
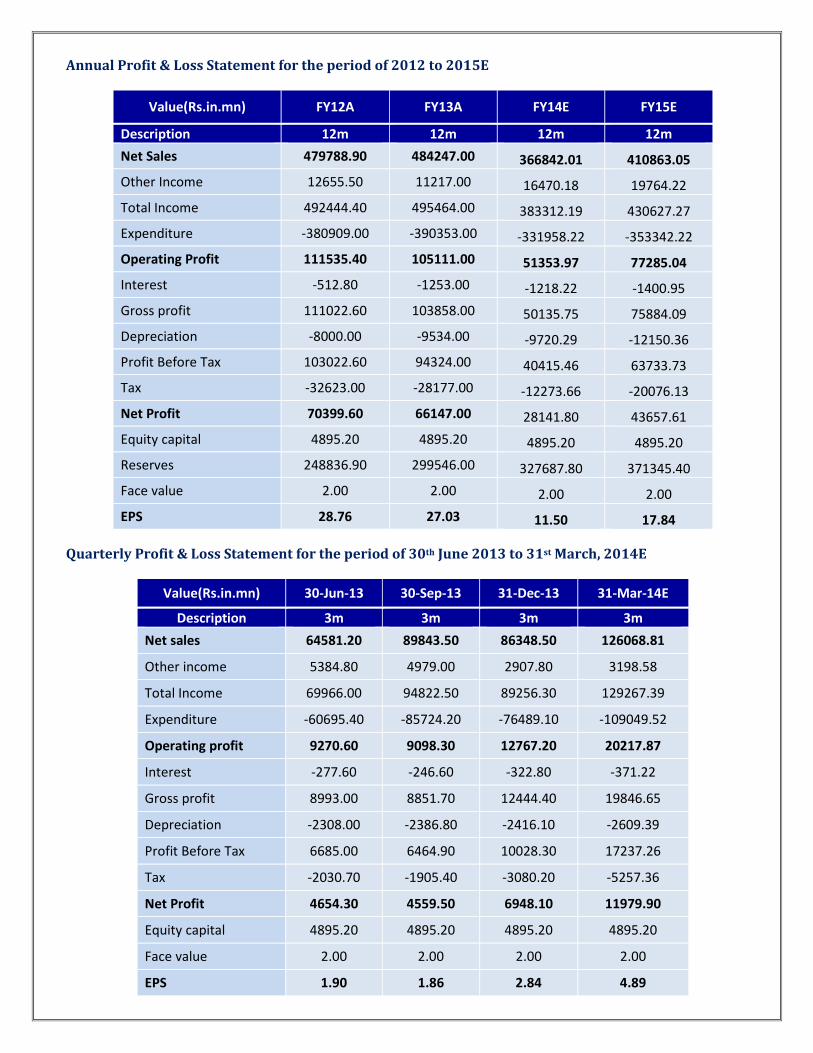
Annual Profit & Loss Statement for the period of 2012 to 2015E
Value(Rs.in.mn) FY12A FY13A FY14E FY15E
Description 12m 12m 12m 12m
Net Sales 479788.90 484247.00 366842.01 410863.05
Other Income 12655.50 11217.00 16470.18 19764.22
Total Income 492444.40 495464.00 383312.19 430627.27
Expenditure -380909.00 -390353.00 -331958.22 -353342.22
Operating Profit 111535.40 105111.00 51353.97 77285.04
Interest -512.80 -1253.00 -1218.22 -1400.95
Gross profit 111022.60 103858.00 50135.75 75884.09
Depreciation -8000.00 -9534.00 -9720.29 -12150.36
Profit Before Tax 103022.60 94324.00 40415.46 63733.73
Tax -32623.00 -28177.00 -12273.66 -20076.13
Net Profit 70399.60 66147.00 28141.80 43657.61
Equity capital 4895.20 4895.20 4895.20 4895.20
Reserves 248836.90 299546.00 327687.80 371345.40
Face value 2.00 2.00 2.00 2.00
EPS 28.76 27.03 11.50 17.84
Quarterly Profit & Loss Statement for the period of 30th June 2013 to 31st March, 2014E
Value(Rs.in.mn) 30-Jun-13 30-Sep-13 31-Dec-13 31-Mar-14E
Description 3m 3m 3m 3m
Net sales 64581.20 89843.50 86348.50 126068.81
Other income 5384.80 4979.00 2907.80 3198.58
Total Income 69966.00 94822.50 89256.30 129267.39
Expenditure -60695.40 -85724.20 -76489.10 -109049.52
Operating profit 9270.60 9098.30 12767.20 20217.87
Interest -277.60 -246.60 -322.80 -371.22
Gross profit 8993.00 8851.70 12444.40 19846.65
Depreciation -2308.00 -2386.80 -2416.10 -2609.39
Profit Before Tax 6685.00 6464.90 10028.30 17237.26
Tax -2030.70 -1905.40 -3080.20 -5257.36
Net Profit 4654.30 4559.50 6948.10 11979.90
Equity capital 4895.20 4895.20 4895.20 4895.20
Face value 2.00 2.00 2.00 2.00
EPS 1.90 1.86 2.84 4.89

Ratio Analysis
Particulars FY12A FY13A FY14E FY15E
EPS (Rs.) 28.76 27.03 11.50 17.84
EBITDA Margin (%) 23.25% 21.71% 14.00% 18.81%
PBT Margin (%) 21.47% 19.48% 11.02% 15.51%
PAT Margin (%) 14.67% 13.66% 7.67% 10.63%
P/E Ratio (x) 6.78 7.22 16.97 10.94
ROE (%) 27.75% 21.73% 8.46% 11.60%
ROCE (%) 46.88% 35.98% 17.79% 23.16%
Debt Equity Ratio 0.00 0.05 0.03 0.03
EV/EBITDA (x) 3.70 3.94 8.23 5.37
Book Value (Rs.) 103.67 124.38 135.88 153.72
P/BV 1.88 1.57 1.44 1.27
Charts

Outlook and Conclusion
� At the current market price of Rs.195.15, the stock P/E ratio is at 16.97 x FY14E and 10.94 x FY15E
respectively.
� Earning per share (EPS) of the company for the earnings for FY14E and FY15E is seen at Rs.11.50 and
Rs.17.84 respectively.
� On the basis of EV/EBITDA, the stock trades at 8.23 x for FY14E and 5.37 x for FY15E.
� Price to Book Value of the stock is expected to be at 1.44 x and 1.27 x respectively for FY14E and FY15E.
� We recommend ‘BUY’ in this particular scrip with a target price of Rs.250.00 for Medium to Long term
investment.
Industry Overview
The Indian engineering sector is of strategic importance to the economy owing to its intense integration with
other industry segments. Development .in sectors such as infrastructure, power, mining, oil and gas, refinery,
steel, automotives, and consumer durables are driving demand in the engineering sector. Major foreign players
are also confident and have big expectations from the Indian engineering segment as it enjoys a comparative
advantage in terms of manufacturing costs, market knowledge, technology and creativity.
The total exports of Indian engineering sector stood at US$ 56.7 billion during FY13 and are anticipated to grow
to US$ 125 billion by FY14. Exports from the engineering segment have registered a compound annual growth
rate (CAGR) of 12.6 per cent over the period FY08-13 wherein transport equipment is the leading contributor to
engineering exports.
The Indian Government also plays a crucial role in developing the engineering section of the economy. The
engineering industry has been de-licensed and enjoys 100 per cent foreign direct investment (FDI).
Exports
The engineering sector is one of the major contributors to the country's total merchandise shipments. The US
and Europe together account for over 60 per cent of India's total engineering exports.
Engineering exports mainly include transport equipment, capital goods, other machinery/equipment and light
engineering products like castings, forgings and fasteners.

The Ministry of Commerce and Industries has set a target of shipping US$ 125 billion worth of engineering goods
by the end of 2013-14. Indian engineering companies are scouting for newer markets (like Latin America, Africa
etc.) for exports along with strengthening their base in the US and Europe.
Engineering goods represent India's third-biggest export sector which rose 2 per cent in August 2013.
Engineering exports are projected to cumulatively expand by 22 per cent in September-December 2013 to US$
21.5 billion against US$ 17.1 billion last fiscal.
Design & Engineering- Key Developments and Investments
The miscellaneous mechanical and engineering industries’ sector-wise FDI inflows from April 2000 to July 2013
were calculated at US$ 2.48 billion, as per the Department of Industrial Policy and Promotion (DIPP).
• Kirloskar Brothers Ltd (KBL)’s subsidiary SPP Pumps has launched its most advanced facility at Atlanta,
USA, embarking the inauguration of KBL’s seventh manufacturing facility worldwide. With an outlay of
US$ 6 million, the new plant is equipped with latest engineering, testing and training set-up and has an
annual installed capacity of 2,500 units. With the opening of the new facility, SPP Pumps expects its
production capacity to increase by 30 per cent and the turnover to reach US$ 40 million over the next
three years.
• Meanwhile, L&T has been appointed for an EPC project worth about US$ 250 million by Petroleum
Development Oman. The project, which is scheduled to be completed in 39 months, involves the Yibal-
Natih gas reservoir in Oman and is considered to be of strategic importance for L&T.
• BPCL has awarded a Rs 700 crore (US$ 111.88 million)-contract to Essar Projects Limited (EPL) for
Engineering, Procurement, Construction and Commissioning as well as commissioning assistance of the
Coke Drum Structure Package (CDSP) of the Delayed Coker Unit (DCU) at the BPCL Kochi Refinery for the
Integrated Refinery Expansion Project.
• AION Capital Partners, a joint venture (JV) between Apollo Global Management and ICICI Venture has
made an investment of Rs 300 crore (US$ 47.94 million) in Jyoti Structures.
Government Initiatives
Dr Manmohan Singh, the Prime Minister of India, has revealed the country's new Science, Technology and
Innovation policy which aims to increase the number of full time equivalent of R&D personnel in India by at least
66 per cent of the present strength in five years.
Alongside, the National Policy on Electronics (NPE) proposes to set up more than 200 Electronic Manufacturing
Clusters in India while the Government of India (GoI) has proposed to create an electronics development fund of
US$ 2 billion to promote innovation, intellectual property, R&D, nano electronics and help commercialise made-
in-India products.
The chip design and embedded software market in India is estimated to reach US$ 55 billion by 2020, as per the
targets set by NPE.
Road Ahead
Management consulting firm Zinnov has stated that India may soon have its first US$ 1 billion-product
engineering services company, proving the country's strategic position in the field.
Indian engineering service providers enjoy a crucial position, with about 23 per cent of the overall engineering
and R&D outsourcing pie. India's exports in the R&D and product engineering segment are currently valued at
US$ 16.3 billion and are poised to grow exponentially over the coming years.
Industry analysts project that by 2020, the Engineering Services Outsourcing (ESO) market in India would reach
US$ 40-50 billion, driven by increasing onshore to offshore movement of services.
Disclaimer:
This document prepared by our research analysts does not constitute an offer or solicitation for the purchase or sale
of any financial instrument or as an official confirmation of any transaction. The information contained herein is
from publicly available data or other sources believed to be reliable but do not represent that it is accurate or
complete and it should not be relied on as such. Firstcall India Equity Advisors Pvt. Ltd. or any of it’s affiliates shall
not be in any way responsible for any loss or damage that may arise to any person from any inadvertent error in the
information contained in this report. This document is provide for assistance only and is not intended to be and must
not alone be taken as the basis for an investment decision.

Firstcall India Equity Research: Email – [email protected]
C.V.S.L.Kameswari Pharma
U. Janaki Rao Capital Goods
B. Anil Kumar Auto, IT & FMCG
Suhani Adilabadkar Pharma & Banking
M. Vinayak Rao Diversified
C. Bhagya Lakshmi Diversified
Firstcall India also provides
Firstcall India Equity Advisors Pvt.Ltd focuses on, IPO’s, QIP’s, F.P.O’s,Takeover
Offers, Offer for Sale and Buy Back Offerings.
Corporate Finance Offerings include Foreign Currency Loan Syndications,
Placement of Equity / Debt with multilateral organizations, Short Term Funds
Management Debt & Equity, Working Capital Limits, Equity & Debt
Syndications and Structured Deals.
Corporate Advisory Offerings include Mergers & Acquisitions(domestic and
cross-border), divestitures, spin-offs, valuation of business, corporate
restructuring-Capital and Debt, Turnkey Corporate Revival – Planning &
Execution, Project Financing, Venture capital, Private Equity and Financial
Joint Ventures
Firstcall India also provides Financial Advisory services with respect to raising
of capital through FCCBs, GDRs, ADRs and listing of the same on International
Stock Exchanges namely AIMs, Luxembourg, Singapore Stock Exchanges and
other international stock exchanges.
For Further Details Contact:
3rd Floor,Sankalp,The Bureau,Dr.R.C.Marg,Chembur,Mumbai 400 071
Tel. : 022-2527 2510/2527 6077/25276089 Telefax : 022-25276089
E-mail: [email protected]
www.firstcallindiaequity.com