best practices to drive business intelligence user adoption
TRANSCRIPT

Best Practices to Drive Business
Intelligence User Adoption
Notes:
If you experience audio issues during the webinar, you can dial in through
telephone details provided to you in your registration confirmation email.
Please feel free to post questions in the questions dialog and we will try to
answer as many as we can at the end.
Recording of this session will be shared in next 24-48 hours.
You can also write to us at [email protected] for any clarifications or
information.

Session Speaker
Srini Pattabi
VP - Analytics & Information
Management
WinWire Technologies

Why BI Projects Fail…
Sifting from the noise…

What is “Business”
A faceless, featureless entity?
Business User
Power User
Executives
IT
You have a rich choice of 4 to pick from!

Traditional Approach on ‘Users’
Data is the center of universe
Users are described based on ‘permissions’ requirement
What are the fields and columns required in the report:
• Excel is used to create a mock-up
• Colors, Navigation and other “minor” details are discussed during UAT
What information do you want?
Business Analyst and Developer interaction: relatively silo’ed approach
Delivery channels are explicitly part of the requirements discussion

Engineer’s View vs. User’s View

What is the point?
Declutter,
Organize,
Simplify
Interaction
with the data
Amplify
Cognition
2 31
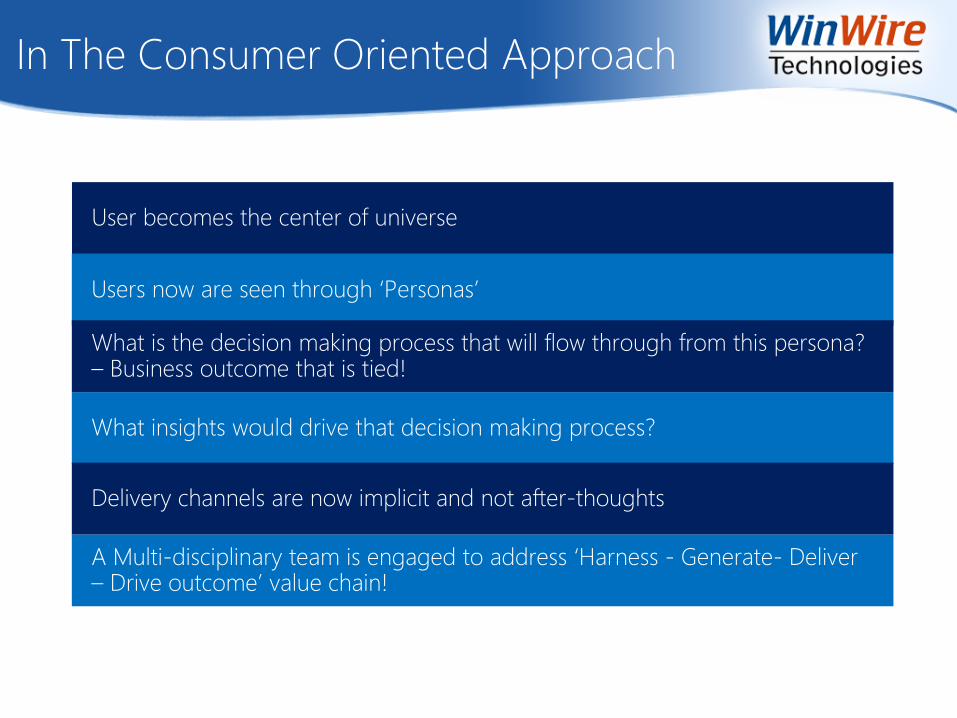
In The Consumer Oriented Approach

Introducing Personas – User Traits
Status
Reporting
Diagnosis
Explanation
ExplorationVisual Cues
Detail
Oriented
Monitoring
Tracking
High
Latency
Tolerance
Low Latency
Tolerance
• Visualization
• Delivery channel
• Delivery
(Reporting) tool
choices
• Aggregation
strategy

No Longer Faceless!

Meet “Ted” The Headliner
Implications
• Manages a large team over a wide spread of either
geography or business areas
• Is always on the ‘Go’: Typically runs from one
meeting to another or is on the ‘Field’
• Not a micro-manager but would like to be in the
know alwaysBusiness User
• High Availability of Reports
• Visualization that delivers ‘Headlines’ efficiently
• Most likely a Tablet/ Mobile device user – reports/
dashboards should be form friendly
• Limited drill down capability required
Relies more on visual cues
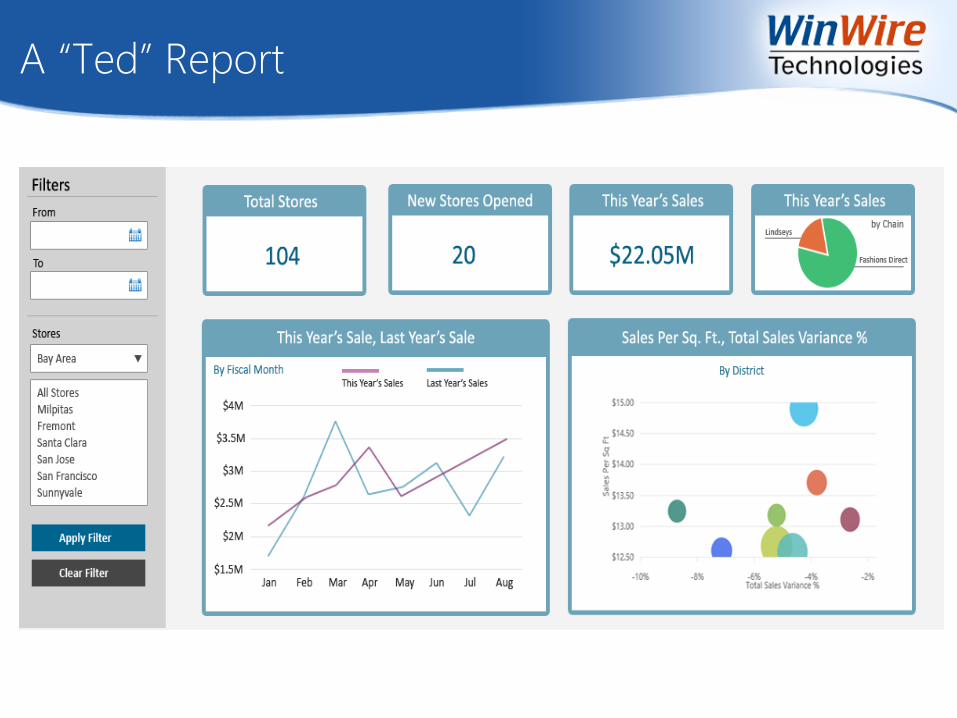
A “Ted” Report

Meet “The Monk”: The Perfectionist
Implications
• Manages a critical business function – typically
manages operations
• Highly detail oriented and would like to
understand granular data of the report
• Spends long hours in office
• A high laptop device user
• High Availability of Reports
• Less visual, more data but efficient navigation
• Multi-level drill down to most granular data
• Typically high volume data reporting
Relies on granular data
Business User

Example Mock-up: A “Monk” Report
Analytical and Operational reports to provide Trending and detail information.

Say Hello to Sergei, The Data Scientist!
Power User
Implications
• Likely a direct-report of a ‘powerful’ executive
• Does special projects and has the trust of a power
center
• Very tech-savvy and has good sql and reporting
skills – uses prescriptive data analysis tools
• A high volume data cruncher
• Access to a rich semantic layer and/ or data
discovery platform
• Need more of data extracts and self-service
capabilities than canned reporting
• Focus more on data quality and lineage
• Tool-sets should data exploration capable
Just give them the data!
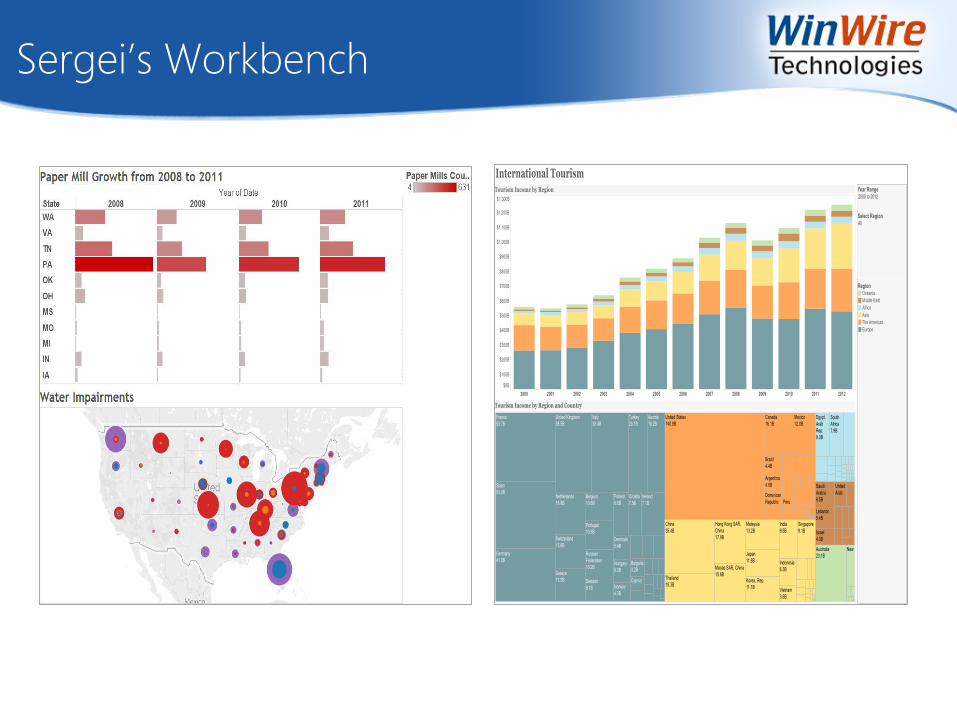
Sergei’s Workbench
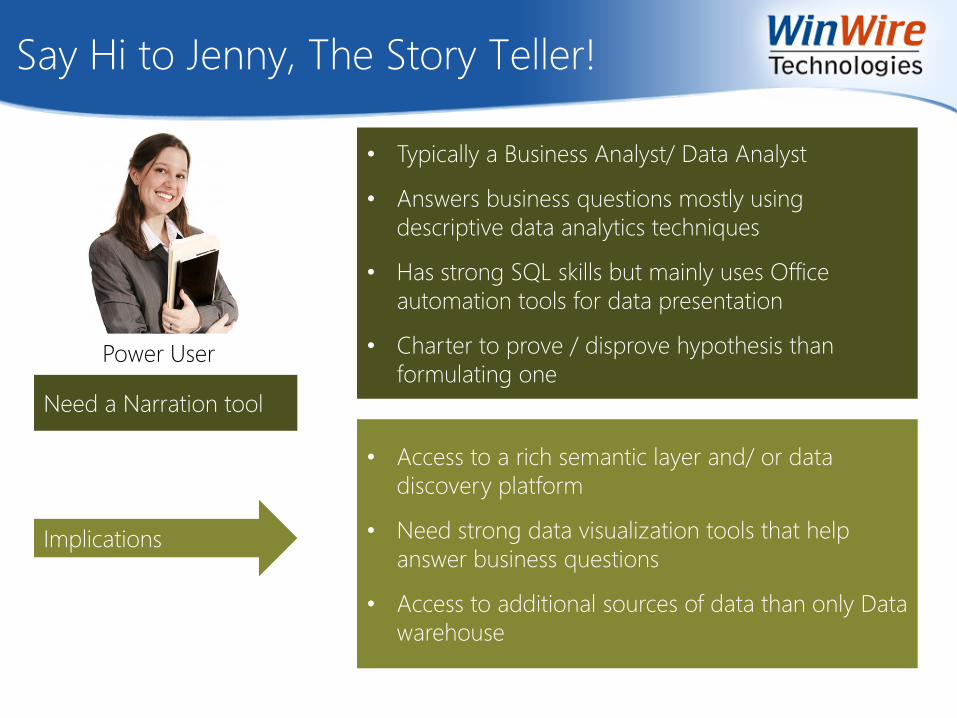
Say Hi to Jenny, The Story Teller!
Implications
• Typically a Business Analyst/ Data Analyst
• Answers business questions mostly using
descriptive data analytics techniques
• Has strong SQL skills but mainly uses Office
automation tools for data presentation
• Charter to prove / disprove hypothesis than
formulating one
• Access to a rich semantic layer and/ or data
discovery platform
• Need strong data visualization tools that help
answer business questions
• Access to additional sources of data than only Data
warehouse
Need a Narration tool
Power User

Jenny’s Report
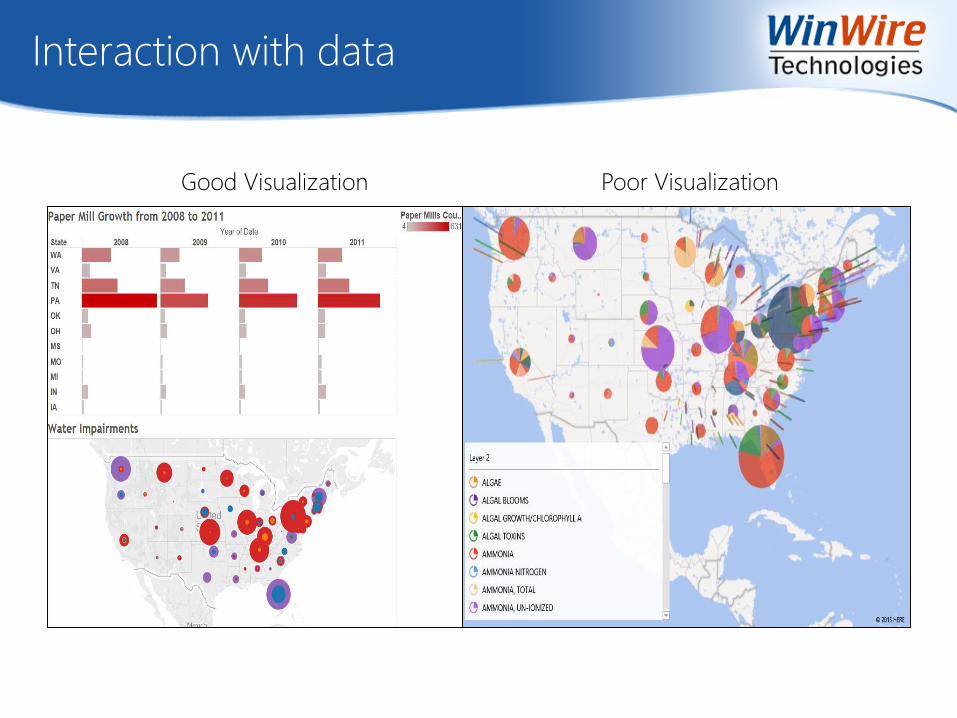
Interaction with data
Good Visualization Poor Visualization

Exploration vs. Explanation

Innovate & Iterate Methodology
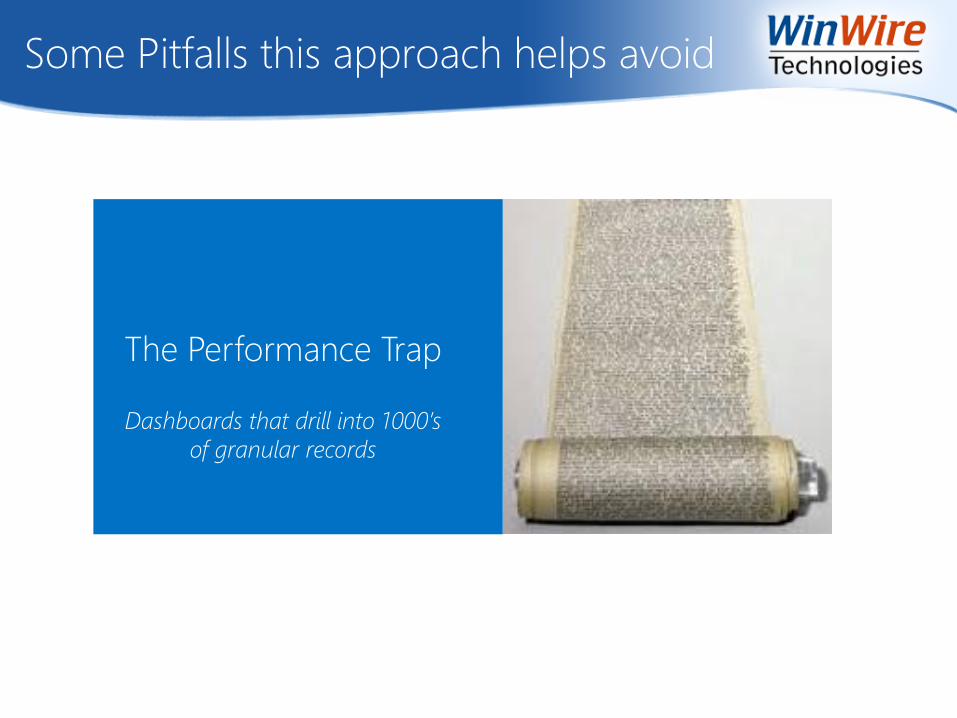
Some Pitfalls this approach helps avoid
The Performance Trap
Dashboards that drill into 1000’s
of granular records

Some Pitfalls this approach helps avoid
Form vs. Function
Laptop friendly functions does not
meet Tablet friendly form
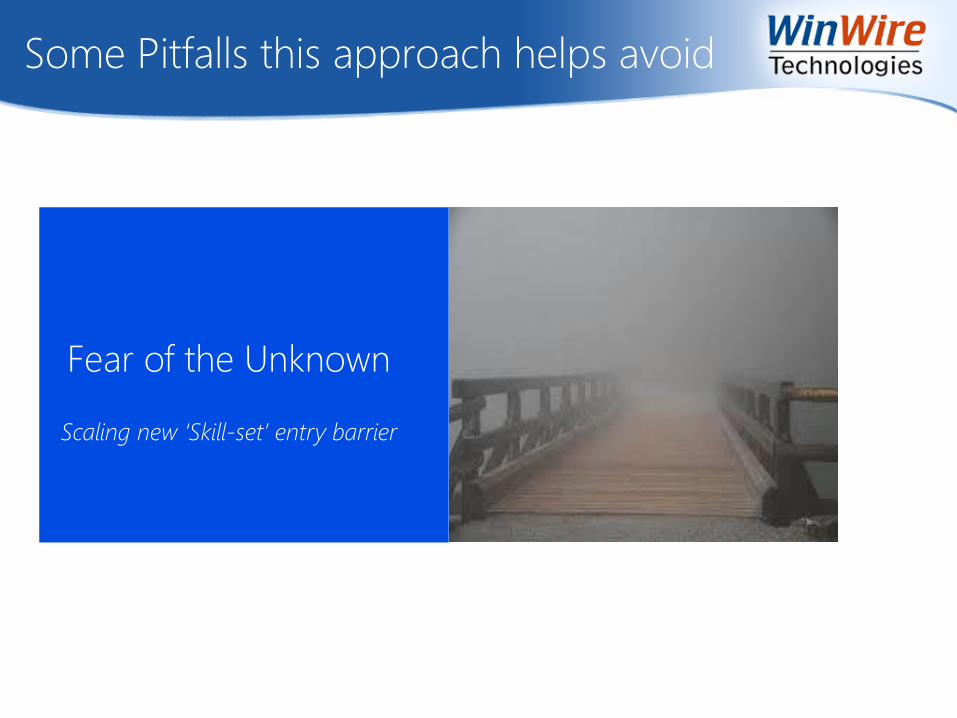
Some Pitfalls this approach helps avoid
Fear of the Unknown
Scaling new ‘Skill-set’ entry barrier

In Summary
We demand a personalized attention
as consumers!...…Yet end up delivering a mass marketing like treatment
Information is also a ‘consumable’…We as BI Leaders are the purveyors of the same
Let us bring ‘Business’ back into BI !

Who We Are
IT solutions company
making information
actionable for the
enterprises in the
mobile-cloud world
Collaborative and
Analytics solutions
leveraging pre-built
solution accelerators
Cloud,
Collaboration &
Analytics Technologies
Mobility,