best practices in experiential education measurement
TRANSCRIPT
In the following report, Hanover reviews literature on
experiential education measurement in order to identify
best practices and effective strategies for tracking
community-based impact.
BEST PRACTICES IN EXPERIENTIAL EDUCATION MEASUREMENTPrepared for New York Institute of
Technology
June 2020
HIGHER EDUCATION 2
TABLE OF CONTENTS
3 / Executive Summary
4 / Research Questions and Methodology
5 / Overview
6 / Trends in Experiential Education Measurement
7 / Measuring Skills Development
8 / Measuring Professional Impact/Community Impact
10 / Case Profiles
13 / Appendix
HIGHER EDUCATION 3
EXECUTIVE SUMMARY
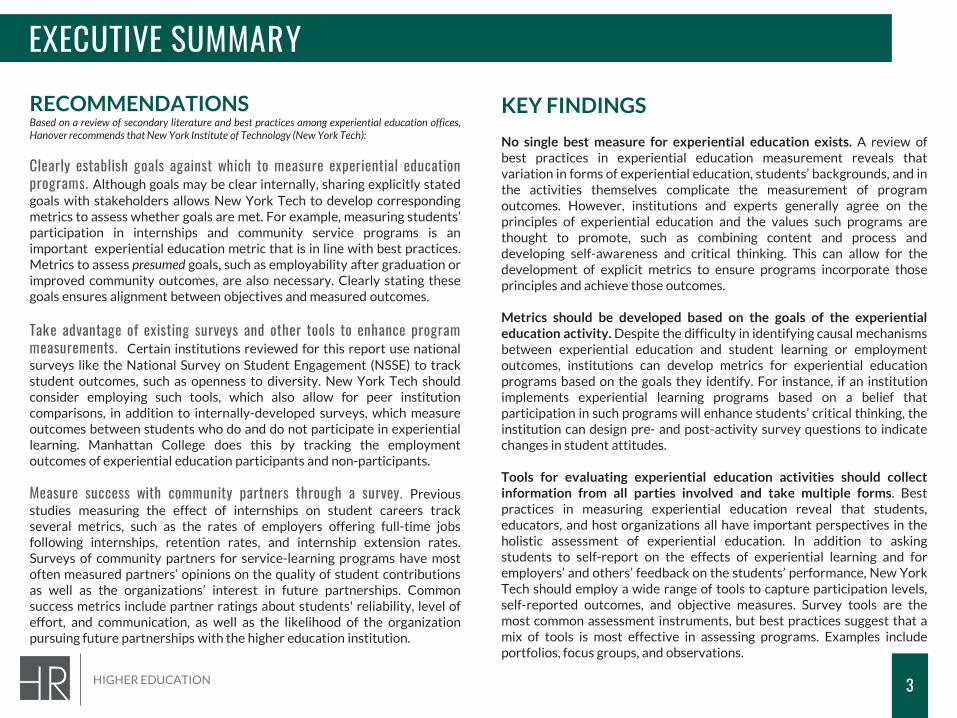
RECOMMENDATIONSBased on a review of secondary literature and best practices among experiential education offices,Hanover recommends that New York Institute of Technology (New York Tech):
Clearly establish goals against which to measure experiential educationprograms. Although goals may be clear internally, sharing explicitly statedgoals with stakeholders allows New York Tech to develop correspondingmetrics to assess whether goals are met. For example, measuring students’participation in internships and community service programs is animportant experiential education metric that is in line with best practices.Metrics to assess presumed goals, such as employability after graduation orimproved community outcomes, are also necessary. Clearly stating thesegoals ensures alignment between objectives and measured outcomes.
Take advantage of existing surveys and other tools to enhance programmeasurements. Certain institutions reviewed for this report use nationalsurveys like the National Survey on Student Engagement (NSSE) to trackstudent outcomes, such as openness to diversity. New York Tech shouldconsider employing such tools, which also allow for peer institutioncomparisons, in addition to internally-developed surveys, which measureoutcomes between students who do and do not participate in experientiallearning. Manhattan College does this by tracking the employmentoutcomes of experiential education participants and non-participants.
Measure success with community partners through a survey. Previousstudies measuring the effect of internships on student careers trackseveral metrics, such as the rates of employers offering full-time jobsfollowing internships, retention rates, and internship extension rates.Surveys of community partners for service-learning programs have mostoften measured partners’ opinions on the quality of student contributionsas well as the organizations’ interest in future partnerships. Commonsuccess metrics include partner ratings about students' reliability, level ofeffort, and communication, as well as the likelihood of the organizationpursuing future partnerships with the higher education institution.
KEY FINDINGS
No single best measure for experiential education exists. A review ofbest practices in experiential education measurement reveals thatvariation in forms of experiential education, students’ backgrounds, and inthe activities themselves complicate the measurement of programoutcomes. However, institutions and experts generally agree on theprinciples of experiential education and the values such programs arethought to promote, such as combining content and process anddeveloping self-awareness and critical thinking. This can allow for thedevelopment of explicit metrics to ensure programs incorporate thoseprinciples and achieve those outcomes.
Metrics should be developed based on the goals of the experientialeducation activity. Despite the difficulty in identifying causal mechanismsbetween experiential education and student learning or employmentoutcomes, institutions can develop metrics for experiential educationprograms based on the goals they identify. For instance, if an institutionimplements experiential learning programs based on a belief thatparticipation in such programs will enhance students’ critical thinking, theinstitution can design pre- and post-activity survey questions to indicatechanges in student attitudes.
Tools for evaluating experiential education activities should collectinformation from all parties involved and take multiple forms. Bestpractices in measuring experiential education reveal that students,educators, and host organizations all have important perspectives in theholistic assessment of experiential education. In addition to askingstudents to self-report on the effects of experiential learning and foremployers’ and others’ feedback on the students’ performance, New YorkTech should employ a wide range of tools to capture participation levels,self-reported outcomes, and objective measures. Survey tools are themost common assessment instruments, but best practices suggest that amix of tools is most effective in assessing programs. Examples includeportfolios, focus groups, and observations.
HIGHER EDUCATION 4
RESEARCH QUESTIONS AND METHODOLOGY
METHODOLOGY
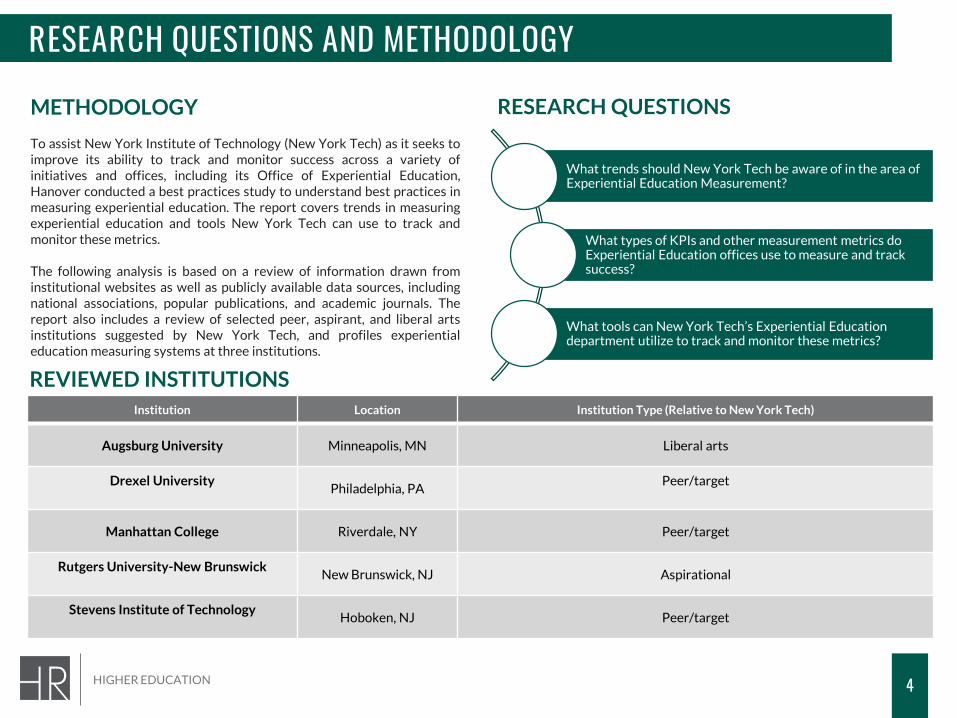
To assist New York Institute of Technology (New York Tech) as it seeks toimprove its ability to track and monitor success across a variety ofinitiatives and offices, including its Office of Experiential Education,Hanover conducted a best practices study to understand best practices inmeasuring experiential education. The report covers trends in measuringexperiential education and tools New York Tech can use to track andmonitor these metrics.
The following analysis is based on a review of information drawn frominstitutional websites as well as publicly available data sources, includingnational associations, popular publications, and academic journals. Thereport also includes a review of selected peer, aspirant, and liberal artsinstitutions suggested by New York Tech, and profiles experientialeducation measuring systems at three institutions.
RESEARCH QUESTIONS
What trends should New York Tech be aware of in the area of Experiential Education Measurement?
What types of KPIs and other measurement metrics do Experiential Education offices use to measure and track success?
What tools can New York Tech’s Experiential Education department utilize to track and monitor these metrics?
Institution Location Institution Type (Relative to New York Tech)
Augsburg University Minneapolis, MN Liberal arts
Drexel UniversityPhiladelphia, PA
Peer/target
Manhattan College Riverdale, NY Peer/target
Rutgers University-New BrunswickNew Brunswick, NJ Aspirational
Stevens Institute of TechnologyHoboken, NJ Peer/target
REVIEWED INSTITUTIONS
HIGHER EDUCATION 5
OVERVIEW
OVERVIEW
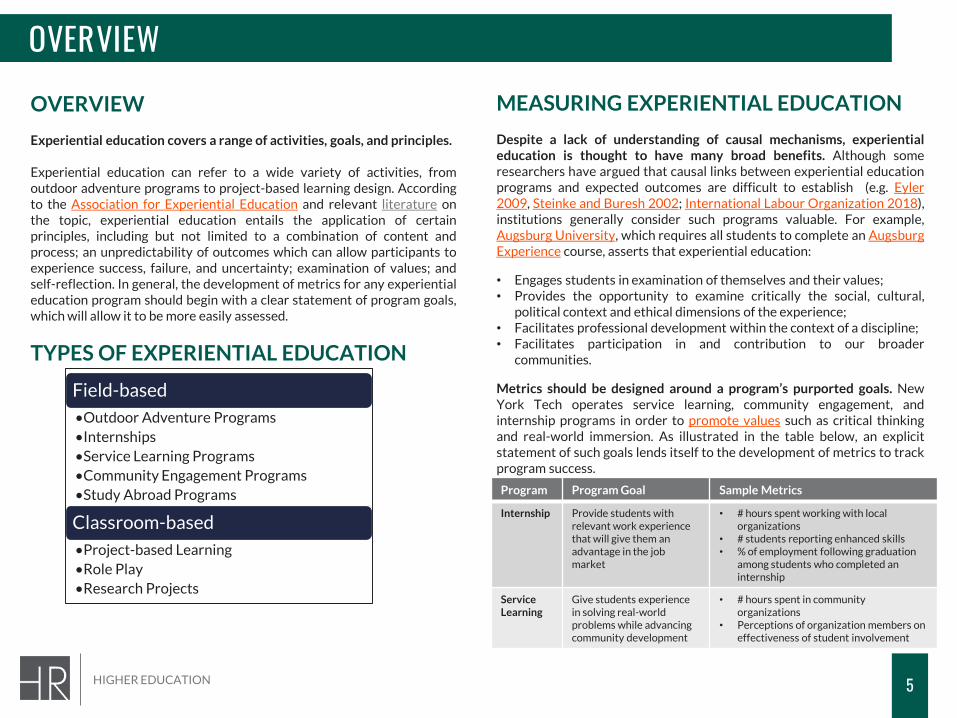
Experiential education covers a range of activities, goals, and principles.
Experiential education can refer to a wide variety of activities, fromoutdoor adventure programs to project-based learning design. Accordingto the Association for Experiential Education and relevant literature onthe topic, experiential education entails the application of certainprinciples, including but not limited to a combination of content andprocess; an unpredictability of outcomes which can allow participants toexperience success, failure, and uncertainty; examination of values; andself-reflection. In general, the development of metrics for any experientialeducation program should begin with a clear statement of program goals,which will allow it to be more easily assessed.
TYPES OF EXPERIENTIAL EDUCATION
Field-based
•Outdoor Adventure Programs
•Internships
•Service Learning Programs
•Community Engagement Programs
•Study Abroad Programs
Classroom-based
•Project-based Learning
•Role Play
•Research Projects
MEASURING EXPERIENTIAL EDUCATION
Despite a lack of understanding of causal mechanisms, experientialeducation is thought to have many broad benefits. Although someresearchers have argued that causal links between experiential educationprograms and expected outcomes are difficult to establish (e.g. Eyler2009, Steinke and Buresh 2002; International Labour Organization 2018),institutions generally consider such programs valuable. For example,Augsburg University, which requires all students to complete an AugsburgExperience course, asserts that experiential education:
• Engages students in examination of themselves and their values;• Provides the opportunity to examine critically the social, cultural,
political context and ethical dimensions of the experience;• Facilitates professional development within the context of a discipline;• Facilitates participation in and contribution to our broader
communities.
Metrics should be designed around a program’s purported goals. NewYork Tech operates service learning, community engagement, andinternship programs in order to promote values such as critical thinkingand real-world immersion. As illustrated in the table below, an explicitstatement of such goals lends itself to the development of metrics to trackprogram success.
Program Program Goal Sample Metrics
Internship Provide students with relevant work experience that will give them an advantage in the job market
• # hours spent working with local organizations
• # students reporting enhanced skills• % of employment following graduation
among students who completed an internship
Service Learning
Give students experience in solving real-world problems while advancing community development
• # hours spent in community organizations
• Perceptions of organization members on effectiveness of student involvement
HIGHER EDUCATION 6
TRENDS IN EXPERIENTIAL EDUCATION MEASUREMENT
DEFINING AUDIENCE AND OUTCOMES
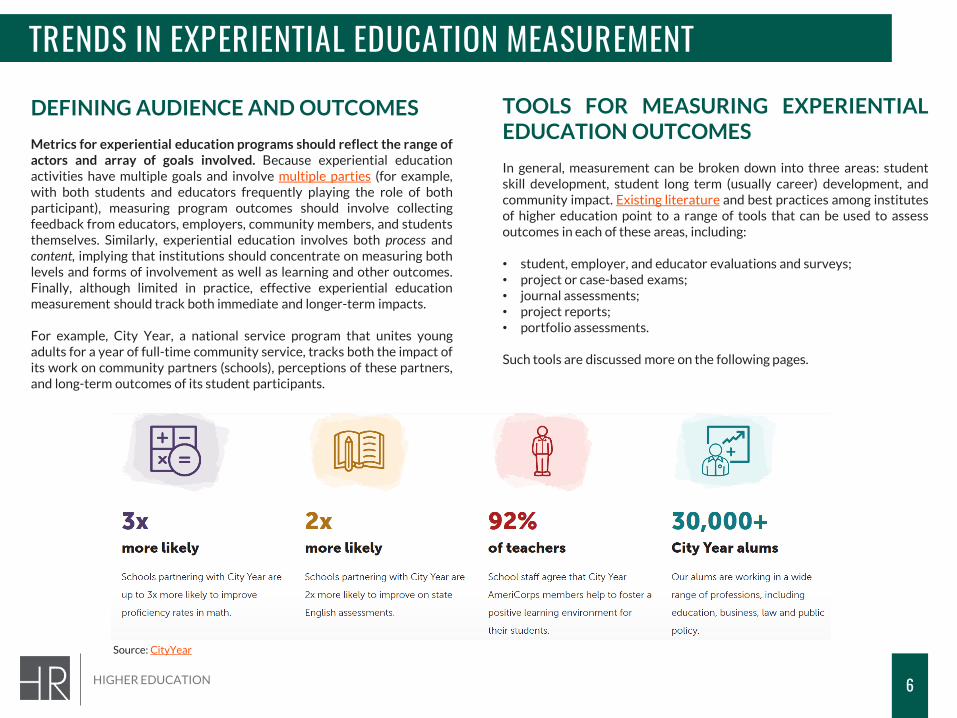
Metrics for experiential education programs should reflect the range ofactors and array of goals involved. Because experiential educationactivities have multiple goals and involve multiple parties (for example,with both students and educators frequently playing the role of bothparticipant), measuring program outcomes should involve collectingfeedback from educators, employers, community members, and studentsthemselves. Similarly, experiential education involves both process andcontent, implying that institutions should concentrate on measuring bothlevels and forms of involvement as well as learning and other outcomes.Finally, although limited in practice, effective experiential educationmeasurement should track both immediate and longer-term impacts.
For example, City Year, a national service program that unites youngadults for a year of full-time community service, tracks both the impact ofits work on community partners (schools), perceptions of these partners,and long-term outcomes of its student participants.
TOOLS FOR MEASURING EXPERIENTIALEDUCATION OUTCOMES
In general, measurement can be broken down into three areas: studentskill development, student long term (usually career) development, andcommunity impact. Existing literature and best practices among institutesof higher education point to a range of tools that can be used to assessoutcomes in each of these areas, including:
• student, employer, and educator evaluations and surveys;• project or case-based exams;• journal assessments;• project reports;• portfolio assessments.
Such tools are discussed more on the following pages.
Source: CityYear
HIGHER EDUCATION 7
MEASURING SKILLS DEVELOPMENT
AREAS OF MEASUREMENT
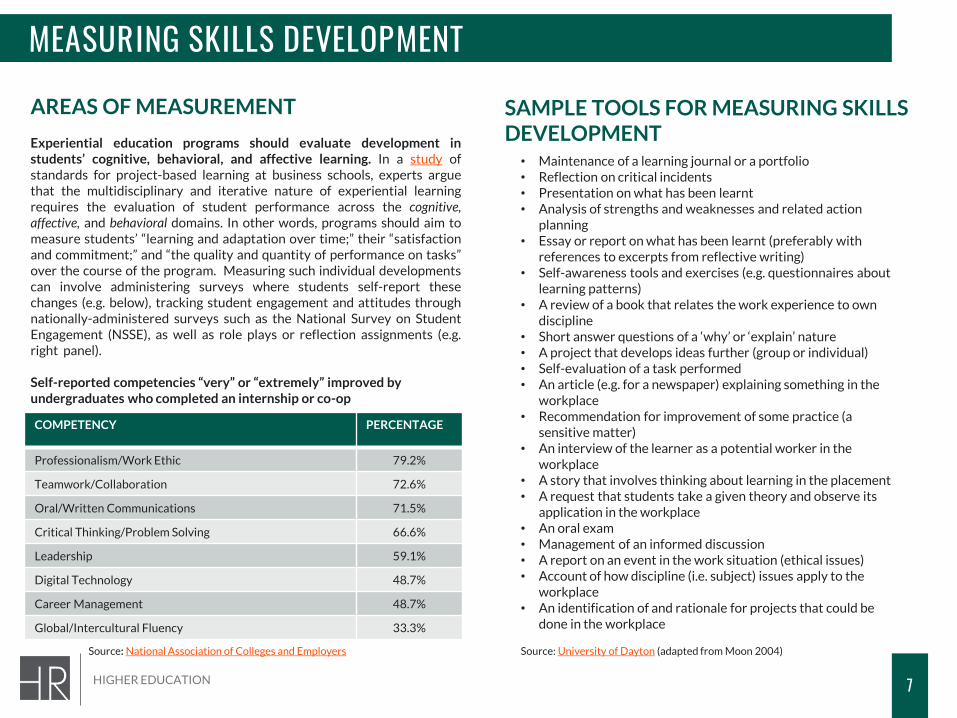
Experiential education programs should evaluate development instudents’ cognitive, behavioral, and affective learning. In a study ofstandards for project-based learning at business schools, experts arguethat the multidisciplinary and iterative nature of experiential learningrequires the evaluation of student performance across the cognitive,affective, and behavioral domains. In other words, programs should aim tomeasure students’ “learning and adaptation over time;” their “satisfactionand commitment;” and “the quality and quantity of performance on tasks”over the course of the program. Measuring such individual developmentscan involve administering surveys where students self-report thesechanges (e.g. below), tracking student engagement and attitudes throughnationally-administered surveys such as the National Survey on StudentEngagement (NSSE), as well as role plays or reflection assignments (e.g.right panel).
Self-reported competencies “very” or “extremely” improved by undergraduates who completed an internship or co-op
• Maintenance of a learning journal or a portfolio • Reflection on critical incidents • Presentation on what has been learnt • Analysis of strengths and weaknesses and related action
planning • Essay or report on what has been learnt (preferably with
references to excerpts from reflective writing) • Self-awareness tools and exercises (e.g. questionnaires about
learning patterns) • A review of a book that relates the work experience to own
discipline • Short answer questions of a ‘why’ or ‘explain’ nature • A project that develops ideas further (group or individual) • Self-evaluation of a task performed • An article (e.g. for a newspaper) explaining something in the
workplace • Recommendation for improvement of some practice (a
sensitive matter) • An interview of the learner as a potential worker in the
workplace • A story that involves thinking about learning in the placement • A request that students take a given theory and observe its
application in the workplace • An oral exam • Management of an informed discussion • A report on an event in the work situation (ethical issues) • Account of how discipline (i.e. subject) issues apply to the
workplace• An identification of and rationale for projects that could be
done in the workplace
SAMPLE TOOLS FOR MEASURING SKILLS DEVELOPMENT
Source: National Association of Colleges and Employers Source: University of Dayton (adapted from Moon 2004)
COMPETENCY PERCENTAGE
Professionalism/Work Ethic 79.2%
Teamwork/Collaboration 72.6%
Oral/Written Communications 71.5%
Critical Thinking/Problem Solving 66.6%
Leadership 59.1%
Digital Technology 48.7%
Career Management 48.7%
Global/Intercultural Fluency 33.3%
HIGHER EDUCATION 8
MEASURING PROFESSIONAL IMPACT/COMMUNITY IMPACT
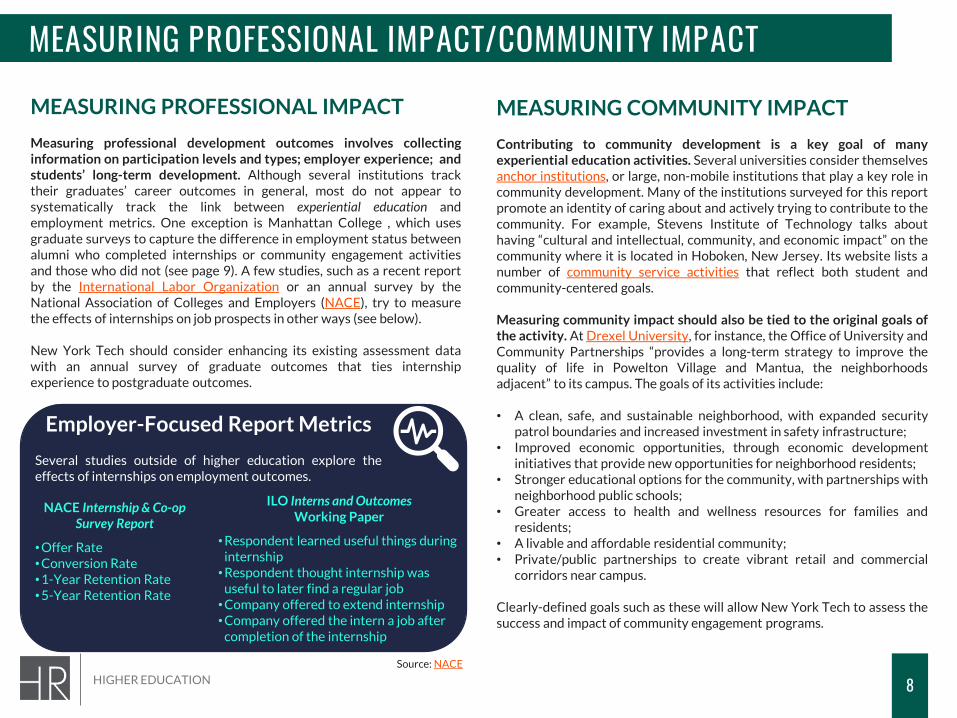
MEASURING PROFESSIONAL IMPACT
Measuring professional development outcomes involves collectinginformation on participation levels and types; employer experience; andstudents’ long-term development. Although several institutions tracktheir graduates’ career outcomes in general, most do not appear tosystematically track the link between experiential education andemployment metrics. One exception is Manhattan College , which usesgraduate surveys to capture the difference in employment status betweenalumni who completed internships or community engagement activitiesand those who did not (see page 9). A few studies, such as a recent reportby the International Labor Organization or an annual survey by theNational Association of Colleges and Employers (NACE), try to measurethe effects of internships on job prospects in other ways (see below).
New York Tech should consider enhancing its existing assessment datawith an annual survey of graduate outcomes that ties internshipexperience to postgraduate outcomes.
MEASURING COMMUNITY IMPACT
Contributing to community development is a key goal of manyexperiential education activities. Several universities consider themselvesanchor institutions, or large, non-mobile institutions that play a key role incommunity development. Many of the institutions surveyed for this reportpromote an identity of caring about and actively trying to contribute to thecommunity. For example, Stevens Institute of Technology talks abouthaving “cultural and intellectual, community, and economic impact” on thecommunity where it is located in Hoboken, New Jersey. Its website lists anumber of community service activities that reflect both student andcommunity-centered goals.
Measuring community impact should also be tied to the original goals ofthe activity. At Drexel University, for instance, the Office of University andCommunity Partnerships “provides a long-term strategy to improve thequality of life in Powelton Village and Mantua, the neighborhoodsadjacent” to its campus. The goals of its activities include:
• A clean, safe, and sustainable neighborhood, with expanded securitypatrol boundaries and increased investment in safety infrastructure;
• Improved economic opportunities, through economic developmentinitiatives that provide new opportunities for neighborhood residents;
• Stronger educational options for the community, with partnerships withneighborhood public schools;
• Greater access to health and wellness resources for families andresidents;
• A livable and affordable residential community;• Private/public partnerships to create vibrant retail and commercial
corridors near campus.
Clearly-defined goals such as these will allow New York Tech to assess thesuccess and impact of community engagement programs.
NACE Internship & Co-op Survey Report
•Offer Rate•Conversion Rate•1-Year Retention Rate•5-Year Retention Rate
Employer-Focused Report Metrics
Several studies outside of higher education explore theeffects of internships on employment outcomes.
Source: NACE
ILO Interns and Outcomes Working Paper
•Respondent learned useful things during internship•Respondent thought internship was
useful to later find a regular job•Company offered to extend internship•Company offered the intern a job after
completion of the internship
HIGHER EDUCATION 9
MEASURING PROFESSIONAL IMPACT/COMMUNITY IMPACT
SERVICE LEARNING ASSESSMENT
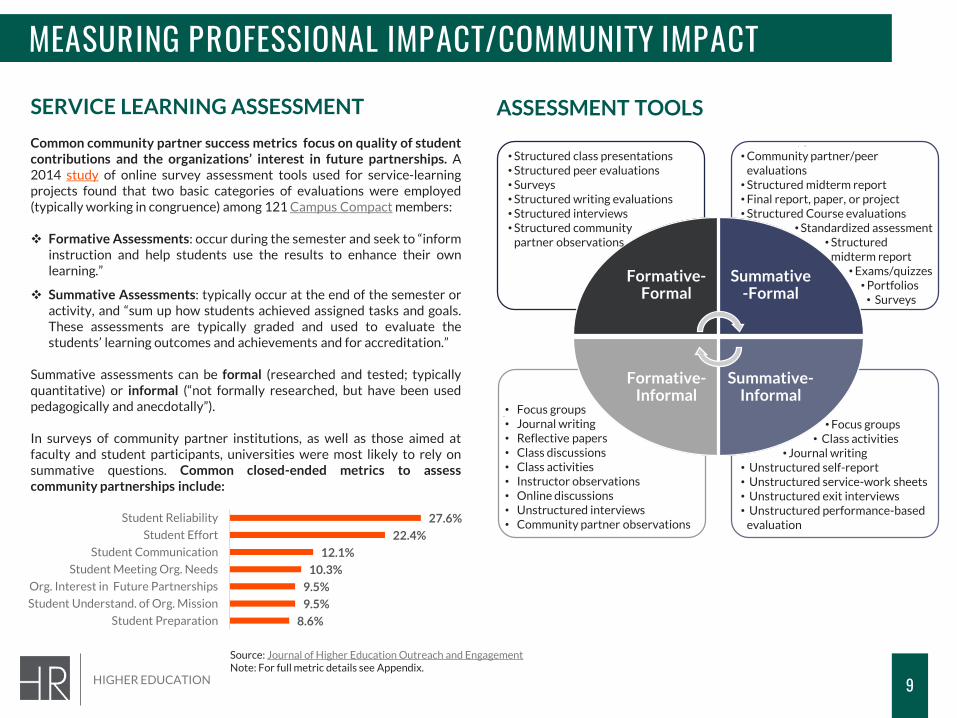
Common community partner success metrics focus on quality of studentcontributions and the organizations’ interest in future partnerships. A2014 study of online survey assessment tools used for service-learningprojects found that two basic categories of evaluations were employed(typically working in congruence) among 121 Campus Compact members:
❖ Formative Assessments: occur during the semester and seek to “informinstruction and help students use the results to enhance their ownlearning.”
❖ Summative Assessments: typically occur at the end of the semester oractivity, and “sum up how students achieved assigned tasks and goals.These assessments are typically graded and used to evaluate thestudents’ learning outcomes and achievements and for accreditation.”
Summative assessments can be formal (researched and tested; typicallyquantitative) or informal (“not formally researched, but have been usedpedagogically and anecdotally”).
In surveys of community partner institutions, as well as those aimed atfaculty and student participants, universities were most likely to rely onsummative questions. Common closed-ended metrics to assesscommunity partnerships include:
ASSESSMENT TOOLS
Source: Journal of Higher Education Outreach and EngagementNote: For full metric details see Appendix.
TheThe
• The
Formative-Formal
Summative-Formal
Summative-Informal
Formative-Informal
•Structured class presentations•Structured peer evaluations•Surveys•Structured writing evaluations•Structured interviews•Structured community
partner observations
• Focus groups• Journal writing• Reflective papers• Class discussions• Class activities• Instructor observations• Online discussions• Unstructured interviews• Community partner observations
•Community partner/peer evaluations•Structured midterm report•Final report, paper, or project•Structured Course evaluations
•Standardized assessment•Structured
midterm report •Exams/quizzes•Portfolios• Surveys
•Focus groups• Class activities
• Journal writing• Unstructured self-report• Unstructured service-work sheets• Unstructured exit interviews• Unstructured performance-based
evaluation
8.6%
9.5%
9.5%
10.3%
12.1%
22.4%
27.6%
Student Preparation
Student Understand. of Org. Mission
Org. Interest in Future Partnerships
Student Meeting Org. Needs
Student Communication
Student Effort
Student Reliability
HIGHER EDUCATION
CASE PROFILE: MANHATTAN COLLEGE
10
INTERNSHIP AND COMMUNITY ENGAGEMENT METRICS
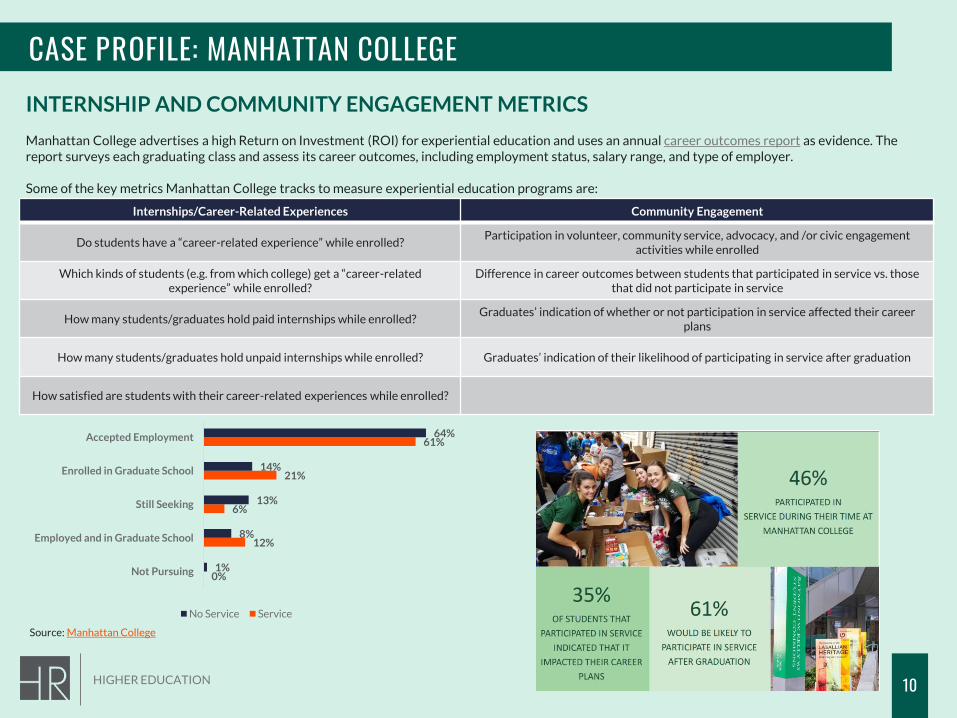
Manhattan College advertises a high Return on Investment (ROI) for experiential education and uses an annual career outcomes report as evidence. The report surveys each graduating class and assess its career outcomes, including employment status, salary range, and type of employer.
Some of the key metrics Manhattan College tracks to measure experiential education programs are:
Internships/Career-Related Experiences Community Engagement
Do students have a “career-related experience” while enrolled?Participation in volunteer, community service, advocacy, and /or civic engagement
activities while enrolled
Which kinds of students (e.g. from which college) get a “career-related experience” while enrolled?
Difference in career outcomes between students that participated in service vs. those that did not participate in service
How many students/graduates hold paid internships while enrolled?Graduates’ indication of whether or not participation in service affected their career
plans
How many students/graduates hold unpaid internships while enrolled? Graduates’ indication of their likelihood of participating in service after graduation
How satisfied are students with their career-related experiences while enrolled?
Source: Manhattan College
0%
12%
6%
21%
61%
1%
8%
13%
14%
64%
Not Pursuing
Employed and in Graduate School
Still Seeking
Enrolled in Graduate School
Accepted Employment
No Service Service
HIGHER EDUCATION
CASE PROFILE: LOYOLA UNIVERSITY CHICAGO
11
TRACKING OUTCOMES
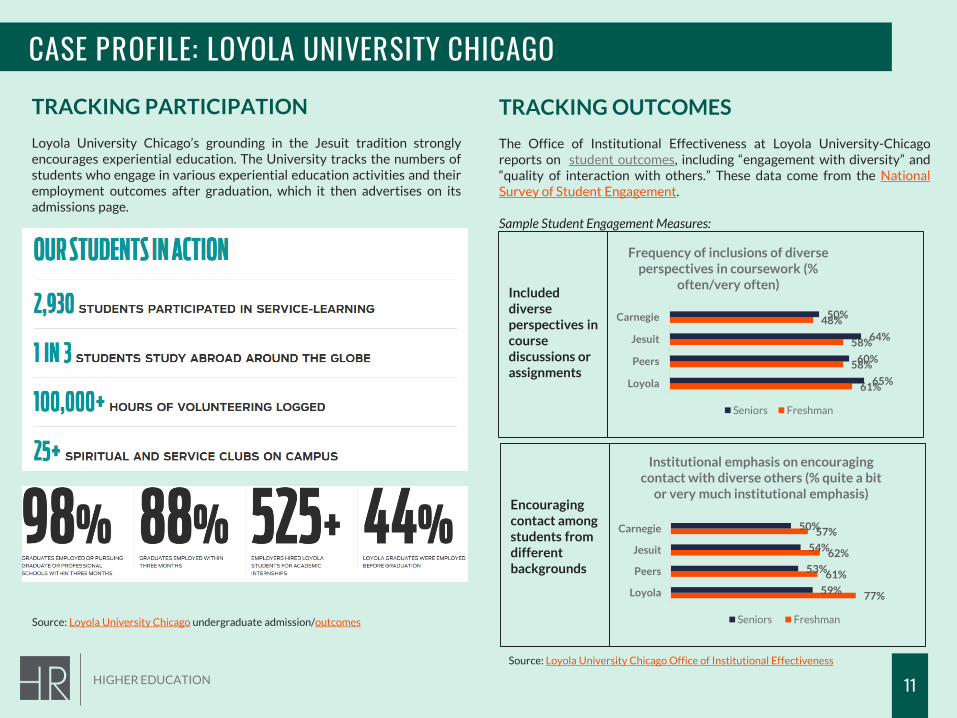
The Office of Institutional Effectiveness at Loyola University-Chicagoreports on student outcomes, including “engagement with diversity” and“quality of interaction with others.” These data come from the NationalSurvey of Student Engagement.
Sample Student Engagement Measures:
Source: Loyola University Chicago Office of Institutional Effectiveness
TRACKING PARTICIPATION
Loyola University Chicago’s grounding in the Jesuit tradition stronglyencourages experiential education. The University tracks the numbers ofstudents who engage in various experiential education activities and theiremployment outcomes after graduation, which it then advertises on itsadmissions page.
Source: Loyola University Chicago undergraduate admission/outcomes
61%
58%
58%
48%
65%
60%
64%
50%
Loyola
Peers
Jesuit
Carnegie
Frequency of inclusions of diverse perspectives in coursework (%
often/very often)
Seniors Freshman
Included diverse perspectives in course discussions or assignments
77%
61%
62%
57%
59%
53%
54%
50%
Loyola
Peers
Jesuit
Carnegie
Institutional emphasis on encouraging contact with diverse others (% quite a bit
or very much institutional emphasis)
Seniors Freshman
Encouraging contact among students from different backgrounds
HIGHER EDUCATION
CASE PROFILE: RUTGERS UNIVERSITY – NEW BRUNSWICK
12
DEFINING PROGRAM GOALS
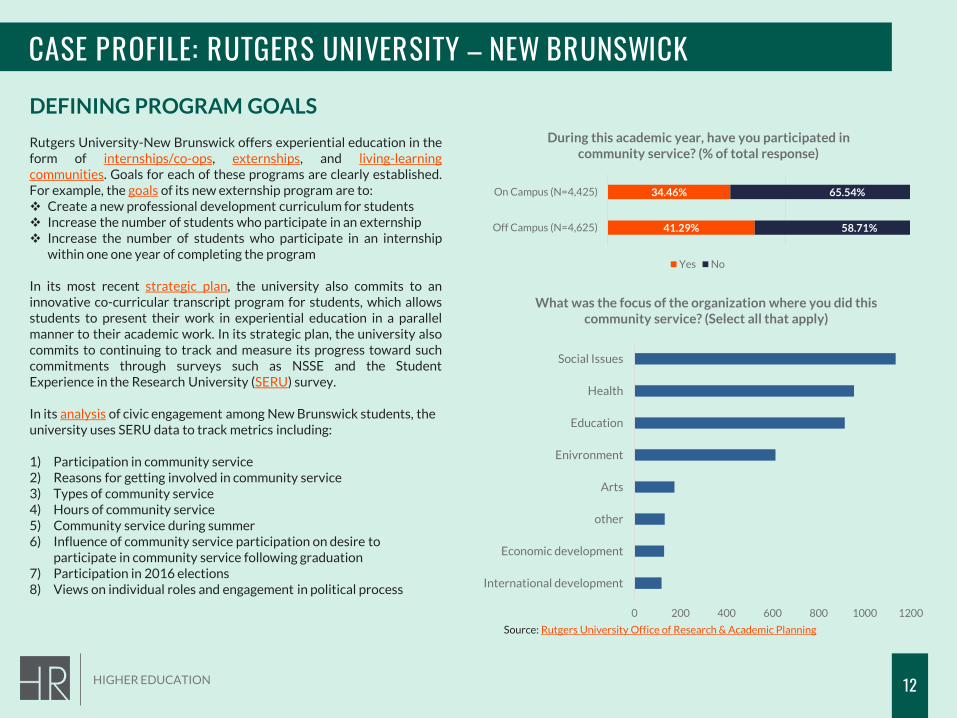
Rutgers University-New Brunswick offers experiential education in theform of internships/co-ops, externships, and living-learningcommunities. Goals for each of these programs are clearly established.For example, the goals of its new externship program are to:❖ Create a new professional development curriculum for students❖ Increase the number of students who participate in an externship❖ Increase the number of students who participate in an internship
within one one year of completing the program
In its most recent strategic plan, the university also commits to aninnovative co-curricular transcript program for students, which allowsstudents to present their work in experiential education in a parallelmanner to their academic work. In its strategic plan, the university alsocommits to continuing to track and measure its progress toward suchcommitments through surveys such as NSSE and the StudentExperience in the Research University (SERU) survey.
In its analysis of civic engagement among New Brunswick students, the university uses SERU data to track metrics including:
1) Participation in community service2) Reasons for getting involved in community service3) Types of community service4) Hours of community service5) Community service during summer6) Influence of community service participation on desire to
participate in community service following graduation7) Participation in 2016 elections8) Views on individual roles and engagement in political process
41.29%
34.46%
58.71%
65.54%
Off Campus (N=4,625)
On Campus (N=4,425)
During this academic year, have you participated in community service? (% of total response)
Yes No
0 200 400 600 800 1000 1200
International development
Economic development
other
Arts
Enivronment
Education
Health
Social Issues
What was the focus of the organization where you did this community service? (Select all that apply)
Source: Rutgers University Office of Research & Academic Planning
HIGHER EDUCATION 13
APPENDIX
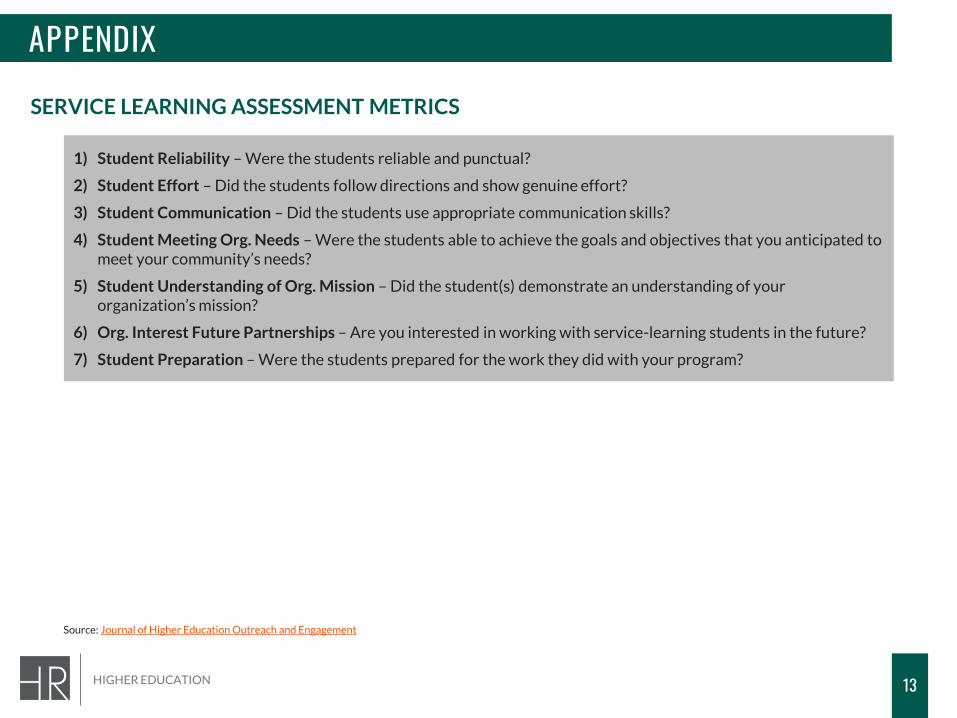
SERVICE LEARNING ASSESSMENT METRICS
Source: Journal of Higher Education Outreach and Engagement
1) Student Reliability – Were the students reliable and punctual?
2) Student Effort – Did the students follow directions and show genuine effort?
3) Student Communication – Did the students use appropriate communication skills?
4) Student Meeting Org. Needs – Were the students able to achieve the goals and objectives that you anticipated to meet your community’s needs?
5) Student Understanding of Org. Mission – Did the student(s) demonstrate an understanding of your organization’s mission?
6) Org. Interest Future Partnerships – Are you interested in working with service-learning students in the future?
7) Student Preparation – Were the students prepared for the work they did with your program?

CONTACT
E:
P:
hanoverresearch.com
Katie Johnson, Ph.D.Content Director
202.559.0050