best practices for using benchmarks to drive improved ... · leasing companies, ... with other...
TRANSCRIPT

Best Practices for Using Benchmarks to Drive Improved Dealership and Departmental Results
An examination of benchmarking for both financial and non-financial dealership managers.
WithPhil Kent, CPA and Partner at Michael Silver & Company CPAs
Moderated byMike Bowers, Executive Editor at DealersEdge
Best Practices for Using Benchmarks To Drive Improved Dealership and Departmental Results
Prepared for DealersEdge

Any U.S. federal tax advice included in this communication (including any attachments) was not intended or written to be used, and cannot be used, for purpose of (i) avoiding
U.S. federal tax-related penalties or (ii) promoting, marketing or recommending to another party any tax-related matter addressed herein. © 2012 Michael Silver & Company
CPAs
About Michael Silver & Company CPAs
3
Michael Silver & Company CPAs provides accounting & audit, tax consulting & compliance, and business advisory services to a broad range of local, national, and international clients. Our firm’s industry expertise includes: automobile dealerships, manufacturing, retail, professional services, vehicle and equipment leasing companies, and high net worth individuals. Specific service solution areas include: estates, gifts and trusts, business valuations, litigation support services, employee benefit plan services, investment advisory, retirement plan advice, and mergers and acquisitions. Founded in 1944, Michael Silver & Company’s growth and expansion are the direct result of our founder’s core principles: dedication to our clients; guidance in tax and business opportunities; expertise in the application of accounting principles; and a commitment to service with integrity. Michael Silver & Company is a member of the GMNInternational association of firms.

Any U.S. federal tax advice included in this communication (including any attachments) was not intended or written to be used, and cannot be used, for purpose of (i) avoiding
U.S. federal tax-related penalties or (ii) promoting, marketing or recommending to another party any tax-related matter addressed herein. © 2012 Michael Silver & Company
CPAs
4
Phil Kent, CPA – Partner
Phil joined Michael Silver & Company CPAs in 1984, and became an AuditPartner in 2004. He has 30 years of experience serving private, closely-held businesses and their stakeholders in the area of audits, reviews andcompilations, individual and business tax compliance and consulting, andaccounting and budgeting. Phil has spent over 25 years serving theautomobile dealership industry, providing value-added advice related tointernal controls evaluation and analysis, LIFO inventory management, andwith other dealership management consulting projects. Phil’s serviceapproach is focused on addressing and satisfying the critical and uniquecompliance issues facing his clients through one-on-one consultation, as wellas helping ensure that the dealership’s profits are retained andmaximized. Phil is a member of the American Institute of Certified PublicAccountants and the Illinois CPA Society. He holds a Bachelor of Science inAccountancy from the University of Illinois, Champaign-Urbana.
Today’s Presenter

Any U.S. federal tax advice included in this communication (including any attachments) was not intended or written to be used, and cannot be used, for purpose of (i) avoiding
U.S. federal tax-related penalties or (ii) promoting, marketing or recommending to another party any tax-related matter addressed herein. © 2012 Michael Silver & Company
CPAs
Purpose
5
The purpose of this webinar is to highlight and explore how to utilizebenchmarking in order to monitor and drive dealership results. Both financialand non-financial dealership staff can take advantage of and utilize theprinciples associated with benchmarking in order to manage dealershipswithin departments as well as across the organization. Benchmarks can beused to compare prior months’/yearly results, against competitors, as well asagainst expected industry performance levels. These quick results-based“snapshots” can also assist in making timely and important managementdecisions.

Agenda

Any U.S. federal tax advice included in this communication (including any attachments) was not intended or written to be used, and cannot be used, for purpose of (i) avoiding
U.S. federal tax-related penalties or (ii) promoting, marketing or recommending to another party any tax-related matter addressed herein. © 2012 Michael Silver & Company
CPAs
In This Webinar, You Will Learn
7
• What benchmarking is and is not.
• How benchmarking can manage results throughout the dealership.
• About different types of cross-dealership, departmental, and expense
benchmarks.
• How to compute certain key benchmarks.
• How to dig deeper when key benchmarks indicate the need.
• How to interpret and react to benchmark results.

Any U.S. federal tax advice included in this communication (including any attachments) was not intended or written to be used, and cannot be used, for purpose of (i) avoiding
U.S. federal tax-related penalties or (ii) promoting, marketing or recommending to another party any tax-related matter addressed herein. © 2012 Michael Silver & Company
CPAs
What Benchmarking Is
8
• An effective means of harvesting your factory financial statement for useful management information.
• A method to compare your dealership results to:
o Prior months’ and prior years’ results
o Competitor results
o Published industry standards
• An effective means of identifying trouble areas in your dealership, enabling quick management decisions and actions.

Any U.S. federal tax advice included in this communication (including any attachments) was not intended or written to be used, and cannot be used, for purpose of (i) avoiding
U.S. federal tax-related penalties or (ii) promoting, marketing or recommending to another party any tax-related matter addressed herein. © 2012 Michael Silver & Company
CPAs
What Benchmarking Is Not
9
• An exact science:
o Different dealers and different benchmark sources will set different benchmarks for the same calculations.
o Dealer-specific goals can alter benchmarks.
o An example would be a market share driven dealer accepting lower vehicle gross profit amounts.

Any U.S. federal tax advice included in this communication (including any attachments) was not intended or written to be used, and cannot be used, for purpose of (i) avoiding
U.S. federal tax-related penalties or (ii) promoting, marketing or recommending to another party any tax-related matter addressed herein. © 2012 Michael Silver & Company
CPAs
What Benchmarking Is Not
10
• Immune from the effect of "non-GAAP" or other accounting impacts to the results:
o LIFO
o “Packs”
o Manufacturer incentive programs
o Backend rebate programs, i.e. “stair step”
o Related party leases
o Other income – doc fees, other vehicle-related income
o Window dressing on the factory statements

Any U.S. federal tax advice included in this communication (including any attachments) was not intended or written to be used, and cannot be used, for purpose of (i) avoiding
U.S. federal tax-related penalties or (ii) promoting, marketing or recommending to another party any tax-related matter addressed herein. © 2012 Michael Silver & Company
CPAs
How Benchmarking Helps Manage Results
11
•Reliable benchmarks can be set and monitored for all dealership departments
(profit centers) and key expense categories.
• Factory financial statements can be difficult to read and interpret, particularly for non-accountants.
o These statements contain a great deal of data
o Benchmarking helps to organize this data
o The statements are not uniform from manufacturer to manufacturer. They each use their own unique form and style to present the information
Any U.S. federal tax advice included in this communication (including any attachments) was not intended or written to be used, and cannot be used, for purpose of (i) avoiding
U.S. federal tax-related penalties or (ii) promoting, marketing or recommending to another party any tax-related matter addressed herein. © 2012 Michael Silver & Company
CPAs
How Benchmarking Helps Manage Results
12
• To be successful, benchmarking must be completed on a timely basis and adhered to.
o Do not take the reports and file them in a drawer.
� Make department managers:
o Aware of benchmarks
o Involved in establishing benchmarks
o Most of all, accountable for identifying and taking corrective action for non-conforming benchmarks

Any U.S. federal tax advice included in this communication (including any attachments) was not intended or written to be used, and cannot be used, for purpose of (i) avoiding
U.S. federal tax-related penalties or (ii) promoting, marketing or recommending to another party any tax-related matter addressed herein. © 2012 Michael Silver & Company
CPAs
Different Types of Benchmarks
13
• Cross-dealership Benchmarks
o Global results -- gross profits, net income, other such things measured at the level of the entire dealership.
o These results answer the first question of “How are you doing?”
� If you are not making money, you are not doing well.
� If so, let's get to the departmental and expense levels to find out why.
• Departmental Benchmarks
o Again, the first question is “Are you making money?” or “Are you making as much money as you should be?”
o Compare the departmental gross profits to benchmarks. If sub-standard, then dig deeper by using sub-benchmarks for each department.
Any U.S. federal tax advice included in this communication (including any attachments) was not intended or written to be used, and cannot be used, for purpose of (i) avoiding
U.S. federal tax-related penalties or (ii) promoting, marketing or recommending to another party any tax-related matter addressed herein. © 2012 Michael Silver & Company
CPAs
Different Types of Benchmarks
14
• Expense Benchmarks
o Most dealerships have similar types of expenses, making benchmarking effective in determining if the expense levels are appropriate.
• First look at the larger expenses
o Rent Expense
o Personnel Expense
• Benchmarks are also available for other administrative costs
o Data processing
o Insurance
o Professional services
o Utilities
o Training

Any U.S. federal tax advice included in this communication (including any attachments) was not intended or written to be used, and cannot be used, for purpose of (i) avoiding
U.S. federal tax-related penalties or (ii) promoting, marketing or recommending to another party any tax-related matter addressed herein. © 2012 Michael Silver & Company
CPAs
How to Compute Certain Key Benchmarks
15
These are high-level benchmarks designed to assess the overall success or failure of the dealership. We have selected a few key benchmarks. There are many to choose from, but these are representative.
• To assist in this part of the webinar, we have included live data to use in the exercise:
o Dealership A – Successful, meeting most benchmarks
o Dealership B – Does not meet most benchmarks
• This creates a real visual example of how benchmarking can identify successes and failures.
• Preparation of a summary worksheet, including:
o Definition
o Benchmark standard
o Calculation
o Result – met or not

Any U.S. federal tax advice included in this communication (including any attachments) was not intended or written to be used, and cannot be used, for purpose of (i) avoiding
U.S. federal tax-related penalties or (ii) promoting, marketing or recommending to another party any tax-related matter addressed herein. © 2012 Michael Silver & Company
CPAs
How to Compute Certain Key Benchmarks
16
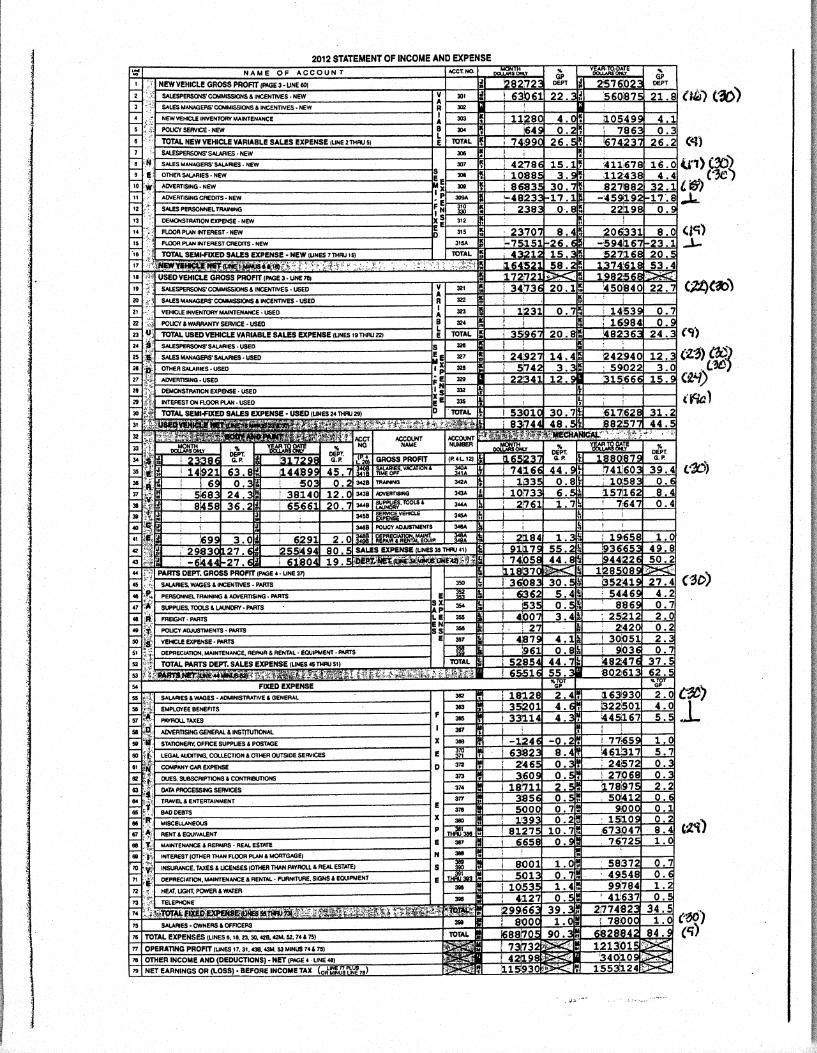
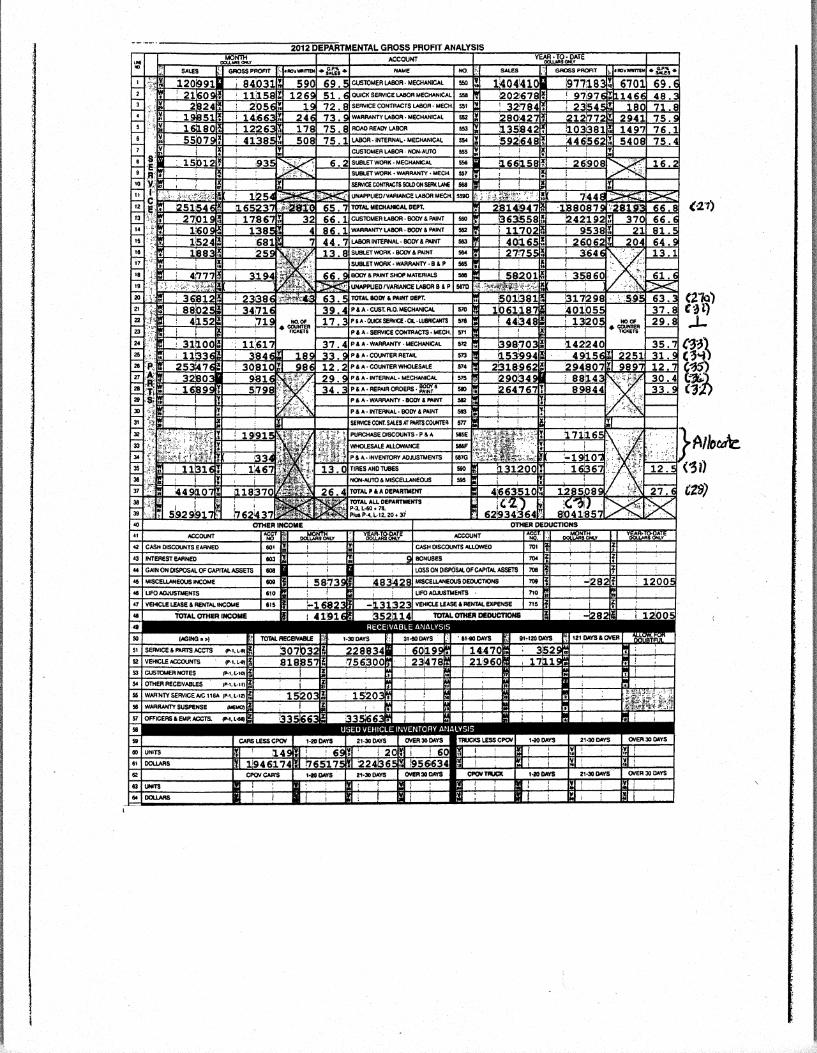
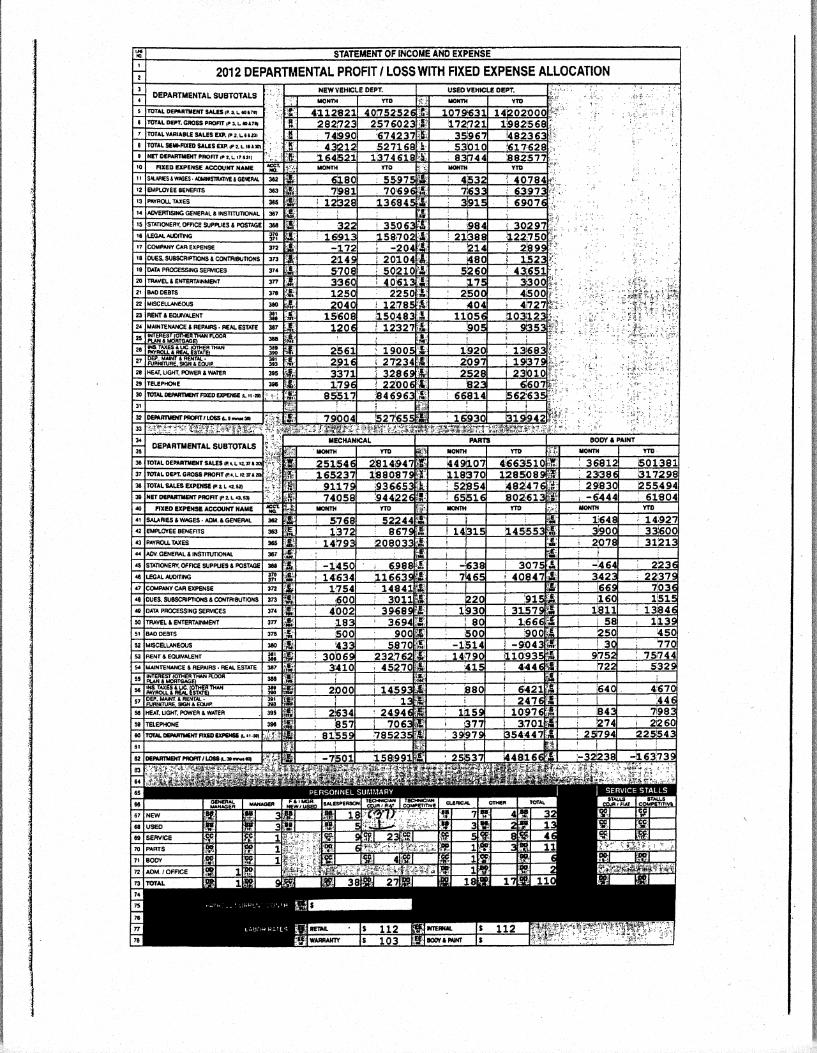
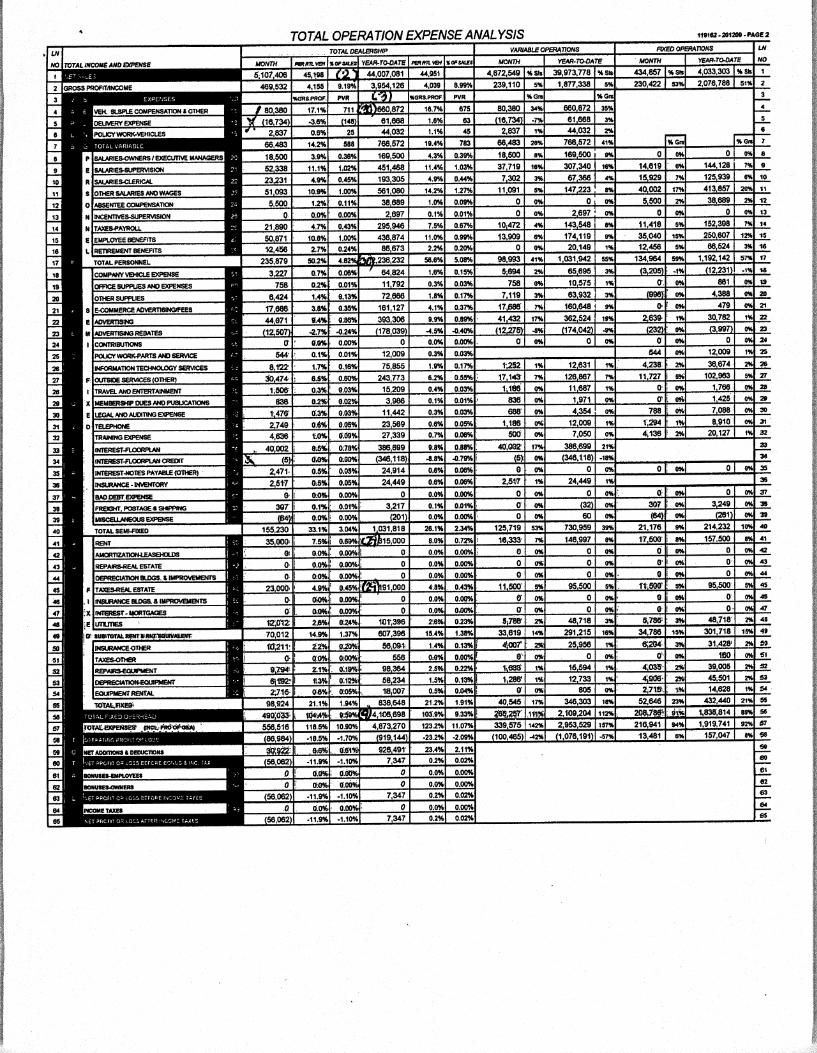
This looks like a real number crunch, and it is. This worksheet reduces benchmarking to a mechanical process that your office manager/accountant can assist with.
Failures are identified with a red “no” in the "met" column. Again, this creates a real effective visual in identifying problem areas.
Let's go through the benchmarks!

Any U.S. federal tax advice included in this communication (including any attachments) was not intended or written to be used, and cannot be used, for purpose of (i) avoiding
U.S. federal tax-related penalties or (ii) promoting, marketing or recommending to another party any tax-related matter addressed herein. © 2012 Michael Silver & Company
CPAs
Digging Deeper When Needed
17
• Identify the red “no's” on the key benchmark worksheet.
• Sometimes we will dig deeper on benchmark successes:
o What went right?
o Unexpected successes may be caused by accounting errors
• Digging deeper is simply designed to provide the why's (answers) to the what's (problems in the dealership).
• Focus areas in digging for answers:
o Gross profit levels
o Expense levels
o Personnel productivity
Let's do some digging!
Any U.S. federal tax advice included in this communication (including any attachments) was not intended or written to be used, and cannot be used, for purpose of (i) avoiding
U.S. federal tax-related penalties or (ii) promoting, marketing or recommending to another party any tax-related matter addressed herein. © 2012 Michael Silver & Company
CPAs
How to Interpret and React to the Results
18
•Benchmarking is of no use if you cannot effectively read and interpret the results.
• Benchmarking can be limited to specific areas. You can provide departmental managers benchmark reports that are only concerned with matters in which they have control.
• Even if you can effectively compute, read, and interpret benchmarks, again, it is of no use if you do not use that information to act:
o Hold managers accountable
o Meet and discuss benchmark results
o Include managers in the process of making corrective actions

Questions and Answers

Any U.S. federal tax advice included in this communication (including any attachments) was not intended or written to be used, and cannot be used, for purpose of (i) avoiding
U.S. federal tax-related penalties or (ii) promoting, marketing or recommending to another party any tax-related matter addressed herein. © 2012 Michael Silver & Company
CPAs
Contact Us
20
Post-webinar handout materials are available upon request. Please send an email to: [email protected] and include your name, title, organization, city/state.
Office Address
5750 Old Orchard Road, Suite 200
Skokie, IL 60077
Telephone: 847.982.2113 Fax: 847.982.0219
Website/Automobile Dealer Industry Pages:
www.msco.net
www.msco.net/industries-auto.html

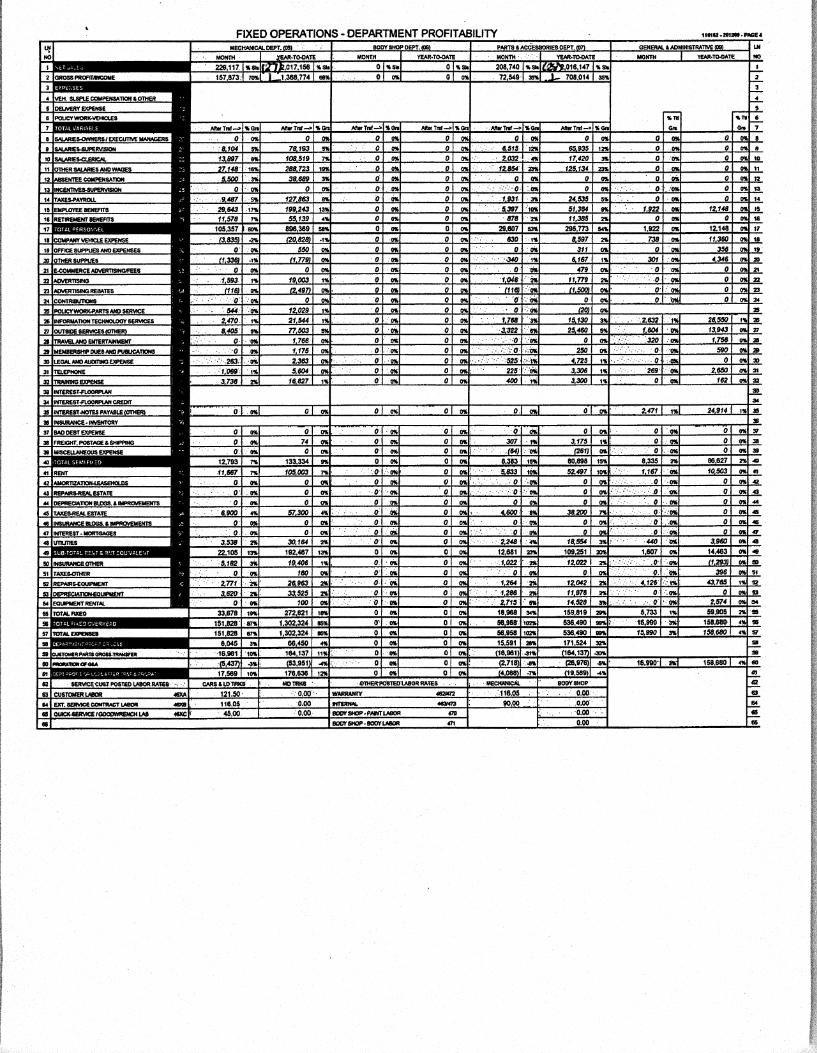
BenchmarkingKey Calculations
Benchmark Dealership A Dealership BDescription Ref Calculation Expectation Calculation Result Met? Calculation Result Met?
1 Overall Profitability
* Net income as a % of total sales (1) Net Income 1,553,124 7,347(2) Total Dealership Sales (plus doc fees) 2% ‐ 2.5% 63,269,884 2.45% Yes 44,163,721 0.02% No
* Net income as a % of gross profit (1) Net Income 1,553,124 7,347(3) Total Dealership Gross Profits 16% ‐ 20% 8,377,377 18.54% Yes 4,110,766 0.18% No
(plus doc fees)
* Return on controllable assets (8) Annualized net income 2,070,832 9,796divided by
(4) Total assets 20,131,716 13,834,049(5) ‐ Notes payable ‐ vehicles 12,642,896 10,485,570(6) ‐ Other assets 1,287,200 1,861,819(7) ‐ Cash 1,544,737 144,665
= Controllable assets 35% 4,656,883 44.47% Yes 1,341,995 0.73% No
* Return on equity (1) Net Income 1,553,124 7,347(1a),(10a) Total net worth plus LIFO 25% ‐ 35% 6,310,412 24.61% Yes 3,212,990 0.23% No
* Service and parts absorption (27),(27a), Service gross profit + parts gross profit(28) + body shop gross profit 3,483,266 2,076,788(9) Total fixed overhead expense 55% ‐ 60% 5,672,242 61.41% Yes 4,106,698 50.57% No
2 Healthy Balance Sheet
* Cash balance (7) Cash balance 1,544,737 144,665(9) Total average monthly expenses 1.5 ‐ 2 630,249 2.45 Yes 456,300 0.32 No
* Current ratio (7a),(10a) Current assets + LIFO reserve (B) 17,619,278 15,020,976(7b) Current liabilities 1.3 ‐ 1.4 13,819,296 1.27 No 11,807,828 1.27 No
* Inventory levels
New vehicles (10) New vehicle inventory count 396 244divided by
(11) New vehicles sold last 3 months90 45 ‐ 60 5.26 75.35 No 2.80 87.14 No

BenchmarkingKey Calculations
Benchmark Dealership A Dealership BDescription Ref Calculation Expectation Calculation Result Met? Calculation Result Met?
Used vehicles (12) Used vehicle inventory count 149 101divided by
(13) Used vehicles sold last 3 months90 45 ‐ 55 2.43 61.23 No 1.27 79.74 No
* Net debt equity (7c),(5) Total liabilities less floorplan 1,178,388 3,499,731(1a),(10a) Total net worth plus LIFO <1 6,310,412 0.19 Yes 3,212,990 1.09 No
3 Departmental Results
* New vehicles
(14) Total new vehicle gross profit Gross profit % (before F&I and including doc fees) 1,726,947 905,775
(14) Total new vehicle sales (incl doc fees) 4% ‐ 6% 39,743,734 4.35% Yes 26,618,341 3.40% No
Sales commissions (16) Total commissions 560,875 427,441(14) Total new vehicle gross profits 20% ‐ 25% 1,726,947 32.48% No 905,775 47.19% No
Sales supervision (17) Sales supervision salaries 411,678 152,693(14a),(46a) Total new vehicle gross profits (incl F&I) 12% ‐ 15% 2,798,423 14.71% Yes 1,183,775 12.90% Yes
Advertising expense (18) Advertising expense 368,690 258,424(14) Total new vehicle gross profits 15% 20% 1,726,947 21.35% No 905,775 28.53% No
Interest expense (19) Interest expense $0 ‐387,836 ‐387,836 Yes 1,008 1,008 Yes
* Used vehicles
(20) Total used vehicle gross profit Gross profit % (before F&I and including doc fees) 1,410,272 701,160
(21) Total used vehicle sales (incl doc fees) 9% ‐ 12% 10,472,272 13.47% Yes 7,872,563 8.91% No
Sales commissions (22) Total commissions 450,840 233,431(20) Total used vehicle gross profits 20% ‐ 25% 1,410,272 31.97% No 701,160 33.29% No

BenchmarkingKey Calculations
Benchmark Dealership A Dealership BDescription Ref Calculation Expectation Calculation Result Met? Calculation Result Met?
Sales supervision (23) Sales supervision expense 242,940 154,647(20a),(46b) Total used vehicle gross profits (incl F&I) 12% ‐ 15% 2,095,688 11.59% Yes 847,889 18.24% No
Advertising expense (24) Advertising expense 315,666 90,706(20) Total used vehicle gross profits 15% ‐ 20% 1,410,272 22.38% No 701,160 12.94% Yes
Interest expense (19a) Interest expense $0 0 0 Yes 39,573 39,573 No
* Finance and Insurance
Total profit per retail vehicle sold (25) Total F& I profits 1,753,981 424,729(26) Total new and used retail units sold $550 ‐ $650 2,097 $836.42 Yes 979 $433.84 No
* Service Department
Total gross profit % (27) Total service department gross profit 1,880,879 1,368,774(27) Total service department sales 65% ‐ 70% 2,814,947 66.82% Yes 2,017,156 67.86% Yes
* Body Shop
Total gross profit % (27a) Total body shop department gross profit 317,298(27a) Total body shop department sales 55% ‐ 60% 501,381 63.28% Yes N/A
* Parts Department
Total gross profit % (28) Total parts department gross profit 1,285,089 708,014(28) Total parts department sales 30% ‐ 32% 4,663,510 27.56% No 2,016,147 35.12% Yes
4 Key Expenses
* Rent Expense (29) Total rent expense 673,047 506,000(3) Gross Dealership Gross Profits 8% ‐ 10% 8,377,377 8.03% Yes 4,110,766 12.31% No
* Personnel Expense (30) Total personnel expense (incl sales) 4,086,312 2,897,104(3) Gross Dealership Gross Profits 50% ‐ 55% 8,377,377 48.78% Yes 4,110,766 70.48% No
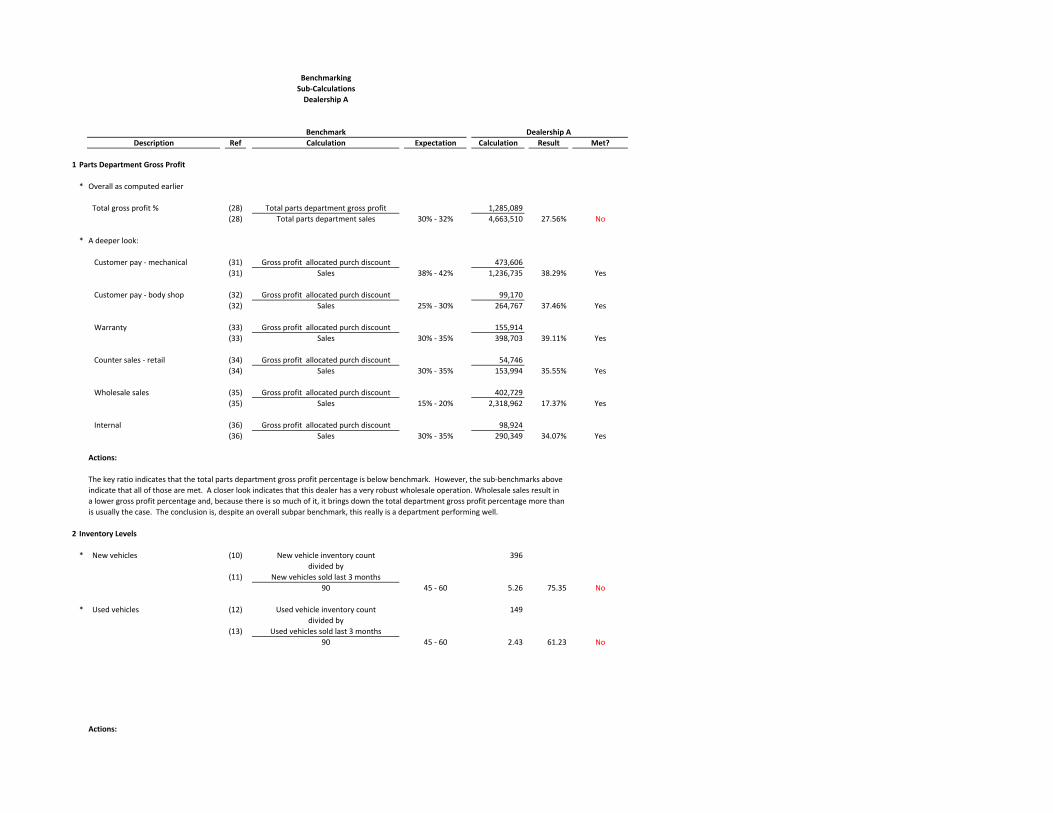
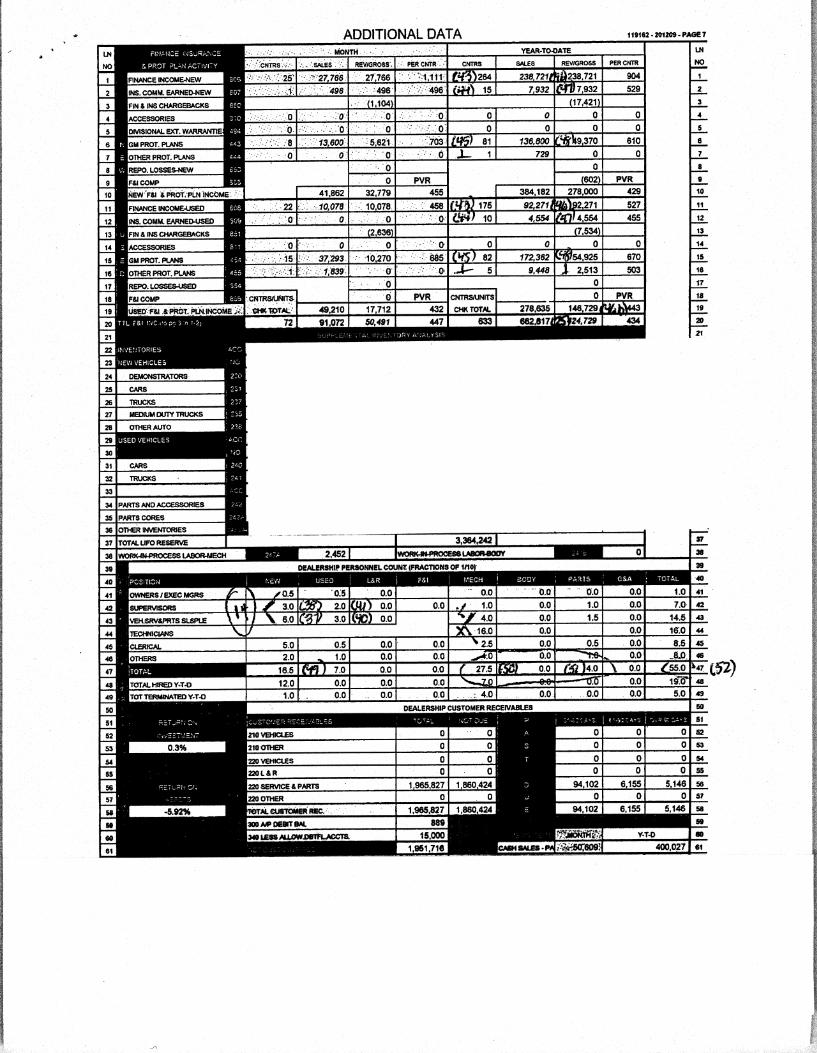
BenchmarkingSub‐CalculationsDealership A
Benchmark Dealership ADescription Ref Calculation Expectation Calculation Result Met?
1 Parts Department Gross Profit
* Overall as computed earlier
Total gross profit % (28) Total parts department gross profit 1,285,089(28) Total parts department sales 30% ‐ 32% 4,663,510 27.56% No
* A deeper look:
Customer pay ‐ mechanical (31) Gross profit allocated purch discount 473,606(31) Sales 38% ‐ 42% 1,236,735 38.29% Yes
Customer pay ‐ body shop (32) Gross profit allocated purch discount 99,170(32) Sales 25% ‐ 30% 264,767 37.46% Yes
Warranty (33) Gross profit allocated purch discount 155,914(33) Sales 30% ‐ 35% 398,703 39.11% Yes
Counter sales ‐ retail (34) Gross profit allocated purch discount 54,746(34) Sales 30% ‐ 35% 153,994 35.55% Yes
Wholesale sales (35) Gross profit allocated purch discount 402,729(35) Sales 15% ‐ 20% 2,318,962 17.37% Yes
Internal (36) Gross profit allocated purch discount 98,924(36) Sales 30% ‐ 35% 290,349 34.07% Yes
Actions:
The key ratio indicates that the total parts department gross profit percentage is below benchmark. However, the sub‐benchmarks aboveindicate that all of those are met. A closer look indicates that this dealer has a very robust wholesale operation. Wholesale sales result ina lower gross profit percentage and, because there is so much of it, it brings down the total department gross profit percentage more thanis usually the case. The conclusion is, despite an overall subpar benchmark, this really is a department performing well.
2 Inventory Levels
* New vehicles (10) New vehicle inventory count 396divided by
(11) New vehicles sold last 3 months90 45 ‐ 60 5.26 75.35 No
* Used vehicles (12) Used vehicle inventory count 149divided by
(13) Used vehicles sold last 3 months90 45 ‐ 60 2.43 61.23 No
Actions:
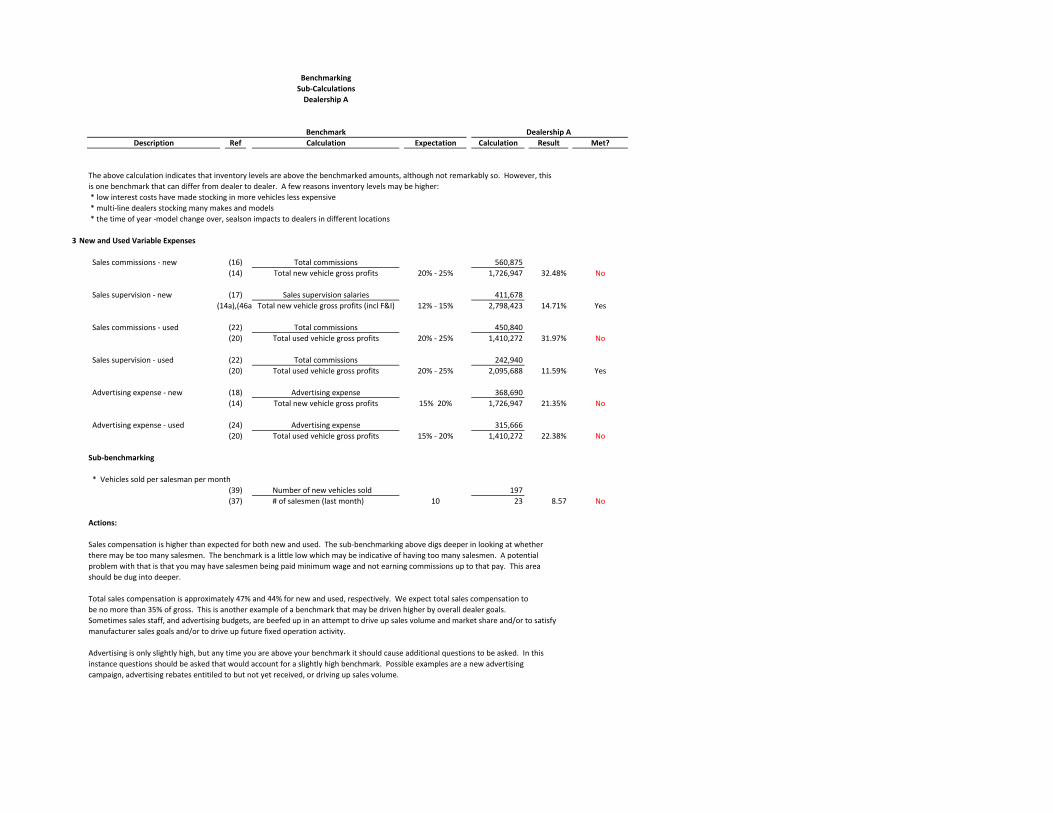
BenchmarkingSub‐CalculationsDealership A
Benchmark Dealership ADescription Ref Calculation Expectation Calculation Result Met?
The above calculation indicates that inventory levels are above the benchmarked amounts, although not remarkably so. However, this is one benchmark that can differ from dealer to dealer. A few reasons inventory levels may be higher: * low interest costs have made stocking in more vehicles less expensive * multi‐line dealers stocking many makes and models * the time of year ‐model change over, sealson impacts to dealers in different locations
3 New and Used Variable Expenses
Sales commissions ‐ new (16) Total commissions 560,875(14) Total new vehicle gross profits 20% ‐ 25% 1,726,947 32.48% No
Sales supervision ‐ new (17) Sales supervision salaries 411,678(14a),(46a Total new vehicle gross profits (incl F&I) 12% ‐ 15% 2,798,423 14.71% Yes
Sales commissions ‐ used (22) Total commissions 450,840(20) Total used vehicle gross profits 20% ‐ 25% 1,410,272 31.97% No
Sales supervision ‐ used (22) Total commissions 242,940(20) Total used vehicle gross profits 20% ‐ 25% 2,095,688 11.59% Yes
Advertising expense ‐ new (18) Advertising expense 368,690(14) Total new vehicle gross profits 15% 20% 1,726,947 21.35% No
Advertising expense ‐ used (24) Advertising expense 315,666(20) Total used vehicle gross profits 15% ‐ 20% 1,410,272 22.38% No
Sub‐benchmarking
* Vehicles sold per salesman per month(39) Number of new vehicles sold 197(37) # of salesmen (last month) 10 23 8.57 No
Actions:
Sales compensation is higher than expected for both new and used. The sub‐benchmarking above digs deeper in looking at whether there may be too many salesmen. The benchmark is a little low which may be indicative of having too many salesmen. A potentialproblem with that is that you may have salesmen being paid minimum wage and not earning commissions up to that pay. This areashould be dug into deeper.
Total sales compensation is approximately 47% and 44% for new and used, respectively. We expect total sales compensation tobe no more than 35% of gross. This is another example of a benchmark that may be driven higher by overall dealer goals.Sometimes sales staff, and advertising budgets, are beefed up in an attempt to drive up sales volume and market share and/or to satisfymanufacturer sales goals and/or to drive up future fixed operation activity.
Advertising is only slightly high, but any time you are above your benchmark it should cause additional questions to be asked. In thisinstance questions should be asked that would account for a slightly high benchmark. Possible examples are a new advertisingcampaign, advertising rebates entitiled to but not yet received, or driving up sales volume.
BenchmarkingSub‐CalculationsDealership B
Benchmark Dealership BDescription Ref Calculation Expectation Calculation Result Met?
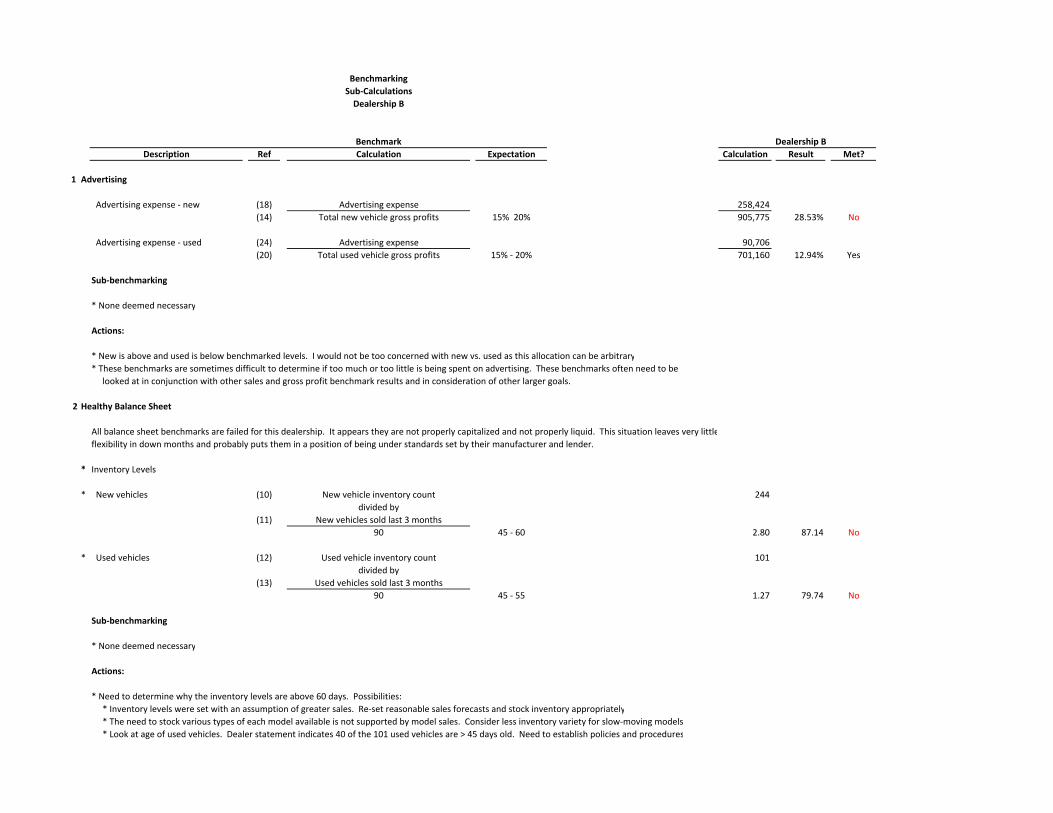
1 Advertising
Advertising expense ‐ new (18) Advertising expense 258,424(14) Total new vehicle gross profits 15% 20% 905,775 28.53% No
Advertising expense ‐ used (24) Advertising expense 90,706(20) Total used vehicle gross profits 15% ‐ 20% 701,160 12.94% Yes
Sub‐benchmarking
* None deemed necessary
Actions:
* New is above and used is below benchmarked levels. I would not be too concerned with new vs. used as this allocation can be arbitrary* These benchmarks are sometimes difficult to determine if too much or too little is being spent on advertising. These benchmarks often need to be looked at in conjunction with other sales and gross profit benchmark results and in consideration of other larger goals.
2 Healthy Balance Sheet
All balance sheet benchmarks are failed for this dealership. It appears they are not properly capitalized and not properly liquid. This situation leaves very littleflexibility in down months and probably puts them in a position of being under standards set by their manufacturer and lender.
* Inventory Levels
* New vehicles (10) New vehicle inventory count 244divided by
(11) New vehicles sold last 3 months90 45 ‐ 60 2.80 87.14 No
* Used vehicles (12) Used vehicle inventory count 101divided by
(13) Used vehicles sold last 3 months90 45 ‐ 55 1.27 79.74 No
Sub‐benchmarking
* None deemed necessary
Actions:
* Need to determine why the inventory levels are above 60 days. Possibilities: * Inventory levels were set with an assumption of greater sales. Re‐set reasonable sales forecasts and stock inventory appropriately * The need to stock various types of each model available is not supported by model sales. Consider less inventory variety for slow‐moving models * Look at age of used vehicles. Dealer statement indicates 40 of the 101 used vehicles are > 45 days old. Need to establish policies and procedures

BenchmarkingSub‐CalculationsDealership B
Benchmark Dealership BDescription Ref Calculation Expectation Calculation Result Met?
for either requiring salesman to move older vehicles and/or wholesale out.
3 New Vehicles
(14) Total new vehicle gross profit * Gross profit % (before F&I and including doc fees) 905,775
(14) Total new vehicle sales (incl doc fees) 4% ‐ 6% 26,618,341 3.40% No
* Sales commissions (16) Total commissions 427,441(14) Total new vehicle gross profits 20% ‐ 25% 905,775 47.19% No
Sales supervision (17) Sales supervision salaries 152,693(14) Total new vehicle gross profits (incl F&I) 12% ‐ 15% 1,183,775 12.90% Yes
Lets look at count and productivity
# of salesmen (last month) (37) 6 # of managers (last month) (38) 3 Number of new vehicles sold (39) 72
Sub‐benchmarking
* Vehicles sold per salesman per month 10 12 Yes * Ratio of salesmen to managers 5:1 2.00 No
Actions:
* It looks like they have approximately the right number of salesman* They have three managers for six salesmen which is excessive. They should have one or one and a half. It is difficult to determine how this benchmark is being met when the ratio of managers to salesmen is so off. Should investigate further* Look at pay plans of both the salesmen and the sales managers. Make sure they are not paying commissions over 25%, including spiff programs, and take a good look at the manager pay plans to be certain they are completely tied to grosses and not base pay that is not getting covered with gross profits.
4 Used Vehicles
(20) Total retail used vehicle gross profit Gross profit % (before F&I and including doc fees) 701,160
(21) Total retail used vehicle sales (incl doc fees) 9% ‐ 12% 7,872,563 8.91% No
Sales commissions (22) Total commissions 233,431(20) Total used vehicle gross profits 20% ‐ 25% 701,160 33.29% No
Sales supervision (23) Sales supervision expense 154,647

BenchmarkingSub‐CalculationsDealership B
Benchmark Dealership BDescription Ref Calculation Expectation Calculation Result Met?
(20) Total used vehicle gross profits (incl F&I) 12% ‐ 15% 847,889 18.24% No
Lets look at count and productivity
# of salesmen (last month) (40) 3 # of managers (last month) (41) 2 Number of new vehicles sold (42) 41
Sub‐benchmarking
* Vehicles sold per salesman per month 10 13.67 Yes * Ratio of salesmen to managers 5:1 1.50 No
Actions:
* It looks like they have approximately the right number of salesman. Maybe one could be added* They have two managers for three salesmen which is excessive. They should have one or one half a manager. It is possible that the information reported in the personnel section on the statement is incorrect.* Look at pay plans of both the salesmen and the sales managers. Make sure they are not paying commissions over 25% and take a good look at the manager pay plans to be certain they are completely tied to grosses and not base pay that is not getting covered with gross profits.
5 Finance and Insurance
Total profit per retail vehicle sold (25) Total F& I profits 424,729(26) Total new and used retail units sold $550 ‐ $650 979 $433.84 No
Sub‐benchmarking
* Penetration * Finance (43) Total contracts financed 439
Total new and used retail units sold 60% ‐ 70% 979 44.84% No
* Insurance (44) Total contracts sold 25Total new and used retail units sold 25% ‐ 30% 979 2.55% No
* Service Contracts (45) Total contracts sold 169Total new and used retail units sold 30% to 40% 979 17.26% No
* Contract Grosses * Finance (46) Total gross profits on contracts sold 330,992
(43) Number of contracts sold $700 ‐ $850 439 $753.97 Yes
* Insurance (47) Total gross profits on contracts sold 12,486(44) Number of contracts sold $300 ‐ $500 25 $499.44 Yes

BenchmarkingSub‐CalculationsDealership B
Benchmark Dealership BDescription Ref Calculation Expectation Calculation Result Met?
* Service Contracts (48) Total gross profits on contracts sold 106,808(45) Number of contracts sold $700 ‐ $850 169 $632.00 No
* Managers per retail unit sold Total monthly retail units sold InformationTotal F&I managers 75 Unavailable
Actions:
* The above sub‐benchmarking clearly indicates that the problem with F&I is penetration. They do not come close to selling contracts to enough sales customers. The per contract grosses either meet or are close to benchmark amounts. Immediate action is necessary to discuss these poor results with the manager and expect immediate improvement. Total year‐to‐date F&I profits are $425,000. It appears that penetrations are at least 50% below benchmark amounts meaning that another $425,000 of grosses could be generated by bringing penetration to benchmark amounts.* Look at the manager count and pay plans of the managers in this department and consider replacing managers that are ineffective.
6 Parts Department
Total gross profit % (28) Total parts department gross profit 708,014(28) Total parts department sales 30% ‐ 32% 2,016,147 35.12% Yes
Sub‐benchmarking
* Possibly go through the sub‐benchmarking indicated in the deeper look at Dealership A
Actions
* Sometimes we may want to look at areas where benchmarks have been met. In this instance, the benchmark is exceeded by more than 3%. In light of the general poor performance in other areas of the dealership, this high performing area in unexpected. A deeper look my reveal accounting errors that have created a false positive
7 Rent Expense
Rent Expense (29) Total rent expense 506,000(3) Gross Dealership Gross Profits 8% ‐ 10% 4,110,766 12.31% No
Sub‐benchmarking
* Recompute benchmark with (29) Total rent expense 506,000 increased gross profits. For this Adjusted Total Dealership Gross Profits 5,410,766 9.35% Yes calculation we will adjust the = total gross profits to reflect Gross Dealership Gross Profits 4,110,766 vehicle sales gross profits to the + Estimated Increased New Gross 800,000 mid‐range of the benchmark + Estimated Increased Used Gross 500,000
= Adjusted Total Dealership Gross Profits 5,410,766

BenchmarkingSub‐CalculationsDealership B
Benchmark Dealership BDescription Ref Calculation Expectation Calculation Result Met?
Actions:
This exercise indicates that all benchmarks are not rigid. Often benchmarks and results are impacted by other benchmarks and results. In this instance it appears thatrent expense is too high, but really the problem is being caused by sub‐standard vehicle sales effort. If vehicle gross profits even fell in the mid‐range of thosebenchmarks, then this would cause the rent benchmark to fall within range.
8 Personnel Expense
Personnel Expense (30) Total personnel expense (incl sales) 2,897,104(3) Gross Dealership Gross Profits 50% ‐ 55% 4,110,766 70.48% No
Sub‐benchmarking
* Gross profit per employee * Vehicle sales (14),(20) Total new and Used Gross Profit/month 178,548
(49) Total number of sales employees $8,500 23.50 $7,598 No
* Service (27) Total Service gross profit/month 152,086(50) Total number of service employees $6,000 27.50 $5,530 No
* Parts (28) Total Parts Gross Profit/month 78,668(51) Total number of parts employees $12,500 4.00 $19,667 Yes
Total Dealership (3) Total Dealership Gross Profit/month 456,752(52) Total number of Dealership Employees $7,500 55.00 $8,305 Yes
Actions:
Total personnel expense, in terms of dollars, fail the benchmark by a wide margin. The sub‐benchmarking above measures productivity in terms of gross profitsper employee. In total the benchmark is met and they either are met (parts) or a little low for the other two. This seems to indicate that the very high personnecosts is due much more to excessive pay plans than it is to employee count. This would require either further digging