benchmarking and reporting
TRANSCRIPT

Benchmarking and Reporting
Jackie P. Boswell, MBA, FACMPESenior Medical Practice Consultant
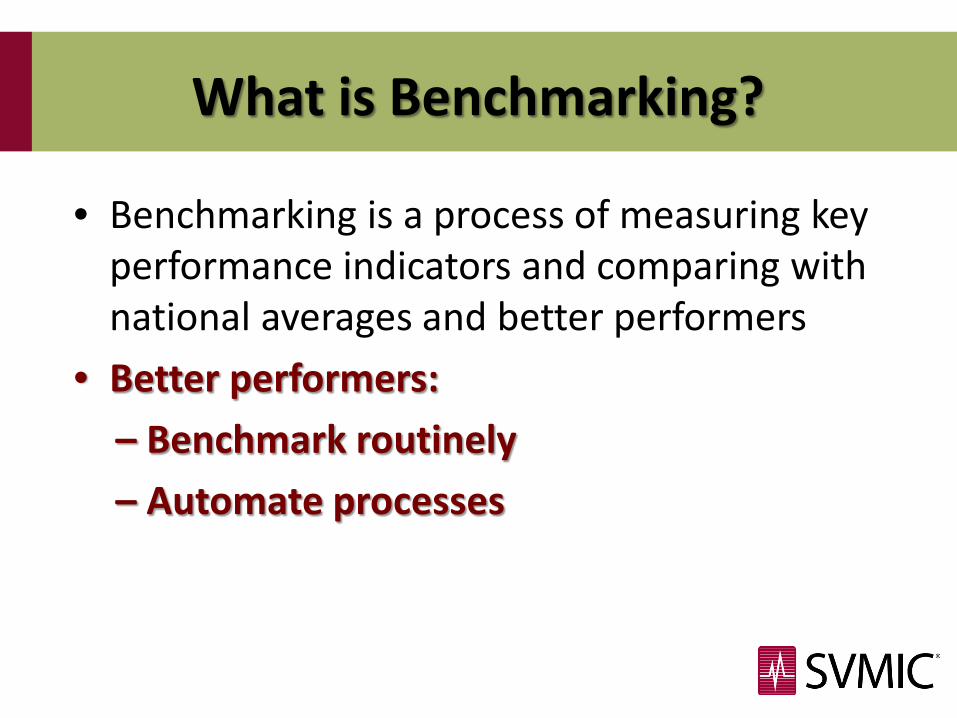
What is Benchmarking?
• Benchmarking is a process of measuring key performance indicators and comparing with national averages and better performers
• Better performers: – Benchmark routinely – Automate processes

Why Benchmark?
Better performing practices use benchmarking to answer the question:
“How are we doing?”

Typical Physician Questions…
• Are we collecting what we should collect?– (Why are my collections lower than his/hers???)
• How many employees should we have per physician (provider)? – (Do we really need all these people????)
• Are my expenses too high? – (Where can we cut costs???)
“One accurate measurement is worth a thousand expert opinions.”
Admiral Grace Hopper

Key Performance IndicatorsKPI Better Performers Example Practice Data
% of A/R>120 days 10.69% 34.25%Days gross FFS charges in A/R 29.4 50.3Adjusted FFS collection % 100.00% 97.33%Patient accounting support staff/FTE physician 0.87 1.09Total medical revenue per FTE physician $1,242,630.00 $1,073,456.00%of claims submitted electronically 95% 83%%of claims denied on first submission 4% 15%
MGMA 2011 Better Performers
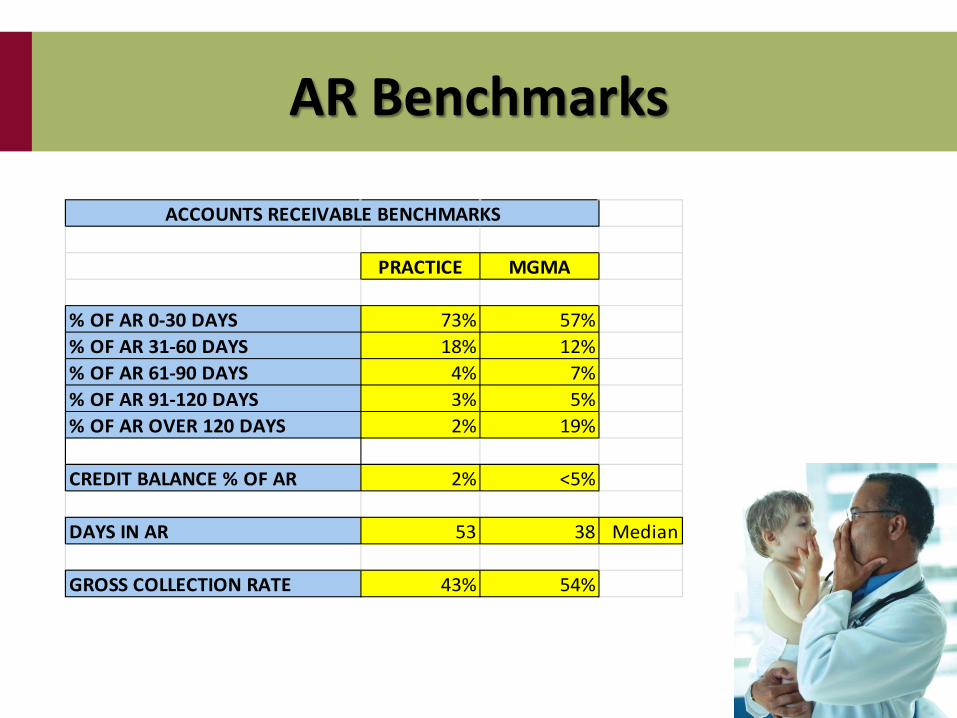
AR Benchmarks
PRACTICE MGMA
% OF AR 0-30 DAYS 73% 57%% OF AR 31-60 DAYS 18% 12%% OF AR 61-90 DAYS 4% 7%% OF AR 91-120 DAYS 3% 5%% OF AR OVER 120 DAYS 2% 19%
CREDIT BALANCE % OF AR 2% <5%
DAYS IN AR 53 38 Median
GROSS COLLECTION RATE 43% 54%
ACCOUNTS RECEIVABLE BENCHMARKS

Accounts Receivable Indicator
• Percentage of A/R over 120 days
– % of total accounts receivable (amounts owed by patient and insurance) greater than 120 days old
– These amounts should be detailed on your Aged Trial Balance Report (Aging Analysis)
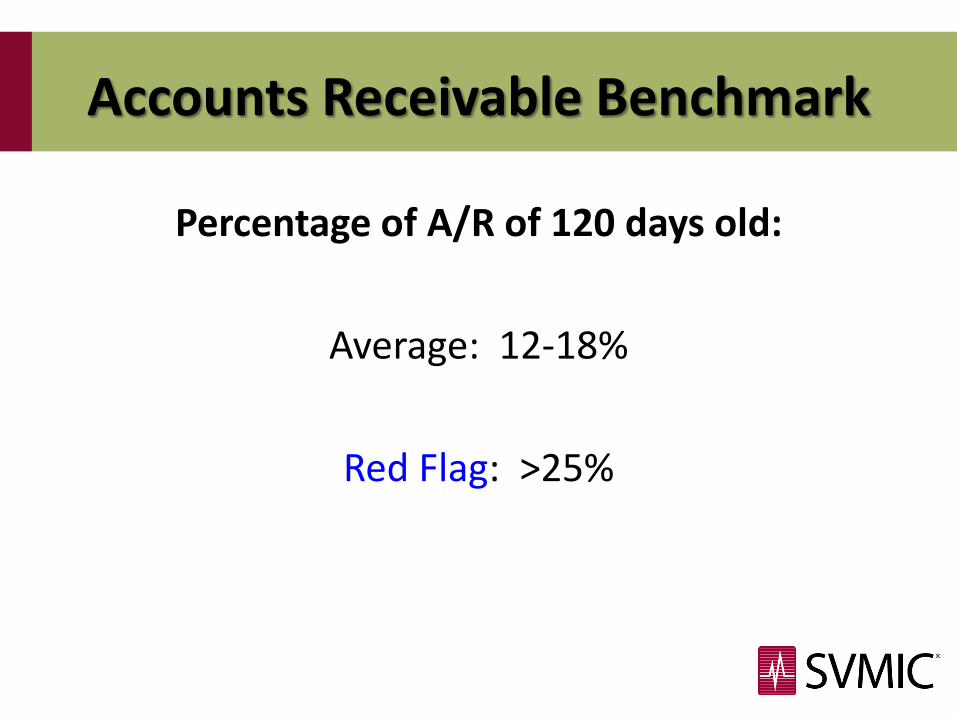
Accounts Receivable Benchmark
Percentage of A/R of 120 days old:
Average: 12-18%
Red Flag: >25%
Days in Accounts Receivable (A/R)
The number of days it takes you to collect an average day’s charges.
(If you average $5,000 a day in charges, how long will it take you to collect $5,000?)

Days in AR Calculation
Total Accounts Receivable(Insurance and Patient less Credit Balances and
Collection Agency Accounts)= ____________________________________
(12 months of gross charges) / 365
Days in AR Benchmark
Also know as…Days Receivable Outstanding (DRO)
Average: 35-45
Red Flag: >50

Net Collection Rate
Revenue that is “collectible” divided by net charges (allowables).
Example:Dr. Doe bills BCBS $120 of which $100 is allowed ($20 is the
contractual write-off).
If you collect $98 of the $100 allowed amount from the insurance company and patient, you have a 98% Net
Collection Rate for that claim.
Net Collection Rate
Average: 94-97%
Red Flag: < 90%
Gross Collections Calculation
Total Collections= __________________ %
Gross Charges

Gross Collections Calculation
Cash Collected in 2014: $100,000Gross Charges in 2014: $180,000
Gross Collection Rate = 55%
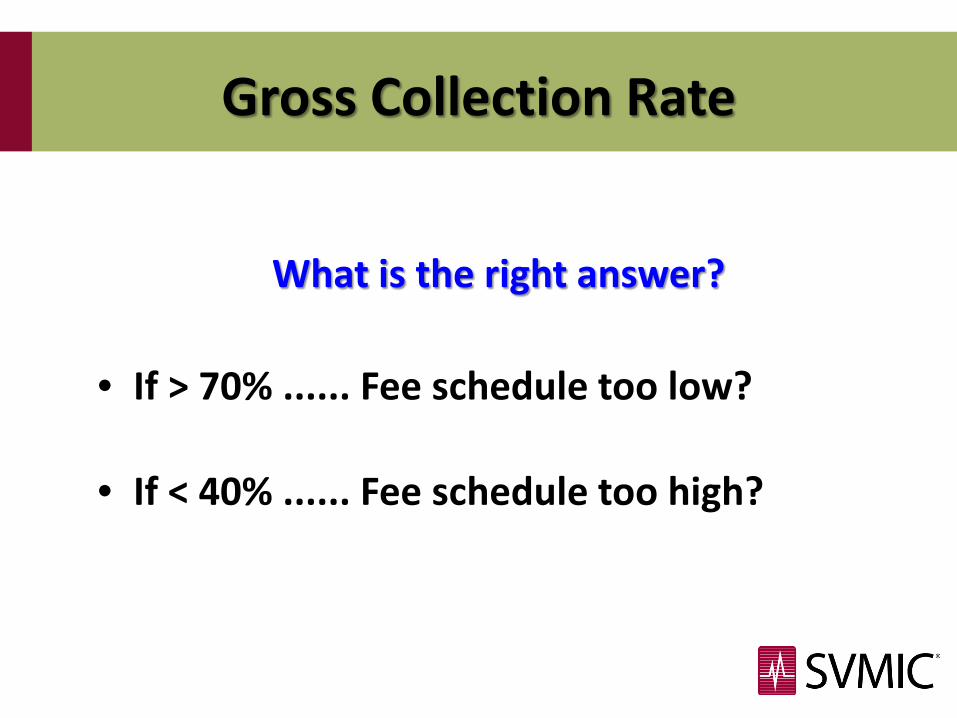
Gross Collection Rate
What is the right answer?
• If > 70% ...... Fee schedule too low?
• If < 40% ...... Fee schedule too high?
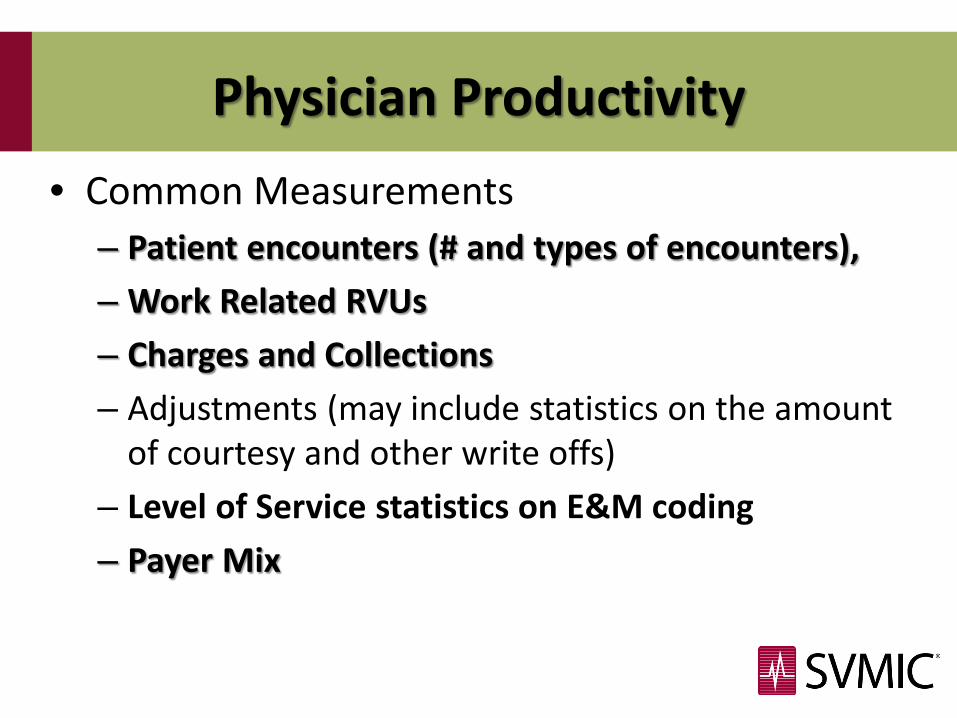
Physician Productivity• Common Measurements
– Patient encounters (# and types of encounters), – Work Related RVUs – Charges and Collections– Adjustments (may include statistics on the amount
of courtesy and other write offs)– Level of Service statistics on E&M coding – Payer Mix

Physician Productivity: Encounters
Dr. A Dr. B Dr. C MGMA Median*Office Visits 4160 1984 4646 2949Hospital Visits 89 66 174 51Total Visits 4249 2050 4820 3000
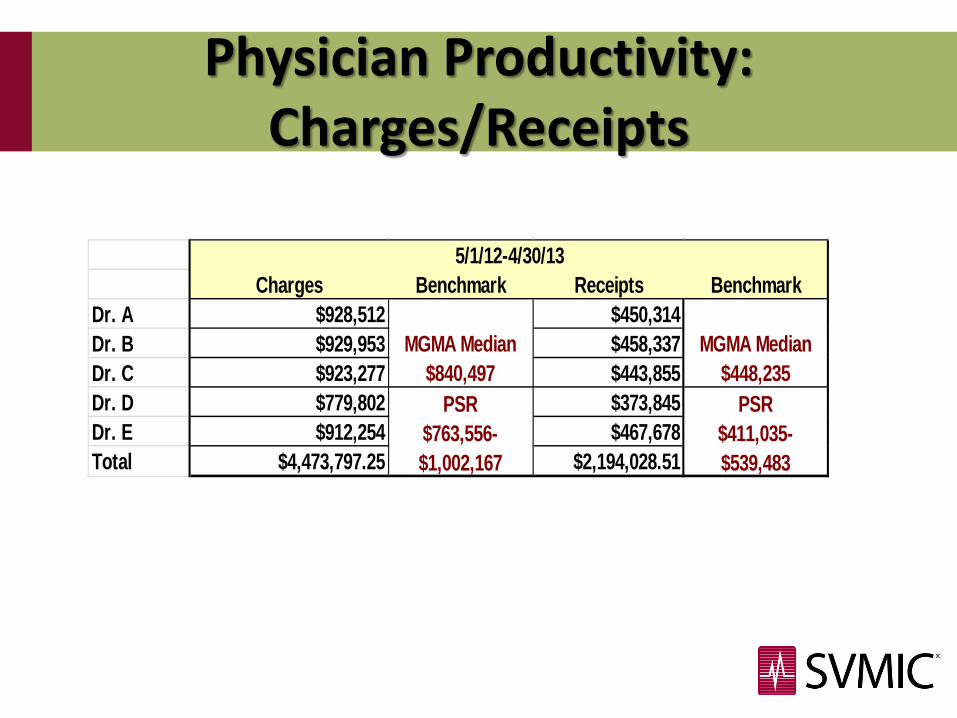
Physician Productivity: Charges/Receipts
Charges Benchmark Receipts BenchmarkDr. A $928,512 $450,314Dr. B $929,953 $458,337Dr. C $923,277 $443,855Dr. D $779,802 $373,845Dr. E $912,254 $467,678Total $4,473,797.25 $2,194,028.51
5/1/12-4/30/13
MGMA Median $840,497
PSR $763,556-$1,002,167
MGMA Median $448,235
PSR $411,035-$539,483

Payer Mix
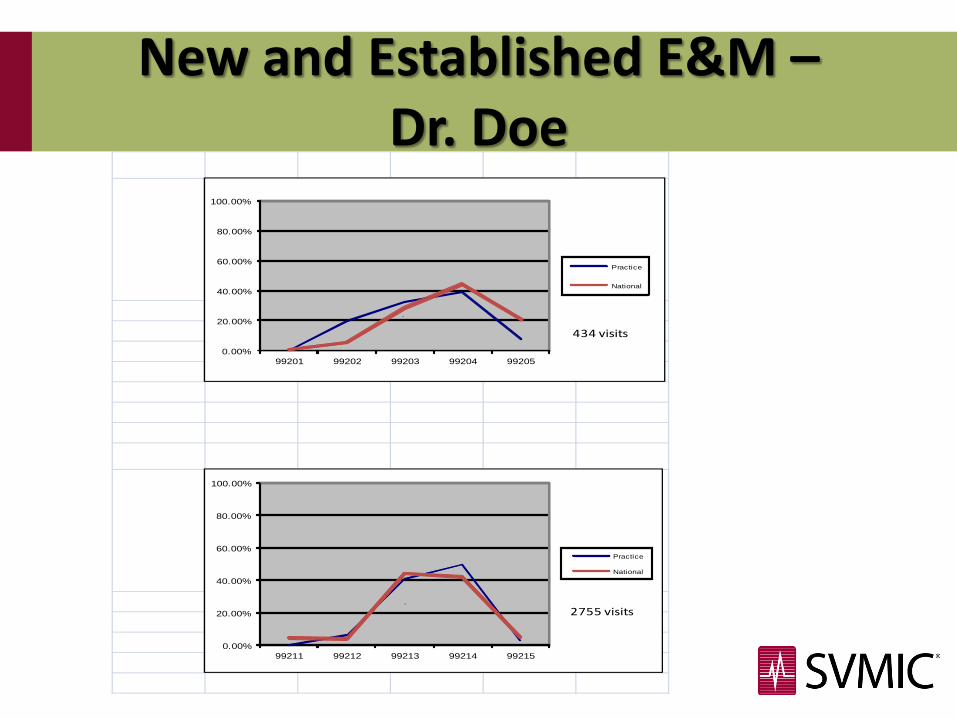
New and Established E&M –Dr. Doe
0.00%
20.00%
40.00%
60.00%
80.00%
100.00%
99201 99202 99203 99204 99205
Practice
National
`
434 visits
0.00%
20.00%
40.00%
60.00%
80.00%
100.00%
99211 99212 99213 99214 99215
Practice
National
` 2755 visits

Inpatient and Subsequent Hospital –Dr. Doe
0.00%
20.00%
40.00%
60.00%
80.00%
100.00%
99221 99222 99223
Practice
National
`
74 visits
0.00%
20.00%
40.00%
60.00%
80.00%
100.00%
99231 99232 99233
Practice
National
`
285 visits

Hospital Discharge –Dr. Doe
0.00%
20.00%
40.00%
60.00%
80.00%
100.00%
99238 99239
Practice
National
`
58 visits

Revenue and Expense BenchmarksINCOME 2010 2011 Annualized* 2010 2011 MGMA
Prof Fees - Office 2,338,670$ 2,651,247$ Prof Fees - Hospital 107,307$ 119,707$ Prof Fees - Immun 1,111,905$ 1,106,432$ Prof Fees - Immun Admin 285,813$ 511,697$ Prof Fees - Other 654,490$ 624,904$ Pt Refund (7,056)$ (17,762)$
Net Collections 4,491,130$ 4,996,225$ 100.00% 100.00% 100.00%
EXPENSES
Payroll- Staff 989,351 952,354 Insurance: Health/Life Emp 99,882 62,260 Pension/ 401K/ Employee 25,412 24,963 Taxes: Payroll Employee 84,665 88,079
Total Staff Cost 1,199,310$ 1,127,655 26.70% 22.57% 27.16%
Rent 211,103 217,518 Utilities 32,141 35,174
Total Facility Cost 243,245$ 252,693 5.42% 5.06% 7.58%
Immunizations 856,768$ 915,907 19.08% 18.33% 15.59%
Total "Other Operating" Expenses 960,101$ 979,302 21.38% 19.60% 15.53%
GP's TOTAL Expense 3,259,423$ 3,275,557 72.57% 65.56% 65.86%
Income for Distribution 1,231,707$ 1,720,668 27.43% 34.44% 34.14%
*Annualized based on Jan-Aug 2011
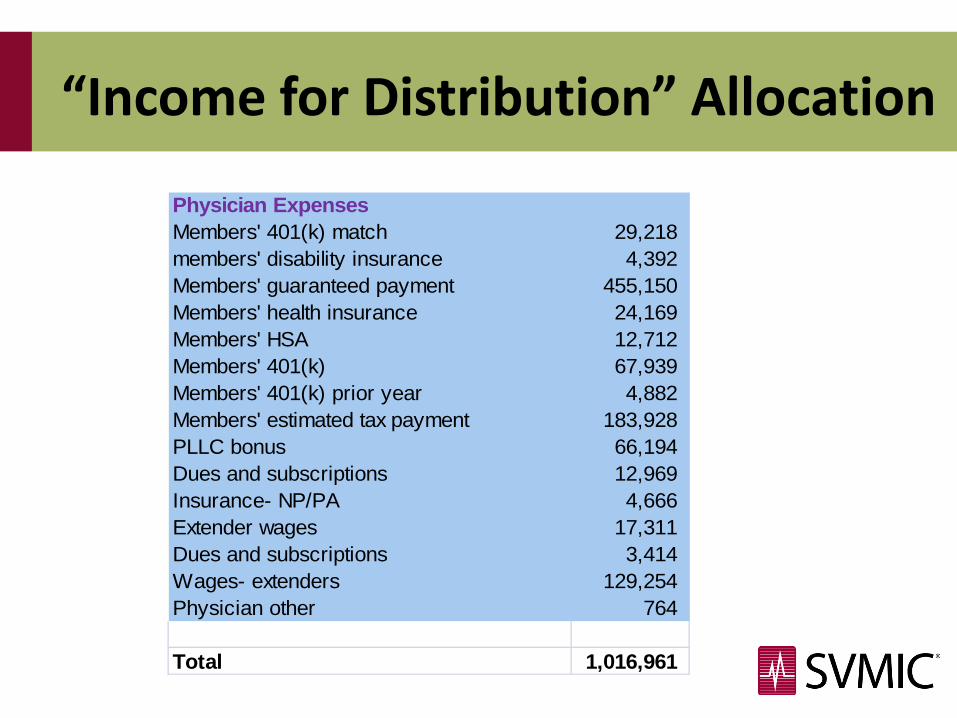
“Income for Distribution” Allocation
Physician ExpensesMembers' 401(k) match 29,218 members' disability insurance 4,392 Members' guaranteed payment 455,150 Members' health insurance 24,169 Members' HSA 12,712 Members' 401(k) 67,939 Members' 401(k) prior year 4,882 Members' estimated tax payment 183,928 PLLC bonus 66,194 Dues and subscriptions 12,969 Insurance- NP/PA 4,666 Extender wages 17,311 Dues and subscriptions 3,414 Wages- extenders 129,254 Physician other 764
Total 1,016,961

Dispensary
Other IncomeDispensary Income 214,313 Other ExpenseDispensary- wages 41,189 Dispensary- pharmaceuticals 230,522 Dispensary- fees 18,584 Dispensary- other 448 Dispensary- staff expense 92
Profit/Loss (76,521)

Comparative ReportCurrent Month Current Y- T- D
Y-T-D Budget
Same Month Prior Year Y-T-D Prior Year Y-T-D Variance
Patient Encounters 1,488 9,070 1,740 9,423 -353Charges $202,353 $1,231,379 $236,677 $1,285,267 ($53,888)Adjustments $91,588 $403,765 $91,591 $427,591 ($23,826)
Collections $134,808 $827,614 $165,497 $859,774 ($32,160)Gross Collection Ratio 66.6% 67.2% 69.9% 66.9%Accounts Receivable 287,258 290,890$
Salaries $37,814 $195,992 $36,130 $191,676 $4,316Overtime Expense $1,502 $2,947 $1,750 $4,443 ($1,496)Contract labor $600 $4,100 $750 $4,750 ($650)Staff Payroll Taxes $3,047 $15,418 $2,936 $15,199 $219
Staff Benefits:Health Insurance (Employer cost) $4,933 $74,289 $4,854 $25,830 $48,459Other Insurance ( Employer cost) $186 $930 $179 $895 $35Other Benefits ( uniforms) $0 $626 $0 $350 $276
Total Staff Cost $48,082 $294,302 $46,599 $243,143 $51,159% of Collections 35.7% 35.6% 28.2% 28.3%
Rent $12,025 $60,125 $11,875 $59,375 $750Utilities $437 $2,049 $657 $1,703 $346Housekeeping $725 $3,625 $725 $3,625 $0Bldg Maintenance $0 $0 $0 $0 $0Real Estate Taxes $0 $1,244 $0 $1,244 $0Build-out Expenses $0 $0 $0 $0 $0Landscape Maint. $100 $500 $100 $500 $0Alarm System $50 $250 $50 $250 $0Pest Control $0 $50 $0 $50 $0
Total Facility Expense $13,337 $67,843 $13,407 $66,747 $1,096% of Collections 9.9% 8.2% 8.1% 7.8% -0.4%
Equipment Expense $5,578 $26,209 $5,539 $25,800 $409Medical Supplies $7,111 $37,044 $7,844 $40,740 ($3,696)X-ray Supplies, Equipment $0 $0 $0 $0 $0laboratory Expense $589 $3,056 $662 $3,439 ($383)Office Supplies $2,966 $17,786 $3,310 $17,195 $591Billing/Administrative Expense $2,684 $14,145 $2,813 $14,616 ($471)Professional Fees $0 $7,546 $388 $8,534 ($988)Telephone $1,281 $6,257 $1,103 $5,569 $688Marketing $354 $2,531 $3,512 $3,878 ($1,347)Prof liability Ins $0 $16,325 $0 $14,988 $1,337Travel, Meals, CME $714 $1,850 $931 $2,202 ($352)Dues, Books, Subscriptions $0 $1,012 $68 $1,541 ($529)Misc Expenses $1,042 $8,100 $2,091 $8,866 ($766)
Total "Other" Expenses $22,319 $141,861 $28,261 $147,369 ($5,508)% of Collections 16.6% 17.1% 17.1% 17.1% 0.0%
Total Operating Expenses $83,738 $504,006 $88,267 $457,259 4674681.6%% of Collections 62.1% 60.9% 53.3% 53.2% 7.7%
Total Physician Expense $54,700 $393,300 $54,700 $413,500 ($20,200)% of Collections 40.6% 47.5% 33.1% 48.1% -0.6%
Profit/Loss ($3,630) ($69,692) $22,530 ($10,985) ($58,707)
Expenses
Revenue
Physician Expense
Comparative Report

The Dashboard Report
Current Month Y-T-D
AveragePatient Encounters 1488 1814Charges 202,353$ 246,276$ Adjustments $91,588 $80,753
Collections 134,808$ 165,523$ Gross Collection Ratio 66.6% 67.2%Accounts Receivable 287,258$ Credit Balances (63,212)$ Average Days in A/R 43.18 35.48
Beginning Bank Account Balance $15,477Current Month Deposits $134,808Current Month Checks Written $138,438Ending Balance $11,847
Charges Collections EncountersDays in Office
Doctor Bush Jr $53,483 $29,581 412 21Doctor Clinton $57,097 $32,853 437 21Doctor Bush Sr $48,952 $35,229 364 20Doctor Regan $41,821 $37,145 275 11
Total $201,353 $134,808 1488 73
Cash on Hand
Dashboard Report

What Reports Do I Need?Report Sort By Description
Accounts Receivable Summary (Aged Trial Balance)
Insurance Company, Balances > $0.00
Report should show balances greater than $0.00 by insurance responsibility. This report should age all balances into 0-30, 31-60, 61-90, and over 120 day categories
Patient Responsibility, Balances > $0.00
Report should show balances greater than $0.00 by patient responsibility. This report should age all balances into 0-30, 31-60, 61-90, and over 120 day categories
Credit Balance Report Patient Account (Not Invoice)
Report should detail each patient account with a balance less than $0.00. (Credit may be due the patient, insurance company, or neither (account may have been over
adjusted))
Unapplied Credits Report Office Report shows the payments that have been input in to the system but have not been applied to a date of service
Service Analysis ReportYear-End and Year-To-
Date by CPT by Provider
Report should detail the frequency of each CPT code by Provider. It should include total charges for each code (frequency multiplied by the charge)
Year-to-Date Activity Report Individual Month (by Provider)
Report should summarize charges, payments and adjustments for the fiscal year or, preferably for each of the last 12 months, by Provider if there is more than one M.D.
Payer MixYear-to-Date and Previous Year by
Insurance Company
Report should show charges, payments, adjustments by insurance company for a specific time period
List of Employees Practice Listing of all Employees, with Job Titles, Hrs worked per week, and Hourly Rate/Salary
Balance Sheet Practice Prior Year and Current Year-to-Date
Profit / Loss Statement Practice/Provider Prior Year and Current Year-to-Date
BasicReports

Finally…
• Transparency in a medical practice should be expected.
• Understand your financial reports and financial status.
• Ideally, your personal accountant should be different than the practice’s accountant.
• SVMIC is available to assist our policyholders!

Remember!
Just because a practice CAN report it
….doesn’t mean a practice SHOULD.

Questions?