beer - imports and exports report - amazon s3 · of beer into and out of the us marketplace over...
TRANSCRIPT

Beer - Imports and Exports ReportJune 2009
©2016 bw166 llc

bw166 Beer - Imports and Exports Report
About This ReportThe Beer - Imports and Exports Report is a monthly publication providing a complete view of imports and exports
of Beer into and out of the US marketplace over the preceding 24 months. The report allows readers to view overalltrends by package type as well as details for each individual country.
The report is assembled from data provided by the Customs and Census Bureaus and is published approximately 6weeks after the end of each month as the data becomes available. Descriptions of the various data sets can be found atthe end of this publication.
Generally speaking, the six-month or longer trends are more indicative of overall market trends. Short-term trendscan be highly volatile and are impacted by suppliers’ fiscal year, market inventory adjustments, and logistical timing forimports.
About the Cover: The cover graphically displays rolling twelve month industry trends (across Beer, Spirits, and Wine)since 2003.
The price of this publication is dependent on the subscriber’s business scale. Please see our website for the specific rates (http://www.bw166.com). Subscribers are
allowed to share the publication across their company and with majority-owned subsidiaries. The publisher prefers that the publication is shared electronically and viewed
on a digital device to reduce the impact on the environment. Subscribers are responsible to limit distribution only to their employees, employees of their majority-owned
subsidiaries and consultants working on projects specific to the subscriber.
June 2009 Page 2
Contents
Table of Contents 3
1 Imports - Total Beer 61.1 Imports - Total Beer - Top 25 Countries . . . . . . . 7
2 Imports - Details by Country 102.1 Argentina - Imports . . . . . . . . . . . . . . . . . . 102.2 Armenia - Imports . . . . . . . . . . . . . . . . . . . 112.3 Australia - Imports . . . . . . . . . . . . . . . . . . . 122.4 Austria - Imports . . . . . . . . . . . . . . . . . . . . 132.5 Bahamas - Imports . . . . . . . . . . . . . . . . . . . 142.6 Barbados - Imports . . . . . . . . . . . . . . . . . . . 152.7 Belgium - Imports . . . . . . . . . . . . . . . . . . . 162.8 Bolivia - Imports . . . . . . . . . . . . . . . . . . . . 172.9 Bosnia and Herzegovina - Imports . . . . . . . . . . . 182.10 Brazil - Imports . . . . . . . . . . . . . . . . . . . . . 192.11 Bulgaria - Imports . . . . . . . . . . . . . . . . . . . 202.12 Canada - Imports . . . . . . . . . . . . . . . . . . . . 212.13 China - Imports . . . . . . . . . . . . . . . . . . . . . 222.14 Colombia - Imports . . . . . . . . . . . . . . . . . . . 232.15 Costa Rica - Imports . . . . . . . . . . . . . . . . . . 242.16 Croatia - Imports . . . . . . . . . . . . . . . . . . . . 252.17 Czech Republic - Imports . . . . . . . . . . . . . . . 262.18 Denmark - Imports . . . . . . . . . . . . . . . . . . . 272.19 Dominican Republic - Imports . . . . . . . . . . . . . 282.20 El Salvador - Imports . . . . . . . . . . . . . . . . . 292.21 Ethiopia - Imports . . . . . . . . . . . . . . . . . . . 302.22 France - Imports . . . . . . . . . . . . . . . . . . . . 312.23 French Polynesia - Imports . . . . . . . . . . . . . . 322.24 Germany - Imports . . . . . . . . . . . . . . . . . . . 332.25 Greece - Imports . . . . . . . . . . . . . . . . . . . . 342.26 Guatemala - Imports . . . . . . . . . . . . . . . . . . 35
2.27 Haiti - Imports . . . . . . . . . . . . . . . . . . . . . 362.28 Honduras - Imports . . . . . . . . . . . . . . . . . . . 372.29 India - Imports . . . . . . . . . . . . . . . . . . . . . 382.30 Ireland - Imports . . . . . . . . . . . . . . . . . . . . 392.31 Italy - Imports . . . . . . . . . . . . . . . . . . . . . 402.32 Jamaica - Imports . . . . . . . . . . . . . . . . . . . 412.33 Japan - Imports . . . . . . . . . . . . . . . . . . . . . 422.34 Kenya - Imports . . . . . . . . . . . . . . . . . . . . 432.35 Korea, South - Imports . . . . . . . . . . . . . . . . . 442.36 Laos - Imports . . . . . . . . . . . . . . . . . . . . . 452.37 Lebanon - Imports . . . . . . . . . . . . . . . . . . . 462.38 Lithuania - Imports . . . . . . . . . . . . . . . . . . . 472.39 Malta - Imports . . . . . . . . . . . . . . . . . . . . . 482.40 Mexico - Imports . . . . . . . . . . . . . . . . . . . . 492.41 Morocco - Imports . . . . . . . . . . . . . . . . . . . 502.42 Netherlands - Imports . . . . . . . . . . . . . . . . . 512.43 New Zealand - Imports . . . . . . . . . . . . . . . . . 522.44 Nicaragua - Imports . . . . . . . . . . . . . . . . . . 532.45 Peru - Imports . . . . . . . . . . . . . . . . . . . . . 542.46 Philippines - Imports . . . . . . . . . . . . . . . . . . 552.47 Poland - Imports . . . . . . . . . . . . . . . . . . . . 562.48 Portugal - Imports . . . . . . . . . . . . . . . . . . . 572.49 Romania - Imports . . . . . . . . . . . . . . . . . . . 582.50 Russia - Imports . . . . . . . . . . . . . . . . . . . . 592.51 Singapore - Imports . . . . . . . . . . . . . . . . . . 602.52 Slovakia - Imports . . . . . . . . . . . . . . . . . . . 612.53 Spain - Imports . . . . . . . . . . . . . . . . . . . . . 622.54 Sri Lanka - Imports . . . . . . . . . . . . . . . . . . . 632.55 Taiwan - Imports . . . . . . . . . . . . . . . . . . . . 642.56 Thailand - Imports . . . . . . . . . . . . . . . . . . . 652.57 Trinidad and Tobago - Imports . . . . . . . . . . . . 662.58 Turkey - Imports . . . . . . . . . . . . . . . . . . . . 672.59 Ukraine - Imports . . . . . . . . . . . . . . . . . . . . 68
3

bw166 Beer - Imports and Exports Report
2.60 United Kingdom - Imports . . . . . . . . . . . . . . . 692.61 Venezuela - Imports . . . . . . . . . . . . . . . . . . 702.62 Vietnam - Imports . . . . . . . . . . . . . . . . . . . 71
3 Exports - Total Beer 723.1 Exports - Total Beer - Top 25 Countries . . . . . . . 73
4 Exports - Details by Country 764.1 Aruba - Exports . . . . . . . . . . . . . . . . . . . . 764.2 Australia - Exports . . . . . . . . . . . . . . . . . . . 774.3 Bahamas - Exports . . . . . . . . . . . . . . . . . . . 784.4 Bahrain - Exports . . . . . . . . . . . . . . . . . . . 794.5 Belgium - Exports . . . . . . . . . . . . . . . . . . . 804.6 Belize - Exports . . . . . . . . . . . . . . . . . . . . . 814.7 Bermuda - Exports . . . . . . . . . . . . . . . . . . . 824.8 Bosnia and Herzegovina - Exports . . . . . . . . . . . 834.9 British Virgin Islands - Exports . . . . . . . . . . . . 844.10 Cambodia - Exports . . . . . . . . . . . . . . . . . . 854.11 Canada - Exports . . . . . . . . . . . . . . . . . . . . 864.12 Cayman Islands - Exports . . . . . . . . . . . . . . . 874.13 Chile - Exports . . . . . . . . . . . . . . . . . . . . . 884.14 China - Exports . . . . . . . . . . . . . . . . . . . . . 894.15 Colombia - Exports . . . . . . . . . . . . . . . . . . . 904.16 Costa Rica - Exports . . . . . . . . . . . . . . . . . . 914.17 Cyprus - Exports . . . . . . . . . . . . . . . . . . . . 924.18 Denmark - Exports . . . . . . . . . . . . . . . . . . . 934.19 Dominican Republic - Exports . . . . . . . . . . . . . 944.20 Ecuador - Exports . . . . . . . . . . . . . . . . . . . 954.21 El Salvador - Exports . . . . . . . . . . . . . . . . . 964.22 Fiji - Exports . . . . . . . . . . . . . . . . . . . . . . 974.23 Finland - Exports . . . . . . . . . . . . . . . . . . . . 984.24 French Polynesia - Exports . . . . . . . . . . . . . . 994.25 Germany - Exports . . . . . . . . . . . . . . . . . . . 1004.26 Guadeloupe - Exports . . . . . . . . . . . . . . . . . 101
4.27 Haiti - Exports . . . . . . . . . . . . . . . . . . . . . 1024.28 Honduras - Exports . . . . . . . . . . . . . . . . . . . 1034.29 Hong Kong - Exports . . . . . . . . . . . . . . . . . . 1044.30 Iceland - Exports . . . . . . . . . . . . . . . . . . . . 1054.31 Ireland - Exports . . . . . . . . . . . . . . . . . . . . 1064.32 Israel - Exports . . . . . . . . . . . . . . . . . . . . . 1074.33 Italy - Exports . . . . . . . . . . . . . . . . . . . . . 1084.34 Jamaica - Exports . . . . . . . . . . . . . . . . . . . 1094.35 Japan - Exports . . . . . . . . . . . . . . . . . . . . . 1104.36 Korea, South - Exports . . . . . . . . . . . . . . . . . 1114.37 Malaysia - Exports . . . . . . . . . . . . . . . . . . . 1124.38 Malta - Exports . . . . . . . . . . . . . . . . . . . . . 1134.39 Marshall Islands - Exports . . . . . . . . . . . . . . . 1144.40 Mexico - Exports . . . . . . . . . . . . . . . . . . . . 1154.41 Micronesia - Exports . . . . . . . . . . . . . . . . . . 1164.42 Netherlands - Exports . . . . . . . . . . . . . . . . . 1174.43 Netherlands Antilles (through Apr 2011) - Exports . 1184.44 New Zealand - Exports . . . . . . . . . . . . . . . . . 1194.45 Nigeria - Exports . . . . . . . . . . . . . . . . . . . . 1204.46 Norway - Exports . . . . . . . . . . . . . . . . . . . . 1214.47 Oman - Exports . . . . . . . . . . . . . . . . . . . . 1224.48 Palau - Exports . . . . . . . . . . . . . . . . . . . . . 1234.49 Panama - Exports . . . . . . . . . . . . . . . . . . . 1244.50 Paraguay - Exports . . . . . . . . . . . . . . . . . . . 1254.51 Philippines - Exports . . . . . . . . . . . . . . . . . . 1264.52 Qatar - Exports . . . . . . . . . . . . . . . . . . . . . 1274.53 Samoa - Exports . . . . . . . . . . . . . . . . . . . . 1284.54 Saudi Arabia - Exports . . . . . . . . . . . . . . . . . 1294.55 Singapore - Exports . . . . . . . . . . . . . . . . . . 1304.56 Solomon Islands - Exports . . . . . . . . . . . . . . . 1314.57 Spain - Exports . . . . . . . . . . . . . . . . . . . . . 1324.58 Suriname - Exports . . . . . . . . . . . . . . . . . . . 1334.59 Sweden - Exports . . . . . . . . . . . . . . . . . . . . 134
June 2009 Page 4

bw166 Beer - Imports and Exports Report
4.60 Taiwan - Exports . . . . . . . . . . . . . . . . . . . . 1354.61 Trinidad and Tobago - Exports . . . . . . . . . . . . 1364.62 Turks and Caicos Islands - Exports . . . . . . . . . . 1374.63 United Arab Emirates - Exports . . . . . . . . . . . 1384.64 United Kingdom - Exports . . . . . . . . . . . . . . . 139
4.65 Vietnam - Exports . . . . . . . . . . . . . . . . . . . 140
5 Data Descriptions 141
6 Other Publications 142
June 2009 Page 5

bw166 Beer - Imports and Exports Report
1 Imports - Total Beer
Total Beer (000s)L12M YA % L9M YA % L6M YA % L3M YA % L1M YA %
Barrels 27,160 28,961 -6.2% 19,618 21,342 -8.1% 13,171 14,511 -9.2% 7,521 8,215 -8.5% 2,672 2,739 -2.4%Value (USD) 3,496,564 3,632,889 -3.8% 2,532,657 2,697,960 -6.1% 1,703,930 1,854,946 -8.1% 970,471 1,042,566 -6.9% 346,093 342,162 1.1%USD/Barrel 128.74 125.44 2.6% 129.10 126.41 2.1% 129.37 127.83 1.2% 129.04 126.91 1.7% 129.50 124.91 3.7%
Glass Packaging (000s)L12M YA % L9M YA % L6M YA % L3M YA % L1M YA %
Barrels 20,445 21,996 -7.1% 14,725 16,153 -8.8% 9,816 10,915 -10.1% 5,640 6,202 -9.1% 2,012 2,073 -3.0%Value (USD) 2,787,938 2,906,205 -4.1% 2,011,493 2,149,808 -6.4% 1,346,972 1,471,426 -8.5% 772,629 832,890 -7.2% 276,832 276,697 0.0%USD/Barrel 136.36 132.12 3.2% 136.60 133.09 2.6% 137.22 134.81 1.8% 137.00 134.30 2.0% 137.61 133.47 3.1%
Non-Glass Packaging (000s)L12M YA % L9M YA % L6M YA % L3M YA % L1M YA %
Barrels 4,513 4,298 5.0% 3,355 3,188 5.3% 2,339 2,210 5.8% 1,397 1,306 7.0% 482 450 7.1%Value (USD) 484,165 459,297 5.4% 362,389 343,347 5.5% 252,716 236,552 6.8% 147,683 137,960 7.0% 52,009 45,646 13.9%USD/Barrel 107.27 106.86 0.4% 108.01 107.71 0.3% 108.06 107.03 1.0% 105.70 105.63 0.1% 107.93 101.46 6.4%
Kegs (000s)L12M YA % L9M YA % L6M YA % L3M YA % L1M YA %
Barrels 2,202 2,667 -17.4% 1,538 2,002 -23.2% 1,016 1,386 -26.7% 484 707 -31.6% 179 216 -17.3%Value (USD) 224,460 267,387 -16.1% 158,774 204,805 -22.5% 104,242 146,968 -29.1% 50,159 71,716 -30.1% 17,252 19,818 -12.9%USD/Barrel 101.95 100.27 1.7% 103.23 102.31 0.9% 102.59 106.03 -3.2% 103.65 101.38 2.2% 96.45 91.63 5.3%
June 2009 Page 6

bw166 Beer - Imports and Exports Report
1.1 Imports - Total Beer - Top 25 Countries
Barrels (000s)L12M YA % L9M YA % L6M YA % L3M YA % L1M YA %
Mexico 13,369 13,593 -1.6% 9,784 10,049 -2.6% 6,829 6,970 -2.0% 3,972 4,097 -3.1% 1,391 1,416 -1.7%Netherlands 6,033 6,733 -10.4% 4,372 4,949 -11.7% 2,975 3,482 -14.6% 1,697 1,852 -8.3% 634 603 5.1%Canada 2,718 3,227 -15.8% 1,906 2,330 -18.2% 1,181 1,551 -23.9% 689 858 -19.7% 250 282 -11.4%Germany 1,126 1,211 -7.0% 706 853 -17.3% 441 476 -7.4% 247 300 -17.7% 81 109 -25.8%Belgium 1,014 1,020 -0.6% 700 763 -8.3% 394 425 -7.2% 229 271 -15.6% 70 109 -35.7%United Kingdom 864 997 -13.3% 604 756 -20.1% 403 528 -23.7% 201 282 -28.8% 63 83 -23.9%Ireland 862 941 -8.4% 684 758 -9.9% 404 476 -15.2% 161 201 -19.6% 49 18 172.9%Jamaica 240 222 8.2% 182 163 11.8% 112 119 -5.3% 53 79 -32.4% 12 27 -55.5%Italy 162 164 -1.1% 121 122 -0.6% 82 86 -5.2% 54 47 14.7% 25 15 70.8%Dominican Repub-lic
129 117 10.3% 97 88 9.6% 64 62 2.3% 40 36 10.8% 18 12 43.9%
Czech Republic 117 145 -19.4% 84 107 -21.0% 54 70 -23.0% 33 41 -18.9% 16 14 12.4%Poland 86 127 -32.3% 57 80 -28.5% 31 52 -39.6% 22 39 -42.9% 12 13 -10.8%China 63 68 -6.7% 49 49 -1.0% 33 33 -0.8% 17 19 -9.5% 4 7 -40.3%El Salvador 63 42 49.2% 48 31 52.5% 32 23 38.5% 20 12 63.1% 9 5 77.5%Denmark 29 28 2.7% 20 18 8.2% 11 11 4.9% 8 5 58.2% 4 3 41.5%Thailand 28 30 -6.5% 21 19 9.9% 13 10 37.0% 7 4 57.7% 2 1 96.7%New Zealand 27 43 -38.3% 21 29 -29.6% 11 20 -46.8% 7 10 -25.7% 4 3 61.6%Korea, South 23 23 -0.9% 17 17 3.4% 11 11 1.9% 7 6 25.7% 3 2 57.8%Japan 16 12 28.3% 11 9 20.7% 6 6 -0.8% 4 2 42.3% 1 1 159.8%Russia 16 16 -1.4% 11 11 -4.6% 6 7 -9.9% 4 4 -4.1% 1 2 -26.5%Trinidad and To-bago
15 10 41.7% 11 9 18.2% 5 6 -21.0% 4 1 199.8% 3 0 546.5%
France 14 21 -32.4% 10 15 -29.9% 7 12 -43.6% 4 7 -39.8% 2 2 51.7%Portugal 11 13 -15.3% 8 8 -3.9% 6 5 19.6% 4 3 37.7% 2 1 94.4%India 11 13 -16.4% 8 9 -12.8% 5 6 -20.0% 2 4 -45.0% 1 1 3.8%Peru 10 11 -2.5% 7 7 12.0% 5 4 27.6% 3 3 16.3% 2 1 34.6%All Other 116 135 -13.7% 80 92 -13.7% 51 59 -14.4% 32 34 -4.8% 12 9 31.3%Grand Total 27,160 28,961 -6.2% 19,618 21,342 -8.1% 13,171 14,511 -9.2% 7,521 8,215 -8.5% 2,672 2,739 -2.4%
June 2009 Page 7

bw166 Beer - Imports and Exports Report
Value (USD) (000s)L12M YA % L9M YA % L6M YA % L3M YA % L1M YA %
Mexico 1,562,178 1,566,935 -0.3% 1,144,196 1,161,003 -1.4% 802,987 807,778 -0.6% 467,550 475,706 -1.7% 164,664 164,096 0.3%Netherlands 999,674 1,066,398 -6.3% 729,646 788,577 -7.5% 502,971 558,361 -9.9% 288,268 298,714 -3.5% 107,170 97,202 10.3%Canada 236,722 292,519 -19.1% 158,821 218,731 -27.4% 92,551 150,419 -38.5% 53,475 81,108 -34.1% 19,462 25,180 -22.7%Germany 131,078 135,023 -2.9% 83,620 94,974 -12.0% 53,317 58,138 -8.3% 29,663 35,546 -16.6% 9,797 12,634 -22.5%Belgium 140,272 138,737 1.1% 96,953 103,637 -6.4% 53,268 58,954 -9.6% 32,037 36,561 -12.4% 10,054 14,000 -28.2%United Kingdom 114,333 120,725 -5.3% 81,451 90,845 -10.3% 54,616 63,347 -13.8% 28,747 34,080 -15.6% 9,140 9,952 -8.2%Ireland 149,902 151,526 -1.1% 119,186 122,756 -2.9% 69,957 77,036 -9.2% 27,509 32,647 -15.7% 8,582 2,933 192.6%Jamaica 39,392 33,308 18.3% 30,022 24,723 21.4% 18,475 17,934 3.0% 8,739 11,872 -26.4% 2,015 4,128 -51.2%Italy 23,695 23,558 0.6% 17,749 18,173 -2.3% 11,377 12,639 -10.0% 7,019 7,082 -0.9% 3,040 2,371 28.2%Dominican Repub-lic
21,113 18,962 11.3% 15,782 14,181 11.3% 10,505 10,169 3.3% 6,687 5,875 13.8% 2,961 1,984 49.3%
Czech Republic 13,015 15,413 -15.6% 8,890 11,821 -24.8% 5,566 8,141 -31.6% 3,398 4,937 -31.2% 1,658 1,773 -6.5%Poland 9,140 13,006 -29.7% 5,706 8,192 -30.3% 2,845 5,313 -46.4% 2,062 4,049 -49.1% 1,098 1,438 -23.6%China 5,353 5,961 -10.2% 4,100 4,409 -7.0% 2,761 3,073 -10.1% 1,399 1,766 -20.8% 337 687 -51.0%El Salvador 5,277 3,298 60.0% 4,063 2,491 63.1% 2,710 1,827 48.3% 1,676 1,009 66.1% 722 394 83.0%Denmark 3,967 3,793 4.6% 2,712 2,452 10.6% 1,721 1,368 25.8% 1,074 542 98.0% 565 295 91.4%Thailand 4,632 4,681 -1.0% 3,406 3,151 8.1% 2,175 1,671 30.2% 1,085 803 35.1% 347 217 60.1%New Zealand 4,295 6,237 -31.1% 3,334 4,459 -25.2% 1,711 3,207 -46.6% 1,143 1,573 -27.3% 676 402 68.2%Korea, South 2,008 1,904 5.5% 1,489 1,357 9.7% 1,018 928 9.7% 623 476 30.9% 265 157 68.4%Japan 3,922 2,762 42.0% 2,980 2,233 33.5% 1,777 1,682 5.7% 910 625 45.6% 326 152 114.6%Russia 1,071 995 7.6% 751 707 6.3% 435 397 9.5% 313 271 15.4% 111 134 -17.0%Trinidad and To-bago
1,742 1,207 44.3% 1,342 1,085 23.6% 690 742 -7.1% 520 175 196.7% 360 68 430.8%
France 1,730 2,283 -24.2% 1,261 1,746 -27.8% 815 1,372 -40.6% 507 751 -32.6% 342 184 86.0%Portugal 1,257 1,263 -0.4% 950 800 18.7% 757 514 47.1% 543 325 66.9% 271 121 123.5%India 2,128 2,460 -13.5% 1,651 1,843 -10.4% 1,000 1,207 -17.1% 454 794 -42.9% 229 216 6.3%Peru 1,153 1,260 -8.5% 815 796 2.5% 509 480 6.0% 328 333 -1.5% 166 136 21.6%All Other 17,515 18,675 -6.2% 11,780 12,817 -8.1% 7,415 8,250 -10.1% 4,744 4,945 -4.1% 1,736 1,309 32.6%Grand Total 3,496,564 3,632,889 -3.8% 2,532,657 2,697,960 -6.1% 1,703,930 1,854,946 -8.1% 970,471 1,042,566 -6.9% 346,093 342,162 1.1%
June 2009 Page 8
bw166 Beer - Imports and Exports Report
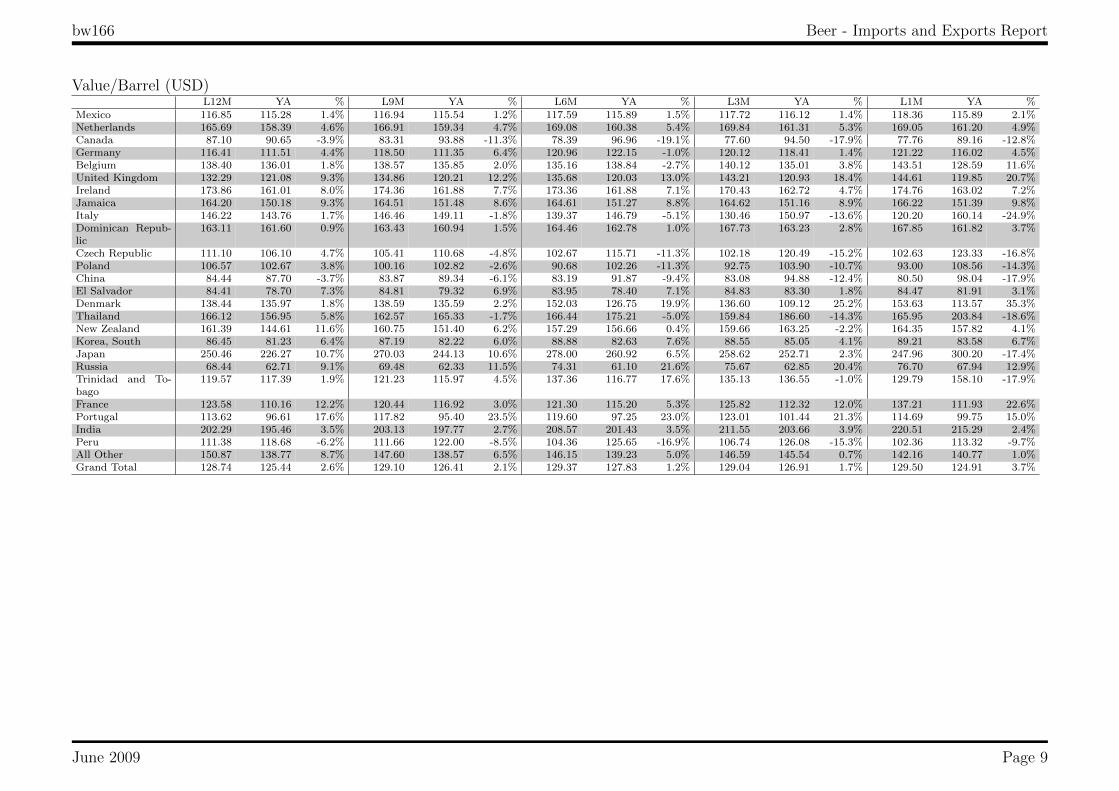
Value/Barrel (USD)L12M YA % L9M YA % L6M YA % L3M YA % L1M YA %
Mexico 116.85 115.28 1.4% 116.94 115.54 1.2% 117.59 115.89 1.5% 117.72 116.12 1.4% 118.36 115.89 2.1%Netherlands 165.69 158.39 4.6% 166.91 159.34 4.7% 169.08 160.38 5.4% 169.84 161.31 5.3% 169.05 161.20 4.9%Canada 87.10 90.65 -3.9% 83.31 93.88 -11.3% 78.39 96.96 -19.1% 77.60 94.50 -17.9% 77.76 89.16 -12.8%Germany 116.41 111.51 4.4% 118.50 111.35 6.4% 120.96 122.15 -1.0% 120.12 118.41 1.4% 121.22 116.02 4.5%Belgium 138.40 136.01 1.8% 138.57 135.85 2.0% 135.16 138.84 -2.7% 140.12 135.01 3.8% 143.51 128.59 11.6%United Kingdom 132.29 121.08 9.3% 134.86 120.21 12.2% 135.68 120.03 13.0% 143.21 120.93 18.4% 144.61 119.85 20.7%Ireland 173.86 161.01 8.0% 174.36 161.88 7.7% 173.36 161.88 7.1% 170.43 162.72 4.7% 174.76 163.02 7.2%Jamaica 164.20 150.18 9.3% 164.51 151.48 8.6% 164.61 151.27 8.8% 164.62 151.16 8.9% 166.22 151.39 9.8%Italy 146.22 143.76 1.7% 146.46 149.11 -1.8% 139.37 146.79 -5.1% 130.46 150.97 -13.6% 120.20 160.14 -24.9%Dominican Repub-lic
163.11 161.60 0.9% 163.43 160.94 1.5% 164.46 162.78 1.0% 167.73 163.23 2.8% 167.85 161.82 3.7%
Czech Republic 111.10 106.10 4.7% 105.41 110.68 -4.8% 102.67 115.71 -11.3% 102.18 120.49 -15.2% 102.63 123.33 -16.8%Poland 106.57 102.67 3.8% 100.16 102.82 -2.6% 90.68 102.26 -11.3% 92.75 103.90 -10.7% 93.00 108.56 -14.3%China 84.44 87.70 -3.7% 83.87 89.34 -6.1% 83.19 91.87 -9.4% 83.08 94.88 -12.4% 80.50 98.04 -17.9%El Salvador 84.41 78.70 7.3% 84.81 79.32 6.9% 83.95 78.40 7.1% 84.83 83.30 1.8% 84.47 81.91 3.1%Denmark 138.44 135.97 1.8% 138.59 135.59 2.2% 152.03 126.75 19.9% 136.60 109.12 25.2% 153.63 113.57 35.3%Thailand 166.12 156.95 5.8% 162.57 165.33 -1.7% 166.44 175.21 -5.0% 159.84 186.60 -14.3% 165.95 203.84 -18.6%New Zealand 161.39 144.61 11.6% 160.75 151.40 6.2% 157.29 156.66 0.4% 159.66 163.25 -2.2% 164.35 157.82 4.1%Korea, South 86.45 81.23 6.4% 87.19 82.22 6.0% 88.88 82.63 7.6% 88.55 85.05 4.1% 89.21 83.58 6.7%Japan 250.46 226.27 10.7% 270.03 244.13 10.6% 278.00 260.92 6.5% 258.62 252.71 2.3% 247.96 300.20 -17.4%Russia 68.44 62.71 9.1% 69.48 62.33 11.5% 74.31 61.10 21.6% 75.67 62.85 20.4% 76.70 67.94 12.9%Trinidad and To-bago
119.57 117.39 1.9% 121.23 115.97 4.5% 137.36 116.77 17.6% 135.13 136.55 -1.0% 129.79 158.10 -17.9%
France 123.58 110.16 12.2% 120.44 116.92 3.0% 121.30 115.20 5.3% 125.82 112.32 12.0% 137.21 111.93 22.6%Portugal 113.62 96.61 17.6% 117.82 95.40 23.5% 119.60 97.25 23.0% 123.01 101.44 21.3% 114.69 99.75 15.0%India 202.29 195.46 3.5% 203.13 197.77 2.7% 208.57 201.43 3.5% 211.55 203.66 3.9% 220.51 215.29 2.4%Peru 111.38 118.68 -6.2% 111.66 122.00 -8.5% 104.36 125.65 -16.9% 106.74 126.08 -15.3% 102.36 113.32 -9.7%All Other 150.87 138.77 8.7% 147.60 138.57 6.5% 146.15 139.23 5.0% 146.59 145.54 0.7% 142.16 140.77 1.0%Grand Total 128.74 125.44 2.6% 129.10 126.41 2.1% 129.37 127.83 1.2% 129.04 126.91 1.7% 129.50 124.91 3.7%
June 2009 Page 9
bw166 Beer - Imports and Exports Report
2 Imports - Details by Country
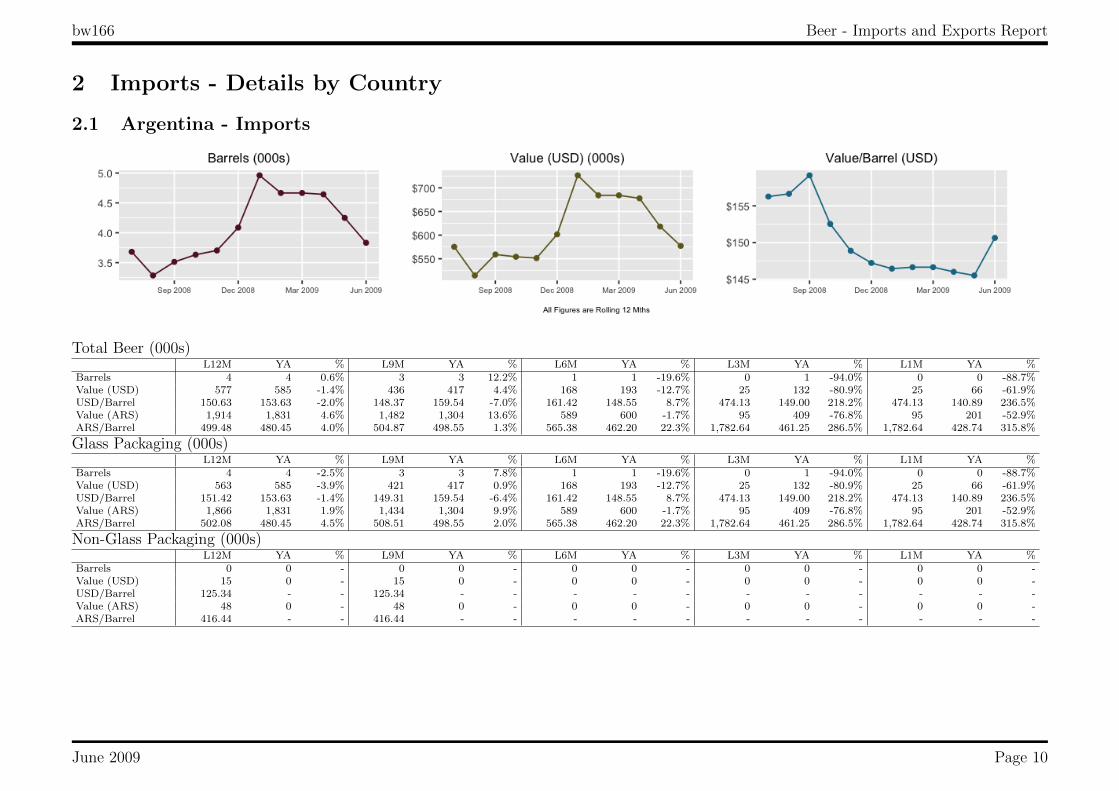
2.1 Argentina - Imports
Total Beer (000s)L12M YA % L9M YA % L6M YA % L3M YA % L1M YA %
Barrels 4 4 0.6% 3 3 12.2% 1 1 -19.6% 0 1 -94.0% 0 0 -88.7%Value (USD) 577 585 -1.4% 436 417 4.4% 168 193 -12.7% 25 132 -80.9% 25 66 -61.9%USD/Barrel 150.63 153.63 -2.0% 148.37 159.54 -7.0% 161.42 148.55 8.7% 474.13 149.00 218.2% 474.13 140.89 236.5%Value (ARS) 1,914 1,831 4.6% 1,482 1,304 13.6% 589 600 -1.7% 95 409 -76.8% 95 201 -52.9%ARS/Barrel 499.48 480.45 4.0% 504.87 498.55 1.3% 565.38 462.20 22.3% 1,782.64 461.25 286.5% 1,782.64 428.74 315.8%
Glass Packaging (000s)L12M YA % L9M YA % L6M YA % L3M YA % L1M YA %
Barrels 4 4 -2.5% 3 3 7.8% 1 1 -19.6% 0 1 -94.0% 0 0 -88.7%Value (USD) 563 585 -3.9% 421 417 0.9% 168 193 -12.7% 25 132 -80.9% 25 66 -61.9%USD/Barrel 151.42 153.63 -1.4% 149.31 159.54 -6.4% 161.42 148.55 8.7% 474.13 149.00 218.2% 474.13 140.89 236.5%Value (ARS) 1,866 1,831 1.9% 1,434 1,304 9.9% 589 600 -1.7% 95 409 -76.8% 95 201 -52.9%ARS/Barrel 502.08 480.45 4.5% 508.51 498.55 2.0% 565.38 462.20 22.3% 1,782.64 461.25 286.5% 1,782.64 428.74 315.8%
Non-Glass Packaging (000s)L12M YA % L9M YA % L6M YA % L3M YA % L1M YA %
Barrels 0 0 - 0 0 - 0 0 - 0 0 - 0 0 -Value (USD) 15 0 - 15 0 - 0 0 - 0 0 - 0 0 -USD/Barrel 125.34 - - 125.34 - - - - - - - - - - -Value (ARS) 48 0 - 48 0 - 0 0 - 0 0 - 0 0 -ARS/Barrel 416.44 - - 416.44 - - - - - - - - - - -
June 2009 Page 10

bw166 Beer - Imports and Exports Report
2.2 Armenia - Imports
Total Beer (000s)L12M YA % L9M YA % L6M YA % L3M YA % L1M YA %
Barrels 1 1 -45.3% 0 1 -20.9% 0 0 -27.1% 0 0 -70.1% 0 0 -54.5%Value (USD) 75 113 -33.4% 65 74 -11.9% 47 60 -22.1% 15 50 -69.4% 15 34 -55.1%USD/Barrel 145.74 119.68 21.8% 151.32 135.72 11.5% 150.26 140.55 6.9% 148.39 145.17 2.2% 148.39 150.39 -1.3%
Glass Packaging (000s)L12M YA % L9M YA % L6M YA % L3M YA % L1M YA %
Barrels 1 1 -45.3% 0 1 -20.9% 0 0 -27.1% 0 0 -70.1% 0 0 -54.5%Value (USD) 75 113 -33.4% 65 74 -11.9% 47 60 -22.1% 15 50 -69.4% 15 34 -55.1%USD/Barrel 145.74 119.68 21.8% 151.32 135.72 11.5% 150.26 140.55 6.9% 148.39 145.17 2.2% 148.39 150.39 -1.3%
June 2009 Page 11

bw166 Beer - Imports and Exports Report
2.3 Australia - Imports
Total Beer (000s)L12M YA % L9M YA % L6M YA % L3M YA % L1M YA %
Barrels 8 13 -34.6% 5 9 -42.2% 3 6 -49.8% 2 3 -49.8% 1 1 -51.2%Value (USD) 1,463 2,266 -35.4% 855 1,675 -49.0% 449 1,135 -60.5% 235 596 -60.6% 70 209 -66.7%USD/Barrel 175.29 177.49 -1.2% 155.87 176.67 -11.8% 138.01 175.14 -21.2% 138.44 176.56 -21.6% 129.15 189.46 -31.8%Value (AUD) 1,922 2,537 -24.2% 1,238 1,836 -32.6% 632 1,232 -48.7% 311 632 -50.8% 87 220 -60.5%AUD/Barrel 230.26 198.67 15.9% 225.74 193.66 16.6% 194.43 190.08 2.3% 183.35 187.17 -2.0% 160.86 198.97 -19.2%
Glass Packaging (000s)L12M YA % L9M YA % L6M YA % L3M YA % L1M YA %
Barrels 8 12 -35.3% 5 9 -42.5% 3 6 -50.5% 2 3 -52.5% 1 1 -51.2%Value (USD) 1,402 2,208 -36.5% 840 1,659 -49.3% 435 1,119 -61.2% 220 596 -63.0% 70 209 -66.7%USD/Barrel 173.77 177.13 -1.9% 155.86 176.81 -11.8% 137.48 175.33 -21.6% 137.41 176.56 -22.2% 129.15 189.46 -31.8%Value (AUD) 1,853 2,470 -25.0% 1,219 1,819 -33.0% 614 1,214 -49.5% 292 632 -53.8% 87 220 -60.5%AUD/Barrel 229.68 198.08 16.0% 226.09 193.84 16.6% 194.11 190.29 2.0% 182.10 187.17 -2.7% 160.86 198.97 -19.2%
Non-Glass Packaging (000s)L12M YA % L9M YA % L6M YA % L3M YA % L1M YA %
Barrels 0 0 - 0 0 - 0 0 - 0 0 - 0 0 -Value (USD) 31 0 - 14 0 - 14 0 - 14 0 - 0 0 -USD/Barrel 169.50 - - 156.46 - - 156.46 - - 156.46 - - - - -Value (AUD) 38 0 - 19 0 - 19 0 - 19 0 - 0 0 -AUD/Barrel 205.84 - - 205.36 - - 205.36 - - 205.36 - - - - -
Kegs (000s)L12M YA % L9M YA % L6M YA % L3M YA % L1M YA %
Barrels 0 0 -67.8% 0 0 -100.0% 0 0 -100.0% 0 0 - 0 0 -Value (USD) 30 58 -47.8% 0 16 -100.0% 0 16 -100.0% 0 0 - 0 0 -USD/Barrel 312.93 192.79 62.3% - 162.79 - - 162.79 - - - - - - -Value (AUD) 31 67 -53.2% 0 17 -100.0% 0 17 -100.0% 0 0 - 0 0 -AUD/Barrel 324.77 223.18 45.5% - 176.57 - - 176.57 - - - - - - -
June 2009 Page 12

bw166 Beer - Imports and Exports Report
2.4 Austria - Imports
Total Beer (000s)L12M YA % L9M YA % L6M YA % L3M YA % L1M YA %
Barrels 6 5 17.9% 4 3 26.0% 3 2 24.9% 2 1 177.4% 1 0 387.6%Value (USD) 1,167 1,084 7.6% 766 721 6.1% 520 494 5.4% 439 205 114.0% 179 37 387.8%USD/Barrel 208.45 228.33 -8.7% 196.51 233.20 -15.7% 179.79 213.05 -15.6% 180.20 233.58 -22.9% 212.16 212.05 0.1%Value (EUR) 837 745 12.3% 571 481 18.6% 385 324 18.7% 321 131 145.5% 128 24 442.1%EUR/Barrel 149.53 157.00 -4.8% 146.52 155.66 -5.9% 132.85 139.80 -5.0% 131.98 149.13 -11.5% 151.38 136.17 11.2%
Glass Packaging (000s)L12M YA % L9M YA % L6M YA % L3M YA % L1M YA %
Barrels 3 3 4.6% 2 2 19.2% 2 1 13.7% 1 1 118.7% 1 0 245.0%Value (USD) 754 825 -8.7% 500 539 -7.2% 326 351 -7.2% 273 161 69.2% 146 37 298.1%USD/Barrel 238.94 273.63 -12.7% 219.34 281.83 -22.2% 205.45 251.56 -18.3% 206.77 267.32 -22.6% 244.67 212.05 15.4%Value (EUR) 539 569 -5.2% 371 360 3.0% 239 230 3.9% 198 103 92.6% 104 24 342.3%EUR/Barrel 170.96 188.50 -9.3% 162.79 188.43 -13.6% 150.87 164.97 -8.6% 150.37 170.70 -11.9% 174.57 136.17 28.2%
Kegs (000s)L12M YA % L9M YA % L6M YA % L3M YA % L1M YA %
Barrels 2 2 44.2% 2 1 41.1% 1 1 36.9% 1 0 289.5% 0 0 -Value (USD) 405 247 64.3% 257 170 51.0% 186 143 30.4% 158 44 259.8% 33 0 -USD/Barrel 168.87 148.25 13.9% 163.78 153.01 7.0% 147.53 154.84 -4.7% 147.42 159.56 -7.6% 133.49 - -Value (EUR) 292 169 73.1% 194 113 71.5% 139 94 48.3% 117 28 318.1% 24 0 -EUR/Barrel 121.67 101.35 20.0% 123.29 101.44 21.5% 110.23 101.76 8.3% 109.26 101.79 7.3% 95.24 - -
Non-Glass Packaging (000s)L12M YA % L9M YA % L6M YA % L3M YA % L1M YA %
Barrels 0 0 -32.4% 0 0 -32.4% 0 0 - 0 0 - 0 0 -Value (USD) 8 12 -30.7% 8 12 -30.7% 8 0 - 8 0 - 0 0 -USD/Barrel 181.30 177.01 2.4% 181.30 177.01 2.4% 181.30 - - 181.30 - - - - -Value (EUR) 6 8 -25.4% 6 8 -25.4% 6 0 - 6 0 - 0 0 -EUR/Barrel 133.00 120.68 10.2% 133.00 120.68 10.2% 133.00 - - 133.00 - - - - -
June 2009 Page 13
bw166 Beer - Imports and Exports Report
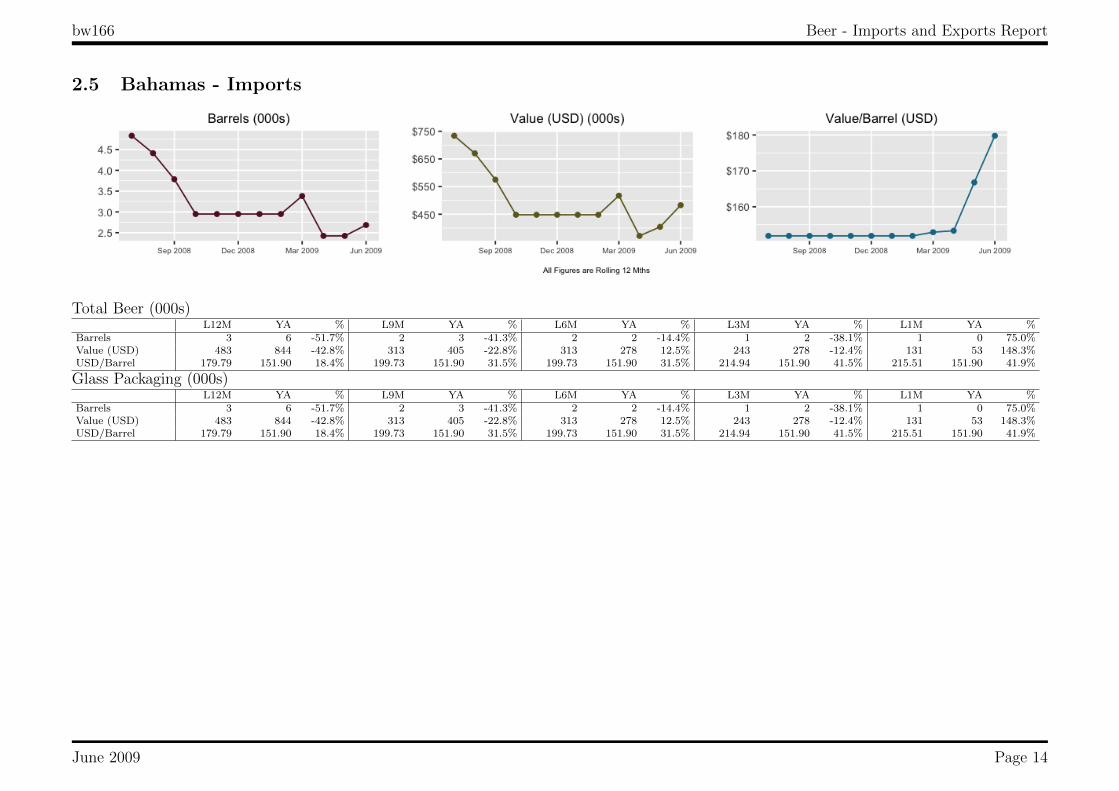
2.5 Bahamas - Imports
Total Beer (000s)L12M YA % L9M YA % L6M YA % L3M YA % L1M YA %
Barrels 3 6 -51.7% 2 3 -41.3% 2 2 -14.4% 1 2 -38.1% 1 0 75.0%Value (USD) 483 844 -42.8% 313 405 -22.8% 313 278 12.5% 243 278 -12.4% 131 53 148.3%USD/Barrel 179.79 151.90 18.4% 199.73 151.90 31.5% 199.73 151.90 31.5% 214.94 151.90 41.5% 215.51 151.90 41.9%
Glass Packaging (000s)L12M YA % L9M YA % L6M YA % L3M YA % L1M YA %
Barrels 3 6 -51.7% 2 3 -41.3% 2 2 -14.4% 1 2 -38.1% 1 0 75.0%Value (USD) 483 844 -42.8% 313 405 -22.8% 313 278 12.5% 243 278 -12.4% 131 53 148.3%USD/Barrel 179.79 151.90 18.4% 199.73 151.90 31.5% 199.73 151.90 31.5% 214.94 151.90 41.5% 215.51 151.90 41.9%
June 2009 Page 14

bw166 Beer - Imports and Exports Report
2.6 Barbados - Imports
Total Beer (000s)L12M YA % L9M YA % L6M YA % L3M YA % L1M YA %
Barrels 1 1 -2.0% 0 1 -59.2% 0 1 -67.3% 0 1 -75.5% 0 1 -65.9%Value (USD) 224 241 -7.2% 94 241 -60.8% 78 241 -67.8% 60 241 -75.2% 39 109 -64.0%USD/Barrel 203.82 215.34 -5.3% 206.47 215.34 -4.1% 212.36 215.34 -1.4% 218.08 215.34 1.3% 214.73 203.49 5.5%
Glass Packaging (000s)L12M YA % L9M YA % L6M YA % L3M YA % L1M YA %
Barrels 1 1 -2.0% 0 1 -59.2% 0 1 -67.3% 0 1 -75.5% 0 1 -65.9%Value (USD) 224 241 -7.2% 94 241 -60.8% 78 241 -67.8% 60 241 -75.2% 39 109 -64.0%USD/Barrel 203.82 215.34 -5.3% 206.47 215.34 -4.1% 212.36 215.34 -1.4% 218.08 215.34 1.3% 214.73 203.49 5.5%
June 2009 Page 15

bw166 Beer - Imports and Exports Report
2.7 Belgium - Imports
Total Beer (000s)L12M YA % L9M YA % L6M YA % L3M YA % L1M YA %
Barrels 1,014 1,020 -0.6% 700 763 -8.3% 394 425 -7.2% 229 271 -15.6% 70 109 -35.7%Value (USD) 140,272 138,737 1.1% 96,953 103,637 -6.4% 53,268 58,954 -9.6% 32,037 36,561 -12.4% 10,054 14,000 -28.2%USD/Barrel 138.40 136.01 1.8% 138.57 135.85 2.0% 135.16 138.84 -2.7% 140.12 135.01 3.8% 143.51 128.59 11.6%Value (EUR) 101,624 94,651 7.4% 72,954 69,070 5.6% 39,906 38,307 4.2% 23,608 23,409 0.9% 7,173 8,990 -20.2%EUR/Barrel 100.27 92.79 8.1% 104.27 90.54 15.2% 101.26 90.22 12.2% 103.25 86.44 19.4% 102.40 82.57 24.0%
Glass Packaging (000s)L12M YA % L9M YA % L6M YA % L3M YA % L1M YA %
Barrels 575 536 7.3% 401 406 -1.3% 180 209 -13.8% 125 135 -7.7% 31 58 -46.0%Value (USD) 106,356 102,685 3.6% 73,850 77,052 -4.2% 36,784 42,249 -12.9% 23,905 25,987 -8.0% 6,942 10,169 -31.7%USD/Barrel 184.84 191.52 -3.5% 184.34 189.83 -2.9% 204.21 202.12 1.0% 191.94 192.49 -0.3% 221.07 174.93 26.4%Value (EUR) 77,077 70,106 9.9% 55,558 51,427 8.0% 27,522 27,465 0.2% 17,645 16,642 6.0% 4,953 6,530 -24.1%EUR/Barrel 133.95 130.76 2.4% 138.68 126.70 9.5% 152.79 131.39 16.3% 141.68 123.27 14.9% 157.73 112.33 40.4%
Kegs (000s)L12M YA % L9M YA % L6M YA % L3M YA % L1M YA %
Barrels 437 479 -8.9% 298 355 -16.1% 213 215 -0.5% 104 135 -23.3% 39 50 -23.7%Value (USD) 33,483 34,930 -4.1% 22,847 26,014 -12.2% 16,355 16,348 0.0% 8,062 10,326 -21.9% 3,091 3,695 -16.3%USD/Barrel 76.70 72.89 5.2% 76.71 73.27 4.7% 76.64 76.21 0.6% 77.77 76.39 1.8% 80.29 73.24 9.6%Value (EUR) 24,237 23,763 2.0% 17,202 17,263 -0.4% 12,287 10,611 15.8% 5,911 6,608 -10.5% 2,206 2,373 -7.0%EUR/Barrel 55.52 49.58 12.0% 57.75 48.62 18.8% 57.58 49.46 16.4% 57.02 48.89 16.6% 57.28 47.03 21.8%
Non-Glass Packaging (000s)L12M YA % L9M YA % L6M YA % L3M YA % L1M YA %
Barrels 2 5 -66.4% 1 2 -38.8% 1 1 -44.1% 0 1 -31.9% 0 0 -48.7%Value (USD) 433 1,122 -61.4% 256 572 -55.1% 129 356 -63.8% 69 248 -72.1% 20 136 -85.1%USD/Barrel 279.10 242.77 15.0% 216.17 294.80 -26.7% 217.32 335.25 -35.2% 160.26 390.99 -59.0% 137.65 472.87 -70.9%Value (EUR) 310 782 -60.3% 194 380 -49.0% 97 231 -58.2% 51 159 -67.9% 15 87 -83.4%EUR/Barrel 199.92 169.15 18.2% 163.49 195.92 -16.6% 162.57 217.53 -25.3% 117.85 250.11 -52.9% 98.21 303.64 -67.7%
June 2009 Page 16

bw166 Beer - Imports and Exports Report
2.8 Bolivia - Imports
Total Beer (000s)L12M YA % L9M YA % L6M YA % L3M YA % L1M YA %
Barrels 0 0 -33.8% 0 0 -51.4% 0 0 -67.2% 0 0 -1.7% 0 0 -Value (USD) 35 51 -31.1% 18 33 -45.0% 8 24 -65.3% 8 7 16.4% 0 0 -USD/Barrel 107.57 103.36 4.1% 112.19 99.07 13.2% 103.09 97.72 5.5% 103.09 87.00 18.5% - - -
Glass Packaging (000s)L12M YA % L9M YA % L6M YA % L3M YA % L1M YA %
Barrels 0 0 -33.8% 0 0 -51.4% 0 0 -67.2% 0 0 -1.7% 0 0 -Value (USD) 35 51 -31.1% 18 33 -45.0% 8 24 -65.3% 8 7 16.4% 0 0 -USD/Barrel 107.57 103.36 4.1% 112.19 99.07 13.2% 103.09 97.72 5.5% 103.09 87.00 18.5% - - -
June 2009 Page 17

bw166 Beer - Imports and Exports Report
2.9 Bosnia and Herzegovina - Imports
Total Beer (000s)L12M YA % L9M YA % L6M YA % L3M YA % L1M YA %
Barrels 0 0 -49.0% 0 0 -100.0% 0 0 -100.0% 0 0 -100.0% 0 0 -100.0%Value (USD) 26 52 -50.0% 0 52 -100.0% 0 52 -100.0% 0 13 -100.0% 0 13 -100.0%USD/Barrel 143.01 145.81 -1.9% - 145.81 - - 145.81 - - 143.77 - - 143.77 -
Glass Packaging (000s)L12M YA % L9M YA % L6M YA % L3M YA % L1M YA %
Barrels 0 0 -49.0% 0 0 -100.0% 0 0 -100.0% 0 0 -100.0% 0 0 -100.0%Value (USD) 26 52 -50.0% 0 52 -100.0% 0 52 -100.0% 0 13 -100.0% 0 13 -100.0%USD/Barrel 143.01 145.81 -1.9% - 145.81 - - 145.81 - - 143.77 - - 143.77 -
June 2009 Page 18

bw166 Beer - Imports and Exports Report
2.10 Brazil - Imports
Total Beer (000s)L12M YA % L9M YA % L6M YA % L3M YA % L1M YA %
Barrels 8 10 -20.6% 6 6 1.8% 4 5 -18.5% 2 3 -22.7% 0 2 -71.6%Value (USD) 1,077 1,299 -17.1% 909 846 7.4% 529 696 -23.9% 303 438 -30.8% 69 213 -67.9%USD/Barrel 138.13 132.28 4.4% 142.98 135.52 5.5% 131.75 141.11 -6.6% 131.21 146.49 -10.4% 139.98 123.82 13.0%Value (BRL) 2,257 2,302 -2.0% 1,987 1,437 38.3% 1,155 1,168 -1.1% 634 720 -11.9% 134 345 -61.3%BRL/Barrel 289.53 234.54 23.4% 312.40 230.05 35.8% 287.41 236.80 21.4% 274.22 240.54 14.0% 272.81 200.26 36.2%
Glass Packaging (000s)L12M YA % L9M YA % L6M YA % L3M YA % L1M YA %
Barrels 7 10 -24.2% 6 6 2.2% 4 5 -18.2% 2 3 -22.7% 0 2 -71.6%Value (USD) 1,053 1,288 -18.3% 909 836 8.7% 529 686 -22.8% 303 438 -30.8% 69 213 -67.9%USD/Barrel 141.73 131.51 7.8% 142.98 134.33 6.4% 131.75 139.63 -5.6% 131.21 146.49 -10.4% 139.98 123.82 13.0%Value (BRL) 2,218 2,285 -2.9% 1,987 1,419 40.0% 1,155 1,150 0.4% 634 720 -11.9% 134 345 -61.3%BRL/Barrel 298.66 233.23 28.1% 312.40 227.97 37.0% 287.41 234.20 22.7% 274.22 240.54 14.0% 272.81 200.26 36.2%
Non-Glass Packaging (000s)L12M YA % L9M YA % L6M YA % L3M YA % L1M YA %
Barrels 0 0 - 0 0 - 0 0 - 0 0 - 0 0 -Value (USD) 24 0 - 0 0 - 0 0 - 0 0 - 0 0 -USD/Barrel 65.66 - - - - - - - - - - - - - -Value (BRL) 39 0 - 0 0 - 0 0 - 0 0 - 0 0 -BRL/Barrel 105.44 - - - - - - - - - - - - - -
Kegs (000s)L12M YA % L9M YA % L6M YA % L3M YA % L1M YA %
Barrels 0 0 -100.0% 0 0 -100.0% 0 0 -100.0% 0 0 - 0 0 -Value (USD) 0 10 -100.0% 0 10 -100.0% 0 10 -100.0% 0 0 - 0 0 -USD/Barrel - 497.80 - - 497.80 - - 497.80 - - - - - - -Value (BRL) 0 18 -100.0% 0 18 -100.0% 0 18 -100.0% 0 0 - 0 0 -BRL/Barrel - 863.05 - - 863.05 - - 863.05 - - - - - - -
June 2009 Page 19

bw166 Beer - Imports and Exports Report
2.11 Bulgaria - Imports
Total Beer (000s)L12M YA % L9M YA % L6M YA % L3M YA % L1M YA %
Barrels 0 1 -69.0% 0 1 -70.4% 0 0 -34.5% 0 0 15.3% 0 0 -Value (USD) 40 119 -66.5% 27 97 -72.1% 11 26 -56.8% 11 15 -25.7% 3 0 -USD/Barrel 123.25 113.93 8.2% 110.62 117.31 -5.7% 68.98 104.52 -34.0% 68.98 107.06 -35.6% 32.50 - -
Glass Packaging (000s)L12M YA % L9M YA % L6M YA % L3M YA % L1M YA %
Barrels 0 1 -69.0% 0 1 -70.4% 0 0 -34.5% 0 0 15.3% 0 0 -Value (USD) 40 119 -66.5% 27 97 -72.1% 11 26 -56.8% 11 15 -25.7% 3 0 -USD/Barrel 123.25 113.93 8.2% 110.62 117.31 -5.7% 68.98 104.52 -34.0% 68.98 107.06 -35.6% 32.50 - -
June 2009 Page 20

bw166 Beer - Imports and Exports Report
2.12 Canada - Imports
Total Beer (000s)L12M YA % L9M YA % L6M YA % L3M YA % L1M YA %
Barrels 2,718 3,227 -15.8% 1,906 2,330 -18.2% 1,181 1,551 -23.9% 689 858 -19.7% 250 282 -11.4%Value (USD) 236,722 292,519 -19.1% 158,821 218,731 -27.4% 92,551 150,419 -38.5% 53,475 81,108 -34.1% 19,462 25,180 -22.7%USD/Barrel 87.10 90.65 -3.9% 83.31 93.88 -11.3% 78.39 96.96 -19.1% 77.60 94.50 -17.9% 77.76 89.16 -12.8%Value (CAD) 271,689 295,626 -8.1% 190,789 218,346 -12.6% 110,836 151,457 -26.8% 62,277 81,868 -23.9% 21,876 25,560 -14.4%CAD/Barrel 99.97 91.61 9.1% 100.08 93.72 6.8% 93.88 97.62 -3.8% 90.37 95.39 -5.3% 87.40 90.50 -3.4%
Glass Packaging (000s)L12M YA % L9M YA % L6M YA % L3M YA % L1M YA %
Barrels 1,534 1,915 -19.9% 1,050 1,417 -25.9% 618 948 -34.8% 330 502 -34.3% 109 148 -26.1%Value (USD) 167,204 212,106 -21.2% 110,102 161,029 -31.6% 61,813 111,266 -44.4% 33,322 58,366 -42.9% 11,156 16,956 -34.2%USD/Barrel 108.99 110.76 -1.6% 104.84 113.62 -7.7% 99.96 117.35 -14.8% 100.98 116.27 -13.2% 101.97 114.59 -11.0%Value (CAD) 191,833 214,191 -10.4% 132,519 160,718 -17.5% 74,270 112,010 -33.7% 38,896 58,904 -34.0% 12,539 17,212 -27.1%CAD/Barrel 125.04 111.84 11.8% 126.19 113.40 11.3% 120.10 118.13 1.7% 117.87 117.35 0.4% 114.61 116.32 -1.5%
Non-Glass Packaging (000s)L12M YA % L9M YA % L6M YA % L3M YA % L1M YA %
Barrels 780 749 4.1% 585 502 16.4% 404 328 23.2% 280 223 25.3% 106 87 22.2%Value (USD) 49,858 50,933 -2.1% 36,907 34,132 8.1% 24,849 22,470 10.6% 17,304 15,244 13.5% 6,953 5,732 21.3%USD/Barrel 63.94 67.98 -5.9% 63.13 67.98 -7.1% 61.57 68.57 -10.2% 61.86 68.29 -9.4% 65.53 66.01 -0.7%Value (CAD) 57,479 51,671 11.2% 44,040 34,053 29.3% 29,480 22,643 30.2% 20,071 15,393 30.4% 7,816 5,818 34.3%CAD/Barrel 73.72 68.96 6.9% 75.33 67.82 11.1% 73.04 69.09 5.7% 71.76 68.96 4.1% 73.66 67.01 9.9%
Kegs (000s)L12M YA % L9M YA % L6M YA % L3M YA % L1M YA %
Barrels 404 563 -28.2% 272 410 -33.8% 159 276 -42.4% 79 133 -40.3% 35 48 -27.0%Value (USD) 19,659 29,480 -33.3% 11,811 23,571 -49.9% 5,888 16,683 -64.7% 2,849 7,499 -62.0% 1,353 2,491 -45.7%USD/Barrel 48.67 52.41 -7.1% 43.48 57.42 -24.3% 37.13 60.54 -38.7% 35.87 56.35 -36.4% 38.90 52.33 -25.7%Value (CAD) 22,378 29,764 -24.8% 14,230 23,575 -39.6% 7,086 16,803 -57.8% 3,310 7,570 -56.3% 1,521 2,529 -39.9%CAD/Barrel 55.40 52.91 4.7% 52.39 57.43 -8.8% 44.68 60.98 -26.7% 41.68 56.89 -26.7% 43.73 53.12 -17.7%
June 2009 Page 21

bw166 Beer - Imports and Exports Report
2.13 China - Imports
Total Beer (000s)L12M YA % L9M YA % L6M YA % L3M YA % L1M YA %
Barrels 63 68 -6.7% 49 49 -1.0% 33 33 -0.8% 17 19 -9.5% 4 7 -40.3%Value (USD) 5,353 5,961 -10.2% 4,100 4,409 -7.0% 2,761 3,073 -10.1% 1,399 1,766 -20.8% 337 687 -51.0%USD/Barrel 84.44 87.70 -3.7% 83.87 89.34 -6.1% 83.19 91.87 -9.4% 83.08 94.88 -12.4% 80.50 98.04 -17.9%
Glass Packaging (000s)L12M YA % L9M YA % L6M YA % L3M YA % L1M YA %
Barrels 63 66 -5.6% 48 48 0.6% 33 33 0.8% 17 18 -7.7% 4 6 -34.7%Value (USD) 5,307 5,801 -8.5% 4,071 4,270 -4.7% 2,742 2,955 -7.2% 1,380 1,656 -16.6% 333 577 -42.3%USD/Barrel 84.71 87.37 -3.0% 84.09 88.71 -5.2% 83.40 90.55 -7.9% 83.49 92.45 -9.7% 80.90 91.51 -11.6%
Non-Glass Packaging (000s)L12M YA % L9M YA % L6M YA % L3M YA % L1M YA %
Barrels 1 2 -52.9% 0 1 -61.5% 0 1 -62.4% 0 1 -56.0% 0 1 -90.2%Value (USD) 46 161 -71.4% 29 139 -79.5% 19 118 -84.1% 19 110 -82.9% 4 110 -96.5%USD/Barrel 61.81 101.73 -39.2% 60.87 113.96 -46.6% 61.06 144.07 -57.6% 61.06 156.66 -61.0% 56.35 156.66 -64.0%
June 2009 Page 22
bw166 Beer - Imports and Exports Report
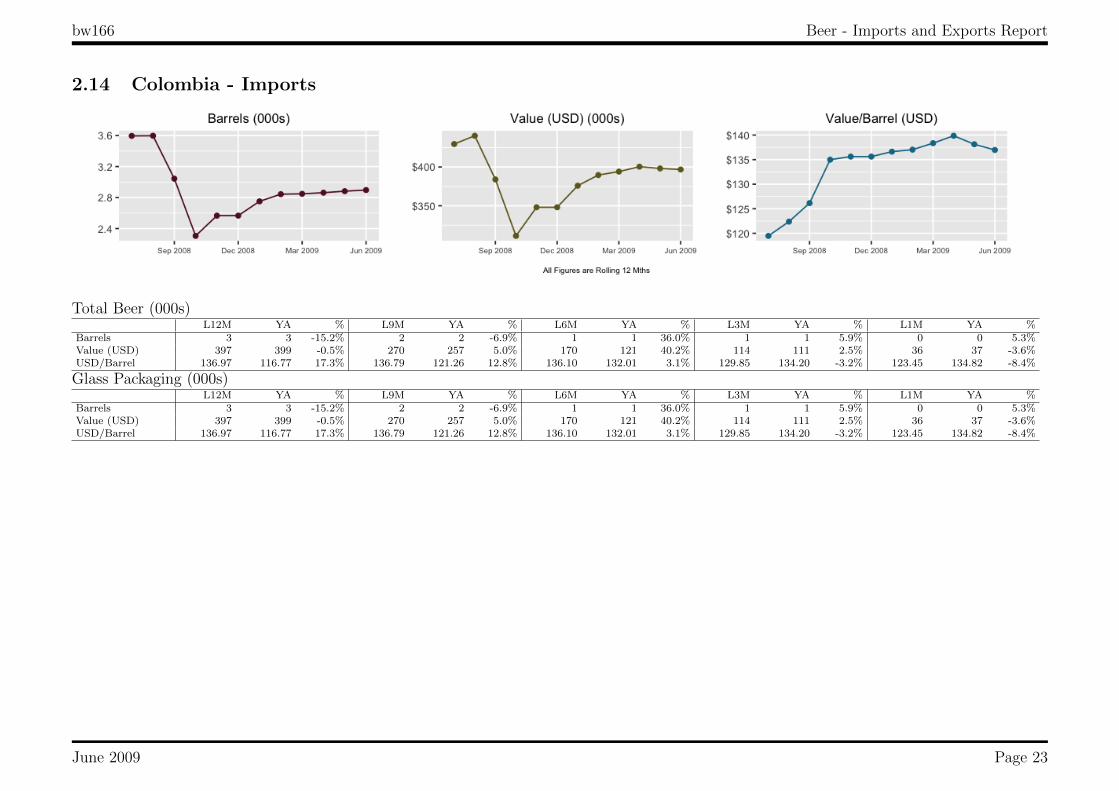
2.14 Colombia - Imports
Total Beer (000s)L12M YA % L9M YA % L6M YA % L3M YA % L1M YA %
Barrels 3 3 -15.2% 2 2 -6.9% 1 1 36.0% 1 1 5.9% 0 0 5.3%Value (USD) 397 399 -0.5% 270 257 5.0% 170 121 40.2% 114 111 2.5% 36 37 -3.6%USD/Barrel 136.97 116.77 17.3% 136.79 121.26 12.8% 136.10 132.01 3.1% 129.85 134.20 -3.2% 123.45 134.82 -8.4%
Glass Packaging (000s)L12M YA % L9M YA % L6M YA % L3M YA % L1M YA %
Barrels 3 3 -15.2% 2 2 -6.9% 1 1 36.0% 1 1 5.9% 0 0 5.3%Value (USD) 397 399 -0.5% 270 257 5.0% 170 121 40.2% 114 111 2.5% 36 37 -3.6%USD/Barrel 136.97 116.77 17.3% 136.79 121.26 12.8% 136.10 132.01 3.1% 129.85 134.20 -3.2% 123.45 134.82 -8.4%
June 2009 Page 23

bw166 Beer - Imports and Exports Report
2.15 Costa Rica - Imports
Total Beer (000s)L12M YA % L9M YA % L6M YA % L3M YA % L1M YA %
Barrels 4 5 -18.9% 3 3 -21.5% 2 2 -31.8% 1 2 -18.8% 1 0 100.0%Value (USD) 385 443 -13.0% 253 296 -14.5% 148 192 -22.9% 138 151 -8.9% 64 28 124.2%USD/Barrel 89.99 83.83 7.3% 92.17 84.62 8.9% 96.17 85.08 13.0% 96.52 86.09 12.1% 96.52 86.09 12.1%
Glass Packaging (000s)L12M YA % L9M YA % L6M YA % L3M YA % L1M YA %
Barrels 4 5 -18.9% 3 3 -21.5% 2 2 -31.8% 1 2 -18.8% 1 0 100.0%Value (USD) 385 443 -13.0% 253 296 -14.5% 148 192 -22.9% 138 151 -8.9% 64 28 124.2%USD/Barrel 89.99 83.83 7.3% 92.17 84.62 8.9% 96.17 85.08 13.0% 96.52 86.09 12.1% 96.52 86.09 12.1%
June 2009 Page 24

bw166 Beer - Imports and Exports Report
2.16 Croatia - Imports
Total Beer (000s)L12M YA % L9M YA % L6M YA % L3M YA % L1M YA %
Barrels 1 1 85.8% 1 0 - 1 0 - 1 0 - 0 0 -Value (USD) 148 71 109.3% 99 0 - 79 0 - 79 0 - 42 0 -USD/Barrel 137.56 122.14 12.6% 130.63 - - 132.98 - - 132.98 - - 140.90 - -
Glass Packaging (000s)L12M YA % L9M YA % L6M YA % L3M YA % L1M YA %
Barrels 1 1 85.8% 1 0 - 1 0 - 1 0 - 0 0 -Value (USD) 148 71 109.3% 99 0 - 79 0 - 79 0 - 42 0 -USD/Barrel 137.56 122.14 12.6% 130.63 - - 132.98 - - 132.98 - - 140.90 - -
June 2009 Page 25

bw166 Beer - Imports and Exports Report
2.17 Czech Republic - Imports
Total Beer (000s)L12M YA % L9M YA % L6M YA % L3M YA % L1M YA %
Barrels 117 145 -19.4% 84 107 -21.0% 54 70 -23.0% 33 41 -18.9% 16 14 12.4%Value (USD) 13,015 15,413 -15.6% 8,890 11,821 -24.8% 5,566 8,141 -31.6% 3,398 4,937 -31.2% 1,658 1,773 -6.5%USD/Barrel 111.10 106.10 4.7% 105.41 110.68 -4.8% 102.67 115.71 -11.3% 102.18 120.49 -15.2% 102.63 123.33 -16.8%
Glass Packaging (000s)L12M YA % L9M YA % L6M YA % L3M YA % L1M YA %
Barrels 90 113 -20.2% 66 82 -19.2% 42 53 -21.3% 26 31 -17.3% 12 11 12.0%Value (USD) 11,332 13,566 -16.5% 7,867 10,322 -23.8% 4,930 7,059 -30.2% 3,021 4,270 -29.2% 1,463 1,543 -5.2%USD/Barrel 125.36 119.80 4.6% 118.75 125.89 -5.7% 117.15 132.06 -11.3% 117.74 137.59 -14.4% 117.96 139.29 -15.3%
Kegs (000s)L12M YA % L9M YA % L6M YA % L3M YA % L1M YA %
Barrels 24 29 -17.3% 17 23 -26.6% 11 15 -26.8% 7 9 -21.2% 3 3 14.5%Value (USD) 1,334 1,549 -13.9% 855 1,258 -32.1% 546 907 -39.8% 315 555 -43.2% 144 186 -22.7%USD/Barrel 55.46 53.22 4.2% 51.39 55.57 -7.5% 48.20 58.65 -17.8% 44.33 61.55 -28.0% 42.78 63.34 -32.5%
Non-Glass Packaging (000s)L12M YA % L9M YA % L6M YA % L3M YA % L1M YA %
Barrels 3 3 -8.5% 1 2 -32.4% 1 1 -43.8% 0 1 -47.8% 0 0 7.9%Value (USD) 348 298 16.6% 168 240 -29.9% 90 175 -48.3% 61 112 -45.3% 51 44 16.8%USD/Barrel 129.51 101.58 27.5% 114.91 110.82 3.7% 111.97 121.74 -8.0% 127.65 121.78 4.8% 132.90 122.83 8.2%
June 2009 Page 26

bw166 Beer - Imports and Exports Report
2.18 Denmark - Imports
Total Beer (000s)L12M YA % L9M YA % L6M YA % L3M YA % L1M YA %
Barrels 29 28 2.7% 20 18 8.2% 11 11 4.9% 8 5 58.2% 4 3 41.5%Value (USD) 3,967 3,793 4.6% 2,712 2,452 10.6% 1,721 1,368 25.8% 1,074 542 98.0% 565 295 91.4%USD/Barrel 138.44 135.97 1.8% 138.59 135.59 2.2% 152.03 126.75 19.9% 136.60 109.12 25.2% 153.63 113.57 35.3%
Glass Packaging (000s)L12M YA % L9M YA % L6M YA % L3M YA % L1M YA %
Barrels 21 25 -16.8% 13 15 -13.6% 8 8 -1.3% 6 3 122.9% 3 2 84.5%Value (USD) 3,530 3,663 -3.6% 2,356 2,335 0.9% 1,535 1,262 21.7% 967 451 114.6% 518 259 100.3%USD/Barrel 170.23 146.97 15.8% 178.42 152.75 16.8% 189.66 153.92 23.2% 165.94 172.36 -3.7% 169.45 156.02 8.6%
Kegs (000s)L12M YA % L9M YA % L6M YA % L3M YA % L1M YA %
Barrels 7 3 141.6% 6 3 106.3% 3 3 12.7% 2 2 -20.0% 0 1 -50.0%Value (USD) 302 130 133.0% 248 117 112.3% 132 106 23.9% 80 91 -12.9% 20 37 -45.6%USD/Barrel 42.13 43.69 -3.6% 42.94 41.72 2.9% 45.03 40.96 9.9% 42.25 38.81 8.9% 42.25 38.81 8.9%
Non-Glass Packaging (000s)L12M YA % L9M YA % L6M YA % L3M YA % L1M YA %
Barrels 1 0 - 1 0 - 0 0 - 0 0 - 0 0 -Value (USD) 134 0 - 108 0 - 54 0 - 27 0 - 27 0 -USD/Barrel 181.54 - - 181.72 - - 180.81 - - 180.81 - - 180.81 - -
June 2009 Page 27

bw166 Beer - Imports and Exports Report
2.19 Dominican Republic - Imports
Total Beer (000s)L12M YA % L9M YA % L6M YA % L3M YA % L1M YA %
Barrels 129 117 10.3% 97 88 9.6% 64 62 2.3% 40 36 10.8% 18 12 43.9%Value (USD) 21,113 18,962 11.3% 15,782 14,181 11.3% 10,505 10,169 3.3% 6,687 5,875 13.8% 2,961 1,984 49.3%USD/Barrel 163.11 161.60 0.9% 163.43 160.94 1.5% 164.46 162.78 1.0% 167.73 163.23 2.8% 167.85 161.82 3.7%
Glass Packaging (000s)L12M YA % L9M YA % L6M YA % L3M YA % L1M YA %
Barrels 118 109 8.4% 88 81 9.6% 58 57 1.9% 37 33 13.7% 17 11 48.5%Value (USD) 19,639 17,732 10.8% 14,775 13,117 12.6% 9,829 9,387 4.7% 6,364 5,400 17.9% 2,865 1,848 55.0%USD/Barrel 166.87 163.33 2.2% 167.35 162.89 2.7% 169.08 164.62 2.7% 171.60 165.58 3.6% 171.65 164.44 4.4%
Non-Glass Packaging (000s)L12M YA % L9M YA % L6M YA % L3M YA % L1M YA %
Barrels 9 8 4.7% 6 7 -17.1% 4 5 -19.3% 2 3 -35.4% 1 1 -27.7%Value (USD) 1,274 1,201 6.1% 853 1,038 -17.8% 564 756 -25.3% 264 449 -41.1% 73 125 -41.7%USD/Barrel 146.17 144.24 1.3% 143.28 144.38 -0.8% 138.50 149.60 -7.4% 137.25 150.51 -8.8% 117.33 145.41 -19.3%
Kegs (000s)L12M YA % L9M YA % L6M YA % L3M YA % L1M YA %
Barrels 3 0 579.0% 2 0 488.6% 2 0 322.4% 1 0 115.6% 0 0 107.8%Value (USD) 201 29 593.8% 154 26 499.4% 111 26 333.1% 58 26 126.3% 23 10 125.6%USD/Barrel 65.95 64.55 2.2% 66.23 65.04 1.8% 66.70 65.04 2.5% 68.27 65.04 5.0% 70.61 65.05 8.6%
June 2009 Page 28

bw166 Beer - Imports and Exports Report
2.20 El Salvador - Imports
Total Beer (000s)L12M YA % L9M YA % L6M YA % L3M YA % L1M YA %
Barrels 63 42 49.2% 48 31 52.5% 32 23 38.5% 20 12 63.1% 9 5 77.5%Value (USD) 5,277 3,298 60.0% 4,063 2,491 63.1% 2,710 1,827 48.3% 1,676 1,009 66.1% 722 394 83.0%USD/Barrel 84.41 78.70 7.3% 84.81 79.32 6.9% 83.95 78.40 7.1% 84.83 83.30 1.8% 84.47 81.91 3.1%
Glass Packaging (000s)L12M YA % L9M YA % L6M YA % L3M YA % L1M YA %
Barrels 38 28 37.0% 29 21 34.1% 18 16 17.9% 12 9 29.4% 5 3 74.2%Value (USD) 3,662 2,523 45.2% 2,761 1,936 42.6% 1,765 1,403 25.8% 1,147 848 35.2% 506 293 72.8%USD/Barrel 95.69 90.30 6.0% 95.85 90.15 6.3% 95.79 89.77 6.7% 95.49 91.36 4.5% 94.47 95.25 -0.8%
Non-Glass Packaging (000s)L12M YA % L9M YA % L6M YA % L3M YA % L1M YA %
Barrels 24 14 73.6% 19 10 92.5% 14 8 80.4% 8 3 173.7% 3 2 83.1%Value (USD) 1,615 775 108.4% 1,302 555 134.6% 945 424 122.7% 529 161 228.6% 216 102 112.4%USD/Barrel 66.62 55.49 20.1% 68.15 55.90 21.9% 68.21 55.26 23.4% 68.31 56.89 20.1% 67.74 58.42 16.0%
June 2009 Page 29

bw166 Beer - Imports and Exports Report
2.21 Ethiopia - Imports
Total Beer (000s)L12M YA % L9M YA % L6M YA % L3M YA % L1M YA %
Barrels 2 1 42.1% 2 1 52.5% 1 1 17.1% 0 0 23.0% 0 0 -Value (USD) 348 223 56.3% 295 170 74.3% 183 139 31.5% 74 58 28.3% 13 0 -USD/Barrel 187.48 170.38 10.0% 187.01 163.68 14.3% 187.36 166.78 12.3% 170.53 163.44 4.3% 178.03 - -
Glass Packaging (000s)L12M YA % L9M YA % L6M YA % L3M YA % L1M YA %
Barrels 2 1 42.1% 2 1 52.5% 1 1 17.1% 0 0 23.0% 0 0 -Value (USD) 348 223 56.3% 295 170 74.3% 183 139 31.5% 74 58 28.3% 13 0 -USD/Barrel 187.48 170.38 10.0% 187.01 163.68 14.3% 187.36 166.78 12.3% 170.53 163.44 4.3% 178.03 - -
June 2009 Page 30

bw166 Beer - Imports and Exports Report
2.22 France - Imports
Total Beer (000s)L12M YA % L9M YA % L6M YA % L3M YA % L1M YA %
Barrels 14 21 -32.4% 10 15 -29.9% 7 12 -43.6% 4 7 -39.8% 2 2 51.7%Value (USD) 1,730 2,283 -24.2% 1,261 1,746 -27.8% 815 1,372 -40.6% 507 751 -32.6% 342 184 86.0%USD/Barrel 123.58 110.16 12.2% 120.44 116.92 3.0% 121.30 115.20 5.3% 125.82 112.32 12.0% 137.21 111.93 22.6%Value (EUR) 1,258 1,546 -18.6% 945 1,155 -18.2% 604 896 -32.6% 367 480 -23.5% 244 118 106.7%EUR/Barrel 89.83 74.59 20.4% 90.26 77.34 16.7% 89.96 75.26 19.5% 91.21 71.77 27.1% 97.90 71.87 36.2%
Glass Packaging (000s)L12M YA % L9M YA % L6M YA % L3M YA % L1M YA %
Barrels 9 13 -34.6% 6 10 -37.8% 4 8 -53.1% 3 4 -39.1% 2 1 52.7%Value (USD) 1,384 1,707 -18.9% 994 1,377 -27.8% 623 1,082 -42.4% 424 574 -26.1% 295 147 99.9%USD/Barrel 162.52 131.06 24.0% 157.52 135.66 16.1% 163.50 133.00 22.9% 162.91 134.22 21.4% 170.62 130.34 30.9%Value (EUR) 1,004 1,152 -12.9% 744 912 -18.4% 460 708 -35.0% 308 367 -16.2% 210 95 122.1%EUR/Barrel 117.88 88.46 33.3% 117.85 89.82 31.2% 120.72 87.01 38.7% 118.04 85.78 37.6% 121.74 83.70 45.5%
Kegs (000s)L12M YA % L9M YA % L6M YA % L3M YA % L1M YA %
Barrels 5 8 -30.1% 4 5 -15.1% 3 4 -25.6% 1 2 -41.0% 1 1 49.6%Value (USD) 329 576 -43.0% 249 369 -32.6% 180 290 -37.9% 82 177 -53.5% 47 36 29.9%USD/Barrel 60.98 74.82 -18.5% 61.27 77.12 -20.5% 64.10 76.83 -16.6% 57.86 73.45 -21.2% 61.81 71.22 -13.2%Value (EUR) 240 394 -39.0% 187 243 -23.0% 135 189 -28.2% 60 113 -47.1% 34 23 44.3%EUR/Barrel 44.58 51.14 -12.8% 46.12 50.83 -9.3% 48.18 49.94 -3.5% 42.05 46.89 -10.3% 44.10 45.73 -3.6%
Non-Glass Packaging (000s)L12M YA % L9M YA % L6M YA % L3M YA % L1M YA %
Barrels 0 0 - 0 0 - 0 0 - 0 0 - 0 0 -Value (USD) 18 0 - 18 0 - 11 0 - 0 0 - 0 0 -USD/Barrel 182.10 - - 182.10 - - 119.20 - - - - - - - -Value (EUR) 14 0 - 14 0 - 8 0 - 0 0 - 0 0 -EUR/Barrel 141.14 - - 141.14 - - 91.51 - - - - - - - -
June 2009 Page 31

bw166 Beer - Imports and Exports Report
2.23 French Polynesia - Imports
Total Beer (000s)L12M YA % L9M YA % L6M YA % L3M YA % L1M YA %
Barrels 2 2 -7.7% 2 2 -3.6% 1 1 -24.0% 1 1 -25.8% 0 0 -Value (USD) 582 580 0.3% 426 411 3.5% 179 227 -21.3% 152 201 -24.5% 0 0 -USD/Barrel 265.67 244.59 8.6% 267.78 249.48 7.3% 269.45 260.08 3.6% 269.45 264.82 1.8% - - -
Glass Packaging (000s)L12M YA % L9M YA % L6M YA % L3M YA % L1M YA %
Barrels 2 2 -9.5% 2 2 -5.2% 1 1 -24.5% 1 1 -26.4% 0 0 -Value (USD) 564 573 -1.5% 411 403 2.0% 171 219 -21.9% 145 194 -25.3% 0 0 -USD/Barrel 266.68 244.93 8.9% 269.04 250.07 7.6% 270.81 261.66 3.5% 271.06 266.88 1.6% - - -
Non-Glass Packaging (000s)L12M YA % L9M YA % L6M YA % L3M YA % L1M YA %
Barrels 0 0 114.1% 0 0 72.0% 0 0 -11.9% 0 0 -11.9% 0 0 -Value (USD) 18 8 128.5% 14 8 82.6% 8 8 -4.2% 8 8 -4.2% 0 0 -USD/Barrel 237.25 222.35 6.7% 236.12 222.35 6.2% 241.81 222.35 8.8% 241.81 222.35 8.8% - - -
June 2009 Page 32

bw166 Beer - Imports and Exports Report
2.24 Germany - Imports
Total Beer (000s)L12M YA % L9M YA % L6M YA % L3M YA % L1M YA %
Barrels 1,126 1,211 -7.0% 706 853 -17.3% 441 476 -7.4% 247 300 -17.7% 81 109 -25.8%Value (USD) 131,078 135,023 -2.9% 83,620 94,974 -12.0% 53,317 58,138 -8.3% 29,663 35,546 -16.6% 9,797 12,634 -22.5%USD/Barrel 116.41 111.51 4.4% 118.50 111.35 6.4% 120.96 122.15 -1.0% 120.12 118.41 1.4% 121.22 116.02 4.5%Value (EUR) 94,452 92,433 2.2% 63,096 63,254 -0.2% 39,956 37,827 5.6% 21,809 22,762 -4.2% 6,990 8,113 -13.8%EUR/Barrel 83.89 76.34 9.9% 89.41 74.16 20.6% 90.65 79.47 14.1% 88.31 75.82 16.5% 86.49 74.50 16.1%
Glass Packaging (000s)L12M YA % L9M YA % L6M YA % L3M YA % L1M YA %
Barrels 923 997 -7.4% 574 712 -19.3% 351 378 -7.1% 190 241 -21.1% 61 88 -31.2%Value (USD) 105,664 108,854 -2.9% 66,916 77,330 -13.5% 41,808 45,629 -8.4% 22,415 28,128 -20.3% 7,323 10,054 -27.2%USD/Barrel 114.43 109.17 4.8% 116.54 108.65 7.3% 119.07 120.75 -1.4% 118.01 116.85 1.0% 120.73 113.96 5.9%Value (EUR) 76,148 74,535 2.2% 50,540 51,566 -2.0% 31,353 29,690 5.6% 16,480 18,014 -8.5% 5,225 6,456 -19.1%EUR/Barrel 82.46 74.75 10.3% 88.02 72.45 21.5% 89.30 78.57 13.7% 86.76 74.83 15.9% 86.14 73.18 17.7%
Kegs (000s)L12M YA % L9M YA % L6M YA % L3M YA % L1M YA %
Barrels 157 173 -9.4% 100 111 -10.0% 69 77 -9.9% 42 45 -5.8% 15 17 -8.9%Value (USD) 21,260 22,729 -6.5% 13,766 15,042 -8.5% 9,597 10,653 -9.9% 5,888 6,139 -4.1% 2,018 2,239 -9.9%USD/Barrel 135.43 131.22 3.2% 138.09 135.84 1.7% 138.57 138.59 0.0% 139.43 136.93 1.8% 132.41 133.85 -1.1%Value (EUR) 15,289 15,572 -1.8% 10,343 9,973 3.7% 7,176 6,939 3.4% 4,328 3,929 10.1% 1,440 1,438 0.1%EUR/Barrel 97.39 89.90 8.3% 103.76 90.07 15.2% 103.61 90.26 14.8% 102.49 87.64 16.9% 94.47 85.95 9.9%
Non-Glass Packaging (000s)L12M YA % L9M YA % L6M YA % L3M YA % L1M YA %
Barrels 46 41 12.4% 32 30 4.4% 20 21 -3.7% 15 15 0.9% 5 4 24.8%Value (USD) 4,153 3,440 20.7% 2,938 2,602 12.9% 1,912 1,856 3.0% 1,359 1,279 6.3% 456 341 33.4%USD/Barrel 91.16 84.87 7.4% 92.38 85.44 8.1% 93.66 87.55 7.0% 92.00 87.34 5.3% 92.59 86.63 6.9%Value (EUR) 3,014 2,325 29.6% 2,213 1,714 29.1% 1,426 1,198 19.1% 1,001 819 22.3% 325 219 48.3%EUR/Barrel 66.16 57.37 15.3% 69.57 56.29 23.6% 69.86 56.51 23.6% 67.76 55.89 21.2% 66.06 55.63 18.8%
June 2009 Page 33

bw166 Beer - Imports and Exports Report
2.25 Greece - Imports
Total Beer (000s)L12M YA % L9M YA % L6M YA % L3M YA % L1M YA %
Barrels 6 4 54.3% 4 3 40.4% 2 1 75.9% 2 1 70.2% 1 0 183.6%Value (USD) 992 565 75.5% 622 400 55.4% 397 199 99.7% 263 141 86.6% 104 38 174.8%USD/Barrel 167.98 147.66 13.8% 164.71 148.84 10.7% 169.31 149.16 13.5% 165.64 151.03 9.7% 156.98 161.99 -3.1%Value (EUR) 713 389 83.4% 467 268 74.1% 297 129 129.1% 193 90 114.3% 74 24 205.4%EUR/Barrel 120.63 101.47 18.9% 123.73 99.80 24.0% 126.34 97.02 30.2% 121.35 96.38 25.9% 112.00 104.02 7.7%
Glass Packaging (000s)L12M YA % L9M YA % L6M YA % L3M YA % L1M YA %
Barrels 6 4 54.3% 4 3 40.4% 2 1 75.9% 2 1 70.2% 1 0 183.6%Value (USD) 992 565 75.5% 622 400 55.4% 397 199 99.7% 263 141 86.6% 104 38 174.8%USD/Barrel 167.98 147.66 13.8% 164.71 148.84 10.7% 169.31 149.16 13.5% 165.64 151.03 9.7% 156.98 161.99 -3.1%Value (EUR) 713 389 83.4% 467 268 74.1% 297 129 129.1% 193 90 114.3% 74 24 205.4%EUR/Barrel 120.63 101.47 18.9% 123.73 99.80 24.0% 126.34 97.02 30.2% 121.35 96.38 25.9% 112.00 104.02 7.7%
June 2009 Page 34

bw166 Beer - Imports and Exports Report
2.26 Guatemala - Imports
Total Beer (000s)L12M YA % L9M YA % L6M YA % L3M YA % L1M YA %
Barrels 10 15 -31.4% 7 10 -28.7% 5 6 -16.4% 2 3 -13.2% 1 1 21.8%Value (USD) 1,022 1,322 -22.7% 693 888 -22.0% 489 538 -9.3% 222 232 -4.4% 99 76 29.8%USD/Barrel 99.20 87.96 12.8% 97.88 89.47 9.4% 99.98 92.14 8.5% 99.73 90.57 10.1% 95.22 89.35 6.6%
Glass Packaging (000s)L12M YA % L9M YA % L6M YA % L3M YA % L1M YA %
Barrels 10 15 -30.6% 7 10 -28.3% 5 6 -16.4% 2 3 -13.2% 1 1 21.8%Value (USD) 1,022 1,314 -22.2% 693 885 -21.7% 489 538 -9.3% 222 232 -4.4% 99 76 29.8%USD/Barrel 99.20 88.44 12.2% 97.88 89.70 9.1% 99.98 92.14 8.5% 99.73 90.57 10.1% 95.22 89.35 6.6%
Non-Glass Packaging (000s)L12M YA % L9M YA % L6M YA % L3M YA % L1M YA %
Barrels 0 0 -100.0% 0 0 -100.0% 0 0 - 0 0 - 0 0 -Value (USD) 0 9 -100.0% 0 3 -100.0% 0 0 - 0 0 - 0 0 -USD/Barrel - 48.07 - - 48.07 - - - - - - - - - -
June 2009 Page 35

bw166 Beer - Imports and Exports Report
2.27 Haiti - Imports
Total Beer (000s)L12M YA % L9M YA % L6M YA % L3M YA % L1M YA %
Barrels 3 1 150.0% 2 0 - 1 0 - 1 0 - 0 0 -Value (USD) 377 211 78.3% 231 0 - 153 0 - 78 0 - 48 0 -USD/Barrel 147.40 206.68 -28.7% 145.84 - - 148.53 - - 152.54 - - 158.04 - -
Glass Packaging (000s)L12M YA % L9M YA % L6M YA % L3M YA % L1M YA %
Barrels 3 1 150.0% 2 0 - 1 0 - 1 0 - 0 0 -Value (USD) 377 211 78.3% 231 0 - 153 0 - 78 0 - 48 0 -USD/Barrel 147.40 206.68 -28.7% 145.84 - - 148.53 - - 152.54 - - 158.04 - -
June 2009 Page 36

bw166 Beer - Imports and Exports Report
2.28 Honduras - Imports
Total Beer (000s)L12M YA % L9M YA % L6M YA % L3M YA % L1M YA %
Barrels 1 1 189.2% 1 0 236.8% 1 0 368.7% 1 0 481.8% 1 0 -Value (USD) 175 51 242.1% 170 38 345.1% 147 21 590.5% 117 10 >999% 70 0 -USD/Barrel 117.69 99.52 18.3% 120.19 90.95 32.2% 127.12 86.29 47.3% 126.21 65.74 92.0% 127.96 - -
Glass Packaging (000s)L12M YA % L9M YA % L6M YA % L3M YA % L1M YA %
Barrels 1 1 189.2% 1 0 236.8% 1 0 368.7% 1 0 481.8% 1 0 -Value (USD) 175 51 242.1% 170 38 345.1% 147 21 590.5% 117 10 >999% 70 0 -USD/Barrel 117.69 99.52 18.3% 120.19 90.95 32.2% 127.12 86.29 47.3% 126.21 65.74 92.0% 127.96 - -
June 2009 Page 37

bw166 Beer - Imports and Exports Report
2.29 India - Imports
Total Beer (000s)L12M YA % L9M YA % L6M YA % L3M YA % L1M YA %
Barrels 11 13 -16.4% 8 9 -12.8% 5 6 -20.0% 2 4 -45.0% 1 1 3.8%Value (USD) 2,128 2,460 -13.5% 1,651 1,843 -10.4% 1,000 1,207 -17.1% 454 794 -42.9% 229 216 6.3%USD/Barrel 202.29 195.46 3.5% 203.13 197.77 2.7% 208.57 201.43 3.5% 211.55 203.66 3.9% 220.51 215.29 2.4%
Glass Packaging (000s)L12M YA % L9M YA % L6M YA % L3M YA % L1M YA %
Barrels 11 13 -16.4% 8 9 -12.8% 5 6 -20.0% 2 4 -45.0% 1 1 3.8%Value (USD) 2,128 2,460 -13.5% 1,651 1,843 -10.4% 1,000 1,207 -17.1% 454 794 -42.9% 229 216 6.3%USD/Barrel 202.29 195.46 3.5% 203.13 197.77 2.7% 208.57 201.43 3.5% 211.55 203.66 3.9% 220.51 215.29 2.4%
June 2009 Page 38
bw166 Beer - Imports and Exports Report
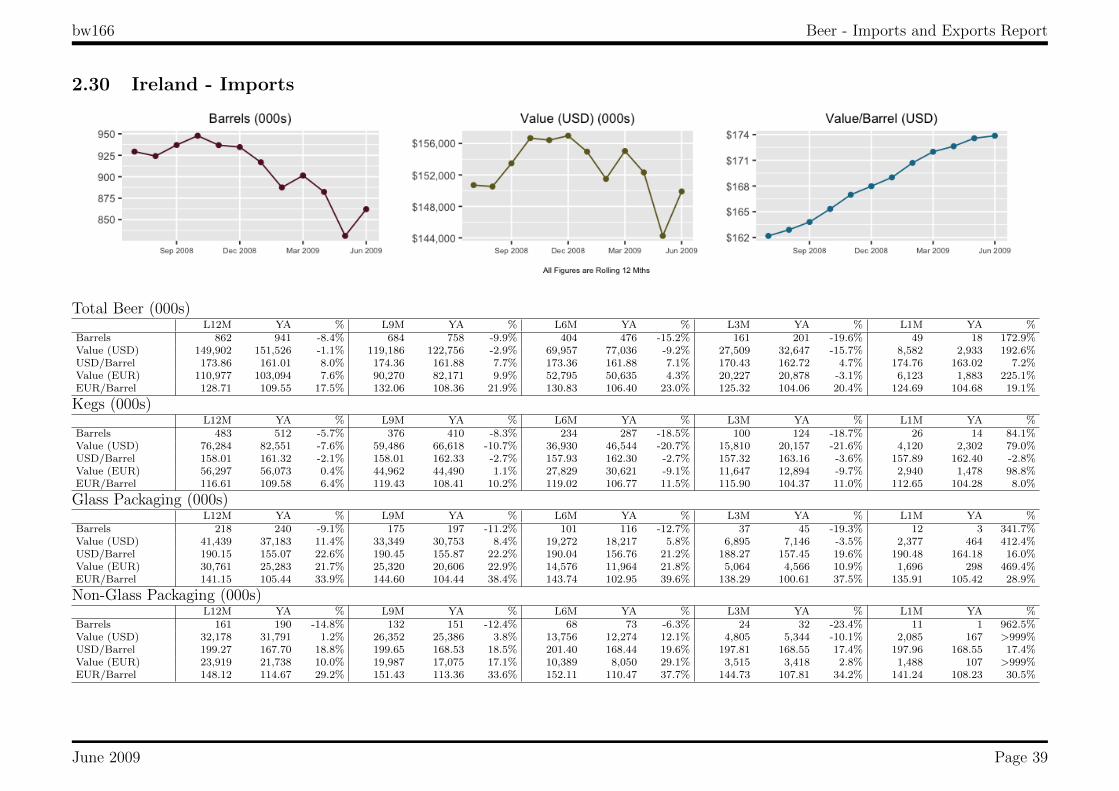
2.30 Ireland - Imports
Total Beer (000s)L12M YA % L9M YA % L6M YA % L3M YA % L1M YA %
Barrels 862 941 -8.4% 684 758 -9.9% 404 476 -15.2% 161 201 -19.6% 49 18 172.9%Value (USD) 149,902 151,526 -1.1% 119,186 122,756 -2.9% 69,957 77,036 -9.2% 27,509 32,647 -15.7% 8,582 2,933 192.6%USD/Barrel 173.86 161.01 8.0% 174.36 161.88 7.7% 173.36 161.88 7.1% 170.43 162.72 4.7% 174.76 163.02 7.2%Value (EUR) 110,977 103,094 7.6% 90,270 82,171 9.9% 52,795 50,635 4.3% 20,227 20,878 -3.1% 6,123 1,883 225.1%EUR/Barrel 128.71 109.55 17.5% 132.06 108.36 21.9% 130.83 106.40 23.0% 125.32 104.06 20.4% 124.69 104.68 19.1%
Kegs (000s)L12M YA % L9M YA % L6M YA % L3M YA % L1M YA %
Barrels 483 512 -5.7% 376 410 -8.3% 234 287 -18.5% 100 124 -18.7% 26 14 84.1%Value (USD) 76,284 82,551 -7.6% 59,486 66,618 -10.7% 36,930 46,544 -20.7% 15,810 20,157 -21.6% 4,120 2,302 79.0%USD/Barrel 158.01 161.32 -2.1% 158.01 162.33 -2.7% 157.93 162.30 -2.7% 157.32 163.16 -3.6% 157.89 162.40 -2.8%Value (EUR) 56,297 56,073 0.4% 44,962 44,490 1.1% 27,829 30,621 -9.1% 11,647 12,894 -9.7% 2,940 1,478 98.8%EUR/Barrel 116.61 109.58 6.4% 119.43 108.41 10.2% 119.02 106.77 11.5% 115.90 104.37 11.0% 112.65 104.28 8.0%
Glass Packaging (000s)L12M YA % L9M YA % L6M YA % L3M YA % L1M YA %
Barrels 218 240 -9.1% 175 197 -11.2% 101 116 -12.7% 37 45 -19.3% 12 3 341.7%Value (USD) 41,439 37,183 11.4% 33,349 30,753 8.4% 19,272 18,217 5.8% 6,895 7,146 -3.5% 2,377 464 412.4%USD/Barrel 190.15 155.07 22.6% 190.45 155.87 22.2% 190.04 156.76 21.2% 188.27 157.45 19.6% 190.48 164.18 16.0%Value (EUR) 30,761 25,283 21.7% 25,320 20,606 22.9% 14,576 11,964 21.8% 5,064 4,566 10.9% 1,696 298 469.4%EUR/Barrel 141.15 105.44 33.9% 144.60 104.44 38.4% 143.74 102.95 39.6% 138.29 100.61 37.5% 135.91 105.42 28.9%
Non-Glass Packaging (000s)L12M YA % L9M YA % L6M YA % L3M YA % L1M YA %
Barrels 161 190 -14.8% 132 151 -12.4% 68 73 -6.3% 24 32 -23.4% 11 1 962.5%Value (USD) 32,178 31,791 1.2% 26,352 25,386 3.8% 13,756 12,274 12.1% 4,805 5,344 -10.1% 2,085 167 >999%USD/Barrel 199.27 167.70 18.8% 199.65 168.53 18.5% 201.40 168.44 19.6% 197.81 168.55 17.4% 197.96 168.55 17.4%Value (EUR) 23,919 21,738 10.0% 19,987 17,075 17.1% 10,389 8,050 29.1% 3,515 3,418 2.8% 1,488 107 >999%EUR/Barrel 148.12 114.67 29.2% 151.43 113.36 33.6% 152.11 110.47 37.7% 144.73 107.81 34.2% 141.24 108.23 30.5%
June 2009 Page 39
bw166 Beer - Imports and Exports Report
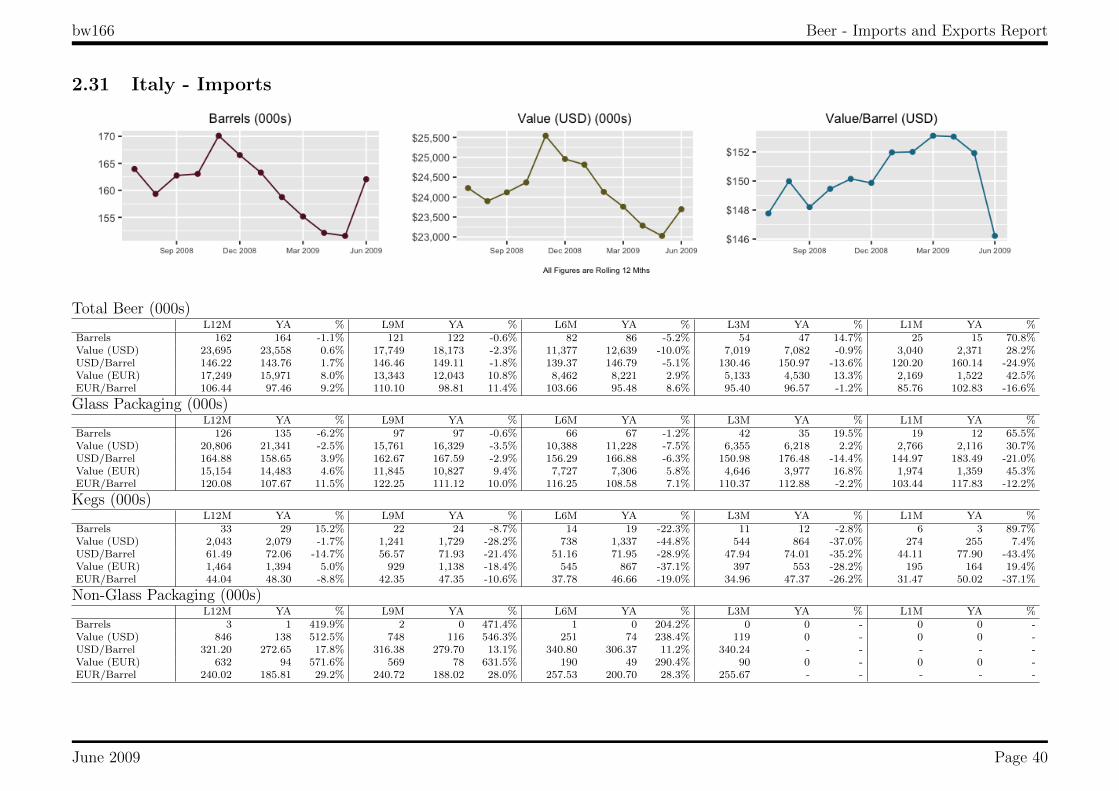
2.31 Italy - Imports
Total Beer (000s)L12M YA % L9M YA % L6M YA % L3M YA % L1M YA %
Barrels 162 164 -1.1% 121 122 -0.6% 82 86 -5.2% 54 47 14.7% 25 15 70.8%Value (USD) 23,695 23,558 0.6% 17,749 18,173 -2.3% 11,377 12,639 -10.0% 7,019 7,082 -0.9% 3,040 2,371 28.2%USD/Barrel 146.22 143.76 1.7% 146.46 149.11 -1.8% 139.37 146.79 -5.1% 130.46 150.97 -13.6% 120.20 160.14 -24.9%Value (EUR) 17,249 15,971 8.0% 13,343 12,043 10.8% 8,462 8,221 2.9% 5,133 4,530 13.3% 2,169 1,522 42.5%EUR/Barrel 106.44 97.46 9.2% 110.10 98.81 11.4% 103.66 95.48 8.6% 95.40 96.57 -1.2% 85.76 102.83 -16.6%
Glass Packaging (000s)L12M YA % L9M YA % L6M YA % L3M YA % L1M YA %
Barrels 126 135 -6.2% 97 97 -0.6% 66 67 -1.2% 42 35 19.5% 19 12 65.5%Value (USD) 20,806 21,341 -2.5% 15,761 16,329 -3.5% 10,388 11,228 -7.5% 6,355 6,218 2.2% 2,766 2,116 30.7%USD/Barrel 164.88 158.65 3.9% 162.67 167.59 -2.9% 156.29 166.88 -6.3% 150.98 176.48 -14.4% 144.97 183.49 -21.0%Value (EUR) 15,154 14,483 4.6% 11,845 10,827 9.4% 7,727 7,306 5.8% 4,646 3,977 16.8% 1,974 1,359 45.3%EUR/Barrel 120.08 107.67 11.5% 122.25 111.12 10.0% 116.25 108.58 7.1% 110.37 112.88 -2.2% 103.44 117.83 -12.2%
Kegs (000s)L12M YA % L9M YA % L6M YA % L3M YA % L1M YA %
Barrels 33 29 15.2% 22 24 -8.7% 14 19 -22.3% 11 12 -2.8% 6 3 89.7%Value (USD) 2,043 2,079 -1.7% 1,241 1,729 -28.2% 738 1,337 -44.8% 544 864 -37.0% 274 255 7.4%USD/Barrel 61.49 72.06 -14.7% 56.57 71.93 -21.4% 51.16 71.95 -28.9% 47.94 74.01 -35.2% 44.11 77.90 -43.4%Value (EUR) 1,464 1,394 5.0% 929 1,138 -18.4% 545 867 -37.1% 397 553 -28.2% 195 164 19.4%EUR/Barrel 44.04 48.30 -8.8% 42.35 47.35 -10.6% 37.78 46.66 -19.0% 34.96 47.37 -26.2% 31.47 50.02 -37.1%
Non-Glass Packaging (000s)L12M YA % L9M YA % L6M YA % L3M YA % L1M YA %
Barrels 3 1 419.9% 2 0 471.4% 1 0 204.2% 0 0 - 0 0 -Value (USD) 846 138 512.5% 748 116 546.3% 251 74 238.4% 119 0 - 0 0 -USD/Barrel 321.20 272.65 17.8% 316.38 279.70 13.1% 340.80 306.37 11.2% 340.24 - - - - -Value (EUR) 632 94 571.6% 569 78 631.5% 190 49 290.4% 90 0 - 0 0 -EUR/Barrel 240.02 185.81 29.2% 240.72 188.02 28.0% 257.53 200.70 28.3% 255.67 - - - - -
June 2009 Page 40

bw166 Beer - Imports and Exports Report
2.32 Jamaica - Imports
Total Beer (000s)L12M YA % L9M YA % L6M YA % L3M YA % L1M YA %
Barrels 240 222 8.2% 182 163 11.8% 112 119 -5.3% 53 79 -32.4% 12 27 -55.5%Value (USD) 39,392 33,308 18.3% 30,022 24,723 21.4% 18,475 17,934 3.0% 8,739 11,872 -26.4% 2,015 4,128 -51.2%USD/Barrel 164.20 150.18 9.3% 164.51 151.48 8.6% 164.61 151.27 8.8% 164.62 151.16 8.9% 166.22 151.39 9.8%Value (JMD) 3,034,305 2,301,436 31.8% 2,380,062 1,718,268 38.5% 1,551,103 1,246,958 24.4% 752,562 823,435 -8.6% 173,384 285,900 -39.4%JMD/Barrel 12,647.77 10,377.01 21.9% 13,041.97 10,527.98 23.9% 13,820.32 10,518.17 31.4% 14,176.72 10,484.24 35.2% 14,303.32 10,484.24 36.4%
Glass Packaging (000s)L12M YA % L9M YA % L6M YA % L3M YA % L1M YA %
Barrels 240 222 8.2% 182 163 11.8% 112 119 -5.3% 53 79 -32.4% 12 27 -55.5%Value (USD) 39,392 33,308 18.3% 30,022 24,723 21.4% 18,475 17,934 3.0% 8,739 11,872 -26.4% 2,015 4,128 -51.2%USD/Barrel 164.20 150.18 9.3% 164.51 151.48 8.6% 164.61 151.27 8.8% 164.62 151.16 8.9% 166.22 151.39 9.8%Value (JMD) 3,034,305 2,301,436 31.8% 2,380,062 1,718,268 38.5% 1,551,103 1,246,958 24.4% 752,562 823,435 -8.6% 173,384 285,900 -39.4%JMD/Barrel 12,647.77 10,377.01 21.9% 13,041.97 10,527.98 23.9% 13,820.32 10,518.17 31.4% 14,176.72 10,484.24 35.2% 14,303.32 10,484.24 36.4%
June 2009 Page 41

bw166 Beer - Imports and Exports Report
2.33 Japan - Imports
Total Beer (000s)L12M YA % L9M YA % L6M YA % L3M YA % L1M YA %
Barrels 16 12 28.3% 11 9 20.7% 6 6 -0.8% 4 2 42.3% 1 1 159.8%Value (USD) 3,922 2,762 42.0% 2,980 2,233 33.5% 1,777 1,682 5.7% 910 625 45.6% 326 152 114.6%USD/Barrel 250.46 226.27 10.7% 270.03 244.13 10.6% 278.00 260.92 6.5% 258.62 252.71 2.3% 247.96 300.20 -17.4%Value (JPY) 387,170 300,354 28.9% 285,684 238,228 19.9% 170,079 175,799 -3.3% 88,691 64,976 36.5% 31,477 16,189 94.4%JPY/Barrel 24,727.27 24,606.57 0.5% 25,885.66 26,046.36 -0.6% 26,603.98 27,269.84 -2.4% 25,195.70 26,265.32 -4.1% 23,976.76 32,041.21 -25.2%
Glass Packaging (000s)L12M YA % L9M YA % L6M YA % L3M YA % L1M YA %
Barrels 10 7 53.6% 8 5 59.0% 5 4 41.8% 3 1 108.6% 1 0 182.2%Value (USD) 3,216 2,080 54.6% 2,610 1,734 50.5% 1,623 1,316 23.3% 814 474 71.7% 312 131 138.6%USD/Barrel 313.11 311.17 0.6% 309.71 327.18 -5.3% 302.43 347.59 -13.0% 275.15 334.26 -17.7% 267.83 316.77 -15.5%Value (JPY) 314,599 225,407 39.6% 249,550 184,742 35.1% 155,336 137,524 13.0% 79,337 49,443 60.5% 30,137 13,943 116.1%JPY/Barrel 30,631.56 33,719.28 -9.2% 29,609.52 34,853.72 -15.0% 28,942.04 36,324.31 -20.3% 26,802.64 34,837.84 -23.1% 25,897.77 33,809.89 -23.4%
Non-Glass Packaging (000s)L12M YA % L9M YA % L6M YA % L3M YA % L1M YA %
Barrels 5 5 -2.3% 3 4 -32.5% 1 3 -62.4% 1 1 -47.1% 0 0 60.6%Value (USD) 686 659 4.1% 350 476 -26.4% 134 343 -60.9% 87 128 -32.4% 14 21 -34.1%USD/Barrel 128.49 120.52 6.6% 136.73 125.49 9.0% 137.23 131.68 4.2% 163.51 127.86 27.9% 92.94 226.61 -59.0%Value (JPY) 70,731 72,612 -2.6% 34,293 51,151 -33.0% 12,902 35,940 -64.1% 8,449 13,198 -36.0% 1,340 2,246 -40.3%JPY/Barrel 13,244.61 13,280.00 -0.3% 13,388.04 13,488.64 -0.7% 13,178.89 13,786.10 -4.4% 15,961.85 13,185.81 21.1% 8,986.87 24,186.27 -62.8%
Kegs (000s)L12M YA % L9M YA % L6M YA % L3M YA % L1M YA %
Barrels 0 0 -12.7% 0 0 -12.7% 0 0 -12.7% 0 0 -42.8% 0 0 -Value (USD) 20 23 -13.5% 20 23 -13.5% 20 23 -13.5% 9 23 -59.0% 0 0 -USD/Barrel 420.63 424.82 -1.0% 420.63 424.82 -1.0% 420.63 424.82 -1.0% 304.84 424.82 -28.2% - - -Value (JPY) 1,841 2,335 -21.2% 1,841 2,335 -21.2% 1,841 2,335 -21.2% 904 2,335 -61.3% 0 0 -JPY/Barrel 39,270.24 43,510.98 -9.7% 39,270.24 43,510.98 -9.7% 39,270.24 43,510.98 -9.7% 29,475.11 43,510.98 -32.3% - - -
June 2009 Page 42

bw166 Beer - Imports and Exports Report
2.34 Kenya - Imports
Total Beer (000s)L12M YA % L9M YA % L6M YA % L3M YA % L1M YA %
Barrels 1 1 30.8% 1 0 34.6% 0 0 -40.0% 0 0 -100.0% 0 0 -Value (USD) 103 84 22.2% 56 47 20.0% 28 37 -25.0% 0 28 -100.0% 0 0 -USD/Barrel 98.47 105.37 -6.5% 86.96 97.56 -10.9% 117.07 93.66 25.0% - 117.07 - - - -
Glass Packaging (000s)L12M YA % L9M YA % L6M YA % L3M YA % L1M YA %
Barrels 1 1 30.8% 1 0 34.6% 0 0 -40.0% 0 0 -100.0% 0 0 -Value (USD) 103 84 22.2% 56 47 20.0% 28 37 -25.0% 0 28 -100.0% 0 0 -USD/Barrel 98.47 105.37 -6.5% 86.96 97.56 -10.9% 117.07 93.66 25.0% - 117.07 - - - -
June 2009 Page 43

bw166 Beer - Imports and Exports Report
2.35 Korea, South - Imports
Total Beer (000s)L12M YA % L9M YA % L6M YA % L3M YA % L1M YA %
Barrels 23 23 -0.9% 17 17 3.4% 11 11 1.9% 7 6 25.7% 3 2 57.8%Value (USD) 2,008 1,904 5.5% 1,489 1,357 9.7% 1,018 928 9.7% 623 476 30.9% 265 157 68.4%USD/Barrel 86.45 81.23 6.4% 87.19 82.22 6.0% 88.88 82.63 7.6% 88.55 85.05 4.1% 89.21 83.58 6.7%
Glass Packaging (000s)L12M YA % L9M YA % L6M YA % L3M YA % L1M YA %
Barrels 20 21 -4.2% 14 15 -3.3% 10 10 -2.9% 6 5 24.0% 3 2 67.9%Value (USD) 1,761 1,714 2.8% 1,290 1,243 3.8% 899 858 4.8% 557 431 29.1% 243 143 69.8%USD/Barrel 88.74 82.77 7.2% 89.51 83.38 7.4% 90.52 83.90 7.9% 91.15 87.53 4.1% 89.83 88.86 1.1%
Non-Glass Packaging (000s)L12M YA % L9M YA % L6M YA % L3M YA % L1M YA %
Barrels 3 2 24.9% 2 1 77.2% 1 1 82.4% 1 0 57.1% 0 0 225.0%Value (USD) 214 162 32.5% 174 97 80.6% 106 57 86.6% 54 35 56.0% 22 7 229.0%USD/Barrel 83.54 78.71 6.1% 84.68 83.12 1.9% 85.48 83.52 2.3% 82.56 83.15 -0.7% 82.95 81.95 1.2%
Kegs (000s)L12M YA % L9M YA % L6M YA % L3M YA % L1M YA %
Barrels 1 1 20.7% 1 0 38.8% 0 0 -15.4% 0 0 7.3% 0 0 -100.0%Value (USD) 33 28 15.5% 25 18 39.4% 12 13 -6.2% 12 10 19.9% 0 8 -100.0%USD/Barrel 40.03 41.81 -4.2% 40.71 40.54 0.4% 44.40 40.04 10.9% 44.40 39.74 11.7% - 39.60 -
June 2009 Page 44

bw166 Beer - Imports and Exports Report
2.36 Laos - Imports
Total Beer (000s)L12M YA % L9M YA % L6M YA % L3M YA % L1M YA %
Barrels 1 0 245.5% 1 0 223.2% 0 0 213.1% 0 0 -100.0% 0 0 -100.0%Value (USD) 65 19 245.5% 61 19 223.2% 40 13 213.1% 0 6 -100.0% 0 6 -100.0%USD/Barrel 88.90 88.90 0.0% 88.90 88.90 0.0% 88.90 88.90 0.0% - 88.90 - - 88.90 -
Glass Packaging (000s)L12M YA % L9M YA % L6M YA % L3M YA % L1M YA %
Barrels 1 0 220.1% 1 0 197.8% 0 0 213.1% 0 0 -100.0% 0 0 -100.0%Value (USD) 60 19 220.1% 56 19 197.8% 40 13 213.1% 0 6 -100.0% 0 6 -100.0%USD/Barrel 88.90 88.90 0.0% 88.90 88.90 0.0% 88.90 88.90 0.0% - 88.90 - - 88.90 -
Non-Glass Packaging (000s)L12M YA % L9M YA % L6M YA % L3M YA % L1M YA %
Barrels 0 0 - 0 0 - 0 0 - 0 0 - 0 0 -Value (USD) 5 0 - 5 0 - 0 0 - 0 0 - 0 0 -USD/Barrel 88.90 - - 88.90 - - - - - - - - - - -
June 2009 Page 45

bw166 Beer - Imports and Exports Report
2.37 Lebanon - Imports
Total Beer (000s)L12M YA % L9M YA % L6M YA % L3M YA % L1M YA %
Barrels 1 2 -34.5% 1 1 -37.1% 0 1 -56.4% 0 1 -29.0% 0 0 -100.0%Value (USD) 240 291 -17.3% 195 225 -13.2% 106 178 -40.6% 75 106 -28.8% 0 30 -100.0%USD/Barrel 209.34 165.80 26.3% 224.34 162.52 38.0% 218.78 160.74 36.1% 163.67 163.19 0.3% - 161.73 -
Glass Packaging (000s)L12M YA % L9M YA % L6M YA % L3M YA % L1M YA %
Barrels 1 2 -34.5% 1 1 -37.1% 0 1 -56.4% 0 1 -29.0% 0 0 -100.0%Value (USD) 240 291 -17.3% 195 225 -13.2% 106 178 -40.6% 75 106 -28.8% 0 30 -100.0%USD/Barrel 209.34 165.80 26.3% 224.34 162.52 38.0% 218.78 160.74 36.1% 163.67 163.19 0.3% - 161.73 -
June 2009 Page 46
bw166 Beer - Imports and Exports Report
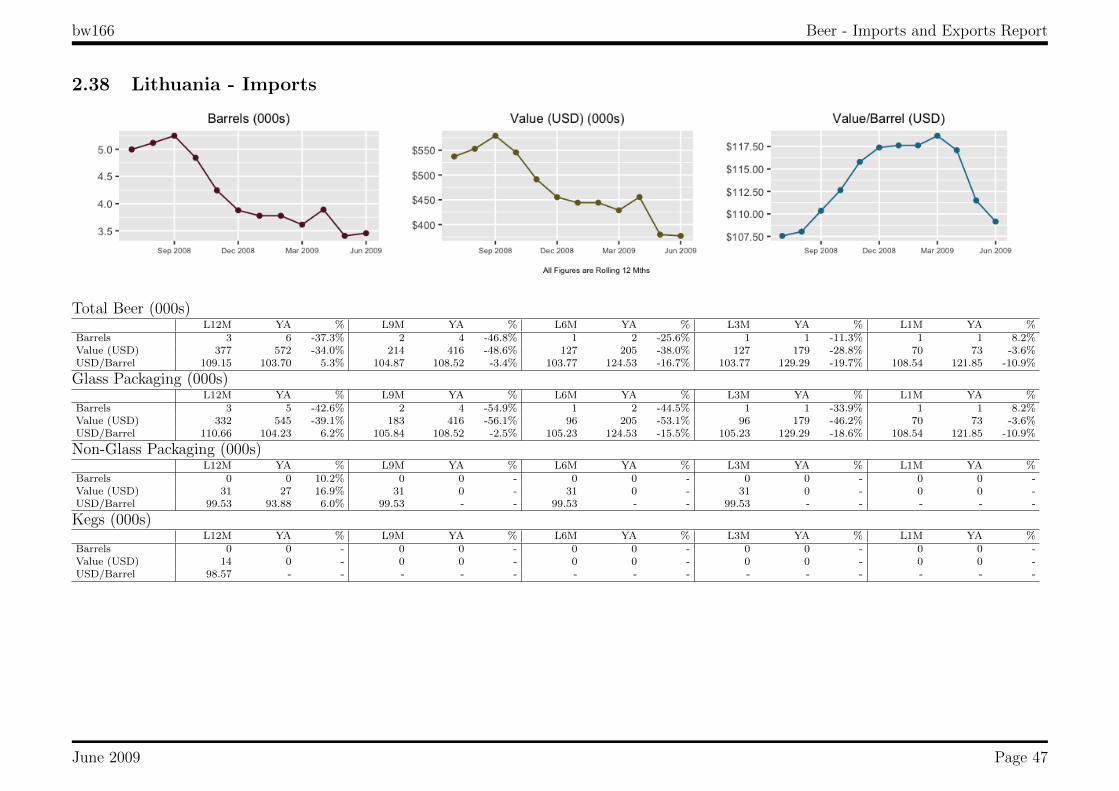
2.38 Lithuania - Imports
Total Beer (000s)L12M YA % L9M YA % L6M YA % L3M YA % L1M YA %
Barrels 3 6 -37.3% 2 4 -46.8% 1 2 -25.6% 1 1 -11.3% 1 1 8.2%Value (USD) 377 572 -34.0% 214 416 -48.6% 127 205 -38.0% 127 179 -28.8% 70 73 -3.6%USD/Barrel 109.15 103.70 5.3% 104.87 108.52 -3.4% 103.77 124.53 -16.7% 103.77 129.29 -19.7% 108.54 121.85 -10.9%
Glass Packaging (000s)L12M YA % L9M YA % L6M YA % L3M YA % L1M YA %
Barrels 3 5 -42.6% 2 4 -54.9% 1 2 -44.5% 1 1 -33.9% 1 1 8.2%Value (USD) 332 545 -39.1% 183 416 -56.1% 96 205 -53.1% 96 179 -46.2% 70 73 -3.6%USD/Barrel 110.66 104.23 6.2% 105.84 108.52 -2.5% 105.23 124.53 -15.5% 105.23 129.29 -18.6% 108.54 121.85 -10.9%
Non-Glass Packaging (000s)L12M YA % L9M YA % L6M YA % L3M YA % L1M YA %
Barrels 0 0 10.2% 0 0 - 0 0 - 0 0 - 0 0 -Value (USD) 31 27 16.9% 31 0 - 31 0 - 31 0 - 0 0 -USD/Barrel 99.53 93.88 6.0% 99.53 - - 99.53 - - 99.53 - - - - -
Kegs (000s)L12M YA % L9M YA % L6M YA % L3M YA % L1M YA %
Barrels 0 0 - 0 0 - 0 0 - 0 0 - 0 0 -Value (USD) 14 0 - 0 0 - 0 0 - 0 0 - 0 0 -USD/Barrel 98.57 - - - - - - - - - - - - - -
June 2009 Page 47

bw166 Beer - Imports and Exports Report
2.39 Malta - Imports
Total Beer (000s)L12M YA % L9M YA % L6M YA % L3M YA % L1M YA %
Barrels 0 0 -26.3% 0 0 -100.0% 0 0 -100.0% 0 0 -100.0% 0 0 -100.0%Value (USD) 49 57 -13.7% 0 57 -100.0% 0 38 -100.0% 0 38 -100.0% 0 19 -100.0%USD/Barrel 181.27 154.81 17.1% - 154.81 - - 160.35 - - 160.35 - - 159.05 -Value (EUR) 34 38 -9.1% 0 38 -100.0% 0 25 -100.0% 0 25 -100.0% 0 12 -100.0%EUR/Barrel 125.93 102.08 23.4% - 102.08 - - 102.35 - - 102.35 - - 102.13 -
Glass Packaging (000s)L12M YA % L9M YA % L6M YA % L3M YA % L1M YA %
Barrels 0 0 -35.4% 0 0 -100.0% 0 0 -100.0% 0 0 -100.0% 0 0 -100.0%Value (USD) 35 50 -28.7% 0 50 -100.0% 0 36 -100.0% 0 36 -100.0% 0 17 -100.0%USD/Barrel 176.36 159.83 10.3% - 159.83 - - 162.11 - - 162.11 - - 162.57 -Value (EUR) 25 33 -24.6% 0 33 -100.0% 0 23 -100.0% 0 23 -100.0% 0 11 -100.0%EUR/Barrel 122.51 104.89 16.8% - 104.89 - - 103.42 - - 103.42 - - 104.39 -
Non-Glass Packaging (000s)L12M YA % L9M YA % L6M YA % L3M YA % L1M YA %
Barrels 0 0 22.2% 0 0 -100.0% 0 0 -100.0% 0 0 -100.0% 0 0 -100.0%Value (USD) 14 7 86.3% 0 7 -100.0% 0 3 -100.0% 0 3 -100.0% 0 3 -100.0%USD/Barrel 195.13 128.01 52.4% - 128.01 - - 140.45 - - 140.45 - - 140.45 -Value (EUR) 10 5 90.2% 0 5 -100.0% 0 2 -100.0% 0 2 -100.0% 0 2 -100.0%EUR/Barrel 135.55 87.13 55.6% - 87.13 - - 90.19 - - 90.19 - - 90.19 -
June 2009 Page 48
bw166 Beer - Imports and Exports Report
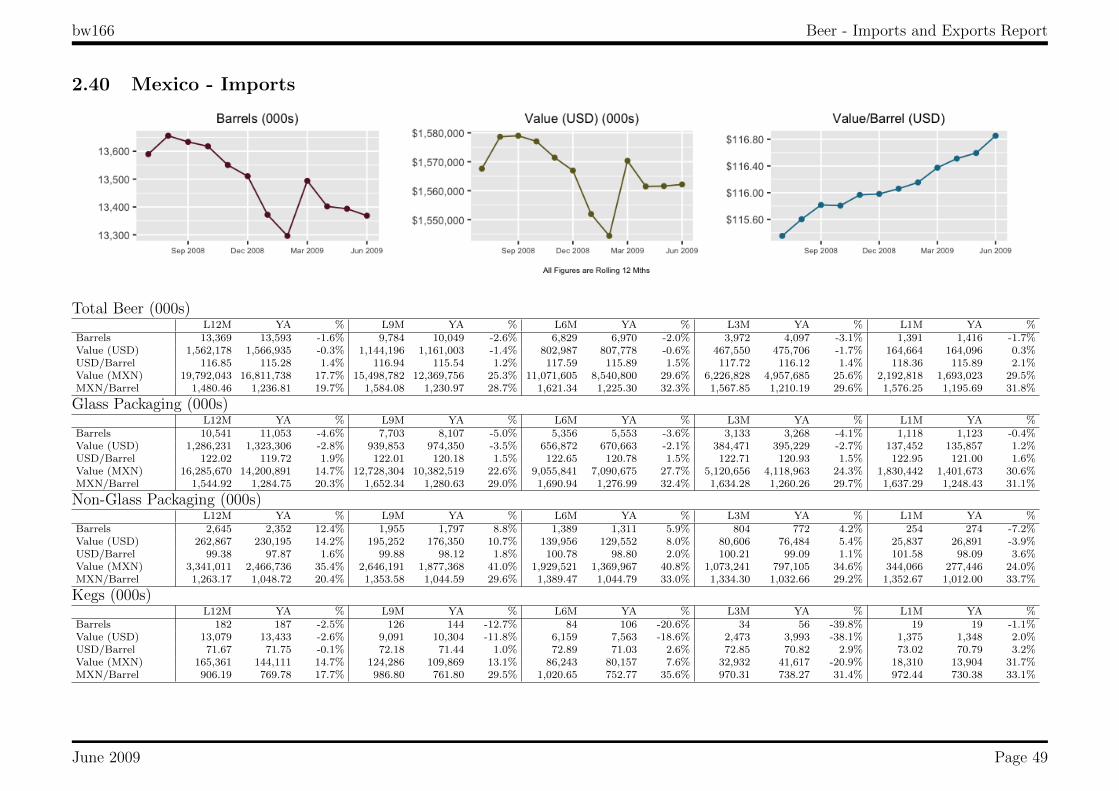
2.40 Mexico - Imports
Total Beer (000s)L12M YA % L9M YA % L6M YA % L3M YA % L1M YA %
Barrels 13,369 13,593 -1.6% 9,784 10,049 -2.6% 6,829 6,970 -2.0% 3,972 4,097 -3.1% 1,391 1,416 -1.7%Value (USD) 1,562,178 1,566,935 -0.3% 1,144,196 1,161,003 -1.4% 802,987 807,778 -0.6% 467,550 475,706 -1.7% 164,664 164,096 0.3%USD/Barrel 116.85 115.28 1.4% 116.94 115.54 1.2% 117.59 115.89 1.5% 117.72 116.12 1.4% 118.36 115.89 2.1%Value (MXN) 19,792,043 16,811,738 17.7% 15,498,782 12,369,756 25.3% 11,071,605 8,540,800 29.6% 6,226,828 4,957,685 25.6% 2,192,818 1,693,023 29.5%MXN/Barrel 1,480.46 1,236.81 19.7% 1,584.08 1,230.97 28.7% 1,621.34 1,225.30 32.3% 1,567.85 1,210.19 29.6% 1,576.25 1,195.69 31.8%
Glass Packaging (000s)L12M YA % L9M YA % L6M YA % L3M YA % L1M YA %
Barrels 10,541 11,053 -4.6% 7,703 8,107 -5.0% 5,356 5,553 -3.6% 3,133 3,268 -4.1% 1,118 1,123 -0.4%Value (USD) 1,286,231 1,323,306 -2.8% 939,853 974,350 -3.5% 656,872 670,663 -2.1% 384,471 395,229 -2.7% 137,452 135,857 1.2%USD/Barrel 122.02 119.72 1.9% 122.01 120.18 1.5% 122.65 120.78 1.5% 122.71 120.93 1.5% 122.95 121.00 1.6%Value (MXN) 16,285,670 14,200,891 14.7% 12,728,304 10,382,519 22.6% 9,055,841 7,090,675 27.7% 5,120,656 4,118,963 24.3% 1,830,442 1,401,673 30.6%MXN/Barrel 1,544.92 1,284.75 20.3% 1,652.34 1,280.63 29.0% 1,690.94 1,276.99 32.4% 1,634.28 1,260.26 29.7% 1,637.29 1,248.43 31.1%
Non-Glass Packaging (000s)L12M YA % L9M YA % L6M YA % L3M YA % L1M YA %
Barrels 2,645 2,352 12.4% 1,955 1,797 8.8% 1,389 1,311 5.9% 804 772 4.2% 254 274 -7.2%Value (USD) 262,867 230,195 14.2% 195,252 176,350 10.7% 139,956 129,552 8.0% 80,606 76,484 5.4% 25,837 26,891 -3.9%USD/Barrel 99.38 97.87 1.6% 99.88 98.12 1.8% 100.78 98.80 2.0% 100.21 99.09 1.1% 101.58 98.09 3.6%Value (MXN) 3,341,011 2,466,736 35.4% 2,646,191 1,877,368 41.0% 1,929,521 1,369,967 40.8% 1,073,241 797,105 34.6% 344,066 277,446 24.0%MXN/Barrel 1,263.17 1,048.72 20.4% 1,353.58 1,044.59 29.6% 1,389.47 1,044.79 33.0% 1,334.30 1,032.66 29.2% 1,352.67 1,012.00 33.7%
Kegs (000s)L12M YA % L9M YA % L6M YA % L3M YA % L1M YA %
Barrels 182 187 -2.5% 126 144 -12.7% 84 106 -20.6% 34 56 -39.8% 19 19 -1.1%Value (USD) 13,079 13,433 -2.6% 9,091 10,304 -11.8% 6,159 7,563 -18.6% 2,473 3,993 -38.1% 1,375 1,348 2.0%USD/Barrel 71.67 71.75 -0.1% 72.18 71.44 1.0% 72.89 71.03 2.6% 72.85 70.82 2.9% 73.02 70.79 3.2%Value (MXN) 165,361 144,111 14.7% 124,286 109,869 13.1% 86,243 80,157 7.6% 32,932 41,617 -20.9% 18,310 13,904 31.7%MXN/Barrel 906.19 769.78 17.7% 986.80 761.80 29.5% 1,020.65 752.77 35.6% 970.31 738.27 31.4% 972.44 730.38 33.1%
June 2009 Page 49

bw166 Beer - Imports and Exports Report
2.41 Morocco - Imports
Total Beer (000s)L12M YA % L9M YA % L6M YA % L3M YA % L1M YA %
Barrels 1 0 151.6% 0 0 30.4% 0 0 - 0 0 - 0 0 -Value (USD) 104 41 152.4% 54 41 30.9% 42 0 - 27 0 - 15 0 -USD/Barrel 139.83 139.37 0.3% 139.99 139.37 0.4% 139.23 - - 137.10 - - 133.10 - -
Glass Packaging (000s)L12M YA % L9M YA % L6M YA % L3M YA % L1M YA %
Barrels 1 0 151.6% 0 0 30.4% 0 0 - 0 0 - 0 0 -Value (USD) 104 41 152.4% 54 41 30.9% 42 0 - 27 0 - 15 0 -USD/Barrel 139.83 139.37 0.3% 139.99 139.37 0.4% 139.23 - - 137.10 - - 133.10 - -
June 2009 Page 50

bw166 Beer - Imports and Exports Report
2.42 Netherlands - Imports
Total Beer (000s)L12M YA % L9M YA % L6M YA % L3M YA % L1M YA %
Barrels 6,033 6,733 -10.4% 4,372 4,949 -11.7% 2,975 3,482 -14.6% 1,697 1,852 -8.3% 634 603 5.1%Value (USD) 999,674 1,066,398 -6.3% 729,646 788,577 -7.5% 502,971 558,361 -9.9% 288,268 298,714 -3.5% 107,170 97,202 10.3%USD/Barrel 165.69 158.39 4.6% 166.91 159.34 4.7% 169.08 160.38 5.4% 169.84 161.31 5.3% 169.05 161.20 4.9%Value (EUR) 727,914 725,411 0.3% 548,810 523,103 4.9% 376,367 364,241 3.3% 211,711 191,075 10.8% 76,466 62,416 22.5%EUR/Barrel 120.65 107.74 12.0% 125.54 105.70 18.8% 126.52 104.62 20.9% 124.74 103.19 20.9% 120.62 103.51 16.5%
Glass Packaging (000s)L12M YA % L9M YA % L6M YA % L3M YA % L1M YA %
Barrels 5,103 5,591 -8.7% 3,697 4,114 -10.1% 2,497 2,892 -13.6% 1,410 1,542 -8.5% 525 502 4.6%Value (USD) 850,068 888,656 -4.3% 619,899 658,300 -5.8% 423,831 465,872 -9.0% 240,449 250,222 -3.9% 89,183 81,315 9.7%USD/Barrel 166.57 158.96 4.8% 167.66 160.01 4.8% 169.71 161.08 5.4% 170.49 162.25 5.1% 170.02 162.13 4.9%Value (EUR) 619,188 604,331 2.5% 466,376 436,595 6.8% 317,255 303,848 4.4% 176,605 160,075 10.3% 63,632 52,215 21.9%EUR/Barrel 121.33 108.10 12.2% 126.14 106.12 18.9% 127.03 105.06 20.9% 125.22 103.80 20.6% 121.31 104.11 16.5%
Non-Glass Packaging (000s)L12M YA % L9M YA % L6M YA % L3M YA % L1M YA %
Barrels 768 861 -10.8% 566 628 -9.9% 405 418 -3.1% 246 236 4.5% 96 76 26.6%Value (USD) 120,635 129,697 -7.0% 90,247 94,833 -4.8% 65,976 62,832 5.0% 40,393 35,682 13.2% 15,559 11,423 36.2%USD/Barrel 157.12 150.66 4.3% 159.35 150.92 5.6% 162.83 150.30 8.3% 163.93 151.39 8.3% 162.11 150.69 7.6%Value (EUR) 87,845 88,437 -0.7% 67,757 63,050 7.5% 49,246 40,945 20.3% 29,636 22,808 29.9% 11,101 7,335 51.3%EUR/Barrel 114.42 102.73 11.4% 119.64 100.34 19.2% 121.54 97.95 24.1% 120.27 96.77 24.3% 115.66 96.76 19.5%
Kegs (000s)L12M YA % L9M YA % L6M YA % L3M YA % L1M YA %
Barrels 162 281 -42.3% 108 206 -47.7% 72 171 -57.9% 41 74 -45.2% 13 26 -47.7%Value (USD) 28,972 48,045 -39.7% 19,500 35,444 -45.0% 13,164 29,657 -55.6% 7,426 12,809 -42.0% 2,429 4,464 -45.6%USD/Barrel 178.44 170.78 4.5% 180.83 171.82 5.2% 182.77 173.15 5.6% 183.32 173.39 5.7% 180.99 174.11 4.0%Value (EUR) 20,881 32,643 -36.0% 14,677 23,458 -37.4% 9,866 19,448 -49.3% 5,470 8,192 -33.2% 1,733 2,866 -39.5%EUR/Barrel 128.61 116.04 10.8% 136.11 113.72 19.7% 136.98 113.55 20.6% 135.03 110.89 21.8% 129.14 111.80 15.5%
June 2009 Page 51

bw166 Beer - Imports and Exports Report
2.43 New Zealand - Imports
Total Beer (000s)L12M YA % L9M YA % L6M YA % L3M YA % L1M YA %
Barrels 27 43 -38.3% 21 29 -29.6% 11 20 -46.8% 7 10 -25.7% 4 3 61.6%Value (USD) 4,295 6,237 -31.1% 3,334 4,459 -25.2% 1,711 3,207 -46.6% 1,143 1,573 -27.3% 676 402 68.2%USD/Barrel 161.39 144.61 11.6% 160.75 151.40 6.2% 157.29 156.66 0.4% 159.66 163.25 -2.2% 164.35 157.82 4.1%Value (NZD) 7,041 8,118 -13.3% 5,716 5,730 -0.2% 2,929 4,090 -28.4% 1,853 2,025 -8.5% 1,059 527 101.1%NZD/Barrel 264.59 188.21 40.6% 275.66 194.55 41.7% 269.18 199.83 34.7% 258.79 210.13 23.2% 257.52 206.91 24.5%
Glass Packaging (000s)L12M YA % L9M YA % L6M YA % L3M YA % L1M YA %
Barrels 23 40 -41.9% 18 28 -35.5% 10 19 -48.6% 7 9 -27.9% 4 2 53.4%Value (USD) 3,847 5,977 -35.6% 2,929 4,290 -31.7% 1,584 3,061 -48.3% 1,078 1,516 -28.9% 637 399 59.8%USD/Barrel 164.93 148.92 10.8% 164.49 155.32 5.9% 162.48 161.31 0.7% 163.96 166.24 -1.4% 166.63 159.95 4.2%Value (NZD) 6,271 7,778 -19.4% 5,007 5,513 -9.2% 2,705 3,905 -30.7% 1,747 1,951 -10.4% 998 522 91.0%NZD/Barrel 268.86 193.78 38.7% 281.19 199.62 40.9% 277.54 205.77 34.9% 265.88 214.02 24.2% 261.10 209.69 24.5%
Non-Glass Packaging (000s)L12M YA % L9M YA % L6M YA % L3M YA % L1M YA %
Barrels 2 1 211.0% 2 0 278.7% 0 0 -25.4% 0 0 -15.8% 0 0 -Value (USD) 341 97 253.2% 309 74 320.3% 61 74 -17.3% 36 38 -5.6% 30 0 -USD/Barrel 171.73 151.20 13.6% 173.50 156.32 11.0% 173.20 156.32 10.8% 175.30 156.31 12.1% 179.68 - -Value (NZD) 586 125 367.1% 541 94 477.1% 105 94 12.0% 58 49 16.8% 47 0 -NZD/Barrel 294.59 196.10 50.2% 303.36 199.07 52.4% 298.99 199.07 50.2% 277.69 200.17 38.7% 281.54 - -
Kegs (000s)L12M YA % L9M YA % L6M YA % L3M YA % L1M YA %
Barrels 1 2 -44.9% 1 1 -15.5% 1 1 -23.4% 0 0 40.0% 0 0 125.0%Value (USD) 106 163 -34.9% 95 96 -0.4% 67 71 -6.9% 29 19 55.3% 9 3 167.1%USD/Barrel 81.85 69.32 18.1% 82.88 70.29 17.9% 85.22 70.14 21.5% 77.09 69.49 10.9% 72.10 60.75 18.7%Value (NZD) 184 215 -14.0% 169 123 37.7% 118 91 29.7% 48 24 98.5% 14 4 219.2%NZD/Barrel 141.95 91.07 55.9% 146.97 90.16 63.0% 151.49 89.50 69.3% 126.34 89.12 41.8% 112.98 79.64 41.9%
June 2009 Page 52

bw166 Beer - Imports and Exports Report
2.44 Nicaragua - Imports
Total Beer (000s)L12M YA % L9M YA % L6M YA % L3M YA % L1M YA %
Barrels 1 2 -22.6% 1 1 6.3% 1 1 10.1% 0 0 0.0% 0 0 0.0%Value (USD) 184 222 -17.3% 133 118 13.1% 96 83 15.4% 38 38 -0.3% 13 12 5.1%USD/Barrel 129.71 121.52 6.7% 129.78 121.93 6.4% 129.49 123.51 4.8% 127.45 127.78 -0.3% 130.85 124.46 5.1%
Glass Packaging (000s)L12M YA % L9M YA % L6M YA % L3M YA % L1M YA %
Barrels 1 2 -22.6% 1 1 6.3% 1 1 10.1% 0 0 0.0% 0 0 0.0%Value (USD) 184 222 -17.3% 133 118 13.1% 96 83 15.4% 38 38 -0.3% 13 12 5.1%USD/Barrel 129.71 121.52 6.7% 129.78 121.93 6.4% 129.49 123.51 4.8% 127.45 127.78 -0.3% 130.85 124.46 5.1%
June 2009 Page 53

bw166 Beer - Imports and Exports Report
2.45 Peru - Imports
Total Beer (000s)L12M YA % L9M YA % L6M YA % L3M YA % L1M YA %
Barrels 10 11 -2.5% 7 7 12.0% 5 4 27.6% 3 3 16.3% 2 1 34.6%Value (USD) 1,153 1,260 -8.5% 815 796 2.5% 509 480 6.0% 328 333 -1.5% 166 136 21.6%USD/Barrel 111.38 118.68 -6.2% 111.66 122.00 -8.5% 104.36 125.65 -16.9% 106.74 126.08 -15.3% 102.36 113.32 -9.7%
Glass Packaging (000s)L12M YA % L9M YA % L6M YA % L3M YA % L1M YA %
Barrels 10 11 -2.5% 7 7 12.0% 5 4 27.6% 3 3 16.3% 2 1 34.6%Value (USD) 1,153 1,260 -8.5% 815 796 2.5% 509 480 6.0% 328 333 -1.5% 166 136 21.6%USD/Barrel 111.38 118.68 -6.2% 111.66 122.00 -8.5% 104.36 125.65 -16.9% 106.74 126.08 -15.3% 102.36 113.32 -9.7%
June 2009 Page 54

bw166 Beer - Imports and Exports Report
2.46 Philippines - Imports
Total Beer (000s)L12M YA % L9M YA % L6M YA % L3M YA % L1M YA %
Barrels 10 12 -16.3% 7 8 -16.0% 4 5 -19.9% 2 3 -19.2% 1 1 156.1%Value (USD) 1,741 1,911 -8.9% 1,180 1,285 -8.2% 642 712 -9.8% 371 432 -14.1% 214 77 176.2%USD/Barrel 172.45 158.39 8.9% 169.12 154.75 9.3% 166.74 148.04 12.6% 164.72 154.98 6.3% 163.03 151.19 7.8%
Glass Packaging (000s)L12M YA % L9M YA % L6M YA % L3M YA % L1M YA %
Barrels 10 12 -13.9% 7 8 -15.2% 4 5 -18.5% 2 3 -17.9% 1 1 156.1%Value (USD) 1,731 1,811 -4.4% 1,180 1,261 -6.4% 642 688 -6.6% 371 418 -11.4% 214 77 176.2%USD/Barrel 171.47 154.34 11.1% 169.12 153.32 10.3% 166.74 145.45 14.6% 164.72 152.61 7.9% 163.03 151.19 7.8%
Non-Glass Packaging (000s)L12M YA % L9M YA % L6M YA % L3M YA % L1M YA %
Barrels 0 0 - 0 0 - 0 0 - 0 0 - 0 0 -Value (USD) 10 0 - 0 0 - 0 0 - 0 0 - 0 0 -USD/Barrel 48,625.98 - - - - - - - - - - - - - -
Kegs (000s)L12M YA % L9M YA % L6M YA % L3M YA % L1M YA %
Barrels 0 0 -100.0% 0 0 -100.0% 0 0 -100.0% 0 0 -100.0% 0 0 -Value (USD) 0 101 -100.0% 0 24 -100.0% 0 24 -100.0% 0 13 -100.0% 0 0 -USD/Barrel - 300.68 - - 297.07 - - 297.07 - - 304.03 - - - -
June 2009 Page 55

bw166 Beer - Imports and Exports Report
2.47 Poland - Imports
Total Beer (000s)L12M YA % L9M YA % L6M YA % L3M YA % L1M YA %
Barrels 86 127 -32.3% 57 80 -28.5% 31 52 -39.6% 22 39 -42.9% 12 13 -10.8%Value (USD) 9,140 13,006 -29.7% 5,706 8,192 -30.3% 2,845 5,313 -46.4% 2,062 4,049 -49.1% 1,098 1,438 -23.6%USD/Barrel 106.57 102.67 3.8% 100.16 102.82 -2.6% 90.68 102.26 -11.3% 92.75 103.90 -10.7% 93.00 108.56 -14.3%Value (PLN) 25,033 32,363 -22.7% 17,518 19,103 -8.3% 9,294 11,776 -21.1% 6,691 8,822 -24.2% 3,524 3,113 13.2%PLN/Barrel 291.88 255.47 14.3% 307.50 239.77 28.2% 296.20 226.67 30.7% 300.88 226.36 32.9% 298.39 235.06 26.9%
Glass Packaging (000s)L12M YA % L9M YA % L6M YA % L3M YA % L1M YA %
Barrels 81 117 -30.6% 54 76 -28.5% 31 51 -39.3% 22 38 -42.1% 12 12 -6.6%Value (USD) 8,687 12,051 -27.9% 5,444 7,801 -30.2% 2,818 5,209 -45.9% 2,042 3,956 -48.4% 1,078 1,355 -20.5%USD/Barrel 107.31 103.27 3.9% 100.63 103.14 -2.4% 91.40 102.50 -10.8% 93.03 104.31 -10.8% 93.55 109.93 -14.9%Value (PLN) 23,852 29,838 -20.1% 16,761 18,133 -7.6% 9,205 11,548 -20.3% 6,624 8,620 -23.2% 3,457 2,935 17.8%PLN/Barrel 294.65 255.69 15.2% 309.82 239.76 29.2% 298.60 227.23 31.4% 301.83 227.27 32.8% 300.15 238.04 26.1%
Kegs (000s)L12M YA % L9M YA % L6M YA % L3M YA % L1M YA %
Barrels 3 3 -16.4% 2 1 19.5% 0 0 -18.1% 0 0 -69.1% 0 0 -57.1%Value (USD) 245 314 -21.8% 133 122 8.8% 15 47 -69.1% 8 41 -81.6% 8 31 -75.1%USD/Barrel 84.44 90.29 -6.5% 78.70 86.46 -9.0% 36.38 96.54 -62.3% 53.04 88.96 -40.4% 53.04 91.43 -42.0%Value (PLN) 626 828 -24.4% 383 298 28.3% 47 105 -55.4% 24 90 -72.8% 24 66 -63.2%PLN/Barrel 215.40 238.27 -9.6% 227.19 211.57 7.4% 115.90 212.84 -45.5% 170.19 193.13 -11.9% 170.19 197.98 -14.0%
Non-Glass Packaging (000s)L12M YA % L9M YA % L6M YA % L3M YA % L1M YA %
Barrels 2 7 -70.7% 1 3 -55.0% 0 1 -76.8% 0 1 -74.4% 0 1 -74.4%Value (USD) 208 642 -67.6% 129 269 -52.0% 13 56 -76.5% 13 52 -74.4% 13 52 -74.4%USD/Barrel 108.99 98.52 10.6% 109.05 102.24 6.7% 89.19 88.18 1.1% 89.19 89.19 0.0% 89.19 89.19 0.0%Value (PLN) 555 1,698 -67.3% 374 672 -44.4% 42 123 -65.6% 42 112 -62.1% 42 112 -62.1%PLN/Barrel 290.88 260.70 11.6% 315.65 255.14 23.7% 286.15 192.84 48.4% 286.15 193.12 48.2% 286.15 193.12 48.2%
June 2009 Page 56

bw166 Beer - Imports and Exports Report
2.48 Portugal - Imports
Total Beer (000s)L12M YA % L9M YA % L6M YA % L3M YA % L1M YA %
Barrels 11 13 -15.3% 8 8 -3.9% 6 5 19.6% 4 3 37.7% 2 1 94.4%Value (USD) 1,257 1,263 -0.4% 950 800 18.7% 757 514 47.1% 543 325 66.9% 271 121 123.5%USD/Barrel 113.62 96.61 17.6% 117.82 95.40 23.5% 119.60 97.25 23.0% 123.01 101.44 21.3% 114.69 99.75 15.0%Value (EUR) 907 871 4.1% 708 533 32.8% 561 335 67.6% 397 208 91.0% 194 78 148.3%EUR/Barrel 81.96 66.65 23.0% 87.84 63.58 38.2% 88.69 63.30 40.1% 89.87 64.77 38.8% 81.83 64.05 27.8%
Glass Packaging (000s)L12M YA % L9M YA % L6M YA % L3M YA % L1M YA %
Barrels 11 13 -14.7% 8 8 -4.3% 6 5 15.8% 4 3 37.7% 2 1 94.4%Value (USD) 1,231 1,226 0.4% 923 782 18.1% 730 514 42.0% 543 325 66.9% 271 121 123.5%USD/Barrel 113.32 96.35 17.6% 117.52 95.20 23.4% 119.27 97.25 22.6% 123.01 101.44 21.3% 114.69 99.75 15.0%Value (EUR) 887 845 5.0% 688 521 32.2% 541 335 61.7% 397 208 91.0% 194 78 148.3%EUR/Barrel 81.68 66.41 23.0% 87.60 63.41 38.1% 88.41 63.30 39.7% 89.87 64.77 38.8% 81.83 64.05 27.8%
Non-Glass Packaging (000s)L12M YA % L9M YA % L6M YA % L3M YA % L1M YA %
Barrels 0 0 -40.6% 0 0 17.9% 0 0 - 0 0 - 0 0 -Value (USD) 26 37 -27.6% 26 18 46.2% 26 0 - 0 0 - 0 0 -USD/Barrel 129.67 106.46 21.8% 129.67 104.53 24.0% 129.67 - - - - - - - -Value (EUR) 20 26 -23.5% 20 12 60.1% 20 0 - 0 0 - 0 0 -EUR/Barrel 97.13 75.49 28.7% 97.13 71.53 35.8% 97.13 - - - - - - - -
June 2009 Page 57

bw166 Beer - Imports and Exports Report
2.49 Romania - Imports
Total Beer (000s)L12M YA % L9M YA % L6M YA % L3M YA % L1M YA %
Barrels 0 1 -46.1% 0 0 -66.7% 0 0 0.0% 0 0 -100.0% 0 0 -Value (USD) 43 79 -45.6% 14 41 -65.1% 14 14 0.0% 0 14 -100.0% 0 0 -USD/Barrel 140.82 139.54 0.9% 140.82 134.32 4.8% 140.82 140.82 0.0% - 140.82 - - - -
Glass Packaging (000s)L12M YA % L9M YA % L6M YA % L3M YA % L1M YA %
Barrels 0 1 -46.1% 0 0 -66.7% 0 0 0.0% 0 0 -100.0% 0 0 -Value (USD) 43 79 -45.6% 14 41 -65.1% 14 14 0.0% 0 14 -100.0% 0 0 -USD/Barrel 140.82 139.54 0.9% 140.82 134.32 4.8% 140.82 140.82 0.0% - 140.82 - - - -
June 2009 Page 58
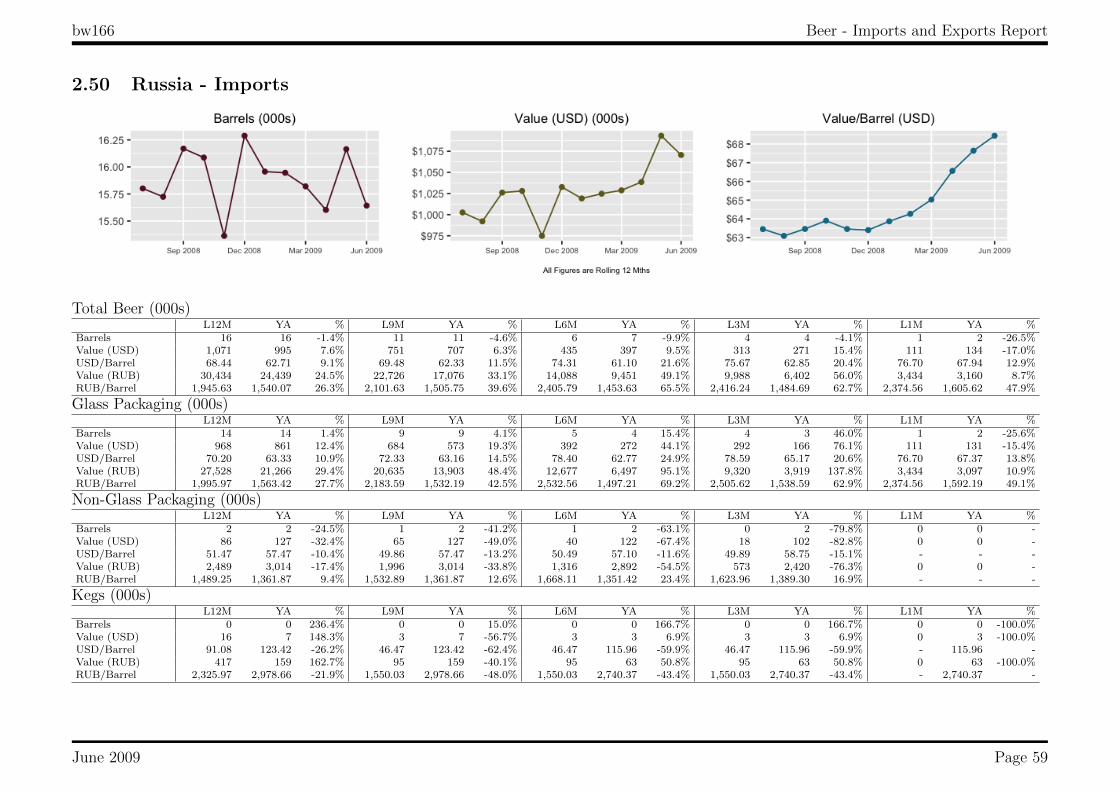
bw166 Beer - Imports and Exports Report
2.50 Russia - Imports
Total Beer (000s)L12M YA % L9M YA % L6M YA % L3M YA % L1M YA %
Barrels 16 16 -1.4% 11 11 -4.6% 6 7 -9.9% 4 4 -4.1% 1 2 -26.5%Value (USD) 1,071 995 7.6% 751 707 6.3% 435 397 9.5% 313 271 15.4% 111 134 -17.0%USD/Barrel 68.44 62.71 9.1% 69.48 62.33 11.5% 74.31 61.10 21.6% 75.67 62.85 20.4% 76.70 67.94 12.9%Value (RUB) 30,434 24,439 24.5% 22,726 17,076 33.1% 14,088 9,451 49.1% 9,988 6,402 56.0% 3,434 3,160 8.7%RUB/Barrel 1,945.63 1,540.07 26.3% 2,101.63 1,505.75 39.6% 2,405.79 1,453.63 65.5% 2,416.24 1,484.69 62.7% 2,374.56 1,605.62 47.9%
Glass Packaging (000s)L12M YA % L9M YA % L6M YA % L3M YA % L1M YA %
Barrels 14 14 1.4% 9 9 4.1% 5 4 15.4% 4 3 46.0% 1 2 -25.6%Value (USD) 968 861 12.4% 684 573 19.3% 392 272 44.1% 292 166 76.1% 111 131 -15.4%USD/Barrel 70.20 63.33 10.9% 72.33 63.16 14.5% 78.40 62.77 24.9% 78.59 65.17 20.6% 76.70 67.37 13.8%Value (RUB) 27,528 21,266 29.4% 20,635 13,903 48.4% 12,677 6,497 95.1% 9,320 3,919 137.8% 3,434 3,097 10.9%RUB/Barrel 1,995.97 1,563.42 27.7% 2,183.59 1,532.19 42.5% 2,532.56 1,497.21 69.2% 2,505.62 1,538.59 62.9% 2,374.56 1,592.19 49.1%
Non-Glass Packaging (000s)L12M YA % L9M YA % L6M YA % L3M YA % L1M YA %
Barrels 2 2 -24.5% 1 2 -41.2% 1 2 -63.1% 0 2 -79.8% 0 0 -Value (USD) 86 127 -32.4% 65 127 -49.0% 40 122 -67.4% 18 102 -82.8% 0 0 -USD/Barrel 51.47 57.47 -10.4% 49.86 57.47 -13.2% 50.49 57.10 -11.6% 49.89 58.75 -15.1% - - -Value (RUB) 2,489 3,014 -17.4% 1,996 3,014 -33.8% 1,316 2,892 -54.5% 573 2,420 -76.3% 0 0 -RUB/Barrel 1,489.25 1,361.87 9.4% 1,532.89 1,361.87 12.6% 1,668.11 1,351.42 23.4% 1,623.96 1,389.30 16.9% - - -
Kegs (000s)L12M YA % L9M YA % L6M YA % L3M YA % L1M YA %
Barrels 0 0 236.4% 0 0 15.0% 0 0 166.7% 0 0 166.7% 0 0 -100.0%Value (USD) 16 7 148.3% 3 7 -56.7% 3 3 6.9% 3 3 6.9% 0 3 -100.0%USD/Barrel 91.08 123.42 -26.2% 46.47 123.42 -62.4% 46.47 115.96 -59.9% 46.47 115.96 -59.9% - 115.96 -Value (RUB) 417 159 162.7% 95 159 -40.1% 95 63 50.8% 95 63 50.8% 0 63 -100.0%RUB/Barrel 2,325.97 2,978.66 -21.9% 1,550.03 2,978.66 -48.0% 1,550.03 2,740.37 -43.4% 1,550.03 2,740.37 -43.4% - 2,740.37 -
June 2009 Page 59

bw166 Beer - Imports and Exports Report
2.51 Singapore - Imports
Total Beer (000s)L12M YA % L9M YA % L6M YA % L3M YA % L1M YA %
Barrels 4 5 -11.3% 3 4 -21.2% 2 4 -41.8% 1 2 -33.2% 0 0 -100.0%Value (USD) 565 594 -4.8% 433 506 -14.4% 291 447 -34.8% 184 243 -24.5% 0 21 -100.0%USD/Barrel 126.16 117.60 7.3% 128.07 117.92 8.6% 132.26 117.97 12.1% 135.55 119.80 13.1% - 123.37 -
Glass Packaging (000s)L12M YA % L9M YA % L6M YA % L3M YA % L1M YA %
Barrels 4 5 -8.8% 3 4 -18.6% 2 4 -39.7% 1 2 -33.2% 0 0 -100.0%Value (USD) 565 573 -1.3% 433 485 -10.7% 291 426 -31.6% 184 243 -24.5% 0 21 -100.0%USD/Barrel 126.16 116.58 8.2% 128.07 116.73 9.7% 132.26 116.61 13.4% 135.55 119.80 13.1% - 123.37 -
Non-Glass Packaging (000s)L12M YA % L9M YA % L6M YA % L3M YA % L1M YA %
Barrels 0 0 -100.0% 0 0 -100.0% 0 0 -100.0% 0 0 - 0 0 -Value (USD) 0 21 -100.0% 0 21 -100.0% 0 21 -100.0% 0 0 - 0 0 -USD/Barrel - 154.15 - - 154.15 - - 154.15 - - - - - - -
June 2009 Page 60

bw166 Beer - Imports and Exports Report
2.52 Slovakia - Imports
Total Beer (000s)L12M YA % L9M YA % L6M YA % L3M YA % L1M YA %
Barrels 4 4 -8.8% 2 2 9.0% 2 1 39.3% 2 1 28.5% 1 0 -Value (USD) 516 502 2.6% 318 297 7.2% 221 197 12.3% 204 197 3.7% 104 0 -USD/Barrel 146.90 130.53 12.5% 137.46 139.78 -1.7% 132.75 164.67 -19.4% 132.95 164.67 -19.3% 122.31 - -Value (EUR) 361 345 4.5% 235 195 20.5% 161 126 27.5% 148 126 17.2% 74 0 -EUR/Barrel 102.79 89.67 14.6% 101.56 91.88 10.5% 96.47 105.38 -8.4% 96.17 105.38 -8.7% 87.27 - -
Glass Packaging (000s)L12M YA % L9M YA % L6M YA % L3M YA % L1M YA %
Barrels 2 4 -30.6% 1 2 -39.0% 1 1 -45.9% 1 1 -45.9% 0 0 -Value (USD) 395 487 -18.8% 198 297 -33.4% 101 197 -48.8% 101 197 -48.8% 42 0 -USD/Barrel 158.66 135.57 17.0% 152.64 139.78 9.2% 155.71 164.67 -5.4% 155.71 164.67 -5.4% 149.31 - -Value (EUR) 273 334 -18.2% 147 195 -24.4% 73 126 -42.0% 73 126 -42.0% 30 0 -EUR/Barrel 109.65 92.99 17.9% 113.79 91.88 23.8% 112.94 105.38 7.2% 112.94 105.38 7.2% 106.53 - -
Non-Glass Packaging (000s)L12M YA % L9M YA % L6M YA % L3M YA % L1M YA %
Barrels 1 0 - 1 0 - 1 0 - 1 0 - 0 0 -Value (USD) 99 0 - 99 0 - 99 0 - 82 0 - 42 0 -USD/Barrel 130.66 - - 130.66 - - 130.66 - - 130.71 - - 132.01 - -Value (EUR) 73 0 - 73 0 - 73 0 - 60 0 - 30 0 -EUR/Barrel 95.50 - - 95.50 - - 95.50 - - 94.56 - - 94.19 - -
Kegs (000s)L12M YA % L9M YA % L6M YA % L3M YA % L1M YA %
Barrels 0 0 0.0% 0 0 - 0 0 - 0 0 - 0 0 -Value (USD) 21 16 34.4% 21 0 - 21 0 - 21 0 - 21 0 -USD/Barrel 81.50 60.65 34.4% 81.50 - - 81.50 - - 81.50 - - 81.50 - -Value (EUR) 15 11 33.1% 15 0 - 15 0 - 15 0 - 15 0 -EUR/Barrel 58.15 43.68 33.1% 58.15 - - 58.15 - - 58.15 - - 58.15 - -
June 2009 Page 61

bw166 Beer - Imports and Exports Report
2.53 Spain - Imports
Total Beer (000s)L12M YA % L9M YA % L6M YA % L3M YA % L1M YA %
Barrels 4 6 -20.6% 3 3 -7.1% 2 2 -8.1% 2 1 108.8% 0 0 -22.7%Value (USD) 966 971 -0.5% 601 549 9.5% 441 376 17.4% 334 144 132.3% 48 55 -12.0%USD/Barrel 216.34 172.59 25.4% 205.90 174.63 17.9% 219.29 171.78 27.7% 217.85 195.84 11.2% 221.57 194.74 13.8%Value (EUR) 695 675 3.0% 450 367 22.7% 329 247 33.0% 248 92 168.6% 34 35 -2.3%EUR/Barrel 155.61 120.00 29.7% 154.24 116.77 32.1% 163.63 113.07 44.7% 161.36 125.43 28.6% 158.09 125.05 26.4%
Glass Packaging (000s)L12M YA % L9M YA % L6M YA % L3M YA % L1M YA %
Barrels 4 5 -18.2% 3 3 -2.1% 2 2 -0.7% 2 1 108.8% 0 0 -22.7%Value (USD) 966 949 1.8% 601 527 14.0% 441 354 24.6% 334 144 132.3% 48 55 -12.0%USD/Barrel 216.34 173.72 24.5% 205.90 176.82 16.4% 219.29 174.78 25.5% 217.85 195.84 11.2% 221.57 194.74 13.8%Value (EUR) 695 660 5.3% 450 352 27.8% 329 232 41.5% 248 92 168.6% 34 35 -2.3%EUR/Barrel 155.61 120.85 28.8% 154.24 118.15 30.5% 163.63 114.81 42.5% 161.36 125.43 28.6% 158.09 125.05 26.4%
Non-Glass Packaging (000s)L12M YA % L9M YA % L6M YA % L3M YA % L1M YA %
Barrels 0 0 -100.0% 0 0 -100.0% 0 0 -100.0% 0 0 - 0 0 -Value (USD) 0 22 -100.0% 0 22 -100.0% 0 22 -100.0% 0 0 - 0 0 -USD/Barrel - 134.28 - - 134.28 - - 134.28 - - - - - - -Value (EUR) 0 15 -100.0% 0 15 -100.0% 0 15 -100.0% 0 0 - 0 0 -EUR/Barrel - 91.33 - - 91.33 - - 91.33 - - - - - - -
June 2009 Page 62

bw166 Beer - Imports and Exports Report
2.54 Sri Lanka - Imports
Total Beer (000s)L12M YA % L9M YA % L6M YA % L3M YA % L1M YA %
Barrels 2 2 15.1% 2 2 -6.3% 1 1 -22.7% 1 1 38.8% 0 0 0.2%Value (USD) 336 265 26.8% 224 227 -1.6% 149 162 -7.6% 122 81 50.7% 28 30 -5.2%USD/Barrel 149.31 135.50 10.2% 148.93 141.81 5.0% 151.27 126.57 19.5% 151.79 139.83 8.6% 146.32 154.66 -5.4%
Glass Packaging (000s)L12M YA % L9M YA % L6M YA % L3M YA % L1M YA %
Barrels 2 2 16.2% 1 2 -6.0% 1 1 -23.4% 1 1 26.9% 0 0 0.2%Value (USD) 326 262 24.7% 213 224 -4.6% 139 158 -12.0% 111 81 37.8% 28 30 -5.2%USD/Barrel 149.24 139.11 7.3% 148.82 146.57 1.5% 151.26 131.64 14.9% 151.84 139.83 8.6% 146.32 154.66 -5.4%
Kegs (000s)L12M YA % L9M YA % L6M YA % L3M YA % L1M YA %
Barrels 0 0 -11.6% 0 0 -11.6% 0 0 -11.6% 0 0 - 0 0 -Value (USD) 10 4 177.6% 10 4 177.6% 10 4 177.6% 10 0 - 0 0 -USD/Barrel 151.31 48.17 214.1% 151.31 48.17 214.1% 151.31 48.17 214.1% 151.31 - - - - -
June 2009 Page 63
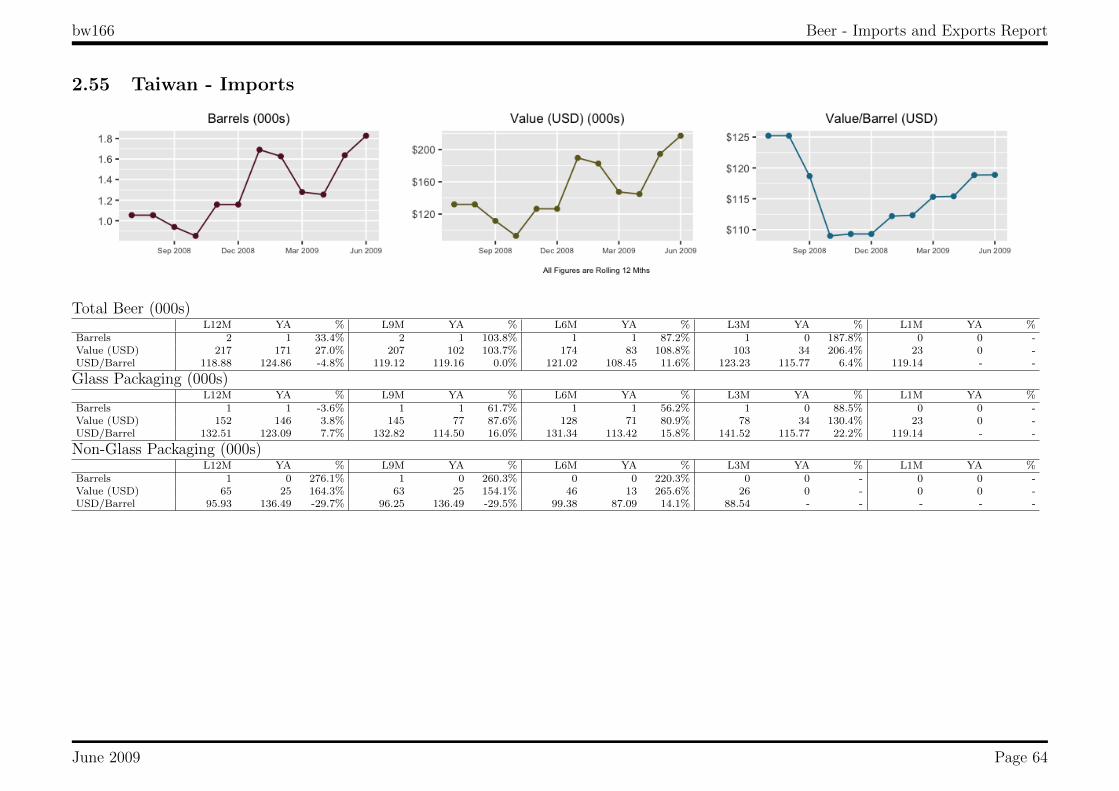
bw166 Beer - Imports and Exports Report
2.55 Taiwan - Imports
Total Beer (000s)L12M YA % L9M YA % L6M YA % L3M YA % L1M YA %
Barrels 2 1 33.4% 2 1 103.8% 1 1 87.2% 1 0 187.8% 0 0 -Value (USD) 217 171 27.0% 207 102 103.7% 174 83 108.8% 103 34 206.4% 23 0 -USD/Barrel 118.88 124.86 -4.8% 119.12 119.16 0.0% 121.02 108.45 11.6% 123.23 115.77 6.4% 119.14 - -
Glass Packaging (000s)L12M YA % L9M YA % L6M YA % L3M YA % L1M YA %
Barrels 1 1 -3.6% 1 1 61.7% 1 1 56.2% 1 0 88.5% 0 0 -Value (USD) 152 146 3.8% 145 77 87.6% 128 71 80.9% 78 34 130.4% 23 0 -USD/Barrel 132.51 123.09 7.7% 132.82 114.50 16.0% 131.34 113.42 15.8% 141.52 115.77 22.2% 119.14 - -
Non-Glass Packaging (000s)L12M YA % L9M YA % L6M YA % L3M YA % L1M YA %
Barrels 1 0 276.1% 1 0 260.3% 0 0 220.3% 0 0 - 0 0 -Value (USD) 65 25 164.3% 63 25 154.1% 46 13 265.6% 26 0 - 0 0 -USD/Barrel 95.93 136.49 -29.7% 96.25 136.49 -29.5% 99.38 87.09 14.1% 88.54 - - - - -
June 2009 Page 64

bw166 Beer - Imports and Exports Report
2.56 Thailand - Imports
Total Beer (000s)L12M YA % L9M YA % L6M YA % L3M YA % L1M YA %
Barrels 28 30 -6.5% 21 19 9.9% 13 10 37.0% 7 4 57.7% 2 1 96.7%Value (USD) 4,632 4,681 -1.0% 3,406 3,151 8.1% 2,175 1,671 30.2% 1,085 803 35.1% 347 217 60.1%USD/Barrel 166.12 156.95 5.8% 162.57 165.33 -1.7% 166.44 175.21 -5.0% 159.84 186.60 -14.3% 165.95 203.84 -18.6%
Glass Packaging (000s)L12M YA % L9M YA % L6M YA % L3M YA % L1M YA %
Barrels 20 22 -11.7% 16 14 12.9% 10 7 37.3% 5 3 66.0% 1 1 23.3%Value (USD) 3,246 3,623 -10.4% 2,575 2,406 7.0% 1,616 1,261 28.1% 861 600 43.5% 207 202 2.3%USD/Barrel 163.87 161.39 1.5% 163.01 171.96 -5.2% 168.32 180.46 -6.7% 159.58 184.67 -13.6% 169.83 204.62 -17.0%
Non-Glass Packaging (000s)L12M YA % L9M YA % L6M YA % L3M YA % L1M YA %
Barrels 8 7 10.7% 5 5 1.7% 3 3 36.1% 1 1 32.0% 1 0 >999%Value (USD) 1,386 1,040 33.2% 830 745 11.5% 559 410 36.5% 224 203 10.3% 140 14 894.8%USD/Barrel 171.62 142.66 20.3% 161.20 147.01 9.7% 161.25 160.80 0.3% 160.87 192.55 -16.5% 160.49 193.21 -16.9%
Kegs (000s)L12M YA % L9M YA % L6M YA % L3M YA % L1M YA %
Barrels 0 0 -100.0% 0 0 - 0 0 - 0 0 - 0 0 -Value (USD) 0 18 -100.0% 0 0 - 0 0 - 0 0 - 0 0 -USD/Barrel - 208.61 - - - - - - - - - - - - -
June 2009 Page 65

bw166 Beer - Imports and Exports Report
2.57 Trinidad and Tobago - Imports
Total Beer (000s)L12M YA % L9M YA % L6M YA % L3M YA % L1M YA %
Barrels 15 10 41.7% 11 9 18.2% 5 6 -21.0% 4 1 199.8% 3 0 546.5%Value (USD) 1,742 1,207 44.3% 1,342 1,085 23.6% 690 742 -7.1% 520 175 196.7% 360 68 430.8%USD/Barrel 119.57 117.39 1.9% 121.23 115.97 4.5% 137.36 116.77 17.6% 135.13 136.55 -1.0% 129.79 158.10 -17.9%
Glass Packaging (000s)L12M YA % L9M YA % L6M YA % L3M YA % L1M YA %
Barrels 14 10 39.0% 11 9 14.4% 5 6 -27.6% 3 1 184.7% 3 0 535.4%Value (USD) 1,682 1,176 43.0% 1,282 1,060 20.9% 632 723 -12.6% 477 155 206.7% 354 58 508.0%USD/Barrel 119.36 115.97 2.9% 121.02 114.52 5.7% 138.58 114.82 20.7% 137.34 127.48 7.7% 130.13 136.01 -4.3%
Kegs (000s)L12M YA % L9M YA % L6M YA % L3M YA % L1M YA %
Barrels 0 0 >999% 0 0 >999% 0 0 >999% 0 0 >999% 0 0 -100.0%Value (USD) 36 9 284.4% 36 9 284.4% 36 9 284.4% 31 9 231.5% 0 9 -100.0%USD/Barrel 125.74 74,257.67 -99.8% 125.74 74,257.67 -99.8% 125.74 74,257.67 -99.8% 109.06 74,257.67 -99.9% - 74,257.67 -
Non-Glass Packaging (000s)L12M YA % L9M YA % L6M YA % L3M YA % L1M YA %
Barrels 0 0 28.8% 0 0 86.9% 0 0 173.5% 0 0 35.2% 0 0 -Value (USD) 24 22 7.9% 24 16 52.6% 21 10 110.6% 11 10 11.1% 5 0 -USD/Barrel 126.23 150.73 -16.3% 126.23 154.56 -18.3% 124.73 161.96 -23.0% 133.09 161.96 -17.8% 110.68 - -
June 2009 Page 66
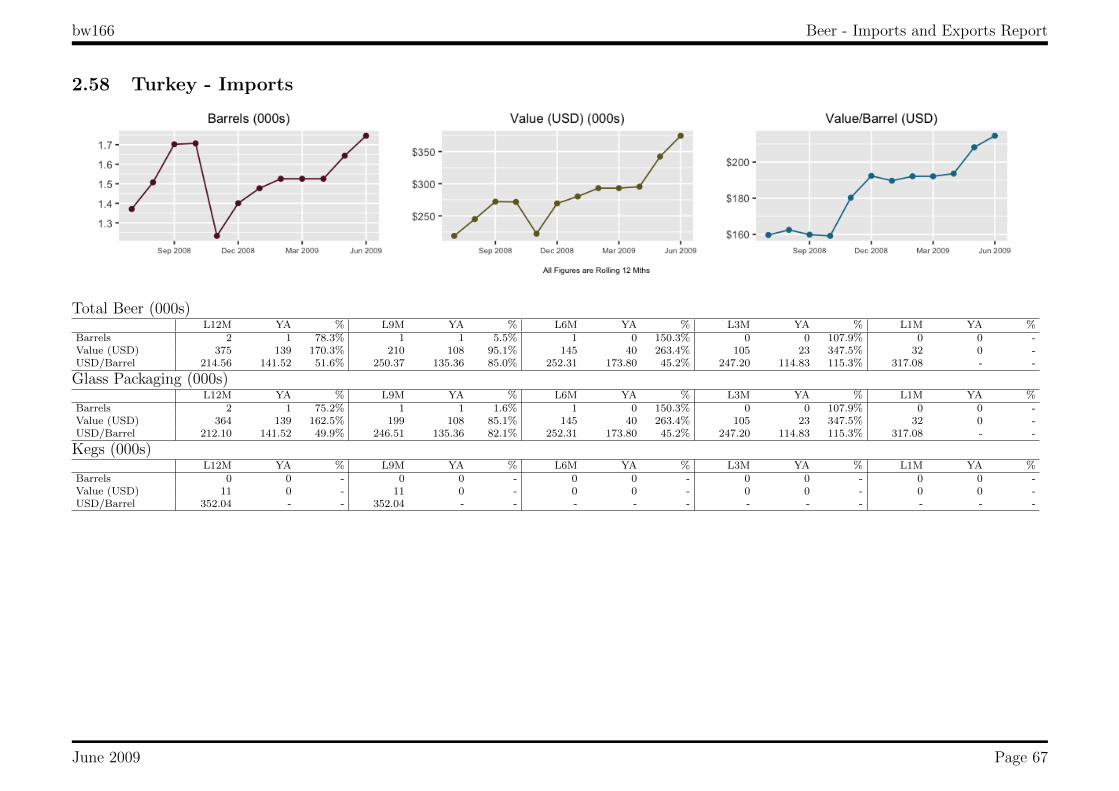
bw166 Beer - Imports and Exports Report
2.58 Turkey - Imports
Total Beer (000s)L12M YA % L9M YA % L6M YA % L3M YA % L1M YA %
Barrels 2 1 78.3% 1 1 5.5% 1 0 150.3% 0 0 107.9% 0 0 -Value (USD) 375 139 170.3% 210 108 95.1% 145 40 263.4% 105 23 347.5% 32 0 -USD/Barrel 214.56 141.52 51.6% 250.37 135.36 85.0% 252.31 173.80 45.2% 247.20 114.83 115.3% 317.08 - -
Glass Packaging (000s)L12M YA % L9M YA % L6M YA % L3M YA % L1M YA %
Barrels 2 1 75.2% 1 1 1.6% 1 0 150.3% 0 0 107.9% 0 0 -Value (USD) 364 139 162.5% 199 108 85.1% 145 40 263.4% 105 23 347.5% 32 0 -USD/Barrel 212.10 141.52 49.9% 246.51 135.36 82.1% 252.31 173.80 45.2% 247.20 114.83 115.3% 317.08 - -
Kegs (000s)L12M YA % L9M YA % L6M YA % L3M YA % L1M YA %
Barrels 0 0 - 0 0 - 0 0 - 0 0 - 0 0 -Value (USD) 11 0 - 11 0 - 0 0 - 0 0 - 0 0 -USD/Barrel 352.04 - - 352.04 - - - - - - - - - - -
June 2009 Page 67

bw166 Beer - Imports and Exports Report
2.59 Ukraine - Imports
Total Beer (000s)L12M YA % L9M YA % L6M YA % L3M YA % L1M YA %
Barrels 3 2 12.4% 2 2 31.0% 2 1 45.9% 1 1 90.4% 1 0 163.5%Value (USD) 198 163 21.3% 157 113 39.7% 119 77 54.2% 95 48 98.4% 42 17 149.3%USD/Barrel 70.56 65.36 7.9% 70.76 66.37 6.6% 71.10 67.27 5.7% 71.70 68.79 4.2% 71.01 75.06 -5.4%
Glass Packaging (000s)L12M YA % L9M YA % L6M YA % L3M YA % L1M YA %
Barrels 3 2 9.5% 2 2 26.7% 2 1 39.5% 1 1 79.8% 1 0 163.5%Value (USD) 193 163 17.9% 152 113 34.8% 114 77 47.1% 90 48 86.9% 42 17 149.3%USD/Barrel 70.43 65.36 7.8% 70.61 66.37 6.4% 70.92 67.27 5.4% 71.50 68.79 3.9% 71.01 75.06 -5.4%
Non-Glass Packaging (000s)L12M YA % L9M YA % L6M YA % L3M YA % L1M YA %
Barrels 0 0 - 0 0 - 0 0 - 0 0 - 0 0 -Value (USD) 6 0 - 6 0 - 6 0 - 6 0 - 0 0 -USD/Barrel 75.11 - - 75.11 - - 75.11 - - 75.11 - - - - -
June 2009 Page 68

bw166 Beer - Imports and Exports Report
2.60 United Kingdom - Imports
Total Beer (000s)L12M YA % L9M YA % L6M YA % L3M YA % L1M YA %
Barrels 864 997 -13.3% 604 756 -20.1% 403 528 -23.7% 201 282 -28.8% 63 83 -23.9%Value (USD) 114,333 120,725 -5.3% 81,451 90,845 -10.3% 54,616 63,347 -13.8% 28,747 34,080 -15.6% 9,140 9,952 -8.2%USD/Barrel 132.29 121.08 9.3% 134.86 120.21 12.2% 135.68 120.03 13.0% 143.21 120.93 18.4% 144.61 119.85 20.7%Value (GBP) 71,069 60,304 17.9% 53,706 45,528 18.0% 36,675 32,071 14.4% 18,647 17,277 7.9% 5,589 5,058 10.5%GBP/Barrel 82.23 60.48 36.0% 88.92 60.25 47.6% 91.11 60.77 49.9% 92.89 61.31 51.5% 88.43 60.91 45.2%
Glass Packaging (000s)L12M YA % L9M YA % L6M YA % L3M YA % L1M YA %
Barrels 521 560 -6.8% 364 414 -11.9% 232 286 -18.8% 131 153 -14.4% 40 45 -12.4%Value (USD) 81,390 83,580 -2.6% 57,551 61,870 -7.0% 37,570 42,506 -11.6% 20,970 22,929 -8.5% 6,409 6,778 -5.5%USD/Barrel 156.07 149.35 4.5% 157.92 149.51 5.6% 161.79 148.69 8.8% 159.96 149.68 6.9% 160.86 149.11 7.9%Value (GBP) 50,475 41,725 21.0% 37,871 30,988 22.2% 25,183 21,518 17.0% 13,613 11,624 17.1% 3,919 3,445 13.8%GBP/Barrel 96.79 74.56 29.8% 103.92 74.88 38.8% 108.45 75.27 44.1% 103.84 75.88 36.8% 98.36 75.78 29.8%
Kegs (000s)L12M YA % L9M YA % L6M YA % L3M YA % L1M YA %
Barrels 295 393 -24.8% 202 305 -33.8% 148 210 -29.7% 58 113 -48.3% 20 34 -41.3%Value (USD) 26,525 30,836 -14.0% 18,877 23,795 -20.7% 14,034 16,468 -14.8% 6,285 8,895 -29.3% 2,287 2,701 -15.3%USD/Barrel 89.87 78.51 14.5% 93.41 78.00 19.8% 94.95 78.29 21.3% 107.57 78.72 36.7% 113.83 78.92 44.2%Value (GBP) 16,570 15,409 7.5% 12,540 11,926 5.1% 9,462 8,337 13.5% 4,065 4,510 -9.9% 1,399 1,372 1.9%GBP/Barrel 56.14 39.23 43.1% 62.05 39.10 58.7% 64.01 39.63 61.5% 69.57 39.91 74.3% 69.61 40.11 73.6%
Non-Glass Packaging (000s)L12M YA % L9M YA % L6M YA % L3M YA % L1M YA %
Barrels 48 45 6.6% 37 37 1.6% 23 32 -28.5% 11 16 -28.3% 3 3 -2.5%Value (USD) 6,418 6,309 1.7% 5,024 5,180 -3.0% 3,013 4,373 -31.1% 1,491 2,255 -33.9% 444 473 -6.1%USD/Barrel 134.77 141.20 -4.6% 134.16 140.59 -4.6% 133.72 138.71 -3.6% 133.14 144.41 -7.8% 135.77 140.90 -3.6%Value (GBP) 4,024 3,171 26.9% 3,295 2,613 26.1% 2,030 2,215 -8.4% 969 1,143 -15.2% 272 240 13.0%GBP/Barrel 84.49 70.97 19.0% 88.00 70.92 24.1% 90.09 70.27 28.2% 86.49 73.19 18.2% 83.02 71.61 15.9%
June 2009 Page 69

bw166 Beer - Imports and Exports Report
2.61 Venezuela - Imports
Total Beer (000s)L12M YA % L9M YA % L6M YA % L3M YA % L1M YA %
Barrels 7 9 -20.8% 5 9 -47.2% 2 5 -58.0% 1 2 -17.9% 1 0 60.4%Value (USD) 790 1,003 -21.3% 491 922 -46.7% 230 539 -57.4% 139 171 -19.2% 66 39 69.9%USD/Barrel 106.12 106.70 -0.5% 106.87 105.95 0.9% 105.53 104.09 1.4% 105.45 107.14 -1.6% 106.32 100.42 5.9%
Glass Packaging (000s)L12M YA % L9M YA % L6M YA % L3M YA % L1M YA %
Barrels 7 7 11.1% 5 6 -23.7% 2 4 -40.9% 1 2 -21.5% 1 0 45.6%Value (USD) 785 749 4.7% 486 668 -27.2% 224 399 -43.8% 133 171 -22.2% 61 39 56.6%USD/Barrel 106.25 112.75 -5.8% 107.09 112.36 -4.7% 105.96 111.27 -4.8% 106.17 107.14 -0.9% 108.00 100.42 7.6%
Non-Glass Packaging (000s)L12M YA % L9M YA % L6M YA % L3M YA % L1M YA %
Barrels 0 3 -97.9% 0 3 -97.9% 0 2 -96.4% 0 0 - 0 0 -Value (USD) 5 254 -98.0% 5 254 -98.0% 5 140 -96.3% 5 0 - 5 0 -USD/Barrel 89.75 92.12 -2.6% 89.75 92.12 -2.6% 89.75 87.96 2.0% 89.75 - - 89.75 - -
June 2009 Page 70

bw166 Beer - Imports and Exports Report
2.62 Vietnam - Imports
Total Beer (000s)L12M YA % L9M YA % L6M YA % L3M YA % L1M YA %
Barrels 1 2 -37.7% 1 2 -44.6% 1 1 -7.9% 0 1 -56.2% 0 0 -Value (USD) 172 285 -39.5% 141 254 -44.4% 128 137 -6.3% 62 137 -54.6% 44 0 -USD/Barrel 124.87 128.53 -2.8% 133.01 132.61 0.3% 129.33 127.11 1.7% 131.55 127.11 3.5% 141.82 - -
Glass Packaging (000s)L12M YA % L9M YA % L6M YA % L3M YA % L1M YA %
Barrels 1 2 -37.7% 1 2 -44.6% 1 1 -7.9% 0 1 -56.2% 0 0 -Value (USD) 172 285 -39.5% 141 254 -44.4% 128 137 -6.3% 62 137 -54.6% 44 0 -USD/Barrel 124.87 128.53 -2.8% 133.01 132.61 0.3% 129.33 127.11 1.7% 131.55 127.11 3.5% 141.82 - -
June 2009 Page 71

bw166 Beer - Imports and Exports Report
3 Exports - Total Beer
Total Beer (000s)L12M YA % L9M YA % L6M YA % L3M YA % L1M YA %
Barrels 2,996 2,743 9.3% 2,166 2,053 5.5% 1,382 1,360 1.6% 722 751 -4.0% 263 268 -1.8%Value (USD) 284,875 252,966 12.6% 207,792 188,696 10.1% 134,009 124,281 7.8% 69,852 68,494 2.0% 25,248 24,400 3.5%USD/Barrel 95.07 92.24 3.1% 95.94 91.92 4.4% 96.94 91.36 6.1% 96.79 91.15 6.2% 95.85 90.96 5.4%
Non-Glass Packaging (000s)L12M YA % L9M YA % L6M YA % L3M YA % L1M YA %
Barrels 2,996 2,743 9.3% 2,166 2,053 5.5% 1,382 1,360 1.6% 722 751 -4.0% 263 268 -1.8%Value (USD) 284,875 252,966 12.6% 207,792 188,696 10.1% 134,009 124,281 7.8% 69,852 68,494 2.0% 25,248 24,400 3.5%USD/Barrel 95.07 92.24 3.1% 95.94 91.92 4.4% 96.94 91.36 6.1% 96.79 91.15 6.2% 95.85 90.96 5.4%
June 2009 Page 72

bw166 Beer - Imports and Exports Report
3.1 Exports - Total Beer - Top 25 Countries
Barrels (000s)L12M YA % L9M YA % L6M YA % L3M YA % L1M YA %
Mexico 1,058 958 10.5% 771 710 8.7% 519 497 4.5% 269 280 -3.8% 85 95 -10.2%Canada 874 891 -1.9% 620 640 -3.1% 407 387 4.9% 218 207 5.5% 90 67 35.8%Panama 118 75 57.2% 84 66 27.6% 59 49 19.4% 26 26 -0.3% 13 9 36.3%Australia 117 97 21.1% 97 77 26.1% 63 45 38.7% 29 18 60.5% 7 3 116.4%Taiwan 105 132 -21.0% 66 93 -28.8% 53 70 -24.0% 33 52 -36.8% 11 24 -55.9%Korea, South 103 111 -7.3% 75 80 -7.0% 44 56 -21.6% 30 31 -3.9% 16 16 -1.8%Paraguay 100 39 156.3% 75 38 100.7% 19 12 62.1% 13 4 248.5% 6 2 271.7%United Kingdom 87 59 49.2% 54 54 0.6% 22 51 -55.9% 7 37 -81.2% 3 17 -80.2%Hong Kong 39 38 4.3% 28 32 -14.2% 16 20 -19.5% 11 11 1.9% 2 4 -52.8%Chile 32 4 613.8% 20 4 365.3% 12 2 440.3% 7 1 392.8% 4 1 553.2%United Arab Emi-rates
31 33 -6.0% 26 25 4.3% 13 17 -23.8% 3 9 -68.4% 1 4 -80.9%
Bahamas 29 24 20.8% 21 18 13.2% 14 12 15.3% 9 6 47.8% 2 3 -36.3%Sweden 27 25 9.0% 15 19 -22.4% 11 13 -18.6% 6 5 15.4% 2 1 65.3%Honduras 25 18 37.3% 20 15 32.7% 15 9 58.5% 5 6 -10.0% 2 2 24.6%Bermuda 22 6 256.7% 16 4 271.1% 7 3 105.4% 6 2 238.7% 1 1 134.9%Netherlands An-tilles (through Apr2011)
20 21 -6.1% 15 16 -6.3% 9 11 -16.8% 3 5 -29.5% 1 1 -27.5%
Aruba 15 23 -33.5% 12 17 -31.1% 6 10 -34.3% 3 4 -7.4% 1 1 3.0%Japan 14 16 -11.9% 12 12 -5.1% 8 9 -7.7% 5 5 -2.2% 3 2 71.1%Cayman Islands 13 15 -18.1% 12 11 0.6% 7 7 -0.2% 3 3 15.5% 1 1 -36.9%Ireland 12 3 380.0% 11 2 414.7% 11 2 485.4% 1 1 23.5% 1 0 241.8%Colombia 11 16 -29.9% 10 12 -12.1% 6 7 -5.9% 2 2 18.4% 0 1 -56.1%Denmark 10 7 36.1% 7 7 9.8% 4 5 -8.4% 3 3 10.8% 1 1 23.7%Dominican Repub-lic
9 15 -35.3% 7 11 -36.5% 5 7 -30.0% 2 3 -37.8% 1 1 -28.8%
Palau 8 8 5.1% 7 5 21.5% 3 3 11.6% 2 2 11.1% 1 0 200.0%Singapore 8 9 -12.6% 4 8 -48.4% 3 7 -50.0% 2 4 -47.4% 0 1 -80.9%All Other 110 101 8.7% 81 75 7.7% 47 51 -7.4% 23 27 -14.9% 9 10 -16.6%Grand Total 2,996 2,743 9.3% 2,166 2,053 5.5% 1,382 1,360 1.6% 722 751 -4.0% 263 268 -1.8%
June 2009 Page 73

bw166 Beer - Imports and Exports Report
Value (USD) (000s)L12M YA % L9M YA % L6M YA % L3M YA % L1M YA %
Mexico 90,531 77,345 17.0% 66,649 57,541 15.8% 45,205 40,490 11.6% 23,727 22,916 3.5% 7,364 7,790 -5.5%Canada 94,931 94,056 0.9% 67,775 67,950 -0.3% 44,063 41,200 7.0% 22,854 22,249 2.7% 9,332 7,284 28.1%Panama 7,999 4,584 74.5% 5,764 4,050 42.3% 4,092 3,060 33.7% 1,847 1,658 11.4% 827 606 36.5%Australia 13,087 10,196 28.4% 10,748 8,194 31.2% 7,075 4,954 42.8% 3,188 1,971 61.7% 767 345 122.4%Taiwan 9,661 11,750 -17.8% 6,181 8,262 -25.2% 5,013 6,229 -19.5% 3,159 4,490 -29.6% 1,047 2,161 -51.6%Korea, South 8,069 8,898 -9.3% 5,921 6,457 -8.3% 3,527 4,562 -22.7% 2,427 2,590 -6.3% 1,308 1,378 -5.1%Paraguay 9,019 2,948 206.0% 6,742 2,809 140.1% 2,365 1,090 116.9% 1,599 428 273.9% 819 213 283.9%United Kingdom 6,151 4,097 50.1% 4,055 3,547 14.3% 1,909 3,233 -41.0% 889 2,116 -58.0% 430 955 -54.9%Hong Kong 2,717 2,470 10.0% 1,938 2,126 -8.8% 1,129 1,302 -13.3% 758 718 5.5% 147 286 -48.7%Chile 3,448 450 666.2% 2,188 440 397.7% 1,228 269 356.3% 759 136 457.0% 370 44 737.1%United Arab Emi-rates
3,549 3,592 -1.2% 2,981 2,720 9.6% 1,479 1,874 -21.1% 326 1,008 -67.6% 87 451 -80.8%
Bahamas 3,358 2,726 23.2% 2,407 2,065 16.6% 1,646 1,379 19.4% 1,055 719 46.6% 195 324 -39.9%Sweden 2,699 2,627 2.7% 1,778 1,930 -7.9% 1,301 1,306 -0.4% 779 646 20.6% 291 191 52.7%Honduras 2,087 1,779 17.3% 1,675 1,449 15.6% 1,220 835 46.1% 473 512 -7.8% 224 149 50.7%Bermuda 2,478 833 197.6% 1,771 587 201.5% 776 454 70.7% 640 240 166.3% 152 72 110.6%Netherlands An-tilles (through Apr2011)
2,494 2,731 -8.7% 1,868 2,068 -9.6% 1,077 1,402 -23.1% 324 646 -49.8% 88 201 -56.0%
Aruba 2,000 2,363 -15.4% 1,530 1,729 -11.5% 859 995 -13.7% 423 464 -8.8% 128 128 0.0%Japan 1,461 1,659 -12.0% 1,191 1,292 -7.8% 829 882 -6.0% 497 478 4.1% 311 178 74.5%Cayman Islands 1,552 1,858 -16.5% 1,430 1,394 2.5% 880 833 5.6% 437 337 29.9% 90 125 -28.6%Ireland 1,178 178 560.2% 1,086 153 610.8% 1,035 128 711.9% 122 84 45.7% 88 17 409.2%Colombia 1,140 1,225 -6.9% 1,044 878 18.9% 640 467 36.9% 181 111 62.2% 25 49 -47.9%Denmark 976 667 46.3% 715 584 22.4% 441 400 10.2% 304 223 36.3% 105 77 37.1%Dominican Repub-lic
1,195 1,596 -25.1% 912 1,204 -24.3% 603 694 -13.1% 236 287 -17.9% 89 109 -18.7%
Palau 1,013 971 4.3% 797 663 20.3% 409 366 11.9% 274 246 11.4% 81 27 200.0%Singapore 852 973 -12.4% 478 930 -48.6% 369 743 -50.4% 219 424 -48.4% 27 142 -81.1%All Other 11,228 10,394 8.0% 8,167 7,673 6.4% 4,839 5,136 -5.8% 2,355 2,796 -15.8% 855 1,097 -22.1%Grand Total 284,875 252,966 12.6% 207,792 188,696 10.1% 134,009 124,281 7.8% 69,852 68,494 2.0% 25,248 24,400 3.5%
June 2009 Page 74

bw166 Beer - Imports and Exports Report
Value/Barrel (USD)L12M YA % L9M YA % L6M YA % L3M YA % L1M YA %
Mexico 85.56 80.77 5.9% 86.42 81.07 6.6% 87.10 81.51 6.9% 88.05 81.78 7.7% 86.49 82.12 5.3%Canada 108.67 105.59 2.9% 109.25 106.14 2.9% 108.39 106.35 1.9% 104.72 107.59 -2.7% 103.32 109.53 -5.7%Panama 67.98 61.24 11.0% 68.72 61.60 11.6% 69.55 62.08 12.0% 71.74 64.20 11.7% 65.75 65.65 0.1%Australia 111.78 105.44 6.0% 110.64 106.36 4.0% 112.26 109.05 2.9% 110.63 109.78 0.8% 114.17 111.09 2.8%Taiwan 92.44 88.79 4.1% 93.21 88.68 5.1% 94.45 89.15 5.9% 95.81 86.06 11.3% 97.87 89.18 9.7%Korea, South 78.49 80.22 -2.2% 79.21 80.31 -1.4% 80.39 81.52 -1.4% 81.93 84.02 -2.5% 81.85 84.67 -3.3%Paraguay 90.47 75.78 19.4% 89.47 74.80 19.6% 121.60 90.87 33.8% 124.21 115.78 7.3% 128.94 124.85 3.3%United Kingdom 70.41 69.95 0.7% 75.30 66.24 13.7% 84.95 63.44 33.9% 129.35 57.90 123.4% 125.72 55.32 127.3%Hong Kong 69.35 65.73 5.5% 69.79 65.69 6.2% 71.55 66.43 7.7% 70.48 68.08 3.5% 75.11 69.16 8.6%Chile 108.71 101.28 7.3% 108.40 101.34 7.0% 104.45 123.67 -15.5% 110.13 97.44 13.0% 102.56 80.03 28.1%United Arab Emi-rates
114.03 108.50 5.1% 114.22 108.70 5.1% 114.18 110.20 3.6% 114.41 111.64 2.5% 112.47 111.86 0.5%
Bahamas 116.78 114.50 2.0% 117.03 113.65 3.0% 117.31 113.33 3.5% 114.72 115.67 -0.8% 109.23 115.66 -5.6%Sweden 99.92 106.04 -5.8% 118.34 99.67 18.7% 122.89 100.49 22.3% 123.15 117.79 4.6% 124.66 134.90 -7.6%Honduras 84.40 98.78 -14.6% 84.49 97.05 -12.9% 84.10 91.26 -7.8% 87.42 85.33 2.4% 93.26 77.07 21.0%Bermuda 110.29 132.19 -16.6% 109.84 135.18 -18.7% 113.55 136.58 -16.9% 108.28 137.68 -21.4% 121.46 135.45 -10.3%Netherlands An-tilles (through Apr2011)
127.66 131.23 -2.7% 126.60 131.25 -3.5% 121.73 131.71 -7.6% 93.87 131.73 -28.7% 81.28 133.94 -39.3%
Aruba 130.27 102.44 27.2% 132.12 102.83 28.5% 132.67 100.88 31.5% 129.83 131.84 -1.5% 125.45 129.24 -2.9%Japan 101.69 101.74 -0.1% 101.54 104.51 -2.8% 100.91 99.12 1.8% 100.05 94.03 6.4% 103.41 101.42 2.0%Cayman Islands 123.32 120.90 2.0% 123.74 121.43 1.9% 128.89 121.81 5.8% 135.49 120.48 12.5% 147.89 130.69 13.2%Ireland 95.76 69.63 37.5% 96.54 69.92 38.1% 97.17 70.07 38.7% 86.50 73.30 18.0% 98.56 66.17 49.0%Colombia 100.60 75.73 32.8% 101.27 74.88 35.2% 101.48 69.73 45.5% 96.78 70.65 37.0% 92.09 77.58 18.7%Denmark 97.58 90.78 7.5% 99.86 89.53 11.5% 105.25 87.48 20.3% 107.96 87.71 23.1% 107.90 97.40 10.8%Dominican Repub-lic
126.45 109.16 15.8% 128.21 107.43 19.3% 129.29 104.11 24.2% 130.24 98.76 31.9% 130.89 114.73 14.1%
Palau 121.01 121.89 -0.7% 120.78 122.03 -1.0% 122.55 122.17 0.3% 122.90 122.66 0.2% 121.86 121.86 0.0%Singapore 111.10 110.74 0.3% 110.33 110.75 -0.4% 108.94 109.82 -0.8% 109.33 111.52 -2.0% 110.19 111.37 -1.1%All Other 102.34 103.02 -0.7% 101.02 102.24 -1.2% 103.40 101.58 1.8% 103.78 104.87 -1.0% 99.22 106.15 -6.5%Grand Total 95.07 92.24 3.1% 95.94 91.92 4.4% 96.94 91.36 6.1% 96.79 91.15 6.2% 95.85 90.96 5.4%
June 2009 Page 75

bw166 Beer - Imports and Exports Report
4 Exports - Details by Country
4.1 Aruba - Exports
Total Beer (000s)L12M YA % L9M YA % L6M YA % L3M YA % L1M YA %
Barrels 15 23 -33.5% 12 17 -31.1% 6 10 -34.3% 3 4 -7.4% 1 1 3.0%Value (USD) 2,000 2,363 -15.4% 1,530 1,729 -11.5% 859 995 -13.7% 423 464 -8.8% 128 128 0.0%USD/Barrel 130.27 102.44 27.2% 132.12 102.83 28.5% 132.67 100.88 31.5% 129.83 131.84 -1.5% 125.45 129.24 -2.9%
June 2009 Page 76

bw166 Beer - Imports and Exports Report
4.2 Australia - Exports
Total Beer (000s)L12M YA % L9M YA % L6M YA % L3M YA % L1M YA %
Barrels 117 97 21.1% 97 77 26.1% 63 45 38.7% 29 18 60.5% 7 3 116.4%Value (USD) 13,087 10,196 28.4% 10,748 8,194 31.2% 7,075 4,954 42.8% 3,188 1,971 61.7% 767 345 122.4%USD/Barrel 111.78 105.44 6.0% 110.64 106.36 4.0% 112.26 109.05 2.9% 110.63 109.78 0.8% 114.17 111.09 2.8%Value (AUD) 18,206 11,389 59.9% 15,539 9,023 72.2% 10,069 5,382 87.1% 4,199 2,097 100.3% 956 362 163.7%AUD/Barrel 155.50 117.78 32.0% 159.96 117.12 36.6% 159.76 118.48 34.8% 145.75 116.78 24.8% 142.20 116.67 21.9%
June 2009 Page 77
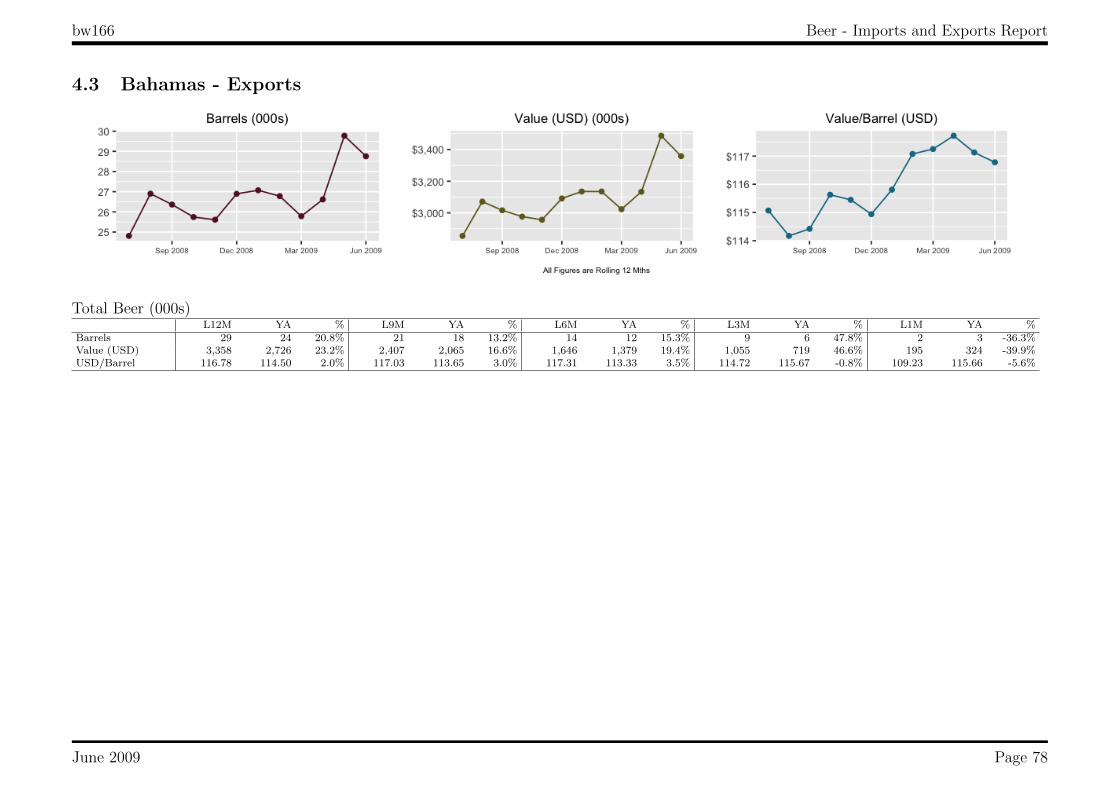
bw166 Beer - Imports and Exports Report
4.3 Bahamas - Exports
Total Beer (000s)L12M YA % L9M YA % L6M YA % L3M YA % L1M YA %
Barrels 29 24 20.8% 21 18 13.2% 14 12 15.3% 9 6 47.8% 2 3 -36.3%Value (USD) 3,358 2,726 23.2% 2,407 2,065 16.6% 1,646 1,379 19.4% 1,055 719 46.6% 195 324 -39.9%USD/Barrel 116.78 114.50 2.0% 117.03 113.65 3.0% 117.31 113.33 3.5% 114.72 115.67 -0.8% 109.23 115.66 -5.6%
June 2009 Page 78

bw166 Beer - Imports and Exports Report
4.4 Bahrain - Exports
Total Beer (000s)L12M YA % L9M YA % L6M YA % L3M YA % L1M YA %
Barrels 4 4 3.4% 3 3 6.4% 2 2 -0.1% 1 1 -45.4% 0 1 -49.1%Value (USD) 425 388 9.6% 335 305 9.7% 220 221 -0.4% 76 133 -42.9% 26 56 -52.9%USD/Barrel 115.60 108.98 6.1% 115.28 111.78 3.1% 113.77 114.16 -0.3% 114.76 109.79 4.5% 103.92 112.34 -7.5%
June 2009 Page 79

bw166 Beer - Imports and Exports Report
4.5 Belgium - Exports
Total Beer (000s)L12M YA % L9M YA % L6M YA % L3M YA % L1M YA %
Barrels 2 2 -16.0% 2 2 -21.8% 2 2 -21.8% 0 1 -68.7% 0 0 -100.0%Value (USD) 114 136 -15.7% 92 122 -24.4% 92 122 -24.4% 32 68 -52.1% 0 25 -100.0%USD/Barrel 61.73 61.55 0.3% 56.68 58.67 -3.4% 56.68 58.67 -3.4% 133.55 87.37 52.9% - 98.56 -Value (EUR) 84 90 -6.1% 69 80 -13.0% 69 80 -13.0% 24 43 -45.3% 0 16 -100.0%EUR/Barrel 45.37 40.58 11.8% 42.58 38.29 11.2% 42.58 38.29 11.2% 97.97 56.09 74.7% - 63.29 -
June 2009 Page 80

bw166 Beer - Imports and Exports Report
4.6 Belize - Exports
Total Beer (000s)L12M YA % L9M YA % L6M YA % L3M YA % L1M YA %
Barrels 2 2 -20.3% 1 2 -46.1% 1 1 -1.5% 0 0 33.5% 0 0 -Value (USD) 165 191 -13.7% 90 150 -40.3% 60 57 5.3% 40 29 37.9% 20 0 -USD/Barrel 95.95 88.65 8.2% 97.85 88.45 10.6% 98.69 92.35 6.9% 98.46 95.26 3.4% 100.71 - -
June 2009 Page 81

bw166 Beer - Imports and Exports Report
4.7 Bermuda - Exports
Total Beer (000s)L12M YA % L9M YA % L6M YA % L3M YA % L1M YA %
Barrels 22 6 256.7% 16 4 271.1% 7 3 105.4% 6 2 238.7% 1 1 134.9%Value (USD) 2,478 833 197.6% 1,771 587 201.5% 776 454 70.7% 640 240 166.3% 152 72 110.6%USD/Barrel 110.29 132.19 -16.6% 109.84 135.18 -18.7% 113.55 136.58 -16.9% 108.28 137.68 -21.4% 121.46 135.45 -10.3%
June 2009 Page 82
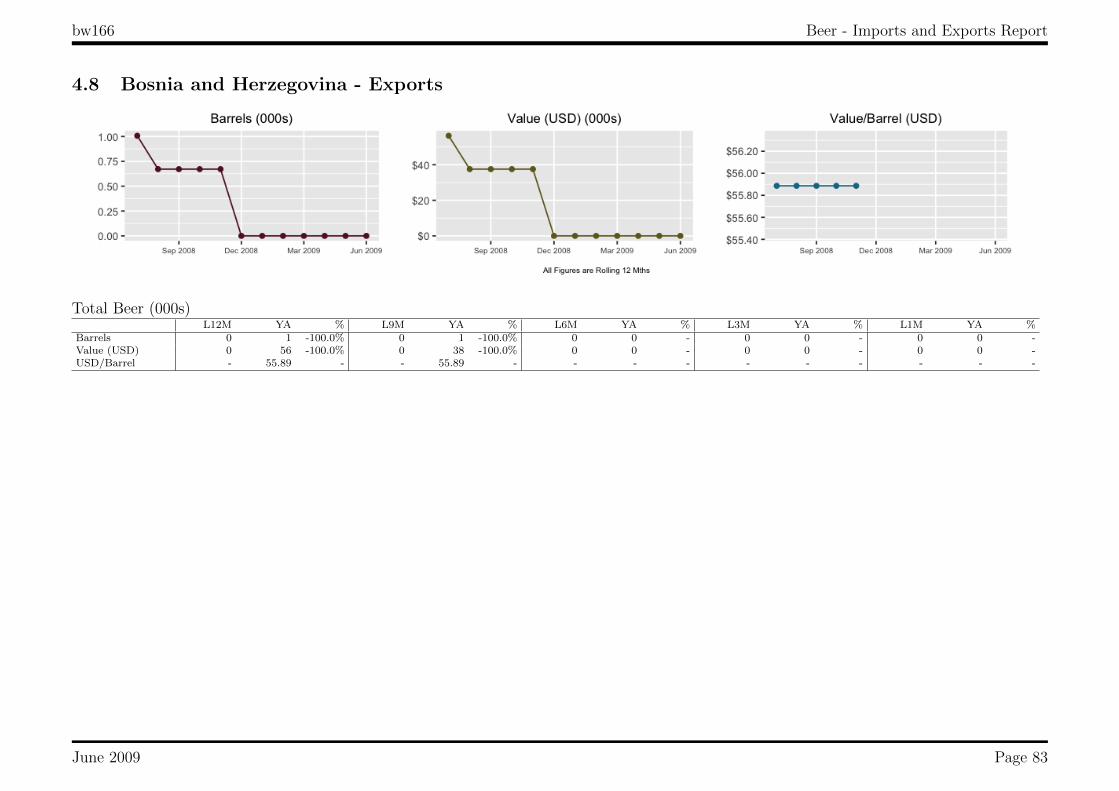
bw166 Beer - Imports and Exports Report
4.8 Bosnia and Herzegovina - Exports
Total Beer (000s)L12M YA % L9M YA % L6M YA % L3M YA % L1M YA %
Barrels 0 1 -100.0% 0 1 -100.0% 0 0 - 0 0 - 0 0 -Value (USD) 0 56 -100.0% 0 38 -100.0% 0 0 - 0 0 - 0 0 -USD/Barrel - 55.89 - - 55.89 - - - - - - - - - -
June 2009 Page 83

bw166 Beer - Imports and Exports Report
4.9 British Virgin Islands - Exports
Total Beer (000s)L12M YA % L9M YA % L6M YA % L3M YA % L1M YA %
Barrels 6 3 103.6% 5 2 123.8% 4 2 111.7% 2 1 123.4% 1 0 42.0%Value (USD) 524 343 52.9% 474 284 66.6% 326 225 44.9% 186 125 48.0% 44 47 -7.8%USD/Barrel 90.66 120.71 -24.9% 87.96 118.19 -25.6% 80.08 116.96 -31.5% 74.57 112.52 -33.7% 77.65 119.63 -35.1%
June 2009 Page 84
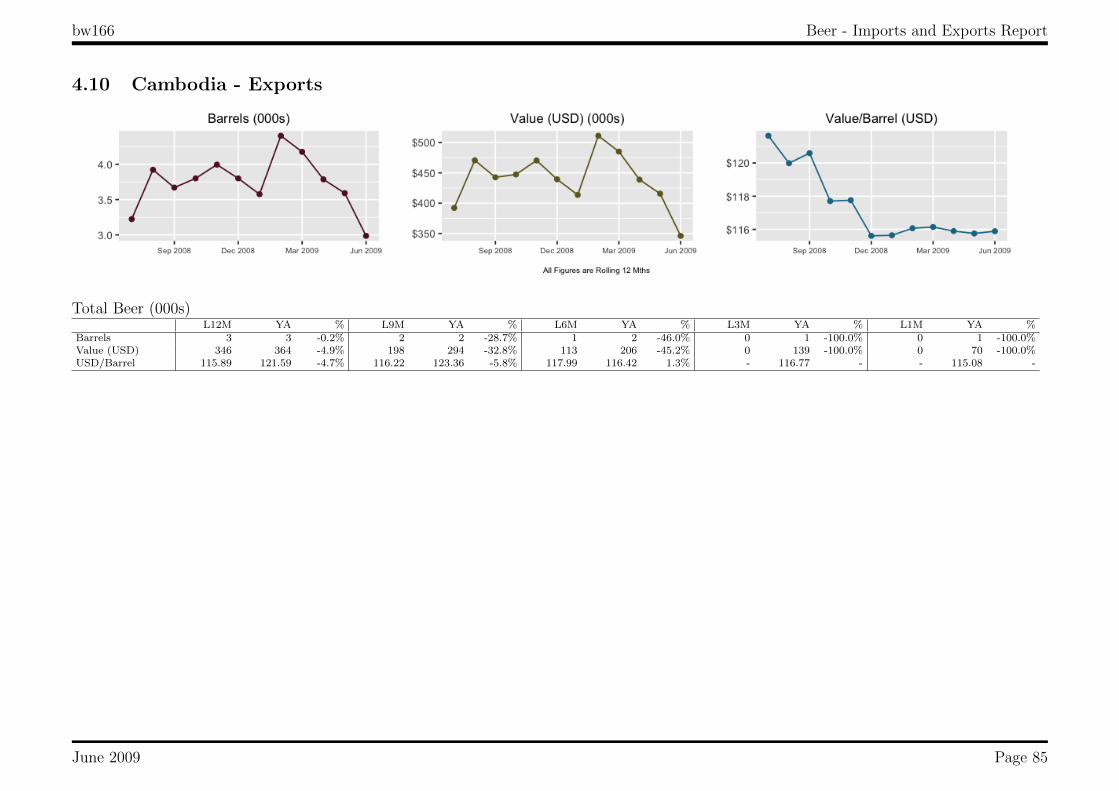
bw166 Beer - Imports and Exports Report
4.10 Cambodia - Exports
Total Beer (000s)L12M YA % L9M YA % L6M YA % L3M YA % L1M YA %
Barrels 3 3 -0.2% 2 2 -28.7% 1 2 -46.0% 0 1 -100.0% 0 1 -100.0%Value (USD) 346 364 -4.9% 198 294 -32.8% 113 206 -45.2% 0 139 -100.0% 0 70 -100.0%USD/Barrel 115.89 121.59 -4.7% 116.22 123.36 -5.8% 117.99 116.42 1.3% - 116.77 - - 115.08 -
June 2009 Page 85

bw166 Beer - Imports and Exports Report
4.11 Canada - Exports
Total Beer (000s)L12M YA % L9M YA % L6M YA % L3M YA % L1M YA %
Barrels 874 891 -1.9% 620 640 -3.1% 407 387 4.9% 218 207 5.5% 90 67 35.8%Value (USD) 94,931 94,056 0.9% 67,775 67,950 -0.3% 44,063 41,200 7.0% 22,854 22,249 2.7% 9,332 7,284 28.1%USD/Barrel 108.67 105.59 2.9% 109.25 106.14 2.9% 108.39 106.35 1.9% 104.72 107.59 -2.7% 103.32 109.53 -5.7%Value (CAD) 109,365 95,131 15.0% 81,276 67,820 19.8% 52,714 41,485 27.1% 26,498 22,443 18.1% 10,489 7,394 41.9%CAD/Barrel 125.19 106.80 17.2% 131.01 105.94 23.7% 129.67 107.08 21.1% 121.42 108.53 11.9% 116.13 111.19 4.5%
June 2009 Page 86

bw166 Beer - Imports and Exports Report
4.12 Cayman Islands - Exports
Total Beer (000s)L12M YA % L9M YA % L6M YA % L3M YA % L1M YA %
Barrels 13 15 -18.1% 12 11 0.6% 7 7 -0.2% 3 3 15.5% 1 1 -36.9%Value (USD) 1,552 1,858 -16.5% 1,430 1,394 2.5% 880 833 5.6% 437 337 29.9% 90 125 -28.6%USD/Barrel 123.32 120.90 2.0% 123.74 121.43 1.9% 128.89 121.81 5.8% 135.49 120.48 12.5% 147.89 130.69 13.2%
June 2009 Page 87
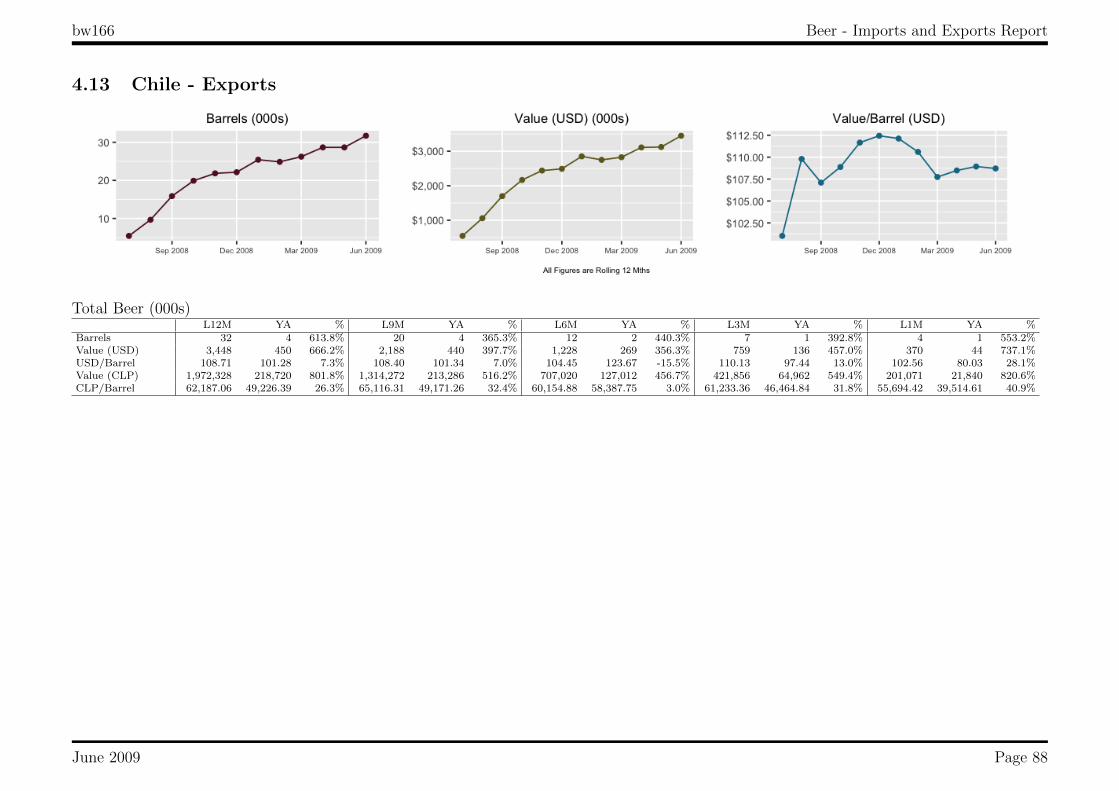
bw166 Beer - Imports and Exports Report
4.13 Chile - Exports
Total Beer (000s)L12M YA % L9M YA % L6M YA % L3M YA % L1M YA %
Barrels 32 4 613.8% 20 4 365.3% 12 2 440.3% 7 1 392.8% 4 1 553.2%Value (USD) 3,448 450 666.2% 2,188 440 397.7% 1,228 269 356.3% 759 136 457.0% 370 44 737.1%USD/Barrel 108.71 101.28 7.3% 108.40 101.34 7.0% 104.45 123.67 -15.5% 110.13 97.44 13.0% 102.56 80.03 28.1%Value (CLP) 1,972,328 218,720 801.8% 1,314,272 213,286 516.2% 707,020 127,012 456.7% 421,856 64,962 549.4% 201,071 21,840 820.6%CLP/Barrel 62,187.06 49,226.39 26.3% 65,116.31 49,171.26 32.4% 60,154.88 58,387.75 3.0% 61,233.36 46,464.84 31.8% 55,694.42 39,514.61 40.9%
June 2009 Page 88
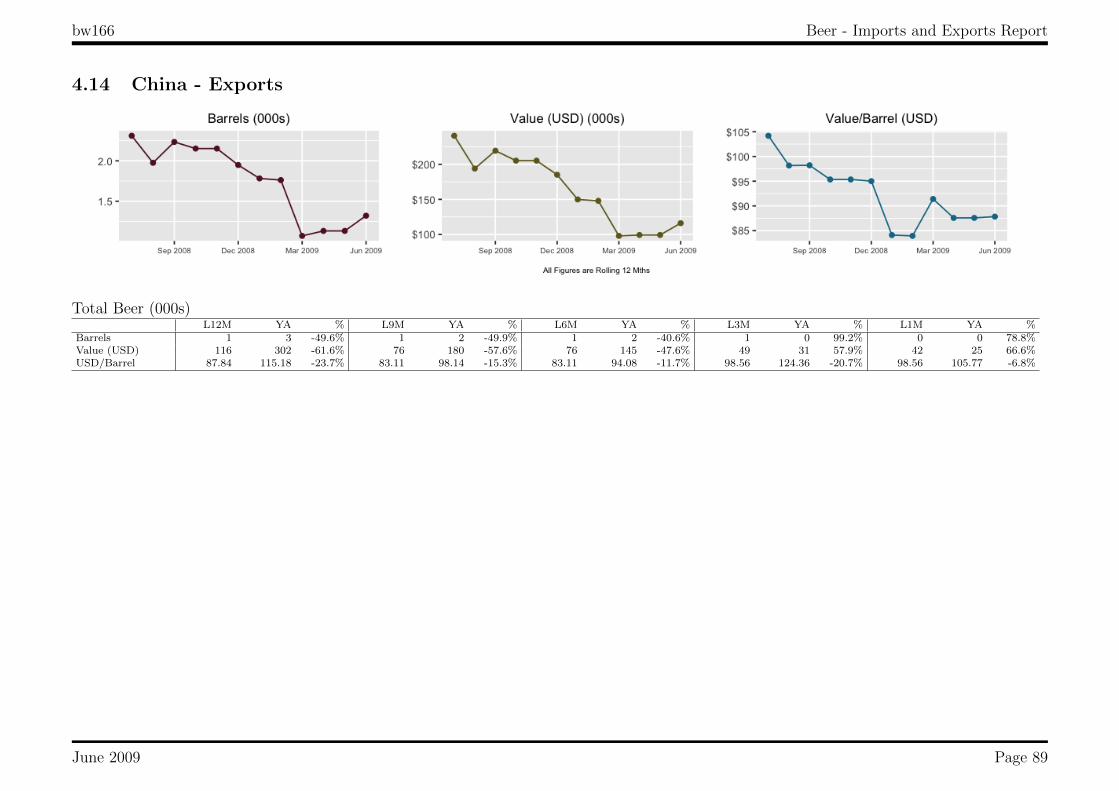
bw166 Beer - Imports and Exports Report
4.14 China - Exports
Total Beer (000s)L12M YA % L9M YA % L6M YA % L3M YA % L1M YA %
Barrels 1 3 -49.6% 1 2 -49.9% 1 2 -40.6% 1 0 99.2% 0 0 78.8%Value (USD) 116 302 -61.6% 76 180 -57.6% 76 145 -47.6% 49 31 57.9% 42 25 66.6%USD/Barrel 87.84 115.18 -23.7% 83.11 98.14 -15.3% 83.11 94.08 -11.7% 98.56 124.36 -20.7% 98.56 105.77 -6.8%
June 2009 Page 89

bw166 Beer - Imports and Exports Report
4.15 Colombia - Exports
Total Beer (000s)L12M YA % L9M YA % L6M YA % L3M YA % L1M YA %
Barrels 11 16 -29.9% 10 12 -12.1% 6 7 -5.9% 2 2 18.4% 0 1 -56.1%Value (USD) 1,140 1,225 -6.9% 1,044 878 18.9% 640 467 36.9% 181 111 62.2% 25 49 -47.9%USD/Barrel 100.60 75.73 32.8% 101.27 74.88 35.2% 101.48 69.73 45.5% 96.78 70.65 37.0% 92.09 77.58 18.7%
June 2009 Page 90

bw166 Beer - Imports and Exports Report
4.16 Costa Rica - Exports
Total Beer (000s)L12M YA % L9M YA % L6M YA % L3M YA % L1M YA %
Barrels 2 2 47.5% 2 2 31.5% 1 1 23.7% 0 1 -24.7% 0 0 31.0%Value (USD) 249 142 74.9% 215 135 59.2% 153 102 50.3% 50 55 -10.0% 25 17 47.9%USD/Barrel 104.40 88.04 18.6% 105.27 86.97 21.0% 107.77 88.69 21.5% 117.05 98.02 19.4% 91.50 81.05 12.9%
June 2009 Page 91

bw166 Beer - Imports and Exports Report
4.17 Cyprus - Exports
Total Beer (000s)L12M YA % L9M YA % L6M YA % L3M YA % L1M YA %
Barrels 1 1 25.3% 0 0 4.7% 0 0 6.2% 0 0 59.3% 0 0 -100.0%Value (USD) 78 44 76.5% 60 36 65.4% 51 28 84.1% 51 18 177.2% 0 9 -100.0%USD/Barrel 121.48 86.25 40.8% 137.50 86.99 58.1% 153.05 88.29 73.3% 153.05 87.95 74.0% - 87.95 -Value (EUR) 57 30 89.7% 45 24 88.0% 38 18 111.5% 38 12 225.5% 0 6 -100.0%EUR/Barrel 88.27 58.33 51.3% 103.81 57.79 79.6% 114.68 57.59 99.1% 114.68 56.13 104.3% - 56.47 -
June 2009 Page 92
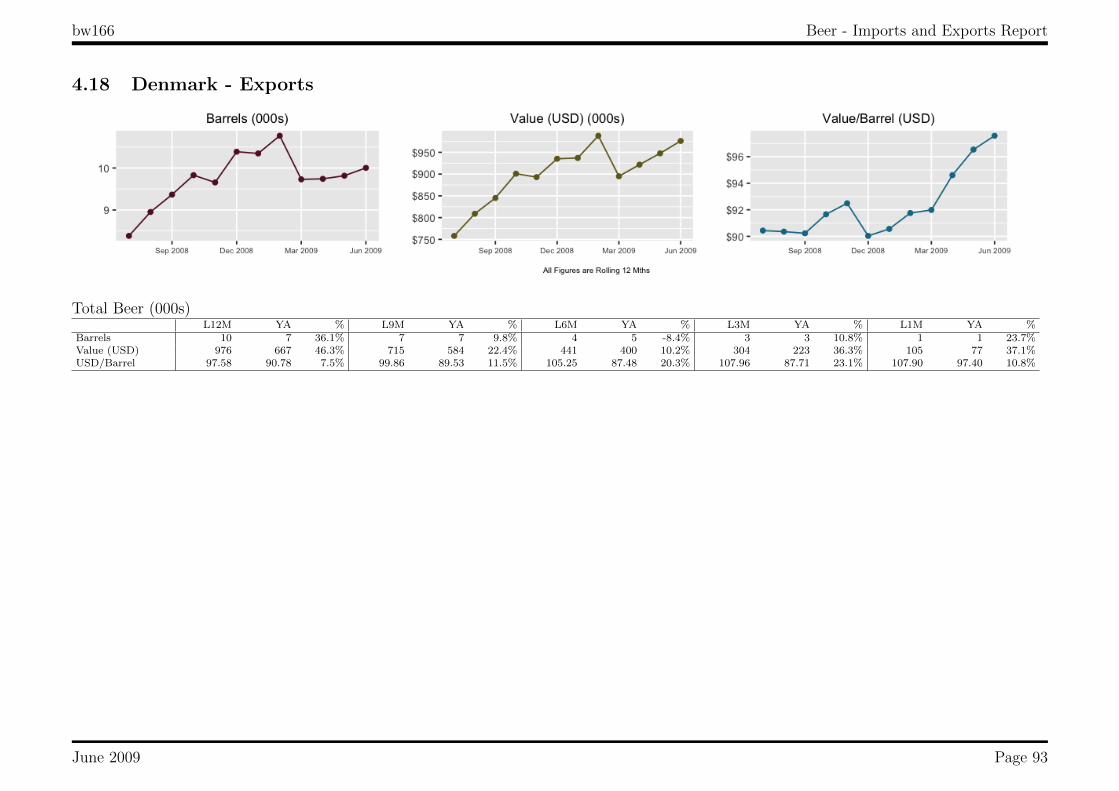
bw166 Beer - Imports and Exports Report
4.18 Denmark - Exports
Total Beer (000s)L12M YA % L9M YA % L6M YA % L3M YA % L1M YA %
Barrels 10 7 36.1% 7 7 9.8% 4 5 -8.4% 3 3 10.8% 1 1 23.7%Value (USD) 976 667 46.3% 715 584 22.4% 441 400 10.2% 304 223 36.3% 105 77 37.1%USD/Barrel 97.58 90.78 7.5% 99.86 89.53 11.5% 105.25 87.48 20.3% 107.96 87.71 23.1% 107.90 97.40 10.8%
June 2009 Page 93

bw166 Beer - Imports and Exports Report
4.19 Dominican Republic - Exports
Total Beer (000s)L12M YA % L9M YA % L6M YA % L3M YA % L1M YA %
Barrels 9 15 -35.3% 7 11 -36.5% 5 7 -30.0% 2 3 -37.8% 1 1 -28.8%Value (USD) 1,195 1,596 -25.1% 912 1,204 -24.3% 603 694 -13.1% 236 287 -17.9% 89 109 -18.7%USD/Barrel 126.45 109.16 15.8% 128.21 107.43 19.3% 129.29 104.11 24.2% 130.24 98.76 31.9% 130.89 114.73 14.1%
June 2009 Page 94

bw166 Beer - Imports and Exports Report
4.20 Ecuador - Exports
Total Beer (000s)L12M YA % L9M YA % L6M YA % L3M YA % L1M YA %
Barrels 7 6 7.9% 4 5 -13.8% 2 3 -22.4% 1 2 -54.2% 0 0 -100.0%Value (USD) 704 666 5.7% 393 487 -19.3% 215 311 -30.7% 70 197 -64.7% 0 14 -100.0%USD/Barrel 104.11 106.23 -2.0% 99.04 105.76 -6.4% 94.08 105.27 -10.6% 79.80 103.46 -22.9% - 82.67 -
June 2009 Page 95

bw166 Beer - Imports and Exports Report
4.21 El Salvador - Exports
Total Beer (000s)L12M YA % L9M YA % L6M YA % L3M YA % L1M YA %
Barrels 1 0 - 1 0 - 0 0 - 0 0 - 0 0 -Value (USD) 79 0 - 67 0 - 26 0 - 17 0 - 17 0 -USD/Barrel 110.47 - - 105.23 - - 117.96 - - 98.56 - - 98.56 - -
June 2009 Page 96

bw166 Beer - Imports and Exports Report
4.22 Fiji - Exports
Total Beer (000s)L12M YA % L9M YA % L6M YA % L3M YA % L1M YA %
Barrels 1 0 >999% 0 0 763.1% 0 0 238.1% 0 0 238.1% 0 0 238.1%Value (USD) 147 21 598.3% 51 12 319.8% 4 3 16.9% 4 3 16.9% 4 3 16.9%USD/Barrel 102.99 210.99 -51.2% 106.79 219.55 -51.4% 112.45 325.17 -65.4% 112.45 325.17 -65.4% 112.45 325.17 -65.4%
June 2009 Page 97

bw166 Beer - Imports and Exports Report
4.23 Finland - Exports
Total Beer (000s)L12M YA % L9M YA % L6M YA % L3M YA % L1M YA %
Barrels 4 4 15.8% 4 3 37.7% 2 2 28.5% 1 1 -1.1% 0 1 -39.0%Value (USD) 424 297 42.8% 397 228 74.2% 248 159 55.9% 84 72 17.7% 26 46 -42.6%USD/Barrel 95.52 77.46 23.3% 96.96 76.67 26.5% 99.32 81.84 21.4% 98.64 82.92 19.0% 81.95 87.19 -6.0%Value (EUR) 320 202 58.4% 303 152 98.7% 188 105 79.4% 62 46 35.1% 19 29 -36.3%EUR/Barrel 72.19 52.78 36.8% 73.85 51.19 44.3% 75.51 54.07 39.7% 72.36 53.01 36.5% 58.47 55.99 4.4%
June 2009 Page 98

bw166 Beer - Imports and Exports Report
4.24 French Polynesia - Exports
Total Beer (000s)L12M YA % L9M YA % L6M YA % L3M YA % L1M YA %
Barrels 3 4 -8.6% 3 3 -0.1% 2 2 -26.2% 1 1 -61.4% 0 0 2.7%Value (USD) 338 365 -7.6% 288 284 1.5% 180 240 -24.8% 56 141 -60.2% 39 37 5.1%USD/Barrel 99.54 98.49 1.1% 100.62 99.12 1.5% 101.38 99.50 1.9% 102.71 99.67 3.0% 101.41 99.11 2.3%
June 2009 Page 99

bw166 Beer - Imports and Exports Report
4.25 Germany - Exports
Total Beer (000s)L12M YA % L9M YA % L6M YA % L3M YA % L1M YA %
Barrels 2 5 -50.9% 2 2 -12.5% 2 2 -0.9% 1 1 67.6% 0 1 -20.1%Value (USD) 265 480 -44.7% 215 194 10.8% 182 155 17.6% 150 86 73.3% 46 57 -19.3%USD/Barrel 111.96 99.45 12.6% 115.24 91.04 26.6% 112.86 95.06 18.7% 111.15 107.51 3.4% 113.84 112.61 1.1%Value (EUR) 194 338 -42.6% 160 129 24.4% 135 102 33.3% 110 55 99.6% 33 37 -10.3%EUR/Barrel 81.79 69.97 16.9% 85.86 60.40 42.1% 83.78 62.26 34.6% 82.05 68.91 19.1% 81.22 72.31 12.3%
June 2009 Page 100
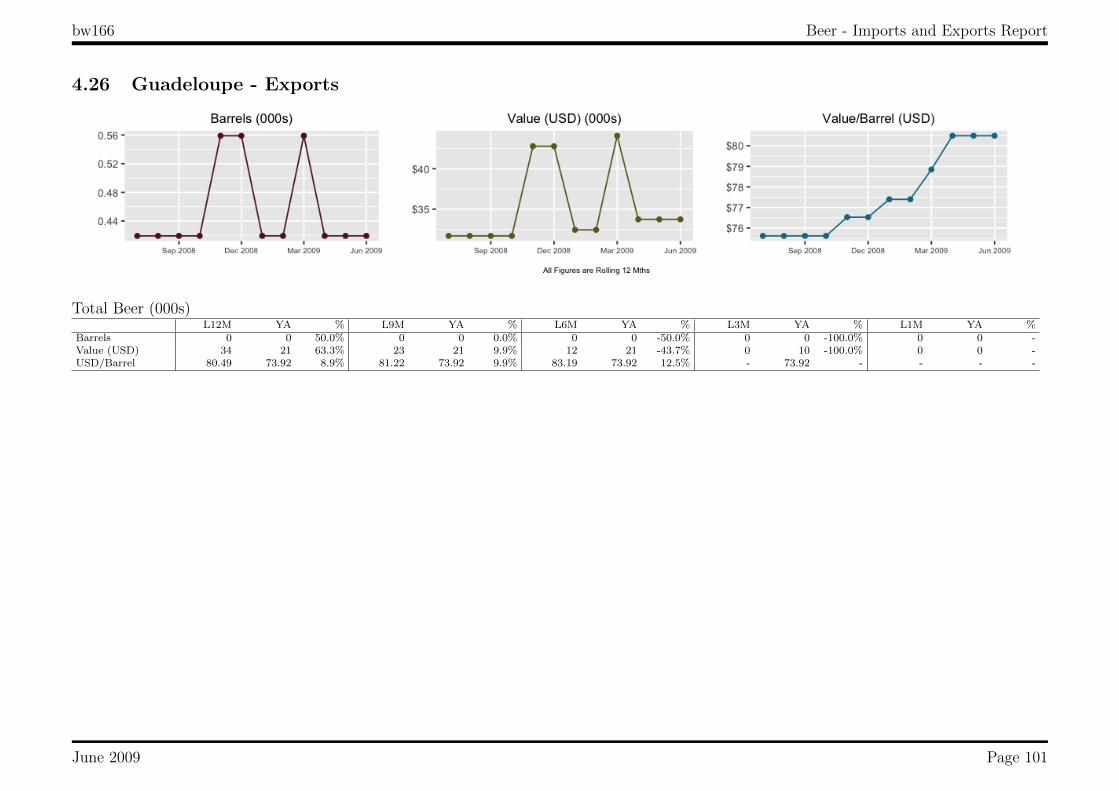
bw166 Beer - Imports and Exports Report
4.26 Guadeloupe - Exports
Total Beer (000s)L12M YA % L9M YA % L6M YA % L3M YA % L1M YA %
Barrels 0 0 50.0% 0 0 0.0% 0 0 -50.0% 0 0 -100.0% 0 0 -Value (USD) 34 21 63.3% 23 21 9.9% 12 21 -43.7% 0 10 -100.0% 0 0 -USD/Barrel 80.49 73.92 8.9% 81.22 73.92 9.9% 83.19 73.92 12.5% - 73.92 - - - -
June 2009 Page 101
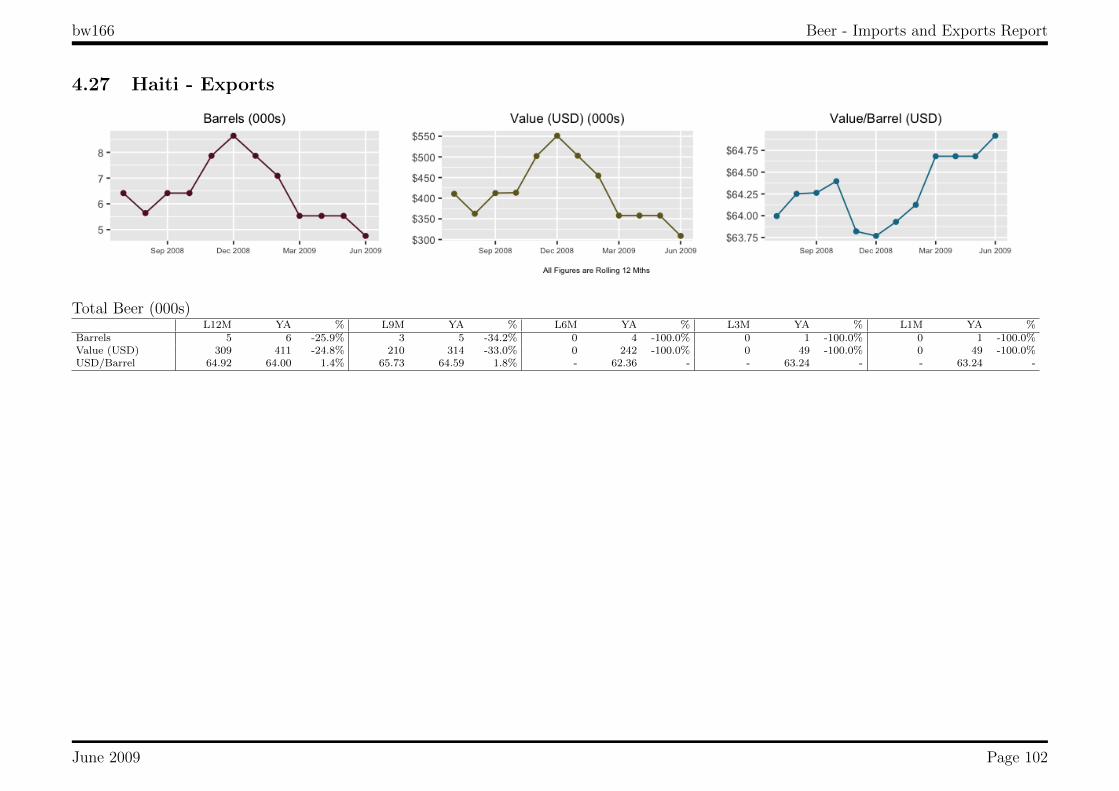
bw166 Beer - Imports and Exports Report
4.27 Haiti - Exports
Total Beer (000s)L12M YA % L9M YA % L6M YA % L3M YA % L1M YA %
Barrels 5 6 -25.9% 3 5 -34.2% 0 4 -100.0% 0 1 -100.0% 0 1 -100.0%Value (USD) 309 411 -24.8% 210 314 -33.0% 0 242 -100.0% 0 49 -100.0% 0 49 -100.0%USD/Barrel 64.92 64.00 1.4% 65.73 64.59 1.8% - 62.36 - - 63.24 - - 63.24 -
June 2009 Page 102

bw166 Beer - Imports and Exports Report
4.28 Honduras - Exports
Total Beer (000s)L12M YA % L9M YA % L6M YA % L3M YA % L1M YA %
Barrels 25 18 37.3% 20 15 32.7% 15 9 58.5% 5 6 -10.0% 2 2 24.6%Value (USD) 2,087 1,779 17.3% 1,675 1,449 15.6% 1,220 835 46.1% 473 512 -7.8% 224 149 50.7%USD/Barrel 84.40 98.78 -14.6% 84.49 97.05 -12.9% 84.10 91.26 -7.8% 87.42 85.33 2.4% 93.26 77.07 21.0%
June 2009 Page 103

bw166 Beer - Imports and Exports Report
4.29 Hong Kong - Exports
Total Beer (000s)L12M YA % L9M YA % L6M YA % L3M YA % L1M YA %
Barrels 39 38 4.3% 28 32 -14.2% 16 20 -19.5% 11 11 1.9% 2 4 -52.8%Value (USD) 2,717 2,470 10.0% 1,938 2,126 -8.8% 1,129 1,302 -13.3% 758 718 5.5% 147 286 -48.7%USD/Barrel 69.35 65.73 5.5% 69.79 65.69 6.2% 71.55 66.43 7.7% 70.48 68.08 3.5% 75.11 69.16 8.6%Value (HKD) 21,102 19,243 9.7% 15,026 16,557 -9.2% 8,752 10,151 -13.8% 5,872 5,602 4.8% 1,138 2,234 -49.1%HKD/Barrel 538.53 512.09 5.2% 541.04 511.63 5.7% 554.59 517.95 7.1% 546.23 531.01 2.9% 582.09 539.90 7.8%
June 2009 Page 104
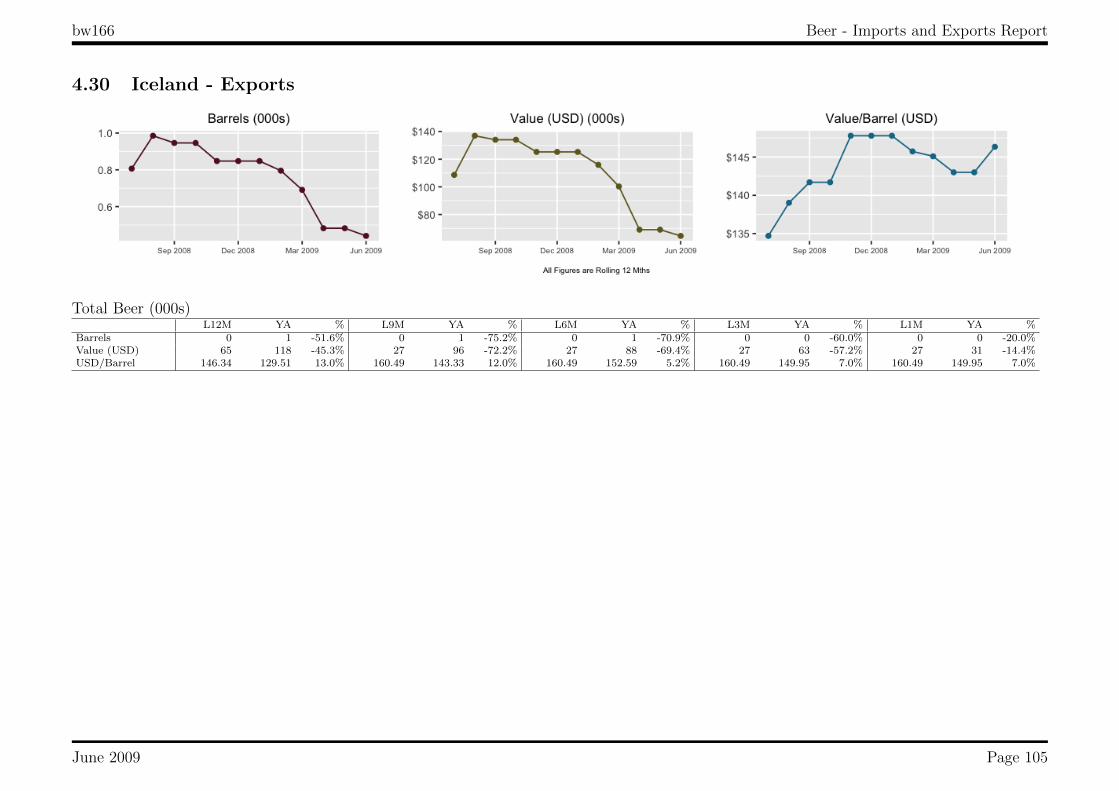
bw166 Beer - Imports and Exports Report
4.30 Iceland - Exports
Total Beer (000s)L12M YA % L9M YA % L6M YA % L3M YA % L1M YA %
Barrels 0 1 -51.6% 0 1 -75.2% 0 1 -70.9% 0 0 -60.0% 0 0 -20.0%Value (USD) 65 118 -45.3% 27 96 -72.2% 27 88 -69.4% 27 63 -57.2% 27 31 -14.4%USD/Barrel 146.34 129.51 13.0% 160.49 143.33 12.0% 160.49 152.59 5.2% 160.49 149.95 7.0% 160.49 149.95 7.0%
June 2009 Page 105

bw166 Beer - Imports and Exports Report
4.31 Ireland - Exports
Total Beer (000s)L12M YA % L9M YA % L6M YA % L3M YA % L1M YA %
Barrels 12 3 380.0% 11 2 414.7% 11 2 485.4% 1 1 23.5% 1 0 241.8%Value (USD) 1,178 178 560.2% 1,086 153 610.8% 1,035 128 711.9% 122 84 45.7% 88 17 409.2%USD/Barrel 95.76 69.63 37.5% 96.54 69.92 38.1% 97.17 70.07 38.7% 86.50 73.30 18.0% 98.56 66.17 49.0%Value (EUR) 895 119 653.5% 835 100 734.0% 797 83 861.9% 88 54 63.9% 63 11 465.7%EUR/Barrel 72.71 46.32 57.0% 74.21 45.80 62.0% 74.77 45.51 64.3% 62.35 46.96 32.8% 70.32 42.49 65.5%
June 2009 Page 106

bw166 Beer - Imports and Exports Report
4.32 Israel - Exports
Total Beer (000s)L12M YA % L9M YA % L6M YA % L3M YA % L1M YA %
Barrels 1 0 77.9% 0 0 55.4% 0 0 41.2% 0 0 134.8% 0 0 263.8%Value (USD) 49 45 9.3% 43 45 -4.8% 37 28 32.5% 25 15 61.0% 14 8 79.0%USD/Barrel 97.21 158.23 -38.6% 97.01 158.23 -38.7% 102.88 109.65 -6.2% 98.56 143.76 -31.4% 98.56 200.27 -50.8%
June 2009 Page 107

bw166 Beer - Imports and Exports Report
4.33 Italy - Exports
Total Beer (000s)L12M YA % L9M YA % L6M YA % L3M YA % L1M YA %
Barrels 1 1 -23.3% 1 1 -22.1% 1 1 -16.7% 1 1 4.2% 0 0 258.9%Value (USD) 123 161 -23.5% 109 147 -25.9% 100 130 -22.8% 73 75 -2.6% 50 17 192.1%USD/Barrel 144.53 144.87 -0.2% 136.88 143.94 -4.9% 141.67 152.99 -7.4% 136.50 146.07 -6.6% 135.22 166.16 -18.6%Value (EUR) 90 106 -15.1% 81 96 -16.1% 74 84 -11.8% 53 48 11.1% 35 11 224.5%EUR/Barrel 105.61 95.38 10.7% 101.13 93.83 7.8% 104.60 98.81 5.9% 99.32 93.22 6.6% 96.48 106.70 -9.6%
June 2009 Page 108

bw166 Beer - Imports and Exports Report
4.34 Jamaica - Exports
Total Beer (000s)L12M YA % L9M YA % L6M YA % L3M YA % L1M YA %
Barrels 1 0 134.6% 1 0 201.9% 1 0 151.9% 1 0 - 0 0 -Value (USD) 57 25 128.3% 47 17 184.0% 37 17 123.5% 37 0 - 24 0 -USD/Barrel 51.62 53.05 -2.7% 49.91 53.05 -5.9% 47.06 53.05 -11.3% 47.06 - - 48.74 - -Value (JMD) 4,571 1,728 164.6% 3,898 1,158 236.6% 3,195 1,158 175.9% 3,195 0 - 2,086 0 -JMD/Barrel 4,150.70 3,680.12 12.8% 4,125.71 3,700.32 11.5% 4,052.78 3,700.32 9.5% 4,052.78 - - 4,194.29 - -
June 2009 Page 109

bw166 Beer - Imports and Exports Report
4.35 Japan - Exports
Total Beer (000s)L12M YA % L9M YA % L6M YA % L3M YA % L1M YA %
Barrels 14 16 -11.9% 12 12 -5.1% 8 9 -7.7% 5 5 -2.2% 3 2 71.1%Value (USD) 1,461 1,659 -12.0% 1,191 1,292 -7.8% 829 882 -6.0% 497 478 4.1% 311 178 74.5%USD/Barrel 101.69 101.74 -0.1% 101.54 104.51 -2.8% 100.91 99.12 1.8% 100.05 94.03 6.4% 103.41 101.42 2.0%Value (JPY) 144,042 182,160 -20.9% 115,122 138,748 -17.0% 79,860 92,263 -13.4% 48,337 49,966 -3.3% 30,034 19,003 58.0%JPY/Barrel 10,028.26 11,169.11 -10.2% 9,814.61 11,221.78 -12.5% 9,725.89 10,369.80 -6.2% 9,726.04 9,835.21 -1.1% 9,999.24 10,825.08 -7.6%
June 2009 Page 110

bw166 Beer - Imports and Exports Report
4.36 Korea, South - Exports
Total Beer (000s)L12M YA % L9M YA % L6M YA % L3M YA % L1M YA %
Barrels 103 111 -7.3% 75 80 -7.0% 44 56 -21.6% 30 31 -3.9% 16 16 -1.8%Value (USD) 8,069 8,898 -9.3% 5,921 6,457 -8.3% 3,527 4,562 -22.7% 2,427 2,590 -6.3% 1,308 1,378 -5.1%USD/Barrel 78.49 80.22 -2.2% 79.21 80.31 -1.4% 80.39 81.52 -1.4% 81.93 84.02 -2.5% 81.85 84.67 -3.3%
June 2009 Page 111

bw166 Beer - Imports and Exports Report
4.37 Malaysia - Exports
Total Beer (000s)L12M YA % L9M YA % L6M YA % L3M YA % L1M YA %
Barrels 4 2 84.9% 2 2 17.8% 1 1 11.0% 1 1 -15.3% 0 1 -54.0%Value (USD) 414 210 97.2% 187 165 13.2% 124 122 1.7% 56 78 -28.2% 24 66 -63.8%USD/Barrel 112.28 105.29 6.6% 101.35 105.50 -3.9% 101.11 110.30 -8.3% 101.43 119.59 -15.2% 98.51 125.22 -21.3%
June 2009 Page 112

bw166 Beer - Imports and Exports Report
4.38 Malta - Exports
Total Beer (000s)L12M YA % L9M YA % L6M YA % L3M YA % L1M YA %
Barrels 1 0 116.1% 1 0 176.5% 1 0 477.0% 0 0 361.6% 0 0 130.8%Value (USD) 60 28 115.5% 50 18 171.7% 50 9 453.9% 40 9 343.1% 20 9 121.6%USD/Barrel 90.95 91.21 -0.3% 90.27 91.89 -1.8% 90.27 94.03 -4.0% 90.27 94.03 -4.0% 90.27 94.03 -4.0%Value (EUR) 44 19 128.8% 37 12 200.4% 37 6 542.0% 29 6 407.4% 14 6 146.2%EUR/Barrel 66.54 62.84 5.9% 67.19 61.84 8.6% 67.19 60.38 11.3% 66.38 60.38 9.9% 64.41 60.38 6.7%
June 2009 Page 113
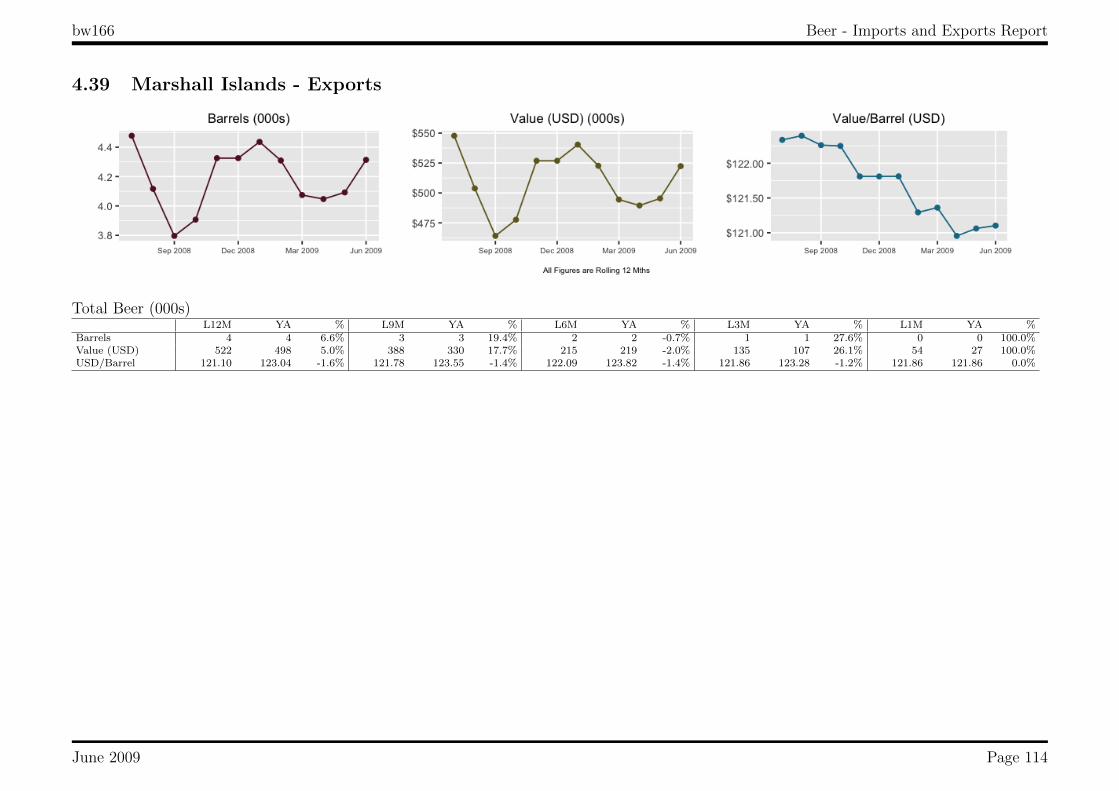
bw166 Beer - Imports and Exports Report
4.39 Marshall Islands - Exports
Total Beer (000s)L12M YA % L9M YA % L6M YA % L3M YA % L1M YA %
Barrels 4 4 6.6% 3 3 19.4% 2 2 -0.7% 1 1 27.6% 0 0 100.0%Value (USD) 522 498 5.0% 388 330 17.7% 215 219 -2.0% 135 107 26.1% 54 27 100.0%USD/Barrel 121.10 123.04 -1.6% 121.78 123.55 -1.4% 122.09 123.82 -1.4% 121.86 123.28 -1.2% 121.86 121.86 0.0%
June 2009 Page 114
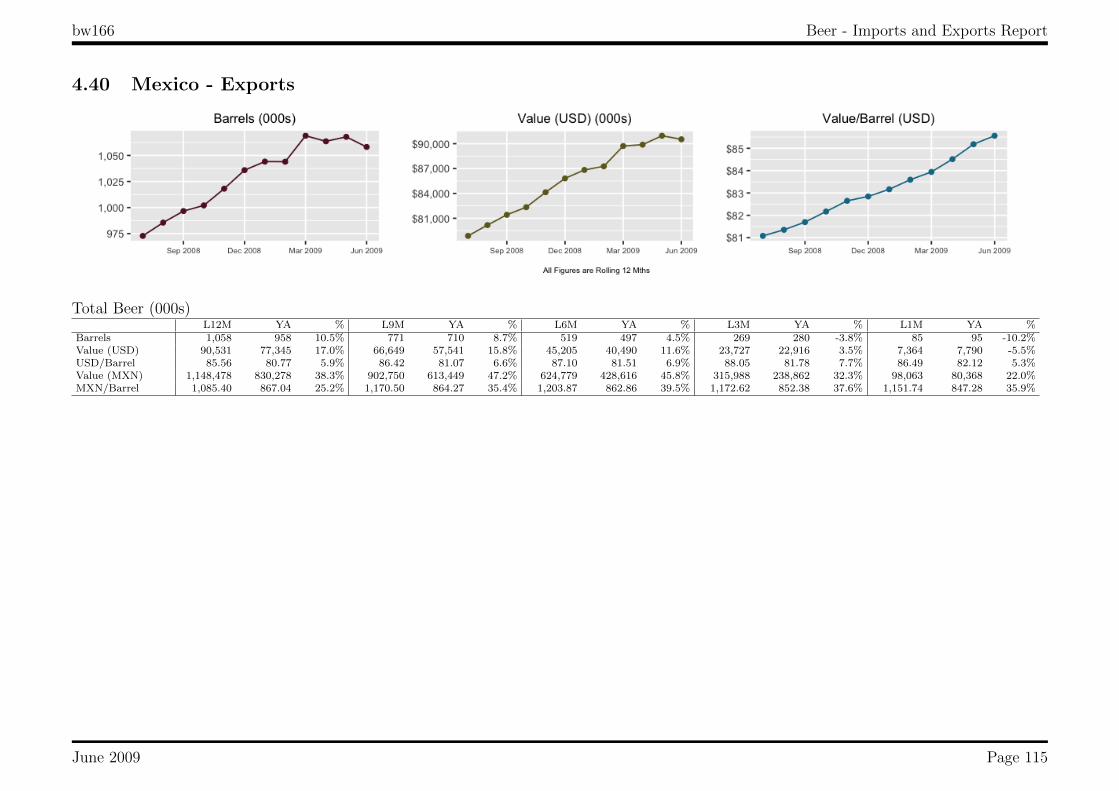
bw166 Beer - Imports and Exports Report
4.40 Mexico - Exports
Total Beer (000s)L12M YA % L9M YA % L6M YA % L3M YA % L1M YA %
Barrels 1,058 958 10.5% 771 710 8.7% 519 497 4.5% 269 280 -3.8% 85 95 -10.2%Value (USD) 90,531 77,345 17.0% 66,649 57,541 15.8% 45,205 40,490 11.6% 23,727 22,916 3.5% 7,364 7,790 -5.5%USD/Barrel 85.56 80.77 5.9% 86.42 81.07 6.6% 87.10 81.51 6.9% 88.05 81.78 7.7% 86.49 82.12 5.3%Value (MXN) 1,148,478 830,278 38.3% 902,750 613,449 47.2% 624,779 428,616 45.8% 315,988 238,862 32.3% 98,063 80,368 22.0%MXN/Barrel 1,085.40 867.04 25.2% 1,170.50 864.27 35.4% 1,203.87 862.86 39.5% 1,172.62 852.38 37.6% 1,151.74 847.28 35.9%
June 2009 Page 115

bw166 Beer - Imports and Exports Report
4.41 Micronesia - Exports
Total Beer (000s)L12M YA % L9M YA % L6M YA % L3M YA % L1M YA %
Barrels 7 8 -12.1% 4 6 -30.5% 3 3 -16.1% 2 2 2.2% 0 0 -25.0%Value (USD) 826 935 -11.7% 513 728 -29.6% 334 384 -13.0% 226 221 2.3% 40 54 -25.0%USD/Barrel 117.14 116.53 0.5% 118.22 116.73 1.3% 118.78 114.59 3.6% 117.36 117.17 0.2% 121.86 121.86 0.0%
June 2009 Page 116

bw166 Beer - Imports and Exports Report
4.42 Netherlands - Exports
Total Beer (000s)L12M YA % L9M YA % L6M YA % L3M YA % L1M YA %
Barrels 5 5 0.7% 4 4 11.1% 2 2 43.2% 1 1 39.9% 1 0 44.9%Value (USD) 464 502 -7.6% 400 392 2.2% 233 173 34.6% 103 80 30.0% 58 47 22.2%USD/Barrel 94.57 103.15 -8.3% 94.39 102.67 -8.1% 99.78 106.13 -6.0% 101.35 109.04 -7.1% 96.32 114.21 -15.7%Value (EUR) 345 347 -0.5% 303 266 13.7% 174 114 53.3% 76 51 48.5% 41 30 35.8%EUR/Barrel 70.32 71.20 -1.2% 71.33 69.71 2.3% 74.69 69.75 7.1% 74.27 69.95 6.2% 68.72 73.34 -6.3%
June 2009 Page 117
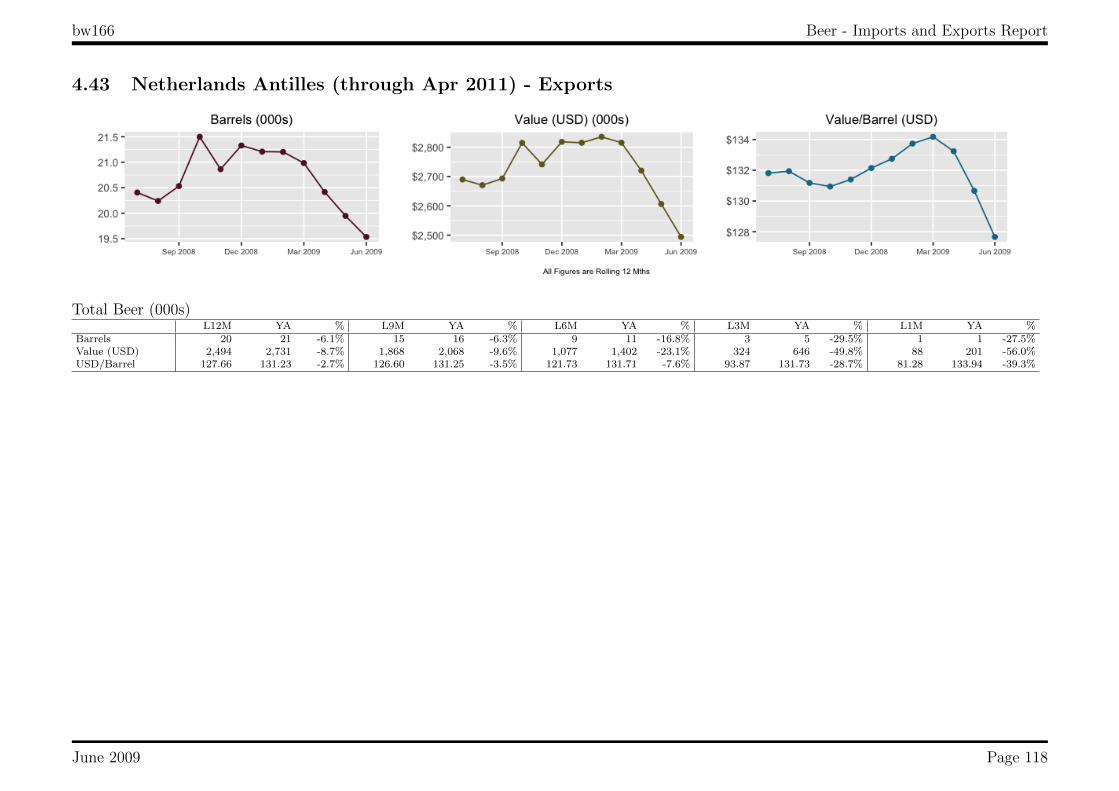
bw166 Beer - Imports and Exports Report
4.43 Netherlands Antilles (through Apr 2011) - Exports
Total Beer (000s)L12M YA % L9M YA % L6M YA % L3M YA % L1M YA %
Barrels 20 21 -6.1% 15 16 -6.3% 9 11 -16.8% 3 5 -29.5% 1 1 -27.5%Value (USD) 2,494 2,731 -8.7% 1,868 2,068 -9.6% 1,077 1,402 -23.1% 324 646 -49.8% 88 201 -56.0%USD/Barrel 127.66 131.23 -2.7% 126.60 131.25 -3.5% 121.73 131.71 -7.6% 93.87 131.73 -28.7% 81.28 133.94 -39.3%
June 2009 Page 118

bw166 Beer - Imports and Exports Report
4.44 New Zealand - Exports
Total Beer (000s)L12M YA % L9M YA % L6M YA % L3M YA % L1M YA %
Barrels 3 1 196.1% 2 1 325.3% 1 0 327.3% 1 0 370.3% 0 0 306.6%Value (USD) 366 66 451.2% 306 48 537.5% 183 30 506.3% 151 18 739.7% 44 9 364.6%USD/Barrel 133.50 71.72 86.1% 131.16 87.51 49.9% 136.52 96.22 41.9% 136.61 76.51 78.6% 136.15 119.15 14.3%Value (NZD) 611 86 606.3% 521 62 740.9% 311 39 704.4% 249 23 966.9% 69 12 455.3%NZD/Barrel 222.63 93.32 138.6% 223.68 113.15 97.7% 232.24 123.37 88.2% 225.50 99.39 126.9% 213.33 156.20 36.6%
June 2009 Page 119

bw166 Beer - Imports and Exports Report
4.45 Nigeria - Exports
Total Beer (000s)L12M YA % L9M YA % L6M YA % L3M YA % L1M YA %
Barrels 0 1 -94.3% 0 0 -100.0% 0 0 -100.0% 0 0 - 0 0 -Value (USD) 4 83 -95.5% 0 51 -100.0% 0 41 -100.0% 0 0 - 0 0 -USD/Barrel 98.57 125.37 -21.4% - 106.67 - - 109.02 - - - - - - -
June 2009 Page 120

bw166 Beer - Imports and Exports Report
4.46 Norway - Exports
Total Beer (000s)L12M YA % L9M YA % L6M YA % L3M YA % L1M YA %
Barrels 4 0 766.6% 3 0 601.4% 2 0 341.2% 1 0 107.1% 0 0 -65.2%Value (USD) 423 44 862.2% 350 44 697.6% 226 44 414.7% 98 44 123.2% 14 44 -67.2%USD/Barrel 99.35 89.48 11.0% 101.75 89.48 13.7% 104.39 89.48 16.7% 96.46 89.48 7.8% 84.33 89.48 -5.8%
June 2009 Page 121

bw166 Beer - Imports and Exports Report
4.47 Oman - Exports
Total Beer (000s)L12M YA % L9M YA % L6M YA % L3M YA % L1M YA %
Barrels 4 5 -18.4% 3 4 -18.3% 2 3 -22.4% 1 1 -24.6% 0 1 -54.6%Value (USD) 513 597 -14.1% 416 483 -14.0% 269 328 -18.0% 136 168 -19.1% 51 103 -50.2%USD/Barrel 119.84 113.83 5.3% 120.33 114.23 5.3% 121.67 115.23 5.6% 123.31 114.94 7.3% 124.15 113.19 9.7%
June 2009 Page 122

bw166 Beer - Imports and Exports Report
4.48 Palau - Exports
Total Beer (000s)L12M YA % L9M YA % L6M YA % L3M YA % L1M YA %
Barrels 8 8 5.1% 7 5 21.5% 3 3 11.6% 2 2 11.1% 1 0 200.0%Value (USD) 1,013 971 4.3% 797 663 20.3% 409 366 11.9% 274 246 11.4% 81 27 200.0%USD/Barrel 121.01 121.89 -0.7% 120.78 122.03 -1.0% 122.55 122.17 0.3% 122.90 122.66 0.2% 121.86 121.86 0.0%
June 2009 Page 123
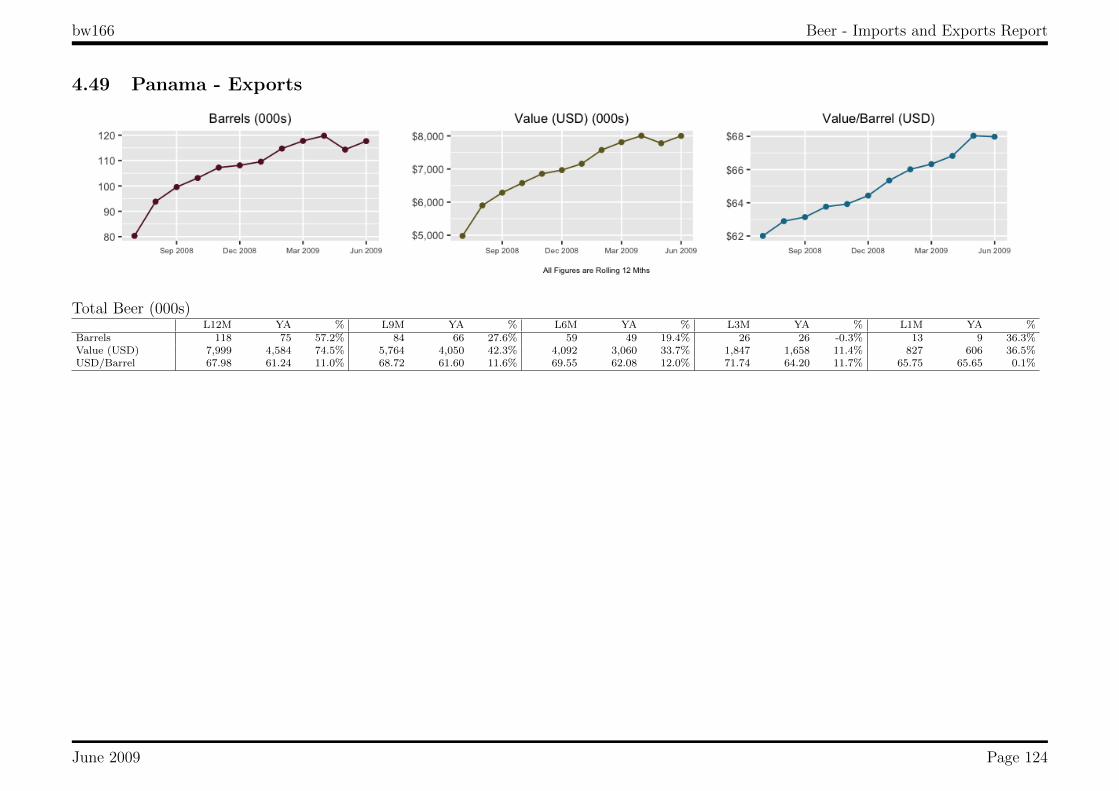
bw166 Beer - Imports and Exports Report
4.49 Panama - Exports
Total Beer (000s)L12M YA % L9M YA % L6M YA % L3M YA % L1M YA %
Barrels 118 75 57.2% 84 66 27.6% 59 49 19.4% 26 26 -0.3% 13 9 36.3%Value (USD) 7,999 4,584 74.5% 5,764 4,050 42.3% 4,092 3,060 33.7% 1,847 1,658 11.4% 827 606 36.5%USD/Barrel 67.98 61.24 11.0% 68.72 61.60 11.6% 69.55 62.08 12.0% 71.74 64.20 11.7% 65.75 65.65 0.1%
June 2009 Page 124

bw166 Beer - Imports and Exports Report
4.50 Paraguay - Exports
Total Beer (000s)L12M YA % L9M YA % L6M YA % L3M YA % L1M YA %
Barrels 100 39 156.3% 75 38 100.7% 19 12 62.1% 13 4 248.5% 6 2 271.7%Value (USD) 9,019 2,948 206.0% 6,742 2,809 140.1% 2,365 1,090 116.9% 1,599 428 273.9% 819 213 283.9%USD/Barrel 90.47 75.78 19.4% 89.47 74.80 19.6% 121.60 90.87 33.8% 124.21 115.78 7.3% 128.94 124.85 3.3%
June 2009 Page 125

bw166 Beer - Imports and Exports Report
4.51 Philippines - Exports
Total Beer (000s)L12M YA % L9M YA % L6M YA % L3M YA % L1M YA %
Barrels 1 0 121.5% 1 0 118.6% 1 0 239.5% 0 0 466.6% 0 0 -Value (USD) 79 33 138.4% 76 33 129.1% 57 19 201.9% 25 8 225.1% 17 0 -USD/Barrel 121.39 112.77 7.6% 118.18 112.77 4.8% 112.80 126.81 -11.1% 122.50 213.53 -42.6% 118.92 - -
June 2009 Page 126

bw166 Beer - Imports and Exports Report
4.52 Qatar - Exports
Total Beer (000s)L12M YA % L9M YA % L6M YA % L3M YA % L1M YA %
Barrels 4 4 18.8% 2 3 -29.9% 1 1 -50.2% 0 1 -100.0% 0 0 -100.0%Value (USD) 434 409 6.1% 191 293 -34.7% 65 166 -61.1% 0 137 -100.0% 0 59 -100.0%USD/Barrel 102.29 114.54 -10.7% 107.44 115.36 -6.9% 91.88 117.65 -21.9% - 118.11 - - 118.06 -
June 2009 Page 127

bw166 Beer - Imports and Exports Report
4.53 Samoa - Exports
Total Beer (000s)L12M YA % L9M YA % L6M YA % L3M YA % L1M YA %
Barrels 2 1 193.8% 2 1 193.8% 1 1 115.8% 1 1 4.4% 0 1 -100.0%Value (USD) 170 53 222.9% 170 53 222.9% 130 53 146.7% 65 53 23.1% 0 53 -100.0%USD/Barrel 110.79 100.81 9.9% 110.79 100.81 9.9% 115.21 100.81 14.3% 118.85 100.81 17.9% - 100.81 -
June 2009 Page 128

bw166 Beer - Imports and Exports Report
4.54 Saudi Arabia - Exports
Total Beer (000s)L12M YA % L9M YA % L6M YA % L3M YA % L1M YA %
Barrels 2 0 - 1 0 - 0 0 - 0 0 - 0 0 -Value (USD) 171 0 - 85 0 - 0 0 - 0 0 - 0 0 -USD/Barrel 101.89 - - 113.25 - - - - - - - - - - -
June 2009 Page 129

bw166 Beer - Imports and Exports Report
4.55 Singapore - Exports
Total Beer (000s)L12M YA % L9M YA % L6M YA % L3M YA % L1M YA %
Barrels 8 9 -12.6% 4 8 -48.4% 3 7 -50.0% 2 4 -47.4% 0 1 -80.9%Value (USD) 852 973 -12.4% 478 930 -48.6% 369 743 -50.4% 219 424 -48.4% 27 142 -81.1%USD/Barrel 111.10 110.74 0.3% 110.33 110.75 -0.4% 108.94 109.82 -0.8% 109.33 111.52 -2.0% 110.19 111.37 -1.1%
June 2009 Page 130

bw166 Beer - Imports and Exports Report
4.56 Solomon Islands - Exports
Total Beer (000s)L12M YA % L9M YA % L6M YA % L3M YA % L1M YA %
Barrels 1 2 -54.6% 1 2 -54.6% 1 1 -28.6% 0 1 -100.0% 0 0 -Value (USD) 55 121 -54.5% 55 121 -54.5% 55 77 -28.5% 0 44 -100.0% 0 0 -USD/Barrel 70.55 70.48 0.1% 70.55 70.48 0.1% 70.55 70.44 0.2% - 70.36 - - - -
June 2009 Page 131
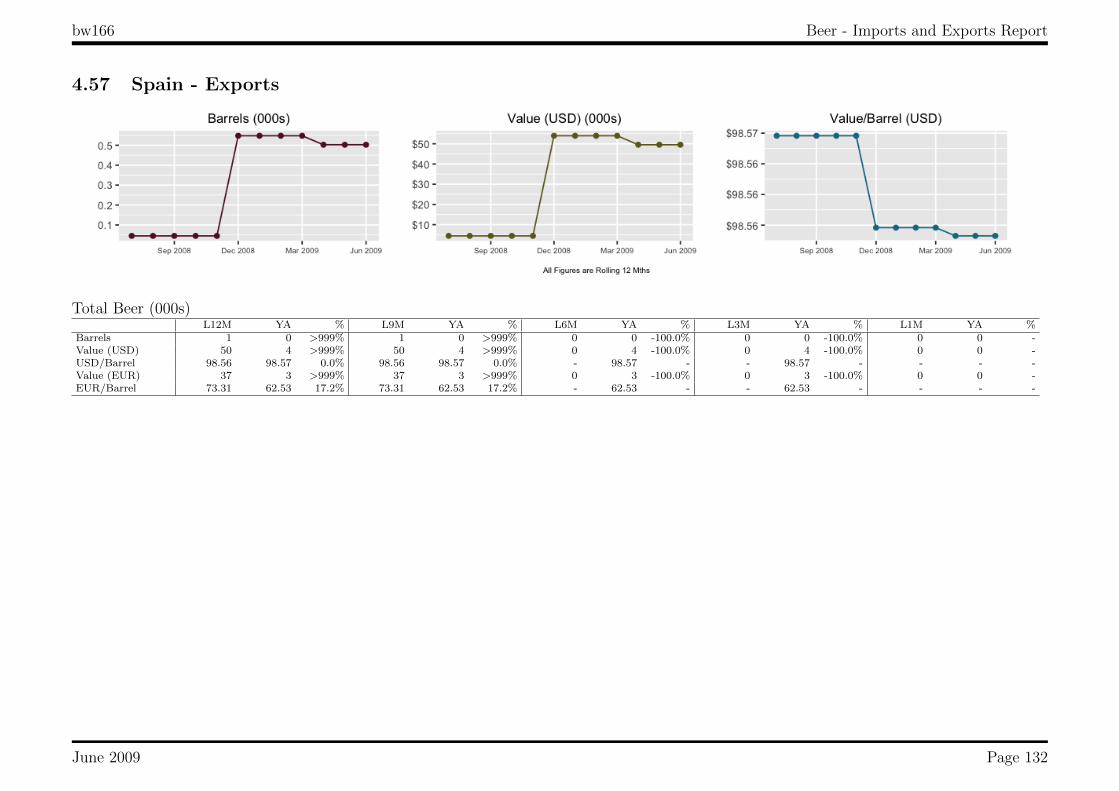
bw166 Beer - Imports and Exports Report
4.57 Spain - Exports
Total Beer (000s)L12M YA % L9M YA % L6M YA % L3M YA % L1M YA %
Barrels 1 0 >999% 1 0 >999% 0 0 -100.0% 0 0 -100.0% 0 0 -Value (USD) 50 4 >999% 50 4 >999% 0 4 -100.0% 0 4 -100.0% 0 0 -USD/Barrel 98.56 98.57 0.0% 98.56 98.57 0.0% - 98.57 - - 98.57 - - - -Value (EUR) 37 3 >999% 37 3 >999% 0 3 -100.0% 0 3 -100.0% 0 0 -EUR/Barrel 73.31 62.53 17.2% 73.31 62.53 17.2% - 62.53 - - 62.53 - - - -
June 2009 Page 132

bw166 Beer - Imports and Exports Report
4.58 Suriname - Exports
Total Beer (000s)L12M YA % L9M YA % L6M YA % L3M YA % L1M YA %
Barrels 1 2 -9.6% 1 2 -46.0% 0 1 -57.6% 0 1 -92.8% 0 0 -Value (USD) 108 106 2.0% 64 100 -36.0% 33 70 -52.3% 6 64 -89.9% 0 0 -USD/Barrel 73.48 65.09 12.9% 75.84 63.99 18.5% 72.22 64.18 12.5% 88.64 63.46 39.7% - - -
June 2009 Page 133

bw166 Beer - Imports and Exports Report
4.59 Sweden - Exports
Total Beer (000s)L12M YA % L9M YA % L6M YA % L3M YA % L1M YA %
Barrels 27 25 9.0% 15 19 -22.4% 11 13 -18.6% 6 5 15.4% 2 1 65.3%Value (USD) 2,699 2,627 2.7% 1,778 1,930 -7.9% 1,301 1,306 -0.4% 779 646 20.6% 291 191 52.7%USD/Barrel 99.92 106.04 -5.8% 118.34 99.67 18.7% 122.89 100.49 22.3% 123.15 117.79 4.6% 124.66 134.90 -7.6%Value (SEK) 20,185 16,680 21.0% 14,364 11,995 19.8% 10,578 7,993 32.3% 6,174 3,862 59.9% 2,259 1,147 97.0%SEK/Barrel 747.23 673.25 11.0% 955.96 619.32 54.4% 999.47 615.05 62.5% 976.11 704.52 38.5% 967.08 811.49 19.2%
June 2009 Page 134

bw166 Beer - Imports and Exports Report
4.60 Taiwan - Exports
Total Beer (000s)L12M YA % L9M YA % L6M YA % L3M YA % L1M YA %
Barrels 105 132 -21.0% 66 93 -28.8% 53 70 -24.0% 33 52 -36.8% 11 24 -55.9%Value (USD) 9,661 11,750 -17.8% 6,181 8,262 -25.2% 5,013 6,229 -19.5% 3,159 4,490 -29.6% 1,047 2,161 -51.6%USD/Barrel 92.44 88.79 4.1% 93.21 88.68 5.1% 94.45 89.15 5.9% 95.81 86.06 11.3% 97.87 89.18 9.7%
June 2009 Page 135

bw166 Beer - Imports and Exports Report
4.61 Trinidad and Tobago - Exports
Total Beer (000s)L12M YA % L9M YA % L6M YA % L3M YA % L1M YA %
Barrels 2 3 -25.5% 1 1 32.5% 1 0 83.4% 0 0 -30.4% 0 0 -59.1%Value (USD) 202 276 -27.0% 127 97 30.7% 55 31 77.4% 14 24 -40.7% 7 20 -66.8%USD/Barrel 93.28 95.10 -1.9% 106.00 107.47 -1.4% 105.22 108.77 -3.3% 98.74 116.03 -14.9% 98.60 121.43 -18.8%
June 2009 Page 136

bw166 Beer - Imports and Exports Report
4.62 Turks and Caicos Islands - Exports
Total Beer (000s)L12M YA % L9M YA % L6M YA % L3M YA % L1M YA %
Barrels 8 11 -33.2% 5 8 -35.0% 3 5 -37.1% 1 2 -45.3% 0 0 -34.1%Value (USD) 958 1,370 -30.1% 656 963 -31.9% 384 606 -36.6% 106 230 -53.8% 25 50 -49.6%USD/Barrel 126.50 120.78 4.7% 126.72 120.91 4.8% 123.76 122.80 0.8% 97.91 115.87 -15.5% 86.73 113.49 -23.6%
June 2009 Page 137

bw166 Beer - Imports and Exports Report
4.63 United Arab Emirates - Exports
Total Beer (000s)L12M YA % L9M YA % L6M YA % L3M YA % L1M YA %
Barrels 31 33 -6.0% 26 25 4.3% 13 17 -23.8% 3 9 -68.4% 1 4 -80.9%Value (USD) 3,549 3,592 -1.2% 2,981 2,720 9.6% 1,479 1,874 -21.1% 326 1,008 -67.6% 87 451 -80.8%USD/Barrel 114.03 108.50 5.1% 114.22 108.70 5.1% 114.18 110.20 3.6% 114.41 111.64 2.5% 112.47 111.86 0.5%
June 2009 Page 138

bw166 Beer - Imports and Exports Report
4.64 United Kingdom - Exports
Total Beer (000s)L12M YA % L9M YA % L6M YA % L3M YA % L1M YA %
Barrels 87 59 49.2% 54 54 0.6% 22 51 -55.9% 7 37 -81.2% 3 17 -80.2%Value (USD) 6,151 4,097 50.1% 4,055 3,547 14.3% 1,909 3,233 -41.0% 889 2,116 -58.0% 430 955 -54.9%USD/Barrel 70.41 69.95 0.7% 75.30 66.24 13.7% 84.95 63.44 33.9% 129.35 57.90 123.4% 125.72 55.32 127.3%Value (GBP) 3,738 2,061 81.3% 2,639 1,789 47.5% 1,278 1,636 -21.9% 568 1,073 -47.0% 263 485 -45.7%GBP/Barrel 42.79 35.19 21.6% 49.00 33.41 46.7% 56.87 32.10 77.2% 82.68 29.37 181.5% 76.88 28.11 173.5%
June 2009 Page 139

bw166 Beer - Imports and Exports Report
4.65 Vietnam - Exports
Total Beer (000s)L12M YA % L9M YA % L6M YA % L3M YA % L1M YA %
Barrels 7 2 339.8% 7 1 338.7% 2 1 10.1% 1 1 -19.4% 1 0 218.7%Value (USD) 450 126 257.8% 434 121 258.3% 120 121 -0.6% 81 97 -17.0% 81 25 218.7%USD/Barrel 66.21 81.37 -18.6% 66.36 81.25 -18.3% 73.30 81.25 -9.8% 80.30 77.93 3.0% 80.30 80.30 0.0%
June 2009 Page 140

bw166 Beer - Imports and Exports Report
5 Data Descriptions
9LE Cases and Barrels
Total volume imported into or exported from the United States.
Value (USD) and Value (FX)
The total value of Beer, Spirits, or Wine imported into or exported from the United States. Source or destination currency valuationsare also provided.
USD/9LE, USD/Barrel, FX/9LE, and FX/Barrel
The per case/barrel value of Beer, Spirits, or Wine imported into or exported from the United States. Source or destination currencyvaluations are also provided.
June 2009 Page 141
bw166 Beer - Imports and Exports Report
6 Other Publications
Available PublicationsThe Total Beverage Alcohol Overview
Monthly overview of Beer, Wine, and Spirits in the US market
Beer - Imports and Exports ReportMonthly publication providing a complete view of imports and exports of Beer
Wine - Imports and Exports ReportMonthly publication providing a complete view of imports and exports of Wine
Spirits - Imports and Exports ReportMonthly publication providing a complete view of imports and exports of Spirits
Total Beverage Alcohol Annual ReviewAn accurate and complete view of beer, wine, and spirits in the US marketplace - beginning with a 30 year look at key economic factors,
topline beverage alcohol statistics, and demographic data; followed by a 10 year review of Beer, Spirits, and Wine.
Please visit www.bw166.com for more information
June 2009 Page 142