beer dataset analysis - dublin business school
TRANSCRIPT
FINTAN WARD 0
Fintan Ward
Id 10524202
Dr Shazia A Afzal
Submission Date: 23/09/2020
BEER DATASET ANALYSIS Final Report
B8IT110 Higher Diploma in Science in Data Analytics
FINTAN WARD 1
Acknowledgments
I would like to thank Dr. Shazia A Afzal for help during the development of the initial project
proposal and assistance with researching and documentation around the theory and
implementation of recommendation systems.
I would also like to thank William Brosan for recommending to me the learning website,
PluralSight.com and specifically to the Angular UI course, ‘Angular: Getting Started’, that I used
in the development of the website section of this project.
FINTAN WARD 2
Contents Acknowledgments ............................................................................................................................ 1
Contents ........................................................................................................................................... 2
1. Introduction ............................................................................................................................ 3
2. Background ............................................................................................................................. 4
3. Requirements Specification and Design ................................................................................. 6
3.1 Project Requirements ................................................................................................. 6
3.1.1 Functional Requirements .................................................................................... 6
3.1.2 Non-Functional Requirements ............................................................................ 6
3.2 Design ............................................................................................................................ 7
3.3 Tools & Techniques ....................................................................................................... 8
3.3.1 Tools ................................................................................................................... 8
3.3.2 Techniques ......................................................................................................... 8
3.4 The beverage dataset .................................................................................................... 8
3.5 The Recommendation System Implementation............................................................ 9
3.5.1 RecommendationEngine.py ............................................................................... 9
3.5.2 app.py ............................................................................................................... 12
3.6 Testing the Beer Recommendation API ...................................................................... 13
3.7 The Angular Application Implementation ................................................................... 13
3.7.1 The Welcome Component ................................................................................ 14
3.7.2 The Beer List Component ................................................................................. 14
3.7.3 The Beer Detail Component ............................................................................. 15
3.7.4 The Plots Component ....................................................................................... 16
3.7.5 The Star Component......................................................................................... 18
3.7.6 The Beer Service ............................................................................................... 18
4 Project Testing and Evaluation ....................................................................................... 19
4.1 Executing the Application ............................................................................................ 19
4.1.1 Executing the Flask application ........................................................................ 19
4.1.2 Executing the Angular UI .................................................................................. 19
4.2 Evaluating the Recommendation Application. ............................................................ 19
5 Demonstration of Progress ................................................................................................... 21
5.1 Project Schedule ....................................................................................................... 21
6 Future Work .......................................................................................................................... 21
7 References / Bibliography ..................................................................................................... 22
8 Appendix A ............................................................................................................................... 23
FINTAN WARD 3
1. Introduction
The aim of this project is to produce a beer recommendation website. The website will allow a
user to select a specific beer from a list of beers and predict several beer recommendations
which will be displayed to the user.
Recommendation systems play a crucial in our day to day online activity. They are used by e-
commerce websites, such as Amazon, Netflix or eBay, to suggest relevant products to the user
that drive sales. Online advertisement use recommendation systems to display relevant ads to
their users, resulting in increased engagement. Indeed, Netflix organized a challenge ‘The Netflix
Prize’ where the goal was to produce a recommender system that performs better than its own
algorithm with a prize of 1 million dollars to win.
(Baptiste Rocca, 2019)
I will develop a website, written in Augular and backed by a Python Flask application which will
expose an API that the Angular website will consume. The python application will contain a
recommendation system that is developed to predict beer recommendations that will be
relevant to the user given their preferred beer choice. The website will also contain a page
where the user can view informative plots which highlight various aspects of the beverage
dataset.
I have approached this project using a rapid prototyping development methodology.
"Rapid Application Development (RAD) is a form of agile software development
methodology that prioritizes rapid prototype releases and iterations. Unlike the Waterfall
method, RAD emphasizes the use of software and user feedback over strict planning and
requirements recording."
(Google Web Search, 2020)
Using this approach, I have been able to mix research and development tasks; researching a
topic then attempting to incorporate this knowledge into a development task that fulfils a
specific feature within the project. I have found that this approach works well and quickly
produces feedback on the suitability of the technology.
For the purposes of this project, I have assumed the following:
• the dataset used in this project reflects real real-world opinion.
• the finished application can be run from my personal computer for demonstration &
presentation purposes.
• The dataset is suitable for the DBS
• The final project and dataset is uploaded to DBS.
FINTAN WARD 4
1. Background
Source
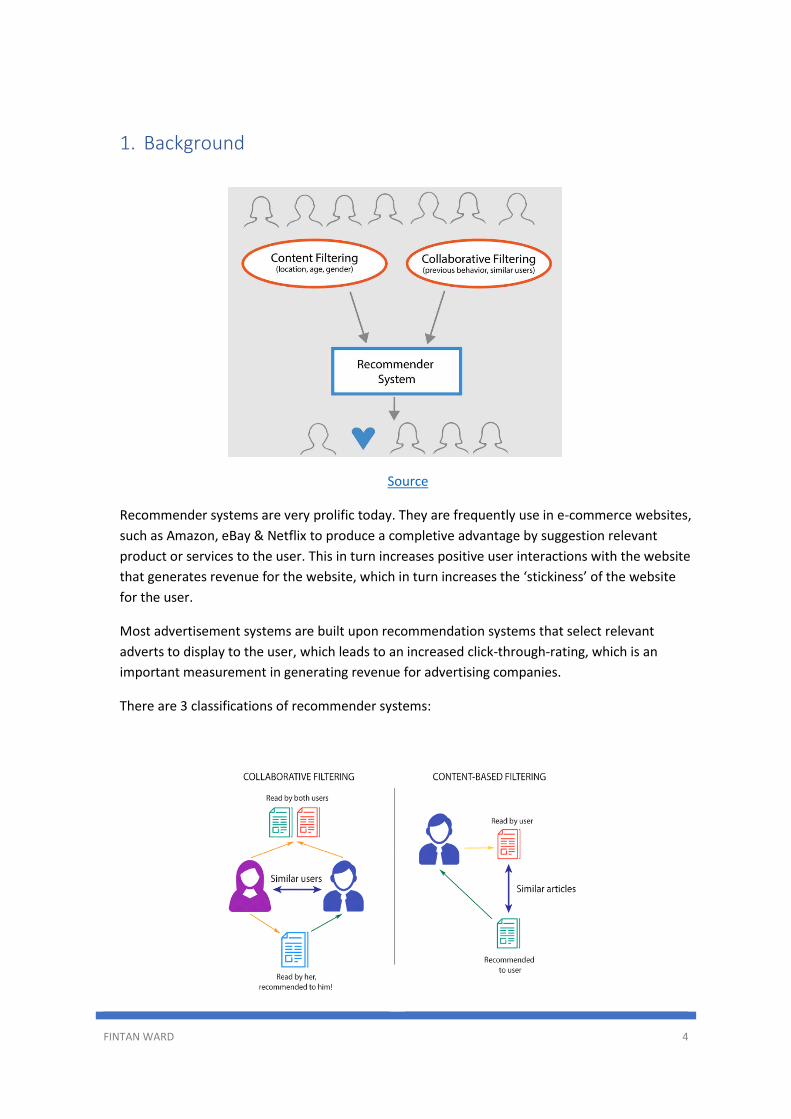
Recommender systems are very prolific today. They are frequently use in e-commerce websites,
such as Amazon, eBay & Netflix to produce a completive advantage by suggestion relevant
product or services to the user. This in turn increases positive user interactions with the website
that generates revenue for the website, which in turn increases the ‘stickiness’ of the website
for the user.
Most advertisement systems are built upon recommendation systems that select relevant
adverts to display to the user, which leads to an increased click-through-rating, which is an
important measurement in generating revenue for advertising companies.
There are 3 classifications of recommender systems:
FINTAN WARD 5
(Medford Xie, 2019)
• Simple Recommenders method
These systems offer generalized recommendations to every user, based on a common
factor. An example would be an online gaming platform, such as Steam, to suggest new
games to a user base on the game's popularity.
• Content-based method
These systems suggest similar items to a user, based on the meta-data, such as a favorite
film director. The assumption for this system is that if a user like a particular item, the user
will also like similar items. An example of this would be the Netflix 'Because you Watched'
movie category.
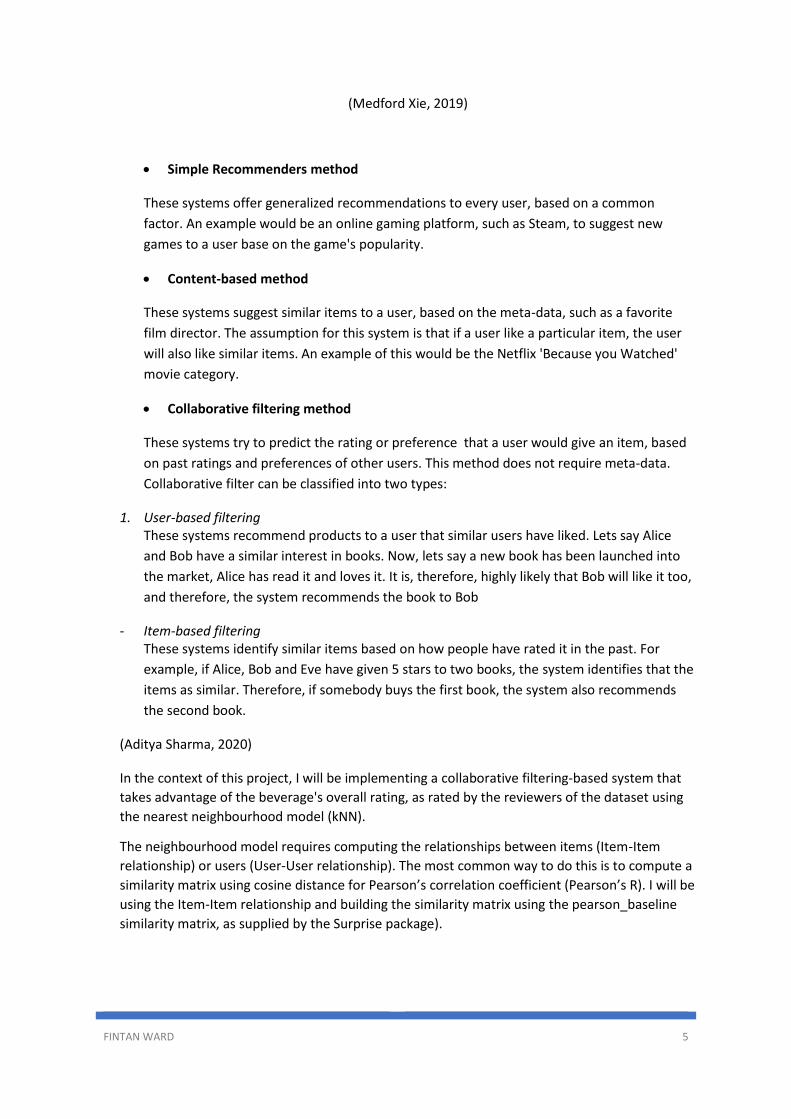
• Collaborative filtering method
These systems try to predict the rating or preference that a user would give an item, based
on past ratings and preferences of other users. This method does not require meta-data.
Collaborative filter can be classified into two types:
1. User-based filtering These systems recommend products to a user that similar users have liked. Lets say Alice
and Bob have a similar interest in books. Now, lets say a new book has been launched into
the market, Alice has read it and loves it. It is, therefore, highly likely that Bob will like it too,
and therefore, the system recommends the book to Bob
- Item-based filtering These systems identify similar items based on how people have rated it in the past. For
example, if Alice, Bob and Eve have given 5 stars to two books, the system identifies that the
items as similar. Therefore, if somebody buys the first book, the system also recommends
the second book.
(Aditya Sharma, 2020)
In the context of this project, I will be implementing a collaborative filtering-based system that
takes advantage of the beverage's overall rating, as rated by the reviewers of the dataset using
the nearest neighbourhood model (kNN).
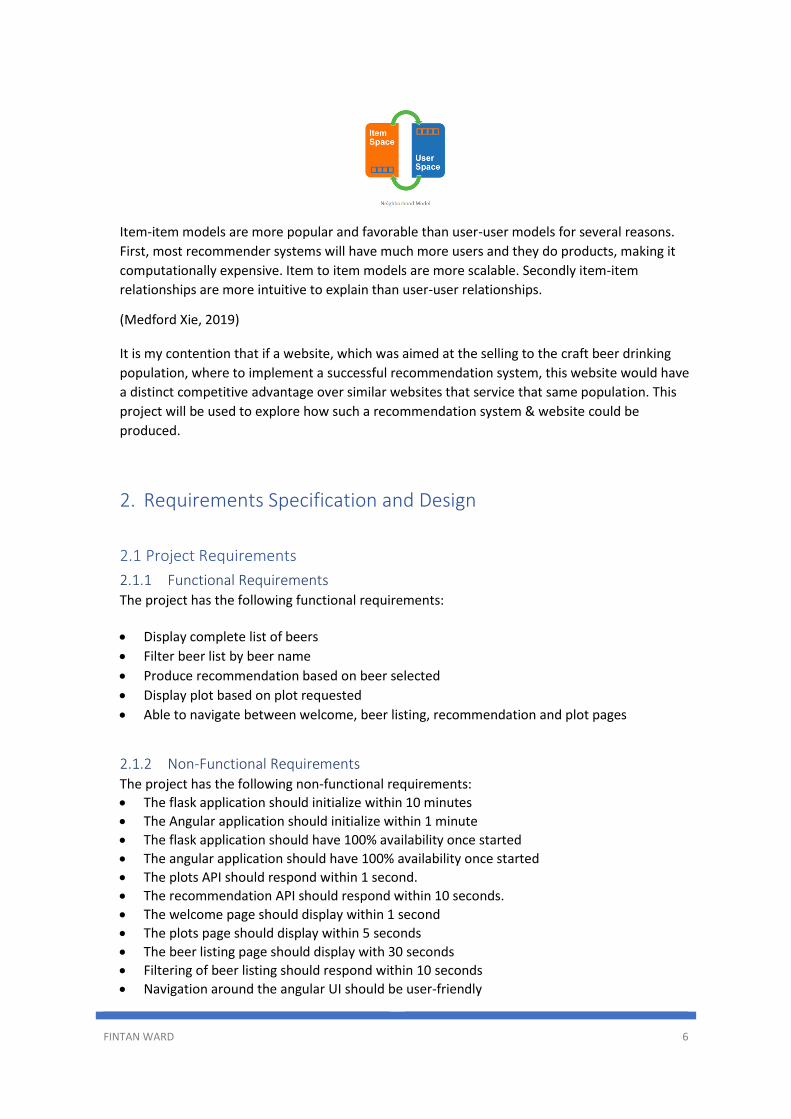
The neighbourhood model requires computing the relationships between items (Item-Item
relationship) or users (User-User relationship). The most common way to do this is to compute a
similarity matrix using cosine distance for Pearson’s correlation coefficient (Pearson’s R). I will be
using the Item-Item relationship and building the similarity matrix using the pearson_baseline
similarity matrix, as supplied by the Surprise package).
FINTAN WARD 6
Item-item models are more popular and favorable than user-user models for several reasons.
First, most recommender systems will have much more users and they do products, making it
computationally expensive. Item to item models are more scalable. Secondly item-item
relationships are more intuitive to explain than user-user relationships.
(Medford Xie, 2019)
It is my contention that if a website, which was aimed at the selling to the craft beer drinking
population, where to implement a successful recommendation system, this website would have
a distinct competitive advantage over similar websites that service that same population. This
project will be used to explore how such a recommendation system & website could be
produced.
2. Requirements Specification and Design
2.1 Project Requirements
2.1.1 Functional Requirements The project has the following functional requirements:
• Display complete list of beers
• Filter beer list by beer name
• Produce recommendation based on beer selected
• Display plot based on plot requested
• Able to navigate between welcome, beer listing, recommendation and plot pages
2.1.2 Non-Functional Requirements The project has the following non-functional requirements:
• The flask application should initialize within 10 minutes
• The Angular application should initialize within 1 minute
• The flask application should have 100% availability once started
• The angular application should have 100% availability once started
• The plots API should respond within 1 second.
• The recommendation API should respond within 10 seconds.
• The welcome page should display within 1 second
• The plots page should display within 5 seconds
• The beer listing page should display with 30 seconds
• Filtering of beer listing should respond within 10 seconds
• Navigation around the angular UI should be user-friendly
FINTAN WARD 7
• The Angular UI should support IE11, Chrome, Firefox & Safari desktop web browsers.
• Support for mobile devices is not part of this release.
2.2 Design The project will build a beverage recommendation system by using a k-nearest neighbours (k-
NN) approach.
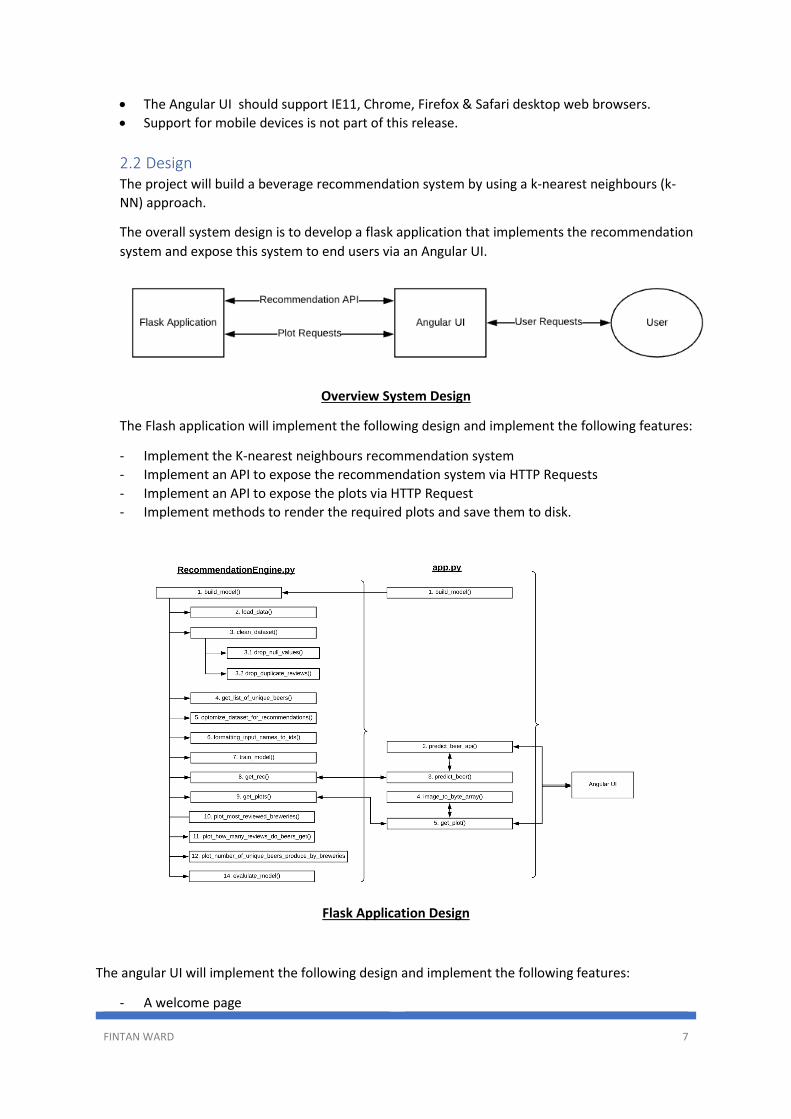
The overall system design is to develop a flask application that implements the recommendation
system and expose this system to end users via an Angular UI.
Overview System Design
The Flash application will implement the following design and implement the following features:
- Implement the K-nearest neighbours recommendation system
- Implement an API to expose the recommendation system via HTTP Requests
- Implement an API to expose the plots via HTTP Request
- Implement methods to render the required plots and save them to disk.
Flask Application Design
The angular UI will implement the following design and implement the following features:
- A welcome page
FINTAN WARD 8
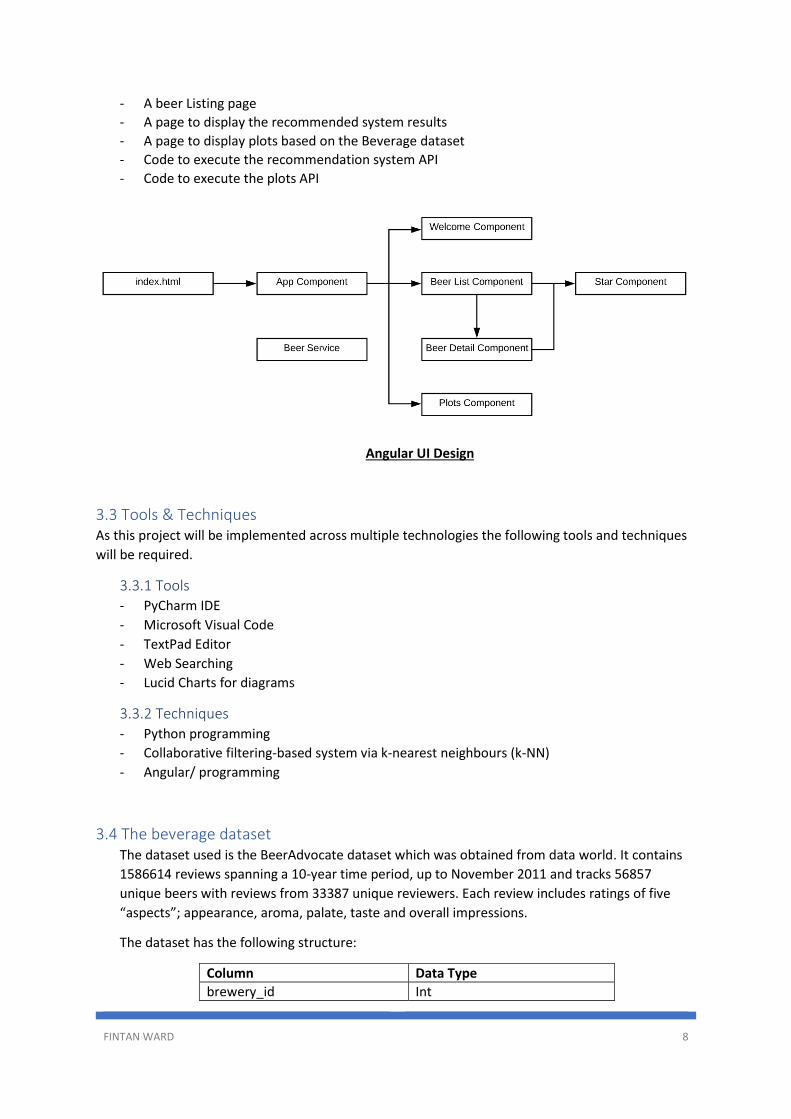
- A beer Listing page
- A page to display the recommended system results
- A page to display plots based on the Beverage dataset
- Code to execute the recommendation system API
- Code to execute the plots API
Angular UI Design
3.3 Tools & Techniques As this project will be implemented across multiple technologies the following tools and techniques
will be required.
3.3.1 Tools - PyCharm IDE
- Microsoft Visual Code
- TextPad Editor
- Web Searching
- Lucid Charts for diagrams
3.3.2 Techniques - Python programming
- Collaborative filtering-based system via k-nearest neighbours (k-NN)
- Angular/ programming
3.4 The beverage dataset The dataset used is the BeerAdvocate dataset which was obtained from data world. It contains
1586614 reviews spanning a 10-year time period, up to November 2011 and tracks 56857
unique beers with reviews from 33387 unique reviewers. Each review includes ratings of five
“aspects”; appearance, aroma, palate, taste and overall impressions.
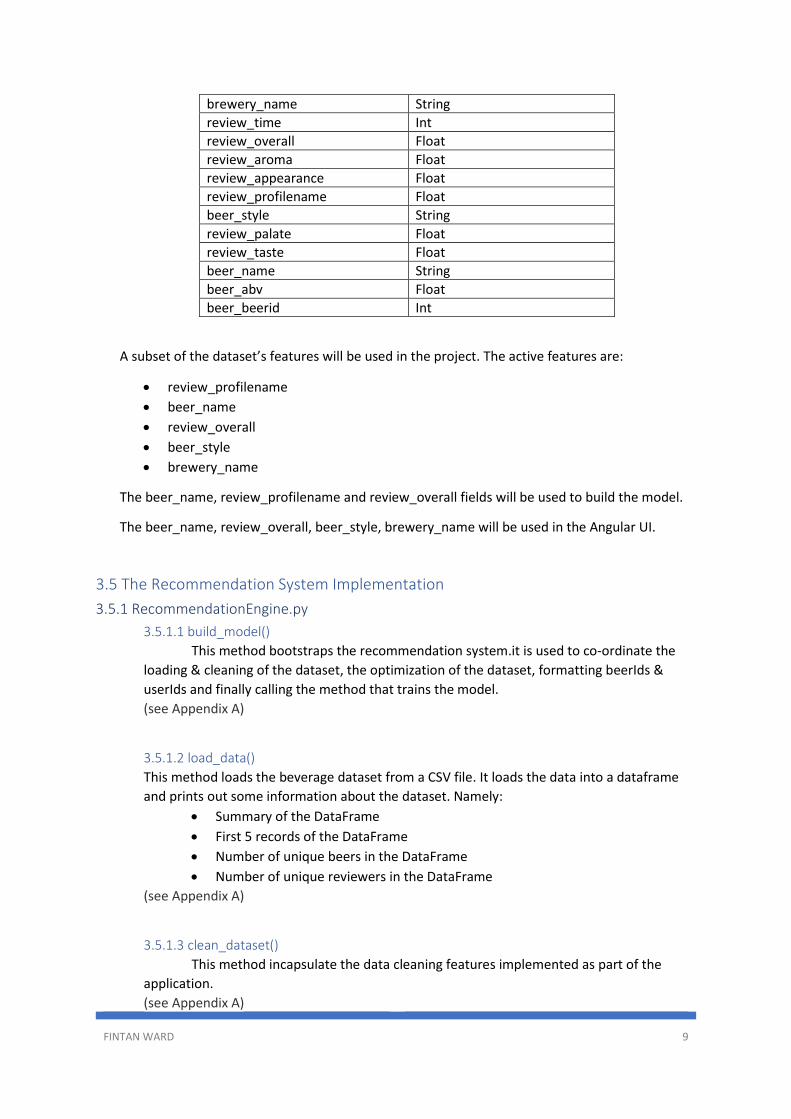
The dataset has the following structure:
Column Data Type
brewery_id Int
FINTAN WARD 9
brewery_name String
review_time Int
review_overall Float
review_aroma Float
review_appearance Float
review_profilename Float
beer_style String
review_palate Float
review_taste Float
beer_name String
beer_abv Float
beer_beerid Int
A subset of the dataset’s features will be used in the project. The active features are:
• review_profilename
• beer_name
• review_overall
• beer_style
• brewery_name
The beer_name, review_profilename and review_overall fields will be used to build the model.
The beer_name, review_overall, beer_style, brewery_name will be used in the Angular UI.
3.5 The Recommendation System Implementation
3.5.1 RecommendationEngine.py
3.5.1.1 build_model()
This method bootstraps the recommendation system.it is used to co-ordinate the
loading & cleaning of the dataset, the optimization of the dataset, formatting beerIds &
userIds and finally calling the method that trains the model.
(see Appendix A)
3.5.1.2 load_data()
This method loads the beverage dataset from a CSV file. It loads the data into a dataframe
and prints out some information about the dataset. Namely:
• Summary of the DataFrame
• First 5 records of the DataFrame
• Number of unique beers in the DataFrame
• Number of unique reviewers in the DataFrame
(see Appendix A)
3.5.1.3 clean_dataset()
This method incapsulate the data cleaning features implemented as part of the
application.
(see Appendix A)
FINTAN WARD 10
3.5.1.4 drop_null_values()
This method drops null values from the dataset. Initially it was implemented that if
any field in the dataset contained null values, that record would be dropped. The dataset
started out with 1586614 records, which was reduced to 1518478 records, meaning a total
of 68136 record or 4.29% of data was dropped.
This method was refined to only drop records if the following relevant fields
contained null data:
• brewery_name
• review_overall
• review_profilename
• beer_name
With this refinement in place, the final number of records remaining after all records with null values in the relevant fields had been dropped amounted to 1586251 records. This meant that a total of 363 records were dropped or 0.02%. This was a quick optimization that has a significant improvement on the number of records that would available for the system to use when it comes to building the model. (see Appendix A)
3.5.1.5 drop_duplicate_reviews()
This method removes duplicate reviews from the dataset. Initially it was
implemented that if any field in the dataset contained duplicate values, only the first record
would be kept, the other records would be dropped. This implementation did not detect any
duplicate records, so it was refined to compare only two significant fields:
• review_profilename
• beer_name
This would mean that duplicate reviews by the same reviewer for the same beer would
be dropped from the dataset. With this optimisation in place, 24861 records were dropped,
or 1.57%, leaving a total of 1561390 records available to train the model with. This was a
small but relevant optimisation as it improves the quality of the remaining data.
(see Appendix A)
3.5.1.6 get_list_of_unique_beers()
With the optimized dataset passed to this method a list if unique beers is calculated,
fields are renamed as required and the result is written out to a json file, which is used in the
Angular UI section of the application.
(see Appendix A)
3.5.1.7 optomize_dataset_for_recommendations()
This purpose of this method it to optimizes the dataset that will be used to build the model. First the number of reviews that a reviewer had made is calculated. Then the number of reviews each beer has is calculated. These values are added to a refined dataset which contains only the fields required going forward. These are:
• review_profilename
• beer_name
FINTAN WARD 11
• review_overall
• beer_style
• beer_beerid
• brewery_name With the resultant dataset in place, beers that have less that 25 reviews and reviewers
that have less than 25 reviews are both dropped from the dataset. This resulted in 309407 records or 19.82% being dropped from the dataset, for a total of 1251983 records remaining, which contained 7933 unique beers and 6823 unique reviewers.
With the optimized dataset calculated, the method. getListOfUniqueBeers() is called. Joon (2019) (see Appendix A)
3.5.1.8 formatting_input_names_to_ids ()
This method first creates a dataframe with a unique beerID’s for each beer in the dataset. It
then creates a dataframe with a unique userIDs for every user in the dataset. These values
are added to the dataset to use later in the application
Medford Xie (2019)
(see Appendix A)
3.5.1.9 train_model()
This method is responsible for training the model. The Reader function normalizes the
data (ratings are from a scale of 1-5. The Dataset.load_from_df() and
data.build_full_trainset() methods are build-in Surprise methods allowing you to load in
your entire dataframe and it will build the training set for you. The sim_options allows you
to specify the type of similarity measure to use, Pearson vs cosine distance vs mean squared
distance. ‘User based = False’ indicates that his is an item-item similarity and not using user-
user similarity.
Medford Xie (2019)
(see Appendix A)
3.5.1.10 get_rec()
This method returns the K nearest recommendation based on the item similarity, after
the model had been trained. Each raw id is mapped to a unique integer called the inner id –
this makes it more suitable for Surprise to manipulate.
This code was taken from the Surprise FAQ documentation and amended to suit the beer
recommender.
Medford Xie (2019)
(see Appendix A)
3.5.1.11 get_plots()
This method receives the name of a plot. It opens the image file on disk and returns
image object to the calling method.
(see Appendix A)
FINTAN WARD 12
3.5.1.12 plot_most_reviewed_breweries()
This method is responsible for the rendering of a plot that visualises the number of
reviews each brewery received. As part of the process, the plot is saved to file. This function
is only ran once so the saved plot will be available to the Flask application.
(see Appendix A)
3.5.1.13 plot_how_many_reviews_do_beers_get()
This method is responsible for the rendering of a plot that visualises how many reviews
each beer gets. As part of the process, the plot is saved to file. This function is only ran once
so the saved plot will be available to the Flask application.
(see Appendix A)
3.5.1.14 plot_number_of_unique_beers_produced_by_breweries()
This method is responsible for the rendering of a plot that visualises the number of
unique beers that each brewery produces. As part of the process, the plot is saved to. This
function is only ran once so the saved plot will be available to the Flask application.
(see Appendix A)
3.5.1.15 evalulate_model()
This method runs a 5-fold cross validation with the specified matrix. This measures how
well the algorithm predicts a missing rating against the actual rating. For the beer
recommender, the RMSE (root mean square error) is 0.58 and the MAE (mean absolute
error is 0.43. This is quite good given the scale is from 1 – 5.
(see Appendix A)
3.5.2 app.py
3.5.2.1 predict_beer_api()
This is the method that implements a http request handling for the beer predication API. It takes the JSON response from the predict_beer() method and returns it as the body of the API’s response (see Appendix A)
3.5.2.2 predict_beer()
This method is responsible for retrieving the beer name from the API restful request and calls upon the get_rec() method to obtain a lick of recommendations. This list is then parsed into a JSON string and returned to the calling method (see Appendix A)
3.5.2.3 image_to_byte_array()
This method is used to loads the previous rendered plot image from the filesystem, convert it into a bytes array and returns it to the calling method. (see Appendix A)
FINTAN WARD 13
3.5.2.4 get_plot()
This method handle API plot requests. It retrieves the plot name from the request and looks up the plot via a call to the getPlot() method, which is implemented in RecommendationEngine.py. Once the plot file had been opened,, the imaga_to_bytes_array() method is called to load the image into memory from the file system and then sends the image back as part of the API response, ensuring that the mime type specifies that the response is a PNG image. (see Appendix A)
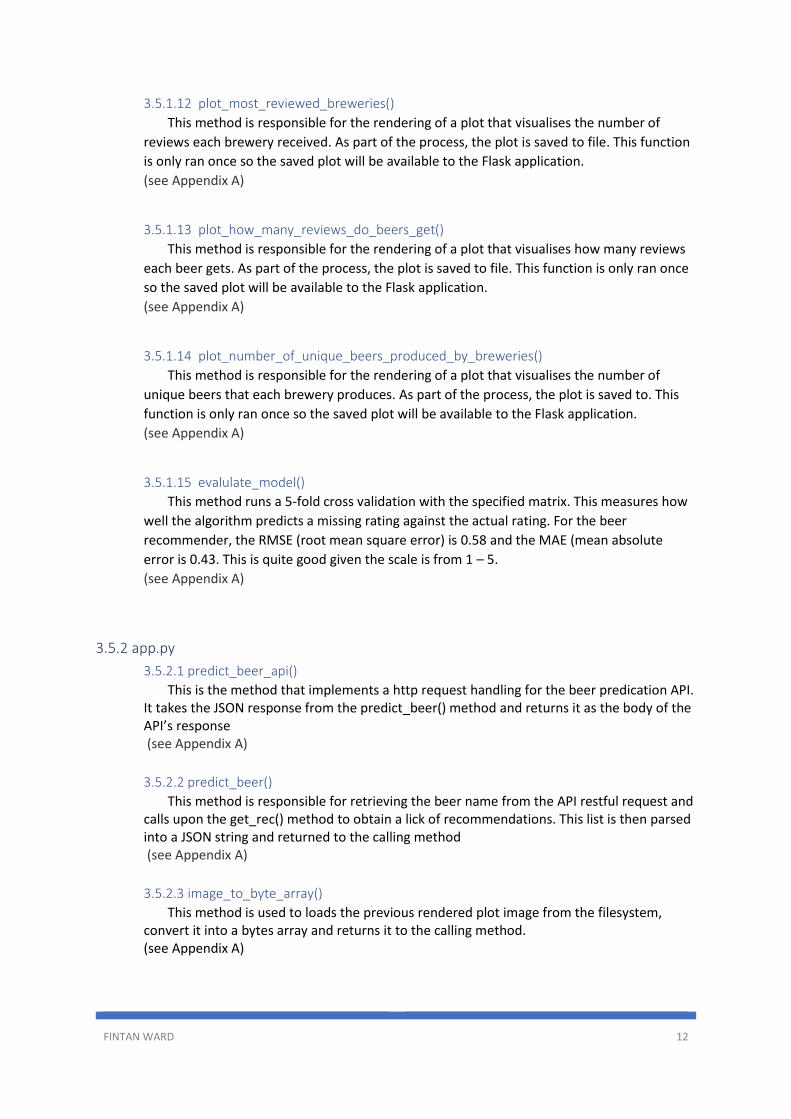
3.6 Testing the Beer Recommendation API During development of the flask application I used an application called ‘Postman’ to send http
requests to the flask application and to review the json response that the flask application
returned.
The Postman Application
3.7 The Angular Application Implementation The angular SPA (Single Page Application) will have services/components:
FINTAN WARD 14
• Welcome Component
• Beer List Component
• Beer Detail Component
• Plots Component
• Star Component
• The Beer Service
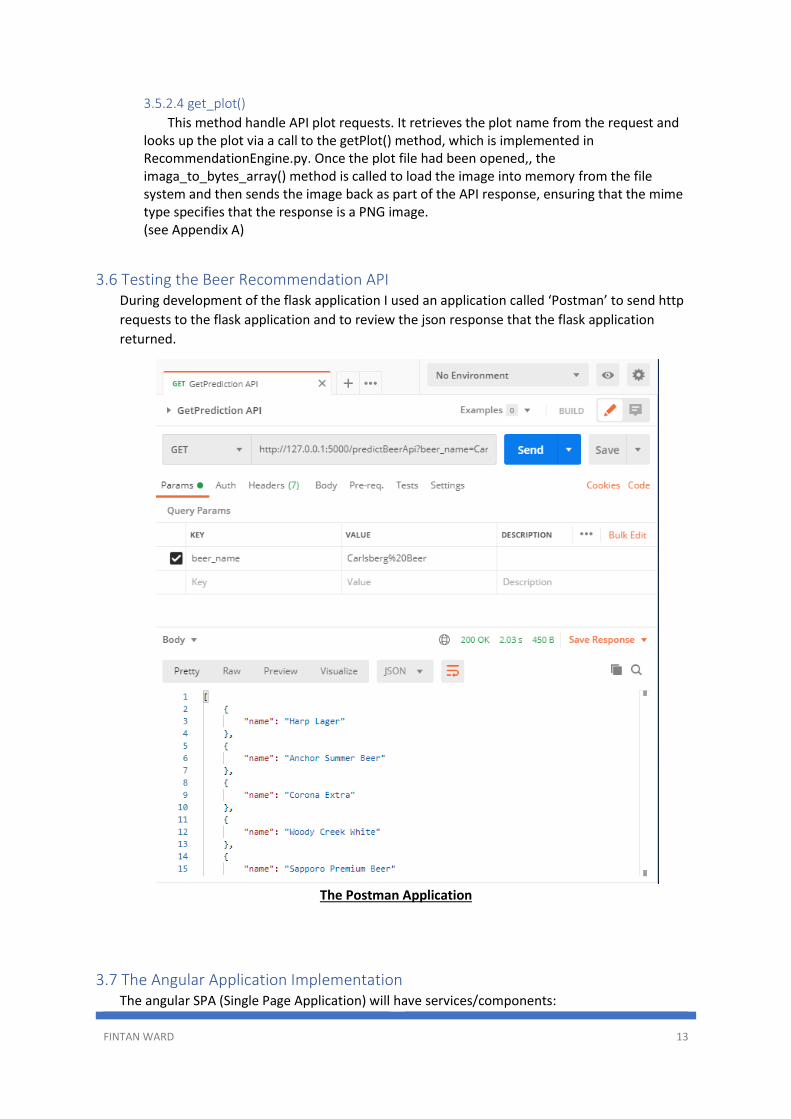
3.7.1 The Welcome Component The Welcome Component will be presented to the user when the user initially visits the
website. This page will have 3 links to allow for navigation around the website – ‘Home’, ‘Beer
List’ and ‘Beer Plots’.
The Welcome Component
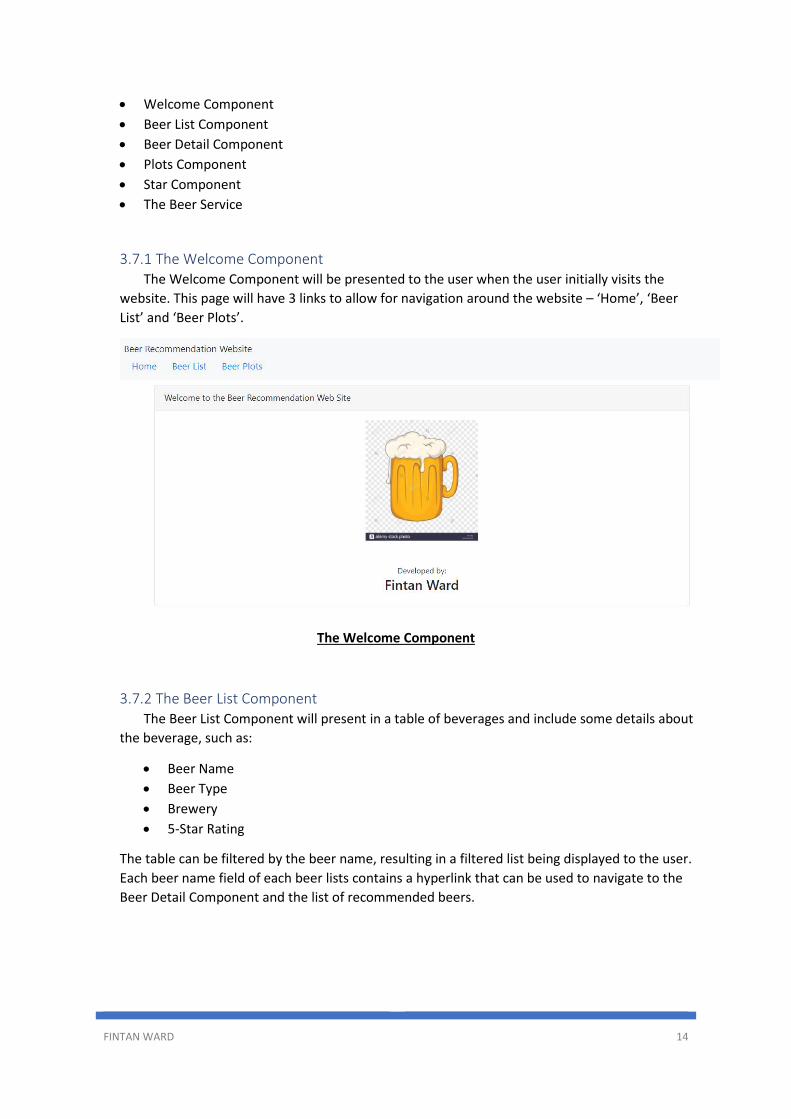
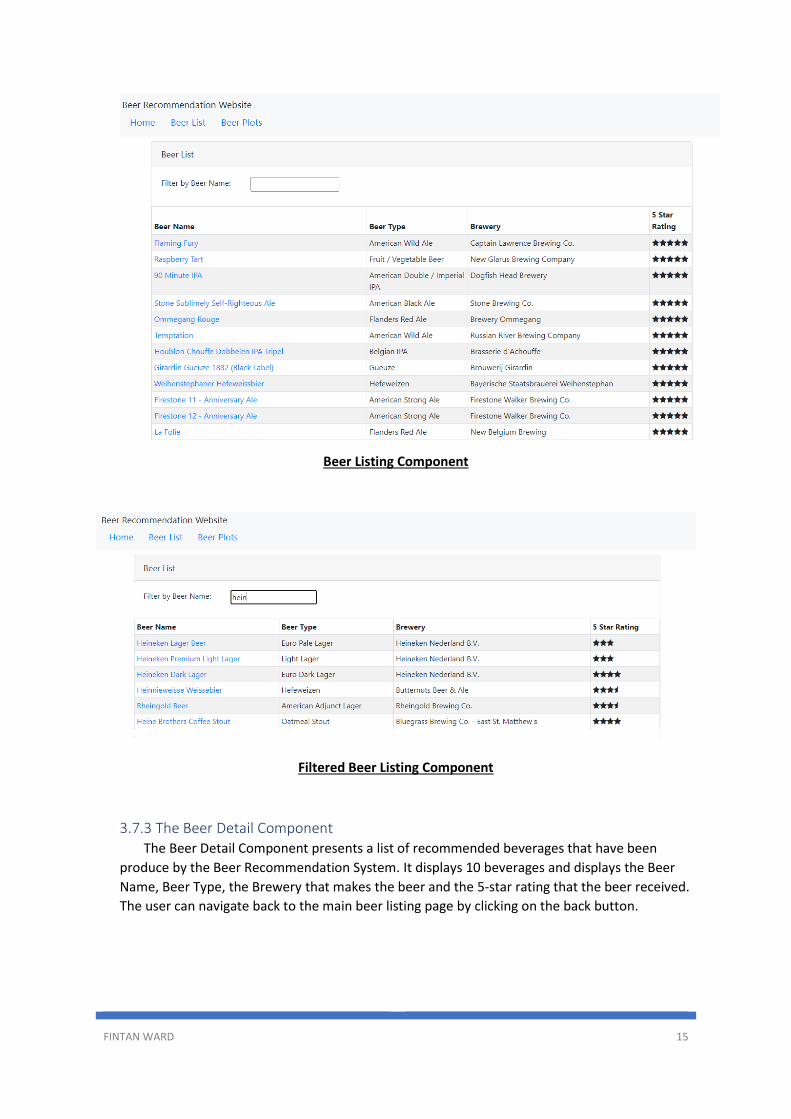
3.7.2 The Beer List Component The Beer List Component will present in a table of beverages and include some details about
the beverage, such as:
• Beer Name
• Beer Type
• Brewery
• 5-Star Rating
The table can be filtered by the beer name, resulting in a filtered list being displayed to the user.
Each beer name field of each beer lists contains a hyperlink that can be used to navigate to the
Beer Detail Component and the list of recommended beers.
FINTAN WARD 15
Beer Listing Component
Filtered Beer Listing Component
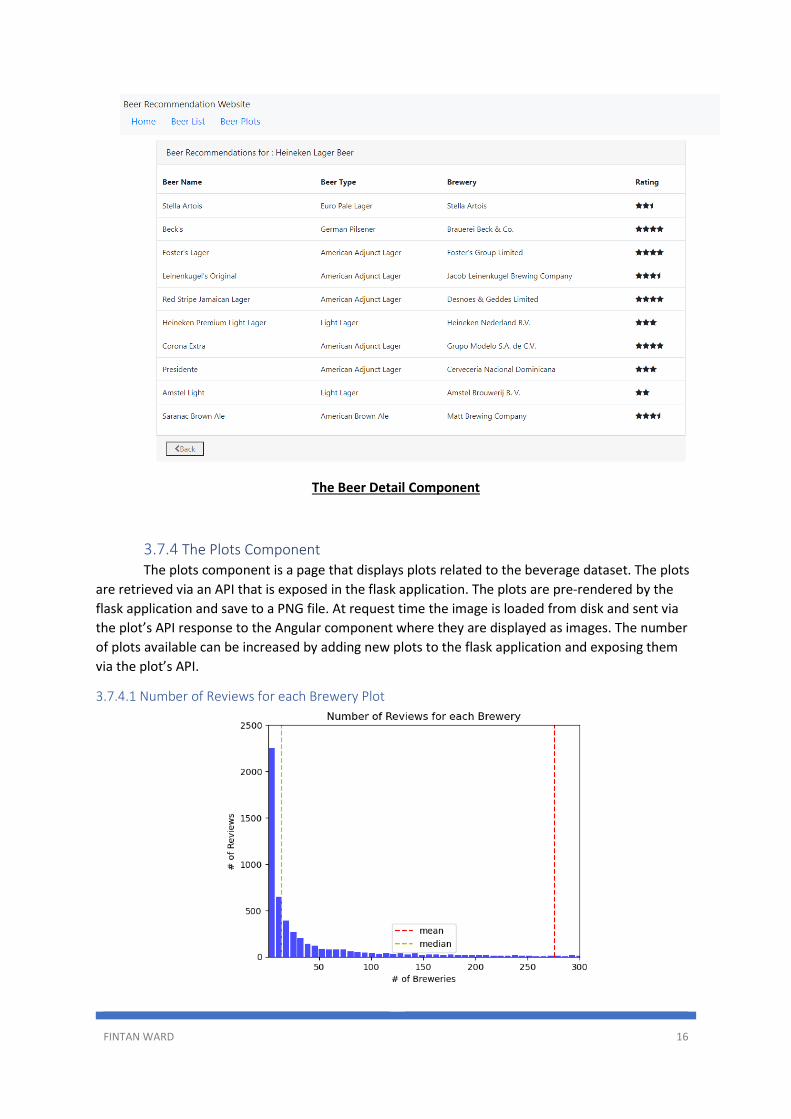
3.7.3 The Beer Detail Component The Beer Detail Component presents a list of recommended beverages that have been
produce by the Beer Recommendation System. It displays 10 beverages and displays the Beer
Name, Beer Type, the Brewery that makes the beer and the 5-star rating that the beer received.
The user can navigate back to the main beer listing page by clicking on the back button.
FINTAN WARD 16
The Beer Detail Component
3.7.4 The Plots Component
The plots component is a page that displays plots related to the beverage dataset. The plots
are retrieved via an API that is exposed in the flask application. The plots are pre-rendered by the
flask application and save to a PNG file. At request time the image is loaded from disk and sent via
the plot’s API response to the Angular component where they are displayed as images. The number
of plots available can be increased by adding new plots to the flask application and exposing them
via the plot’s API.
3.7.4.1 Number of Reviews for each Brewery Plot
FINTAN WARD 17
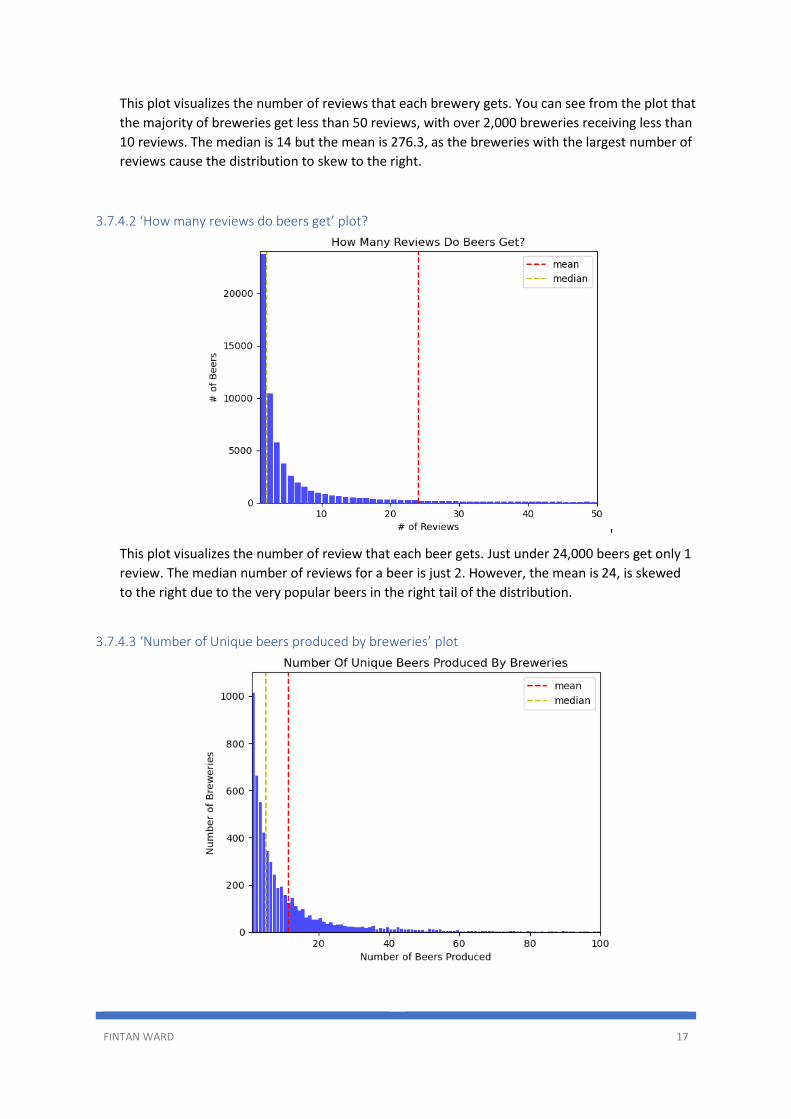
This plot visualizes the number of reviews that each brewery gets. You can see from the plot that
the majority of breweries get less than 50 reviews, with over 2,000 breweries receiving less than
10 reviews. The median is 14 but the mean is 276.3, as the breweries with the largest number of
reviews cause the distribution to skew to the right.
3.7.4.2 ‘How many reviews do beers get’ plot?
'
This plot visualizes the number of review that each beer gets. Just under 24,000 beers get only 1
review. The median number of reviews for a beer is just 2. However, the mean is 24, is skewed
to the right due to the very popular beers in the right tail of the distribution.
3.7.4.3 ‘Number of Unique beers produced by breweries’ plot
FINTAN WARD 18
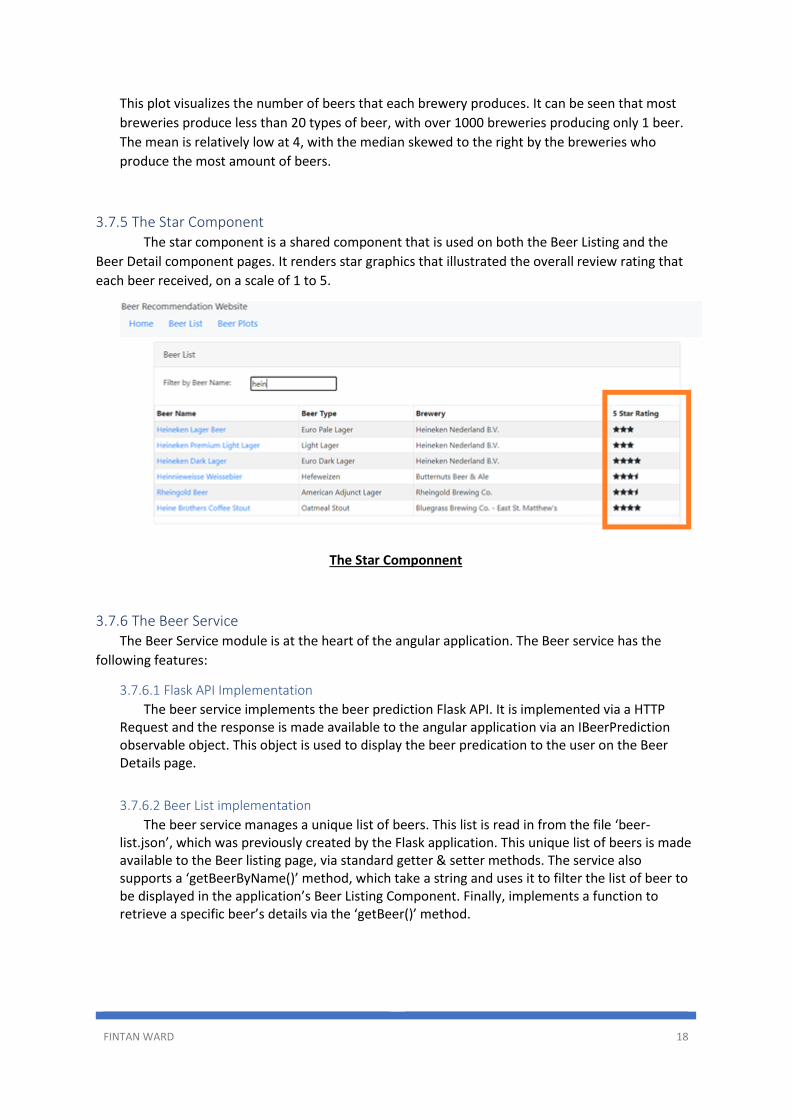
This plot visualizes the number of beers that each brewery produces. It can be seen that most
breweries produce less than 20 types of beer, with over 1000 breweries producing only 1 beer.
The mean is relatively low at 4, with the median skewed to the right by the breweries who
produce the most amount of beers.
3.7.5 The Star Component The star component is a shared component that is used on both the Beer Listing and the
Beer Detail component pages. It renders star graphics that illustrated the overall review rating that
each beer received, on a scale of 1 to 5.
The Star Componnent
3.7.6 The Beer Service The Beer Service module is at the heart of the angular application. The Beer service has the
following features:
3.7.6.1 Flask API Implementation
The beer service implements the beer prediction Flask API. It is implemented via a HTTP Request and the response is made available to the angular application via an IBeerPrediction observable object. This object is used to display the beer predication to the user on the Beer Details page.
3.7.6.2 Beer List implementation
The beer service manages a unique list of beers. This list is read in from the file ‘beer-list.json’, which was previously created by the Flask application. This unique list of beers is made available to the Beer listing page, via standard getter & setter methods. The service also supports a ‘getBeerByName()’ method, which take a string and uses it to filter the list of beer to be displayed in the application’s Beer Listing Component. Finally, implements a function to retrieve a specific beer’s details via the ‘getBeer()’ method.
FINTAN WARD 19
4 Project Testing and Evaluation The project is nearing completion and the development schedule has been adhered to. As
an emphasis was been placed on developing the Recommendation System API & Angular to
reach the milestone of an end-to-end feature request, the creation of plots based on the date
set was moved to the later part of the project. The written report and the related presentation
are under active development and will be the last part of the project to be complete.
It is expected to complete the written report and the presentation by the 21st of September. If
possible, I will submit the final report for a final review by my supervisor to ensure that the
content in the report both relevant and structured correctly.
For testing I calculated the RMSE (root mean square error) and the MAE (mean absolute
error. I also ran manual test to ensure the APIs functioned correctly, that the angular UI
performed as expected and that the beer recommendations were relevant.
4.1 Executing the Application
4.1.1 Executing the Flask application
• Open the ‘fittingModel’ folder in PyCharm
• Run the file ‘app.py’
4.1.2 Executing the Angular UI
• Open the ‘Angular-FinalProject’ folder in Visual Studio Code
• Open a terminal
• Enter the command : npm install
• Enter the command : ng serve -o
• The application will open in your browser window.
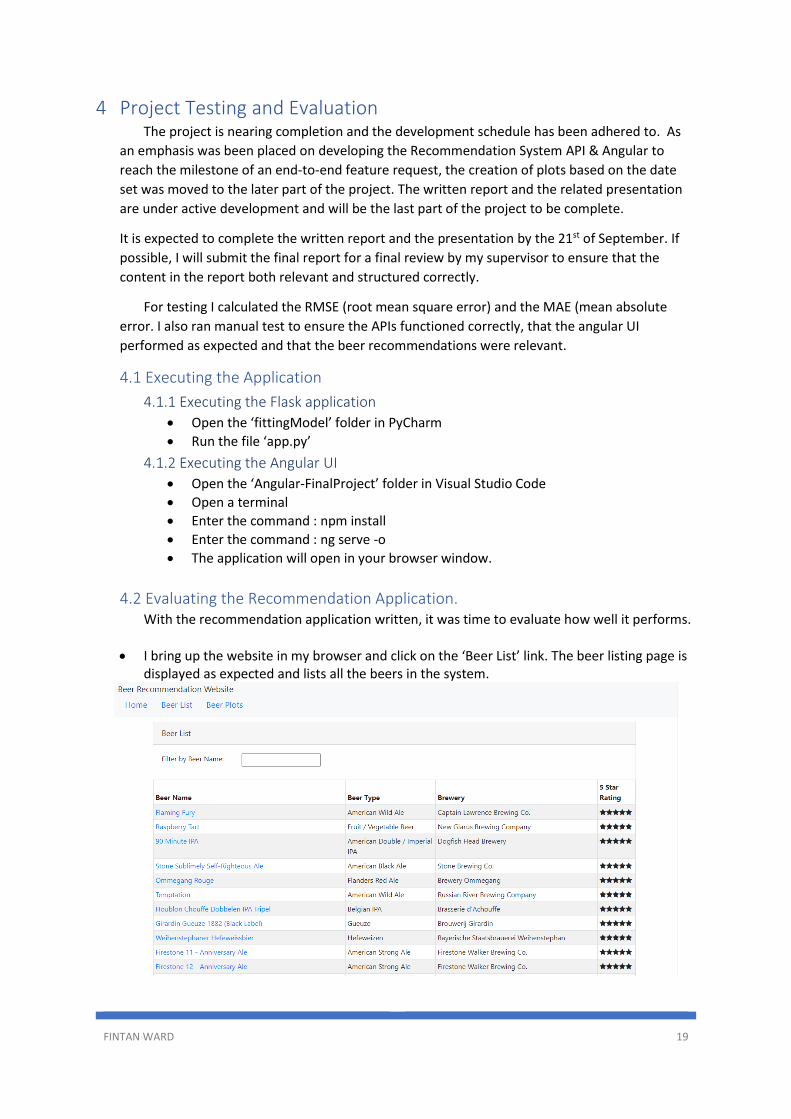
4.2 Evaluating the Recommendation Application. With the recommendation application written, it was time to evaluate how well it performs.
• I bring up the website in my browser and click on the ‘Beer List’ link. The beer listing page is displayed as expected and lists all the beers in the system.
FINTAN WARD 20
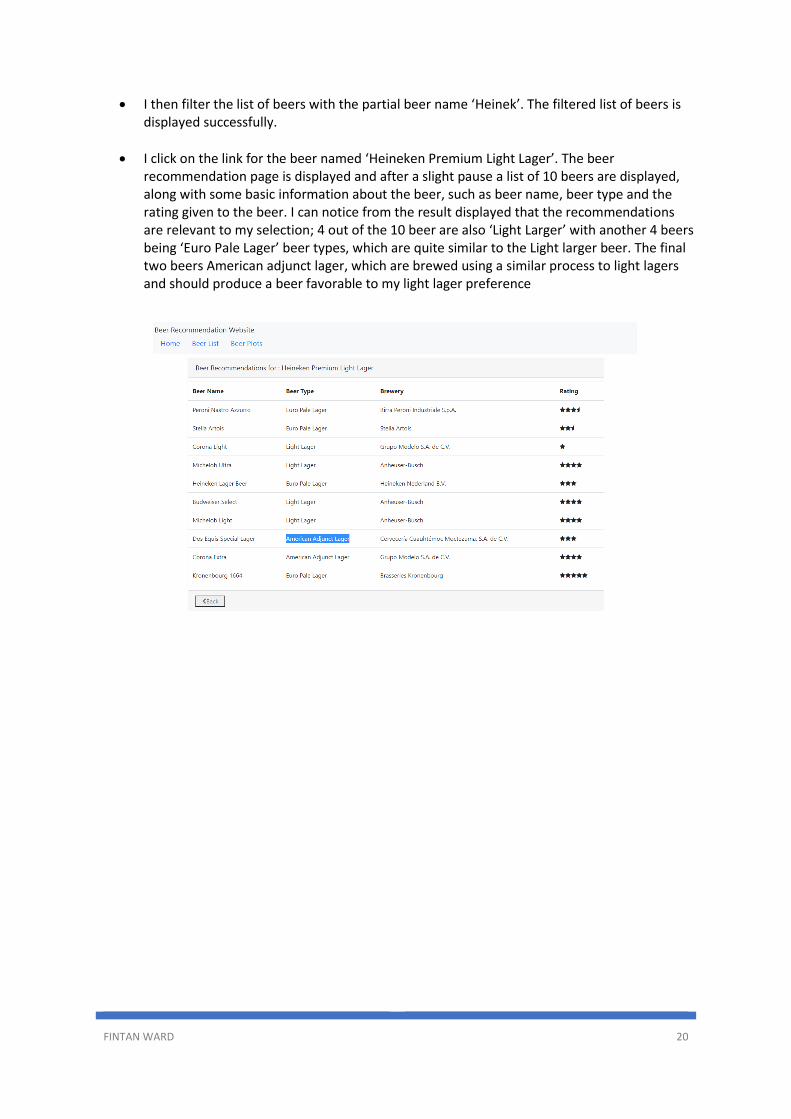
• I then filter the list of beers with the partial beer name ‘Heinek’. The filtered list of beers is displayed successfully.
• I click on the link for the beer named ‘Heineken Premium Light Lager’. The beer recommendation page is displayed and after a slight pause a list of 10 beers are displayed, along with some basic information about the beer, such as beer name, beer type and the rating given to the beer. I can notice from the result displayed that the recommendations are relevant to my selection; 4 out of the 10 beer are also ‘Light Larger’ with another 4 beers being ‘Euro Pale Lager’ beer types, which are quite similar to the Light larger beer. The final two beers American adjunct lager, which are brewed using a similar process to light lagers and should produce a beer favorable to my light lager preference
FINTAN WARD 21
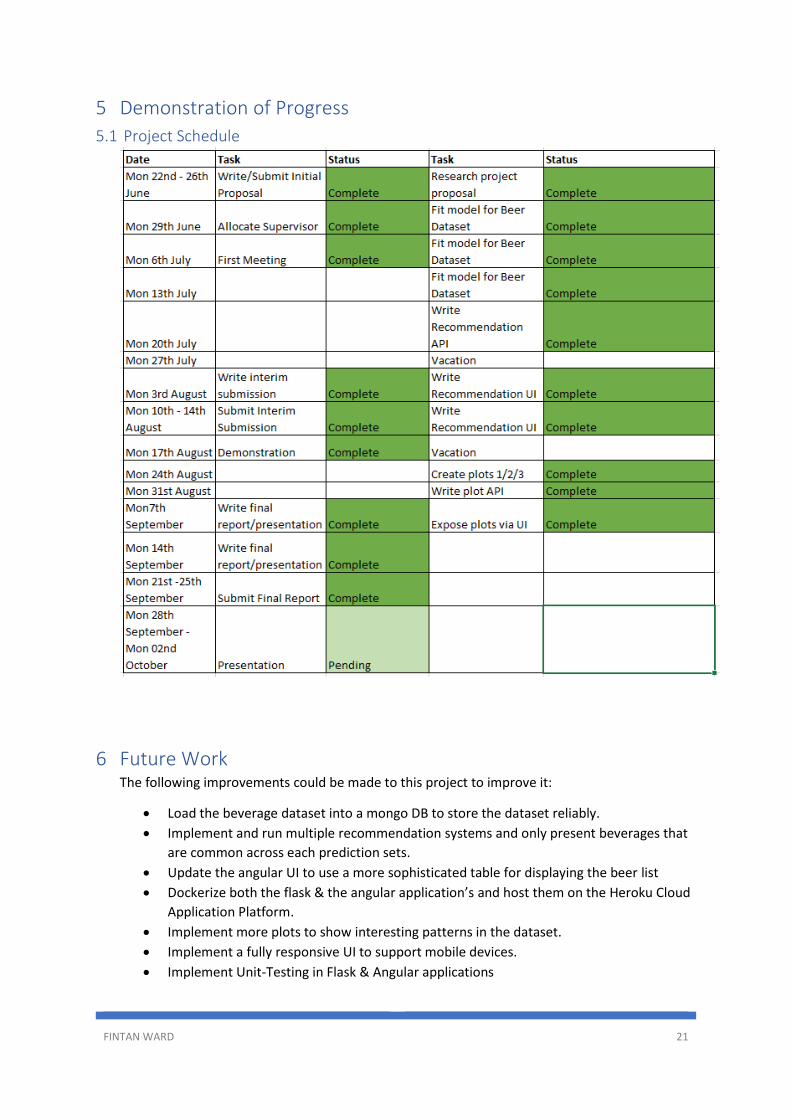
5 Demonstration of Progress
5.1 Project Schedule
6 Future Work The following improvements could be made to this project to improve it:
• Load the beverage dataset into a mongo DB to store the dataset reliably.
• Implement and run multiple recommendation systems and only present beverages that
are common across each prediction sets.
• Update the angular UI to use a more sophisticated table for displaying the beer list
• Dockerize both the flask & the angular application’s and host them on the Heroku Cloud
Application Platform.
• Implement more plots to show interesting patterns in the dataset.
• Implement a fully responsive UI to support mobile devices.
• Implement Unit-Testing in Flask & Angular applications
FINTAN WARD 22
7 References / Bibliography
BeerAdvocate (2016) ‘BeerAdvocate’. Available at:
https://data.world/socialmediadata/beeradvocate (Accessed: 10th June, 2020)
Google Web Search (2010) "Rapid Application Development (RAD..’, Available at:
https://www.google.com/search?client=firefox-b-
d&q=Rapid+Application+Development) (Accessed: 5 August 2020)
Houllette, Adam (2019) ‘Analysis of Beer Advocate Reviews Dataset: Walkthrough of a data
science take-home interview test’. Available at: https://www.ahoulette.com/2019/03/11/beer-
advocate-reviews/ (Accessed: 18th June, 2020)
Houlette, Adam (2019) ‘Getting Started’. Available at:
https://surprise.readthedocs.io/en/stable/getting_started.html (Accessed: 18th June, 2020)
Joon (2019) ‘Beer Reviews: Asking Questions’. Available at
https://www.kaggle.com/joonim/beer-reviews-asking-questions (Accessed: 12th June, 2020)
Kurta, Deborah (2020) ‘Angular: Getting Started’. Available at:
https://app.pluralsight.com/library/courses/angular-2-getting-started-update/table-of-contents
(Accessed: 12th July, 2020)
Mueller, Alexander (2018) ‘Python Plotting API: Expose your scientific python plots through a
flask API’. Available at https://towardsdatascience.com/python-plotting-api-expose-your-
scientific-python-plots-through-a-flask-api-31ec7555c4a8 (Accessed: 12th June, 2020)
Rocca, Baptiste (2019) ‘Introduction to recommender systems’. Available at:
https://towardsdatascience.com/introduction-to-recommender-systems-6c66cf15ada
(Accessed: 27th June 2020)
Sharma, Aditya (2020) ‘Introduction to recommender systems’. Available at:
https://www.datacamp.com/community/tutorials/recommender-systems-python (Accessed:
2nd August 2020)
FINTAN WARD 23
Xie, Medford (2019) ‘What to Drink Next? — A Simple Beer Recommendation System using
Collaborative Filtering’. Available at https://medium.com/@medfordxie/what-to-drink-next-a-
simple-beer-recommendation-system-using-collaborative-filtering-b65dd32b600d (Accessed:
27th June 2020)
Xie, Medford (2019) ‘Neighborhood vs Latent Factors Methods in Collaborative Filter
Recommender Systems — Part 1’. Available at
https://medium.com/@medfordxie/neighborhood-vs-latent-factors-methods-in-collaborative-
filter-recommender-systems-part-1-9f969c4990b0 (Accessed: 1st September, 2020)
8 Appendix A
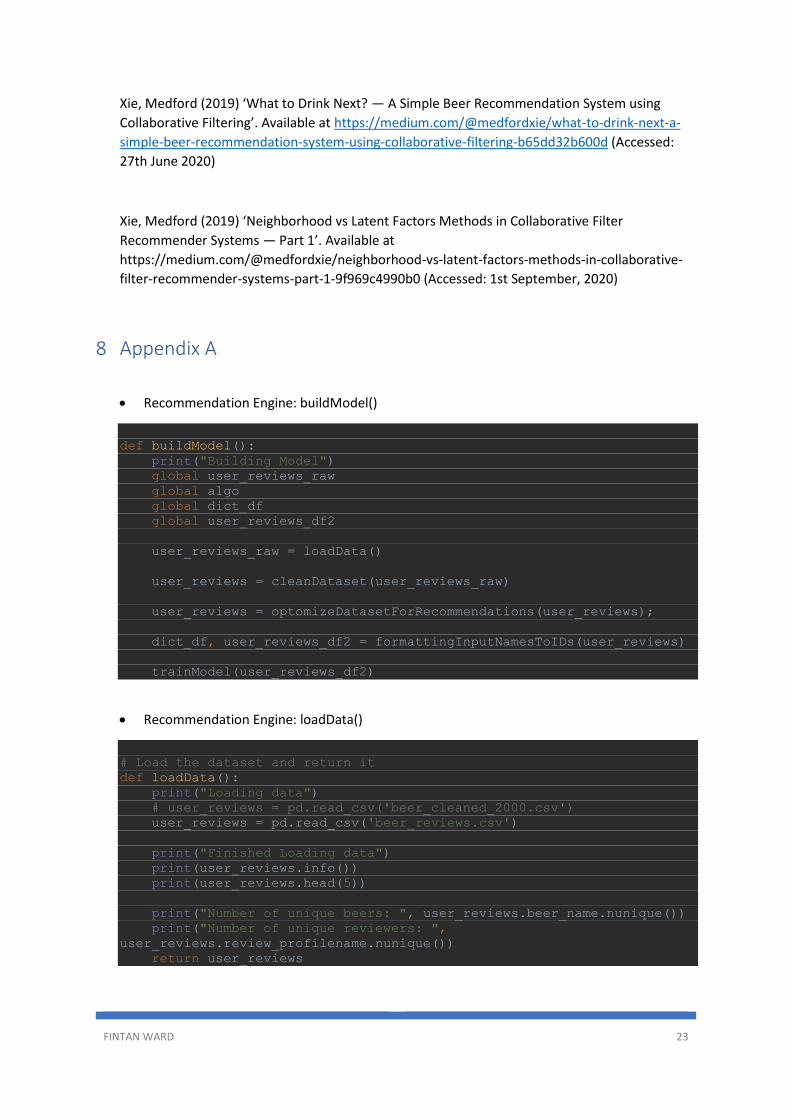
• Recommendation Engine: buildModel()
def buildModel():
print("Building Model")
global user_reviews_raw
global algo
global dict_df
global user_reviews_df2
user_reviews_raw = loadData()
user_reviews = cleanDataset(user_reviews_raw)
user_reviews = optomizeDatasetForRecommendations(user_reviews);
dict_df, user_reviews_df2 = formattingInputNamesToIDs(user_reviews)
trainModel(user_reviews_df2)
• Recommendation Engine: loadData()
# Load the dataset and return it
def loadData():
print("Loading data")
# user_reviews = pd.read_csv('beer_cleaned_2000.csv')
user_reviews = pd.read_csv('beer_reviews.csv')
print("Finished Loading data")
print(user_reviews.info())
print(user_reviews.head(5))
print("Number of unique beers: ", user_reviews.beer_name.nunique())
print("Number of unique reviewers: ",
user_reviews.review_profilename.nunique())
return user_reviews
FINTAN WARD 24
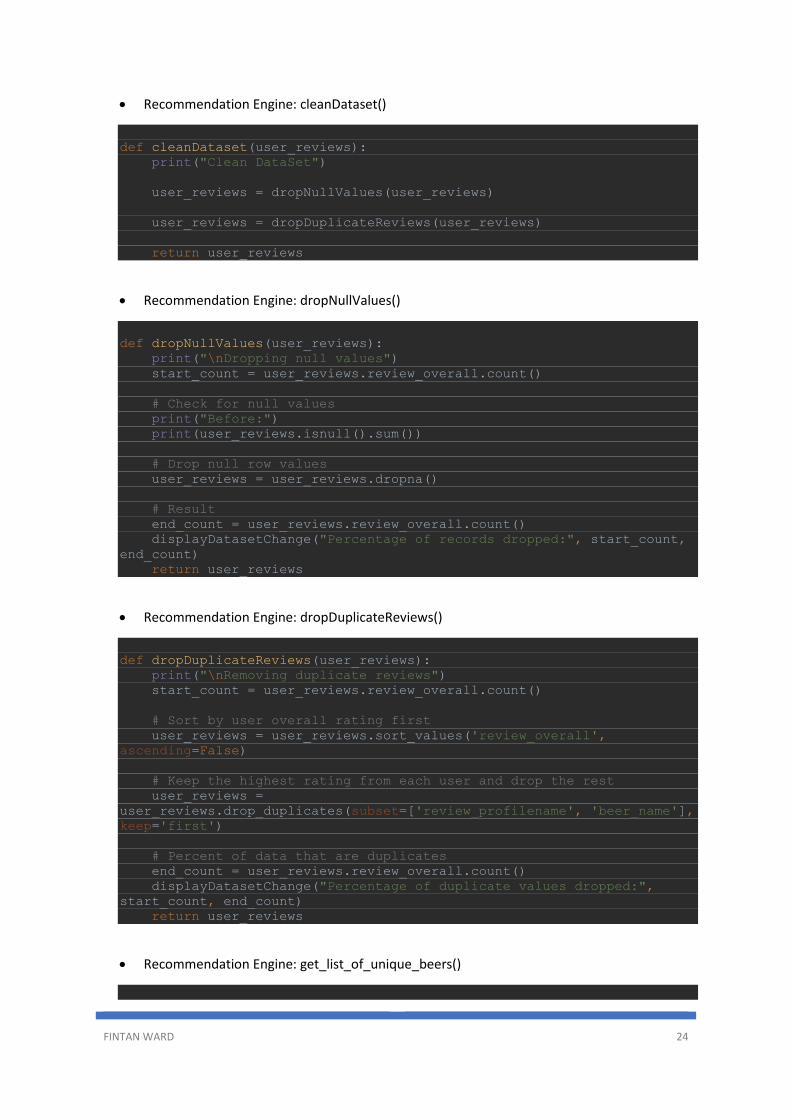
• Recommendation Engine: cleanDataset()
def cleanDataset(user_reviews):
print("Clean DataSet")
user_reviews = dropNullValues(user_reviews)
user_reviews = dropDuplicateReviews(user_reviews)
return user_reviews
• Recommendation Engine: dropNullValues()
def dropNullValues(user_reviews):
print("\nDropping null values")
start_count = user_reviews.review_overall.count()
# Check for null values
print("Before:")
print(user_reviews.isnull().sum())
# Drop null row values
user_reviews = user_reviews.dropna()
# Result
end_count = user_reviews.review_overall.count()
displayDatasetChange("Percentage of records dropped:", start_count,
end_count)
return user_reviews
• Recommendation Engine: dropDuplicateReviews()
def dropDuplicateReviews(user_reviews):
print("\nRemoving duplicate reviews")
start_count = user_reviews.review_overall.count()
# Sort by user overall rating first
user_reviews = user_reviews.sort_values('review_overall',
ascending=False)
# Keep the highest rating from each user and drop the rest
user_reviews =
user_reviews.drop_duplicates(subset=['review_profilename', 'beer_name'],
keep='first')
# Percent of data that are duplicates
end_count = user_reviews.review_overall.count()
displayDatasetChange("Percentage of duplicate values dropped:",
start_count, end_count)
return user_reviews
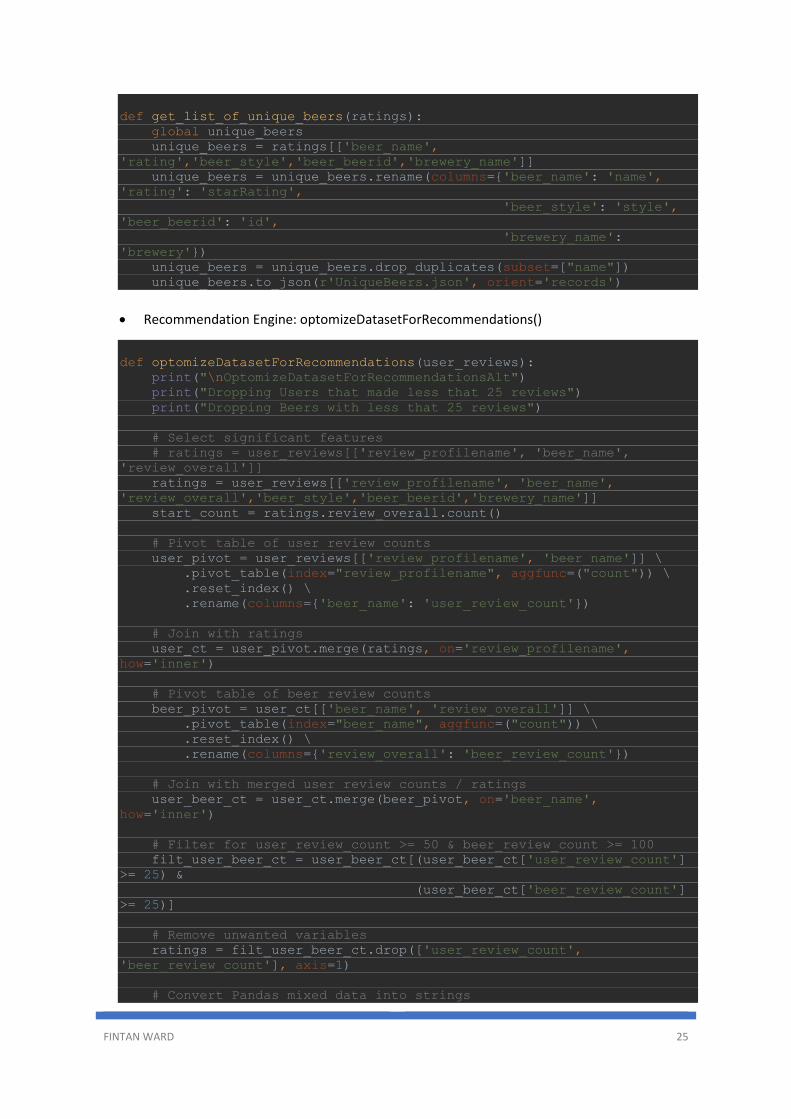
• Recommendation Engine: get_list_of_unique_beers()
FINTAN WARD 25
def get_list_of_unique_beers(ratings):
global unique_beers
unique_beers = ratings[['beer_name',
'rating','beer_style','beer_beerid','brewery_name']]
unique_beers = unique_beers.rename(columns={'beer_name': 'name',
'rating': 'starRating',
'beer_style': 'style',
'beer_beerid': 'id',
'brewery_name':
'brewery'})
unique_beers = unique_beers.drop_duplicates(subset=["name"])
unique_beers.to_json(r'UniqueBeers.json', orient='records')
• Recommendation Engine: optomizeDatasetForRecommendations()
def optomizeDatasetForRecommendations(user_reviews):
print("\nOptomizeDatasetForRecommendationsAlt")
print("Dropping Users that made less that 25 reviews")
print("Dropping Beers with less that 25 reviews")
# Select significant features
# ratings = user_reviews[['review_profilename', 'beer_name',
'review_overall']]
ratings = user_reviews[['review_profilename', 'beer_name',
'review_overall','beer_style','beer_beerid','brewery_name']]
start_count = ratings.review_overall.count()
# Pivot table of user review counts
user_pivot = user_reviews[['review_profilename', 'beer_name']] \
.pivot_table(index="review_profilename", aggfunc=("count")) \
.reset_index() \
.rename(columns={'beer_name': 'user_review_count'})
# Join with ratings
user_ct = user_pivot.merge(ratings, on='review_profilename',
how='inner')
# Pivot table of beer review counts
beer_pivot = user_ct[['beer_name', 'review_overall']] \
.pivot_table(index="beer_name", aggfunc=("count")) \
.reset_index() \
.rename(columns={'review_overall': 'beer_review_count'})
# Join with merged user review counts / ratings
user_beer_ct = user_ct.merge(beer_pivot, on='beer_name',
how='inner')
# Filter for user_review_count >= 50 & beer_review_count >= 100
filt_user_beer_ct = user_beer_ct[(user_beer_ct['user_review_count']
>= 25) &
(user_beer_ct['beer_review_count']
>= 25)]
# Remove unwanted variables
ratings = filt_user_beer_ct.drop(['user_review_count',
'beer_review_count'], axis=1)
# Convert Pandas mixed data into strings
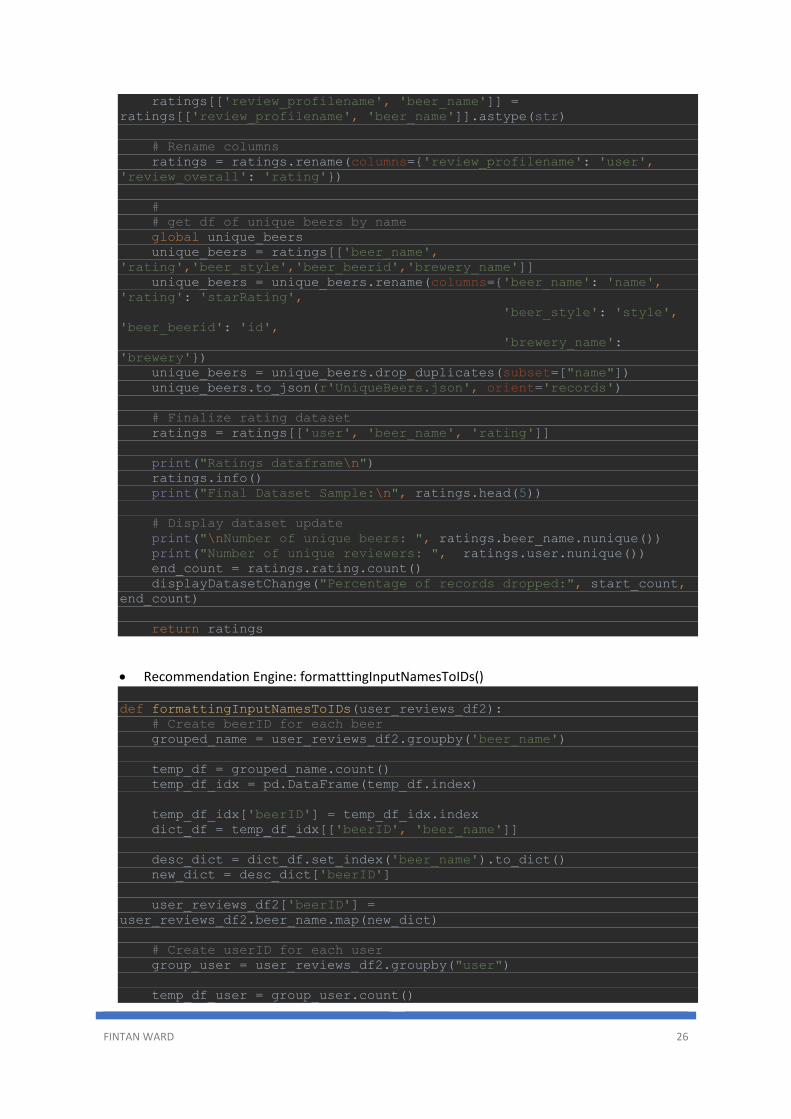
FINTAN WARD 26
ratings[['review_profilename', 'beer_name']] =
ratings[['review_profilename', 'beer_name']].astype(str)
# Rename columns
ratings = ratings.rename(columns={'review_profilename': 'user',
'review_overall': 'rating'})
#
# get df of unique beers by name
global unique_beers
unique_beers = ratings[['beer_name',
'rating','beer_style','beer_beerid','brewery_name']]
unique_beers = unique_beers.rename(columns={'beer_name': 'name',
'rating': 'starRating',
'beer_style': 'style',
'beer_beerid': 'id',
'brewery_name':
'brewery'})
unique_beers = unique_beers.drop_duplicates(subset=["name"])
unique_beers.to_json(r'UniqueBeers.json', orient='records')
# Finalize rating dataset
ratings = ratings[['user', 'beer_name', 'rating']]
print("Ratings dataframe\n")
ratings.info()
print("Final Dataset Sample:\n", ratings.head(5))
# Display dataset update
print("\nNumber of unique beers: ", ratings.beer_name.nunique())
print("Number of unique reviewers: ", ratings.user.nunique())
end_count = ratings.rating.count()
displayDatasetChange("Percentage of records dropped:", start_count,
end_count)
return ratings
• Recommendation Engine: formatttingInputNamesToIDs()
def formattingInputNamesToIDs(user_reviews_df2):
# Create beerID for each beer
grouped_name = user_reviews_df2.groupby('beer_name')
temp_df = grouped_name.count()
temp_df_idx = pd.DataFrame(temp_df.index)
temp_df_idx['beerID'] = temp_df_idx.index
dict_df = temp_df_idx[['beerID', 'beer_name']]
desc_dict = dict_df.set_index('beer_name').to_dict()
new_dict = desc_dict['beerID']
user_reviews_df2['beerID'] =
user_reviews_df2.beer_name.map(new_dict)
# Create userID for each user
group_user = user_reviews_df2.groupby("user")
temp_df_user = group_user.count()
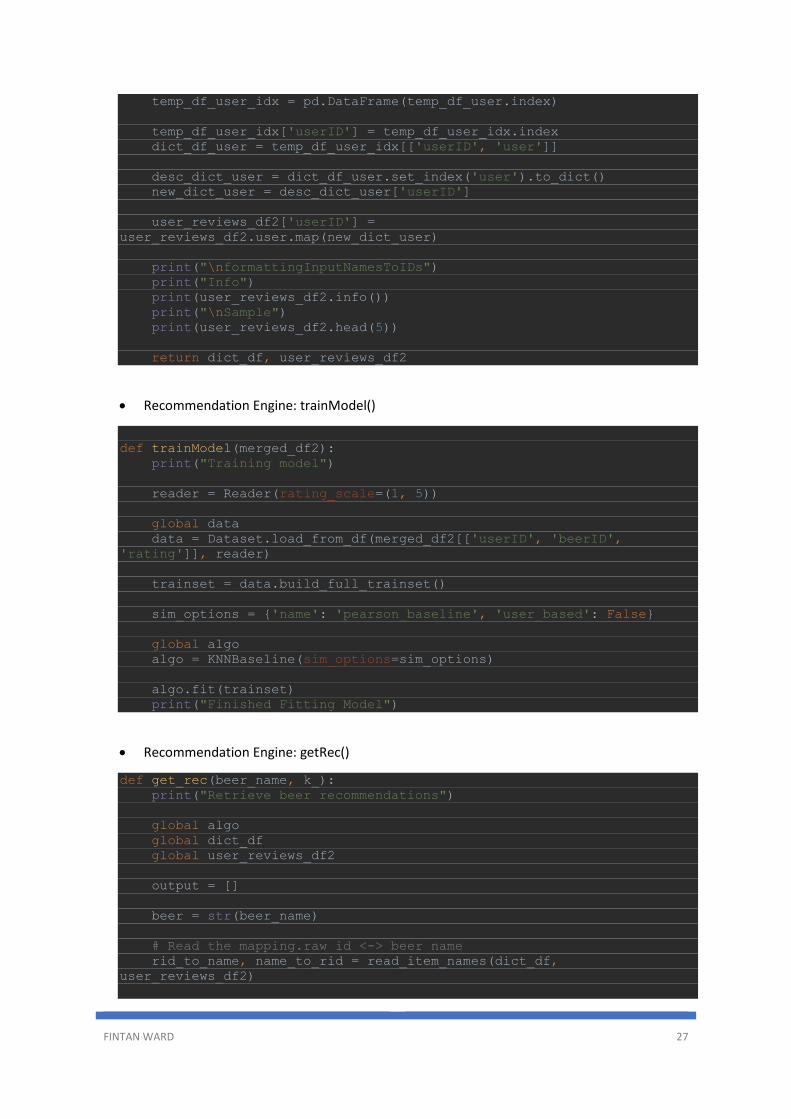
FINTAN WARD 27
temp_df_user_idx = pd.DataFrame(temp_df_user.index)
temp_df_user_idx['userID'] = temp_df_user_idx.index
dict_df_user = temp_df_user_idx[['userID', 'user']]
desc_dict_user = dict_df_user.set_index('user').to_dict()
new_dict_user = desc_dict_user['userID']
user_reviews_df2['userID'] =
user_reviews_df2.user.map(new_dict_user)
print("\nformattingInputNamesToIDs")
print("Info")
print(user_reviews_df2.info())
print("\nSample")
print(user_reviews_df2.head(5))
return dict_df, user_reviews_df2
• Recommendation Engine: trainModel()
def trainModel(merged_df2):
print("Training model")
reader = Reader(rating_scale=(1, 5))
global data
data = Dataset.load_from_df(merged_df2[['userID', 'beerID',
'rating']], reader)
trainset = data.build_full_trainset()
sim_options = {'name': 'pearson_baseline', 'user_based': False}
global algo
algo = KNNBaseline(sim_options=sim_options)
algo.fit(trainset)
print("Finished Fitting Model")
• Recommendation Engine: getRec()
def get_rec(beer_name, k_):
print("Retrieve beer recommendations")
global algo
global dict_df
global user_reviews_df2
output = []
beer = str(beer_name)
# Read the mapping.raw id <-> beer name
rid_to_name, name_to_rid = read_item_names(dict_df,
user_reviews_df2)
FINTAN WARD 28
# Retrieve inner id of the beer
beer_input_raw_id = name_to_rid[beer]
beer_input_inner_id = algo.trainset.to_inner_iid(beer_input_raw_id)
K = k_
# Retrieve inner ids of the nearest neighbours of the Beer
beer_input_neighbours = algo.get_neighbors(beer_input_inner_id, k=K)
# Convert inner ids of the neighbours into names
beer_input_neighbours = (algo.trainset.to_raw_iid(inner_id)
for inner_id in beer_input_neighbours)
beer_input_neighbours = (rid_to_name[rid]
for rid in beer_input_neighbours)
for beer_ in beer_input_neighbours:
output.append(beer_)
return output
• Recommendation Engine: get_plots()
def get_plots(plot_name):
if plot_name == 'plot1':
im = Image.open('plotMostReviewedBreweries.png')
elif plot_name == 'plot2':
im = Image.open('plotHowManyReviewsDoBeersGet.png')
elif plot_name == 'plot3':
im = Image.open('plotNumberOfUniqueBeersProduceByBreweries.png')
return im
• Recommendation Engine: plot_most_reviewed_breweries()
def plot_most_reviewed_breweries():
global user_reviews_raw
df = user_reviews_raw[['brewery_name',
'brewery_id']].groupby('brewery_name')[['brewery_id']].count()
df.sort_values('brewery_id', inplace=True, ascending= False)
print(df.info())
print(df.head(20))
print("Size: ", df.size)
array = df['brewery_id']
print("mean :", array.mean())
print("median :", array.median())
n, bins, patches = plt.hist(array, bins=15742, facecolor='blue',
alpha=0.7, rwidth=0.85)
plt.axis([1,300, 0, 1500])
plt.title('Number of Reviews for each Brewery')
plt.xlabel('# of Breweries')
plt.ylabel('# of Reviews')
plt.axvline(array.mean(), color='r', linestyle='--')
plt.axvline(array.median(), color='y', linestyle='--')
plt.legend(['mean', 'median'])
FINTAN WARD 29
# Save image
plt.savefig('plotMostReviewedBreweries.png', bbox_inches='tight')
# Display the plot
plt.show()
• Recommendation Engine: plot_how_many_reviews_do_beers_get()
def plot_how_many_reviews_do_beers_get():
global user_reviews_raw
beer_review_count = user_reviews_raw['beer_beerid'].value_counts()
beer_review_count
print("mean :", beer_review_count.mean())
print("median :", beer_review_count.median())
plt.hist(beer_review_count,
bins=[1,2,3,4,5,6,7,8,9,10,11,12,13,14,15,16,17,18,19,20,
21,22,23,24,25,26,27,28,29,30,
31,32,33,34,35,36,37,38,39,40,
41,42,43,44,45,46,47,48,49,50,
51,52,53,54,55,56,57,58,59,60,
61,62,63,64,65,66,67,68,69,70,
71,72,73,74,75,76,77,78,79,80,
81,82,83,84,85,86,87,88,89,90,
91,92,93,94,95,96,97,98,99,100],
facecolor='blue', alpha=0.7,
rwidth=0.85)
plt.axis([1,50, 0, 24000])
plt.title('How Many Reviews Do Beers Get?')
plt.xlabel('# of Reviews')
plt.ylabel('# of Beers')
plt.axvline(beer_review_count.mean(), color='r', linestyle='--')
plt.axvline(beer_review_count.median(), color='y', linestyle='--')
plt.legend(['mean', 'median'])
# Save image
plt.savefig('plotHowManyReviewsDoBeersGet.png', bbox_inches='tight')
# Display the plot
plt.show()
• Recommendation Engine: plot_number_of_unique_beers_produce_by_breweries()
def plot_number_of_unique_beers_produce_by_breweries():
# Create DF of my many unique beers each brewery produced
global user_reviews_raw
df = user_reviews_raw[['brewery_name',
'beer_beerid']].drop_duplicates(subset=['brewery_name', 'beer_beerid'])
\
FINTAN WARD 30
.groupby('brewery_name')[['beer_beerid']].count()
df.sort_values('beer_beerid', inplace=True, ascending=False)
print("mean :", df[['beer_beerid']].mean())
print("median :", df[['beer_beerid']].median())
print(df[['beer_beerid']].describe())
array = df['beer_beerid']
# Create the plot
plt.hist(array,
bins=[1,2,3,4,5,6,7,8,9,10,11,12,13,14,15,16,17,18,19,20,
21,22,23,24,25,26,27,28,29,30,
31,32,33,34,35,36,37,38,39,40,
41,42,43,44,45,46,47,48,49,50,
51,52,53,54,55,56,57,58,59,60,
61,62,63,64,65,66,67,68,69,70,
71,72,73,74,75,76,77,78,79,80,
81,82,83,84,85,86,87,88,89,90,
91,92,93,94,95,96,97,98,99,100],
facecolor='blue', alpha=0.7,
rwidth=0.85)
plt.axis([1,100, 0, 1100])
plt.title('Number Of Unique Beers Produced By Breweries')
plt.xlabel('Number of Beers Produced')
plt.ylabel('Number of Breweries')
plt.axvline(array.mean(), color='r', linestyle='--')
plt.axvline(array.median(), color='y', linestyle='--')
plt.legend(['mean', 'median'])
# Save image
plt.savefig('plotNumberOfUniqueBeersProduceByBreweries.png',
bbox_inches='tight')
# Display the plot
plt.show()
• Recommendation Engine: evaluate_model()
def evaluate_model():
print("Running 5-fold cross-validation and printing results - Please
Wait...")
cross_validate(algo, data, measures=['RMSE', 'MAE'], cv=5,
verbose=True)
• Recommendation Engine: Main
FINTAN WARD 31
if __name__ == '__main__':
app.run(debug=False)
print("Fit model and keep it in memory")
buildModel()
app.logger.info("Getting a prediction")
result = get_rec("Founders KBS (Kentucky Breakfast Stout)", 10)
app.logger.info("Prediction :")
app.logger.info(result)
json_str = json.dumps(result)
app.logger.info("Prediction JSON:")
• Recommendation Engine: predict_beer_api()
@app.route('/predictBeerApi', methods=['GET'])
def predict_beer_api():
predictions_json = json.loads(json.dumps( predictBeer()))
return Response(predictions_json, mimetype='application/JSON')
• Recommendation Engine: predictBeer()
def predictBeer():
app.logger.info("predicting beer")
beer_name = request.args.get('beer_name')
app.logger.info("beer_name [" + beer_name + "].")
predictions = get_rec(beer_name, 10)
# Create JSON string
predictions_str = "["
for x, beer in enumerate(predictions):
predictions_str = predictions_str + "{\"name\": \"" + beer +
"\"},"
predictions_str = predictions_str.rstrip(',')
predictions_str = predictions_str + "]"
return predictions_str
• Recommendation Engine: image_to_byte_array()
def image_to_byte_array(image:Image):
img_byte_arr = io.BytesIO()
image.save(img_byte_arr, format=image.format)
img_byte_arr = img_byte_arr.getvalue()
return img_byte_arr
• Recommendation Engine: get_plot()
@app.route('/plots/plot1', methods=['GET'])
def get_plot():
plot_name = request.args.get('plot')
print("plot_name :" + plot_name)
img = get_plots(plot_name)
bytes_image = image_to_byte_array(img)
return send_file(io.BytesIO(bytes_image),

FINTAN WARD 32
attachment_filename='plot.png',
as_attachment=True,
mimetype='image/png')