bedload transport in se asian streams—uncertainties … i: review of bedload studies in southeast...
TRANSCRIPT
Geomorphology 227 (2014) 31–48
Contents lists available at ScienceDirect
Geomorphology
j ourna l homepage: www.e lsev ie r .com/ locate /geomorph
Review
Bedload transport in SE Asian streams—Uncertainties and implicationsfor reservoir management
Alan D. Ziegler a,⁎, R.C. Sidle b, Valerie X.H. Phang a, Spencer H. Wood c, Chatchai Tantasirin d
a Geography Department, National University of Singapore, Singaporeb Environmental Protection Agency, Ecosystems Research Division, Athens, GA, USAc Department of Geological Sciences, Boise State University, Boise, ID, USAd Department of Conservation, Faculty of Forestry, Kasetsart University, Bangkok, Thailand
⁎ Corresponding author: Geography Department, 1 AUniversity of Singapore, 117568, Singapore.
E-mail address: [email protected] (A.D. Ziegler).
http://dx.doi.org/10.1016/j.geomorph.2014.01.0150169-555X/© 2014 Elsevier B.V. All rights reserved.
a b s t r a c t
a r t i c l e i n f oArticle history:Received 2 March 2013Received in revised form 5 November 2013Accepted 28 January 2014Available online 4 February 2014
Keywords:Bedload-to-sediment ratioSediment yieldRoad impactsMass wastingDam buildingAgriculture intensification
This paper reviews the current state of knowledge regarding bedload transport in SE Asian streams and presentsthe results from a case study on bedload transport in a mountain stream in northern Thailand. Together, thereview and new data help contextualize the paucity of work done in the region in the face of a rapid increasein development and reservoir building throughout SE Asia. Data from both the reviewed studies and thecase study indicate that bedload transport in many SE Asian streams (e.g. catchment areas b 100 km2) is oftenmuch higher than is commonly assumed for tropical streams (i.e., about 10% of the total sediment load). Estimat-ed annual bedload proportion was 18% of the total annual sediment load in the 74-km2 Mae Sa Catchment innorthern Thailand. Bedload transport rates ranged from 0.001 to 1.1 kg s−1; and measured total suspendedsolid (TSS) rates ranged from 0.01 to 39 kg s−1, equivalent to TSS concentrations of 20 to 14,000mg l−1 (associ-atedwithflows ranging from0.4 to 30m3 s−1). Event and annual loads of bedload and TSSwere determined fromrating curves based on automated measurements of discharge and turbidity (for TSS only). When taking uncer-tainty into account, the estimated range for the bedload proportion of total sediment loadwas 9–25% (equivalentto a yield of 81–279Mgkm−2y−1). The corresponding TSS yield estimate ranged from649 to 1037Mgkm−2; andthe total sediment load is an estimated 730–1313Mg km−2 y−1. The proportion of bedload was lower than thatreported in some other Asia streams, probably due to the occurrence of extended periods with high TSS thatdampened the bedload signal, which was sand-dominated during the low-energy events that were sampled.Nevertheless, the bedload ratewas generally higher than formost SE Asian locations, likely due to the occurrenceof several road-related landslides the previous year. Althoughwewere not able tomeasure bedload transport forhigh energy flows (discharges N 4.5 m3 s−1), we believe our upper estimates for bedload variables (25% of thetotal sediment load; and a yield of 279 Mg Km−2 y−1) provide reasonable upper bounds. Finally, the bulk ofbedload transport is episodic in nature, with a higher proportion moved during high energy tropical stormsthat occur late in the monsoon rainy season, as well as in response to both natural and anthropogenic landscapedisturbances. The possibility that bedload proportion could exceed 20–40% for rivers and streams of various sizesreinforces the need for accurate estimates of both bedload and suspended solid loads prior to building dams inthe region. Past examples of reservoir closure following rapid infilling possibly stem from underestimating sed-iment loads, particularly the bedload component, and failing to factor in the very high sediment loads associatedwith large storm events.
© 2014 Elsevier B.V. All rights reserved.
1. Introduction
Bedload and total suspended solids (TSS) comprise the total sedi-ment load of rivers and streams. Whereas bedload is the portion ofsolid material transported by rolling, bounding, and sliding along thechannel bed (saltation processes), TSS are carried in suspension in thewater column (Gomez, 1991). Depending on the size of material and
rts Link, Kent Ridge, National
energy of the flowing water, solid material may interchange betweenbedload and TSS components on its journey through a river system(Church, 2006). The interplay of sediment size, discharge energy, ante-cedent storm history, channel bed conditions, channel obstructions, andstorage causes bedload transport rates and residence time in any onestream system to vary across several orders of magnitude (Sidle,1988; Hoey, 1992; Smith et al., 1993a; Habersack et al., 2001; Churchand Hassan, 2002; Yu et al., 2009; Turowski et al., 2010).
Bedload and TSS transport, both natural processes, vary substantiallyacross river catchments of differing geology, climate, vegetation, andland cover (Church, 2006; Hinderer, 2012). Anthropogenic activities

32 A.D. Ziegler et al. / Geomorphology 227 (2014) 31–48
producing landslides and accelerating erosion affect the generation anddelivery of sediment into and through a stream system (Douglas, 1999;Sidle et al., 2006). Large episodic flushes of sediment may also be asso-ciatedwith extremeweather events or catastrophic events, such as dambreaks (Wasson, 2008; Korup, 2012). Discharge becomes an importantcontrolling factor of bedload transport when sediment supply isnot limited. Sediment transport is affected by the availability oftransportable material, which is related to linkages between the chan-nel and hillslope sources as well as the structure and stability of thestream channel bed or bank (Dietrich et al., 1989; Church et al., 1998;Buffington and Montgomery, 1999; Hassan and Church, 2000; Gomiand Sidle, 2003; Recking, 2012).
Sediments are vital in maintaining aquatic habitats such as poolsand sand bars in river channels, flood plain soils, and wetlands; theyalso contribute to the formation of downstream deltas (Colemanand Wright, 1975; Smith et al., 1993b; Yarnell et al., 2006). Bedloadand TSS estimates are essential components of catchment sedimentbudgets (Slaymaker, 2003; Parsons, 2011), and are therefore useful formanaging river systems where sediment may interfere with ecologicalprocesses, flood control, water quality, or water storage (Nagle et al.,1999; Annandale, 2006). They are also paramount for the estimationof reservoir filling rates and dam lifetimes.
Bedload studies are time-consuming and labor-intensive; and mea-surements are potentially risky during large rainfall–runoff events, evenin small streams (Garcia et al., 2000; Turowski et al., 2010). Because ofthese difficulties, bedload is often omitted from total sediment load es-timates; or it is assumed to be a small percentage of the total load (e.g.,Milliman and Meade, 1983; Nagle et al., 1999; Wang et al., 2011).Worldwide, the bedload proportion (BLp) of the total sediment load isbelieved to be about 10 to 20% for rivers in general and 20 to N40% formountain streams (Sidle, 1988; Turowski et al., 2010). In some environ-ments, such as the arid regions and ephemeral streams, bedload ratesmay be exceptionally high, exceeding 50–70% of the total load (e.g.,Laronne and Reid, 1993; Rovira et al., 2005). Only limited work hasbeen conducted on bedload in tropical streams, but generally BLp hasoften been considered to be quite low (e.g., ~10%; cf. Nagle et al., 1999).
Thailand, for example, has an extensive network of small-to-largereservoirs constructed onmany river systems to provide water for agri-culture, domestic, and commercial use. While suspended sedimentrating curves are calculated routinely for several rivers and streams bythe Thai Royal Irrigation Department, detailed studies of bedload pro-cesses have not been a priority (e.g., Ziegler et al., 2000). To date,there has only been one other published bedload study conducted inThailand to guide decisions (Ziegler et al., 2000). In that study, thebedload proportion to the total load was 30%. The paucity of publishedbedload data in the SE Asia region is egregious given current plans ofbuilding a large number of dams in the coming decades (Wang et al.,2011; Ziegler et al., submitted for publication).
This paper reviews the available data for SE Asian streams and pre-sents results from a bedload monitoring experiment conducted inthe 74-km2 Mae Sa catchment in northern Thailand. The Mae Sa Riveris a tributary into the Ping River, one of the largest rivers in northernThailand, on which the multi-purpose Bhumipol dam is located.Although the research was conducted on a relatively small river, webelieve our results, when combined with the regional bedload datafrom the reviewed case studies, will provide information to guidemanagement decisions in river systems where bedload transport isvery difficult to measure.
2. Part I: review of bedload studies in Southeast Asia
Review of the literature uncovered bedload information on a hand-ful of SE Asian river and stream systems in Cambodia, southernChina, Indonesia, Lao PDR, Malaysia (both Peninsular and insular),Papua New Guinea, the Philippines, Thailand, Timor Leste andVietnam (Table 1). In the review we have included Hong Kong and
Papua New Guinea to increase the data pool, even though they arenot part of SE Asia by most political definitions. Most work has beendone in Malaysia; and no information was found for Brunei,Myanmar or Singapore. The studies were inconsistent in scope anddata collection protocol, as well as in the level of detail in the reportingof the results and associated errors.
Early work in the Cameron Highlands, Malaysia, Shallow (1956) de-termined bedload yields associated with different ‘treatments’of steepland agriculture in three forested catchments varying incatchment areas: Sungai (Malay for river; abbreviated as Sg.) Telom(77.7 km2); Sg. Kial (21.4 km2); and Sg. Bertam (75.2 km2). Bedloadwas measured with box traps embedded into the stream channel.Differences in bedload yields ranging from 25.7 to 70.1 Mg km−2 y−1
did not appear to be related to the intensity of agriculture. The catch-ment with the greatest degree of forest conversion (36% reduction inforest in Bertam) had a bedload yield intermediate of the other twocatchments with higher forest cover (70 and 94%). The bedload propor-tion to the total load was higher in catchments with the least amount offorest disturbance.
In a long-term experiment, Kasran (1996) determined bedload yieldin the small logged Jengka Experimental Basin at Pahang in PeninsularMalaysia from 1980 to 1989. The forested catchment had an area of0.28 km2 and a mean slope of 28%. Bedload was measured in 4 × 3 msediment traps at six month intervals. Annual bedload yield increasedmodestly from 10 to 19 Mg km−2 y−1 during the pre-logging phase to14–30 Mg km−2 y−1 following logging. Although bedload yield washigher in the post-logging phase, its proportion to the total sedimentload decreased from 60% to 45%, indicating that an increase inlogging-associated TSS overwhelmed the proportion of the naturallyhigher bedload.
Lai (1993) investigated the impacts of logging by comparing bedloadyields in four catchments on the western flank of the Main Range inPeninsular Malaysia (1988–1989): Sg. Lawing (4.7 km2); Sg. Chongkak(12.7 km2); Sg. Batangsi (19.8 km2); and Sg. Lui (68.1 km2). The catch-ments were moderately steep, with slopes ranging from 34 to 40%.Channel bed material ranged in size from sand to boulders. Bedloadtransport was determined from rating curves established frommeasurements made with a Helley–Smith sampler. Very high bedloadyields of 1264 Mg km−2 y−1 were calculated for the Sg. Batangsi catch-ment, where commercial logging generated stream sediment inputsfrom both steep logged hillslopes and the logging road network. Thebedloadproportionwas31% of the total sediment yield. In theunlogged,forested Lawing catchment, bedload yield was 125 Mg km−2 y−1, anorder of magnitude lower, but BLp was 70%. Following commercial log-ging in Sg. Lawing in 1993, bedload yield increased by more than threetimes the unlogged condition (Lai et al., 1995). Bedload yield was rela-tively high (333–619 Mg km−2 y−1) in Sg. Chongkak, where logginghad ended a year before the studywas initiated in 1988; and BLp consti-tuted 20% (note that Chappell et al. (2005) reported a much lowervalue: b1%, which is b2 Mg km−2 y−1). In the largest catchment (Sg.Lui; 68 km2), bedload yield was the lowest of the four rivers investigat-ed (22 Mg km−2 y−1), perhaps because logging had ceased a decadeprior to measurement. The lower yield may also be a characteristic ofthis lower gradient river system with enhanced storage opportunities—features that often differentiate larger verses smaller catchments. Lai(1993) noted high bedload rates occurred during high rainfall periods,indicating the importance of stream energy on bedload transport inthis particular system where transportable material was not limited.He also called attention to the role of road construction and logging inelevating sediment yields in some of the catchments.
Lai and Detphachanh (2006) studied bedload yield in the 2.6-km2
Sungai Pansun catchment in Selangor, Peninsular Malaysia, for ayear extending from 1997 to 1998 (Table 1). y−1 and 11.4 Mg km−2 y−1,respectively. Theweir pool estimates were considered superior becausethey captured the entire sediment cumulative load. The BLp was an es-timated 33%. Two major storm events contributed 45% of the annual
33A.D. Ziegler et al. / Geomorphology 227 (2014) 31–48
bedload yield. Furthermore, large events exhausted the supply ofbedload material. Bedload transport (BLi; kg s−1) had the followingrelationship with discharge (Qi; m3 s−1):
BLi ¼ 0:0017Qi1:0013
: ð1Þ
The authors postulated that bedloadyieldwas lowbecause the studywas conducted in a dry year with reduced stream flow energy. They ex-pected that under normal conditions, not only would the total yield in-crease, but bedloadwould possibly contribute to a greater proportion ofthe total sediment load. This would obviously require the suspendedsolid load to not increase proportionally.
Also in Selangor, Peninsular Malaysia, Yusop et al. (2006) moni-tored the bedload yield in two steep catchments, C1 and C2, at BukitTarek from 1991 to 1994 (Table 1). Both experimental catchmentsare similar in size, but had differing slopes, 33 versus 45% at C1 andC2, respectively. Vegetation consisted of secondary forest that had re-generated 25–30 years following the cessation of logging operationsin the early 1960s. The channel bed was composed of sandy clay mate-rial and bedload material was generally sand-sized or smaller. Bedloadmeasurements were determined by measuring sediment accumulationbehind weirs. Both catchments had relatively low mean bedloadyields: 13 and 14 Mg km−2 y−1, for C1 and C2 respectively. However,annual variability was high, ranging from 6 to 28 Mg km−2 y−1 at C1and 10–20 Mg km−2 y−1 at C2. This great variation was indicativeof the strong influence of episodic storm events on bedload transportas well as the potential for storage behind accumulations of woody de-bris. Unfortunately, they were unable to quantify TSS in the study, thusthere is no estimate of BLp for these disturbed catchments.
Geoffrey and Yusop (2005) performed a brief study in 2004–2005on the bedload transport in the small (b1 km2) regenerated forestcatchment of Sg. Kebow in Sarawak, Malaysia. Bedload measurementswere made with a Helley–Smith sampler during the six wettest (on av-erage) months of the year (Oct 2004–March 2005). Bedload yield of1.8 Mg km−2 y−1 was determined from the following equationestimating total bedload (BLT, Mg) from river discharge during asampling period (Q; m3 s−1):
BLT ¼ 0:0005 Q0:5895: ð2Þ
The highest estimated monthly bedload yield was recorded inDecember, the month with the highest stream flow. Thus, the highvalues were a result of determining bedload transport from Eq. (2).The authors reported that large episodic events had a strong influenceon the bedload transport at the site.
In comparison with Eqs. (1) and (2), Sirdari (2013) developed thefollowing bedload rating equations for theKurau, Lui, and Semenyih riv-ers in Malaysia:
BLi ¼ 0:164 Qi1:314
: ð3Þ
New data were collected with a Helley–Smith sampler on six sand-gravel bed reaches of the Kurau River during flows ranging from 0.55to 12.79 m3 s−1. The data were then combined with those determinedon the Lui and Semnyih Rivers by Ariffin (2004) to create the equation.Chang and Ab. Ghani (2011) report a similar equation for the Sg.Kumlin:
BLi ¼ 0:171 Qi0:82
: ð4Þ
In general, most recent work in Malaysia has involved short-termbedload data collection to develop transport equations to study theimpacts of river sand-mining or reservoir sedimentation (e.g., Yahaya,1999; Ab. Ghani et al., 2003; Chang, 2006; Chang et al., 2007;Azamathulla et al., 2009; Sinnakaudan et al., 2010; Ab. Ghani et al.,2011; Talib et al., 2012).
Elsewhere in SE Asia, bedload rates have been determined for a fewlocations in Java, Indonesia (Table 1). Bruijnzeel (1983) reported a yieldof 44 Mg km−2 y−1 for the 0.187-km2 Mondo River catchment, whichhad been converted to forest plantation. The BLp was only 13%, largelybecause of a high TSS yield (209-313 Mg km−2 y−1). Rijsdijk (2012)provide data for the upper and lower sections of three river systems inthe Konto basin of Java: Coban, Manting, and Sayang rivers. In allcases, the upper catchments were less disturbed than their lower coun-ter parts which had higher estimated bedload yields. Mean bedloadyield increased from b1 to 66Mg km−2 y−1 from the forested (88% for-est cover), 11.7-km2 upper Coban Rondo catchment to a lower site,which drained a 21.62-km2 area. Swidden agriculture was an importantland cover in the lower catchment. The BLp values were very low forboth locations: 1.8 versus 6.7%. The Manting upper and lower catch-ment areas were very similar (3.88 to 4.6 km2), but had very differentyields (means= 0.5 versus 4Mg km−2 y−1). Values of BLp were similar(0.5 versus 3.6%). Sayang showed a 60% increase in bedload yield be-tween upper (3.41 km2) and lower catchment (12.33 km2) sites(means = 46 versus 74 Mg km−2 y−1). In this case, however, BLp re-duced from 11.9% in the upper catchment to 6.3% downstream.
The Management of Soil Erosion Consortium (MSEC) project in-cluded bedload experiments in their study of 27 experimental catch-ments located in Indonesia, Lao PDR, the Philippines, Thailand, andVietnam (Table 1). Annual bedload was measured behind weirsdraining sub-catchments ranging in size from less than 1 to more than250-km2 (Table 1). Catchment treatments included traditional versusimproved farming methods. Technical difficulties limited the resultsthat could be derived from many of the catchments (summarized byValentin et al. (2008)). However, some data are reported on the projecthomepage (http://msec.iwmi.org/) and in various project reportsor follow-on works (Maglinao and Valentin, n.a.). Collectively, theMSEC data suggest bedload yields across the region are high (44 to869 Mg km−2 y−1) for these agriculture-dominated catchments. Inthe 0.67-km2 Huay Pano catchment (Lao PDR), bedload yield rangedfrom 69 to 117 Mg km−2 y−1; and BLp ranged from 35 to 59%. In con-trast, bedload yields in the 0.96-km2 Dong Cao catchment (Vietnam)were higher (99–322 Mg km−2 y−1), but BLp was lower (23%). Limiteddata at the 0.92-km2 Huai Ma Nai site in Thailand indicate very highbedload yields: 95–869 Mg km−2 y−1. Bedload yields reported forfour small (b0.12 km2) sub-catchments of mixed agriculture atHuai Ma Nai ranging from 32 to 129 Mg km−2 y−1 for the rainy sea-son of 2003 (Bricquet et al., 2004). The BLp for two of the sites wasover 60%; but it was only 20% for a third subcatchment. At the1.39-km2 Babon study catchment in Indonesia, bedload yieldsranged from 158 to 174 Mg km−2 y−1, occupying 29–88% of the esti-mated total loads. Bedload yield at the 0.91-km2 Mapawa catchmentin the Philippines was higher (301–517Mg km−2 y−1), but BLp couldnot be quantified because of difficulties in measuring suspendedsediment.
Data for Cambodia, Hong Kong, Papua NewGuinea, Timor Leste, andVietnam are few and of unknown quality (Table 1). For example, verylow bedload yields of 0.06 and 0.7 Mg km−2 y−1 were reported for theStung Sen and the Stung Ksach Toch rivers in Cambodia (Douglas, 1999;Carbonnel and Guiscafre, 1965). The bedload yield (112 Mg km−2 y−1)for the Fly River in Papua New Guinea is based on Walsh and Ridd's(2008) estimation that fine sediment comprises 90% of total sedimentload, 1118 Mg km−2 y−1 (from Harris et al. (1993)). The only data forTimor Leste are estimates of the bedload proportion of the total sedimentload—up to 50% in the Laclo and Caraulun rivers (Alongi et al., 2009).Douglas (1999) provides limited bedload information for the SesanRiver at Kontum (2910-km2) and Trung Nhia (3139-km2) in Vietnam.The proportion of bedload to the total load was an estimated 5–64%—and a value of 20% was assumed to be the mean. In a small (b1-km2)urban basin in Hong Kong, Peart and Fok (2006) found annual sedimentyields ranging from 0.4 to 3.9 Mg km−2 y−1 with a mean bedload yieldof 1.3 Mg km−2 y−1during a 15-year study conducted between 1989

Table 1Summary of studies conducted in SE Asia region reporting data for which bedload yield (BLyield), suspended sediment yield (TSSyield), and the fraction of the total load that is bedload (BLp).
Referencea Area km2 BLyield Mg km−2y−1 TSSyield Mg km−2 y−1 BLp % Site note Typeb Time Note
Stung Sen at K. Chamlang (Cambodia)1 16200 0.062 0.61 9 Various states for forest,savanna, and wetlands
Lake 1962–1963 Bedload determined assand transport
Stung Ksach Toch (Cambodia)1 30 0.70 - - Various states for forest,savanna, and wetlands
Weir 1962–1963 Bedload determined assand transport; TTS isbasin degradation rate
Shek Kong, Kam Tin basin (Hong Kong)2 1 1.3 - - Woodlands andshrublands
Weir 1989–2003 Geology: intrusivegranodiorite
Sg. Ikan (Malaysia)3 9.2 b1 - - Rainforest andagriculture
– – –
Mondo River, Java (Indonesia)4 0.187 44 209-313 13 Agriculturalland use
calc 1977 Metamorphic rocks, phyllites,graywackes, shales, marls,volcanic breccias
Upper Coban Rondo, Java (Indonesia)5 11.7 0.4–0.9 23–48 1.8 88% forested Trap 1988–89 Volcanic geomorphology:soils: Andosols, Cambisolsand Luvisols
Lower Coban Rondo, Java (Indonesia)5 21.62 54–78 523–1332 6.7 Forests (49%)and agriculture
Trap 1988–89 Volcanic geomorphology:soils: Andosols, Cambisolsand Luvisols
Upper Manting, Java (Indonesia)5 3.88 0.4–0.5 77–113 0.5 82% forest Trap 1988–89 Volcanic geomorphology:soils: Andosols, Cambisolsand Luvisols
Lower Manting, Java (Indonesia)5 4.6 4.0 81–548 3.6 Forest (69%) andagriculture
Trap 1988–89 Volcanic geomorphology:soils: Andosols, Cambisolsand Luvisols
Upper Sayang, Java (Indonesia)5 3.41 43–49 340–715 11.9 Forest (60%) andagriculture
Trap 1988–89 Volcanic geomorphology:soils: Andosols, Cambisolsand Luvisols
Lower Sayang, Java (Indonesia)5 12.33 35–74 621–1179 6.3 Forest (35%) andagriculture
Trap 1988–89 Volcanic geomorphology:soils: Andosols, Cambisolsand Luvisols
Babon, Java (Indonesia)6 1.39 158–174 22–433 29–88 Agroforestryand lowland rice
Weir 2001–2002 Geology: andesite andbasaltic rocks
Huay Pano (Lao PDR)6 0.67 69–117 81–126 35–59 Trad. agriculture& trial practices
Weir 2001–2002 Geology: Shale, schist,mudstone, sandstone
Huay Pano sub-catchments (Lao PDR)7 0.57–0.73 11–474 1–99 19–98 Trad. agriculture& trial practices
Weir ca 2000–2002 Geology: shale, schist,mudstone, sandstone
Sg. Telom (Cameron Highlands, Malaysia)8 77.7 25.7 50 34 Forest (94%) andagriculture
Trap pre 1960 Regional geology: slate,phyllite, schist and granite
Sg. Kial (Cameron Highlands, Malaysia)8 21.4 70.1 265 21 Forest (70%) andagriculture
Trap pre 1960 Regional geology: slate,phyllite, schist and granite
Sg. Bertam (Cameron Highlands, Malaysia)8 75.2 35.7 250 12 Forest (64%) andagriculture
Trap Pre 1960 Regional geology: slate,phyllite, schist and granite
Sg. Lawing, Main Range (Malaysia)9 4.7 125 54 70 Steep rainforest(unlogged)
HS 1988–89 Geology: medium granite;steep, channel gradient =0.17; bedload: sand–boulder
Sg. Lawing, Main Range (Malaysia)9 4.7 414 1129 27 Logging began atstart of the year
HS 1993 Geology: medium granite;steep, channel gradient =0.17; bedload: sand–boulder
Sg. Chongkak, Main Range (Malaysia)9 12.7 334–619 1335–2476 20 Logging ceasedin April 1987
HS 1987–88 Geology: granodiorite granite;steep, channel gradient = 0.11;bedload: sand–boulder
Sg. Batangsi, Main Range `(Malaysia)9 19.8 1264 2826 31 Steep rainforest;logging
HS 1987–89 Geology: coarse grainite;steep, mean main channelslope = 0.05; bedload:sand–boulder
34A.D.Ziegler
etal./Geom
orphology227
(2014)31
–48

Sg. Lui, Main Range (Malaysia)9 68.1 22 90 20 80% forest;logging ceasedin 1978
HS 1987–89 Mean main channelslope = 0.02; bedload:sand to boulder bedload
Bukit Tarek catchment C1 (Malaysia)10 0.33 6–28 – – 25 + year forestregrowth
Trap 1991–1994 Geology: quartzite;sandy-clay channel bed;sand-dominated bedload
Bukit Tarek catchment C2 (Malaysia)10 0.34 10–20 – – 25 + year forestregrowth
Trap 1991–1994 Geology: quartzite;sandy-clay channel bed;sand-dominated bedload
Sg. Kebow (Sarawak, Malaysia)11 0.6 1.80 – – Secondary regeneratedforest
HS 10/04–3/05 Geology: sandstone, shale,limestone, mudstone
Jengka Exp. Basin, Pahang (Malaysia)12 0.28 10–19 4–22 60 Rainforest(pre-logging)
Trap 1980–1986 Geology: Triassicsedimentary rocks withshale and sandstone
Jengka Exp. Basin, Pahang (Malaysia)12 0.28 14–30 23–38 45 Rainforest(post-logging)
Trap 1987–1989 Geology: Triassic sedimentaryrocks with shale and sandstone
Berembum subcatchments (Malaysia)13 0.04-0.29 2-242 7-27 20–90 Undisturbedforests
– 1980-1985 Granitic rocks; soil texturesrange from coarse to sandy clay
Ulu Langat Forest Reserve (Malyasia)14 2.6 1–2 10 17 Hill forest in areserve
HS 1997–1998 Geology: orthoquartziticsedimentary rocks; andargillaceous and calcareousshales.
Sg. Pansun, Main Range (Malaysia)15 2.6 4.6-11.4 22 33 Forestedcatchment
Trap/HS 09/97–06/98 Geology: granite, quartzite,schist; mean main channelslope = 0.29; bedload: gravel
Fly River (Papua New Guinea)16 184000 112 1006 10 30% forested;great miningeffects
Est NA Varied lithology includingvolcanics, clastics, limestones,and sediments
Mapawa (The Philippines)6 0.91 301–517 – – Tree plantations,grass, crops
Weir 2001–2002 Predominantly of anargillaceous and carbonate rocks
Huai Yai (Thailand); 4 small weirs17 0.032–0.118 10–1620 70–520 13.3–75.7 Mixed Agriculture Weir 2001–2002 Geology: siltstone, sandstone,limestone, shale, and phyllite
Mae Thang Reservoir survey (Thailand)17 121 2013 3087 39 Mixed agriculture Res 2001–2002 Geology: siltstone, sandstone,limestone, shale, and phyllite
Huai Ma Nai (Thailand)6 0.92 95–869 147–466 39–65 Mixed agriculture Weir 2001–2002 Geology: siltstone, sandstone,limestone, shale, and phyllite
Huai Ma Nai sub-catchments (Thailand)18 0.032–0.118 32–129 22–128 20–68 Mixed agriculture Weir 2003 Geology: siltstone, sandstone,limestone, shale, and phyllite
Pang Khum (Thailand)19 0.94 28 65 30 Mixed forest andagriculture;
Weir 1998–99 Geology: granite; relatively flatmain channel; stone bedloadmaterial
Huay Ma Feung (Rayong, Thailand)20 1.12 8395 2099 80 Undergoing roadconstruction
Weir 1982–1983 Geology: schist, gneiss, sandstone
Mae Sa (Thailand)21 74 81–279 649–1037 18(9–25) Mixed forest andagriculture;
HS 2005 Geology: granite, schist,limestone, marble; sandbedload material
Laclo & Caraulun Rivers (Timor Leste)22 580–1386 360-3988 3240–3988 10-50 Degradedcatchments
Est 2006–2008 Highly erosive environmentwith landslides and river incision
Dong Cao (Vietnam): small weirs23 0.037–0.108 35–669 – – Agriculture andtreatments
Weir 1999–2002 Geology: schist; soil: ultisols
Dong Cao (Vietnam): small weirs24 0.037–0.108 b20-1200 – – Agriculture andtreatments
Weir 2000–2005 Geology: schist; soil: ultisols
Dong Cao (Vietnam): main weir6,24 0.96 99-322 330 23 Agriculture andtreatments
Weir 2000–2005 Geology: schist; soil: ultisols
Sesan River (Vietnam)25 2910–3139 – – 5-64 60% forested HS 1994–1995 Diverse geology and soils
(continued on next page)
35A.D.Ziegler
etal./Geom
orphology227
(2014)31
–48

Table 1 (continued)
Referencea Area km2 BLyield Mg km−2y−1 TSSyield Mg km−2 y−1 BLp % Site note Typeb Time Note
Other Regional data
East Tributary, Ngarradj Creek (Australia)26 10 58 60 49 Undisturbedcatchment
HS 1998 Geology: quartz sandstone;bed sediments include avariety of sands and pebbles
Upper Swift Creek, Ngarradj27 Creek (Australia) 19 53 – – Mining affected HS 1998–2002 Geology: quartz sandstone;bed sediments include avariety of sands and pebbles
Swift Creek, Ngarradj Creek (Australia)27 44 37 – – Mining affected HS 1998–2002 Geology: quartz sandstone;bed sediments include avariety of sands and pebbles
Magela Creek (N Territory, Australia)28 600 9 12 49 Mixed includebarren lands,savannahs, andforest
HS 1980–1989 Drains plateau of resistantquartzose sandstone
Bhramaputra River (Bangladesh)29 583000 413 397 51 Variable (largecatchment)
Est Long-term Sand-bottom river
Ganges (Bangladesh)29 1060000 270 260 51 Variable (largecatchment)
Est Long-term Sand-bottom river
Yangtze River at xDatong (China)30 1705400 5 238 2 Variable (largecatchment)
Est 50+years
Jinsha River (China)31 485000 16–56 196–666 8 Area affected bymass wasting
Mixed 1958–1984 Steep terrain in three provinces:Tibet, Yunnan and Sichuan
Marsyandi River (Nepal)32 4800 1083 5563 16–35 Erosiveenvironment,landslides
Hydro/sd Unsure Geology: Greater Himalayanmetasedimentary marblesand gneisses
Kali Gandaki River (Nepal)33 46300 216–680 475–1134 25–45 Erosiveenvironment,landslides
Hydro 2006–2012 Geology: gneisses andmetasediments
Reservoirs in Taiwan34 15–763 – – 0–74 Various Res 10–30 years Estimated from 150 suspendedsediment stations (see noteTurowski et al., 2010)
Choshui river (Taiwan)35 3155 913–2107 4916–6109 13–30 Affected bytyphoons,earthquakes
Res 2003 High relief, steep gradients,frequent tectonic activity
a References are (1) Carbonnel and Guiscafre (1965) and Douglas (1999); (2) Peart and Jayawardena (1994); Peart and Fok (2006); (3) Kasran et al. (1996) cited by Geoffrey and Yusop (2005) and Chew (1999); (4) Bruijnzeel (1983); (5) Rijsdijk(2012); (6) MSEC experiments summarized by Valentin et al. (2008) andmsec.iwmi.org/res/tools/database/bedload.htm; (7) Maglinao and Valentin, n.a.; (8) Shallow (1956) cited by Geoffrey and Yusop (2005), Lai (1993), and Choy (2002); (9) Lai(1993) & Lai et al. (1995); (10) Yusop et al. (2006); (11) extrapolated to one year using data of Geoffrey and Yusop (2005); (12) Kasran (1996); (13) Abdul Rahimet al. (1985) cited in Kasran (1996); Kasran (1988); (14)Detphachanh (2000); (15) Laiand Detphachanh (2006); (16) Estimated based onWalsh and Ridd (2008) comment about 90% of total load of 100,000,000 Mg/y being fine sediment; (17) Janeau et al. (2003); (18) Bricquet et al. (2004); (19) Ziegler et al. (2000); (20) HendersonandWitthawatchutikul (1984); (21) this study; (22) estimate by Alongi et al. (2009); (23) Toan et al. (2003); (24) Orange et al. (2012); (25) IMH (1998) cited by Douglas (1999); (26) Saynor et al. (2006); (27) Erskine et al. (2011); (28) Roberts(1991) and Erskine and Saynor (2000); (29) Turowski et al. (2010), Milliman and Farnswarth (2011); (30) based on the estimate of Hu et al. (2009) that only 2% of the total load is bedload; (31) Liu et al. (2011); (32) Values from Shrestha andWannick (1989) suggest BLp value of 16%; the analysis of Pratt-Sitaula et al. (2007) suggest 35%; (33) Struck et al. (2013) and pers. comm (2013); (34) Dadson (2003a) reported in Turowski et al. (2010); (35) based on weir accumulation ratesstated by Yeh et al. (2010) at Chi–Chi weir and Dadson et al. (2003b) estimate that bedload in Taiwan Rivers is 30% of the total load.
b HS refers to a Helly–Smith samplermeasuring sediment trapped behind aweir; trap refers to collection in traps excavated into the channel; Res refers to data estimated from reservoir sediments; sd refers to sedimentary deposits; hydro refers todetermined hydropowerstation; mixed refers to various methods such as back calculation or modeling.
36A.D.Ziegler
etal./Geom
orphology227
(2014)31
–48

37A.D. Ziegler et al. / Geomorphology 227 (2014) 31–48
and2003 (also see Peart and Jayawardena (1994)). The great variability inannual loadwas related largely to the occurrence/absence of large stormsthat could mobilize large loads.
In Thailand, Ziegler et al. (2000) determined stream sediment con-tributions from roads, paths, and agriculture lands in the 0.94-km2
Pang Khum Experimental Watershed (Table 1). Sediment, largely sandand small stones, trapped behind the weir at the catchment outletwas measured irregularly over a one-year period. Road sedimentinput to the streamwas only slightly higher than that from agriculturallands (30–41 versus 25–40 Mg), but corresponding erosion rates weresubstantially greater (65–88 versus 0.02–0.04 Mg km−2 y−1). Thebedload proportion of total sediment was 30%. In contrast, 80% of theroad-generated material entering the HuayMa Fueng stream in RayongProvince was bedload (Henderson and Witthawatchutikul, 1984). Thestudy in Pang Khum indicated that sediment budgeting approachesare needed to uncover important sediment sources that occupy smallpercentages of the total basin area (e.g., roads, landslides). Subsequentobservations (unpublished) showed the importance of singular largeevents on bedload transport, as the capacity of the weir to trap bedloadcould be exceeded during one high flow event, but not likely duringseveral months of low flows.
In brief, the bedload studies reviewed show that the bedloadpropor-tion to total sediment loads was frequently N10%—and often ≥30%. Inaddition, bedload transport was typically episodic, with high propor-tions being mobilized by infrequent large storms. The results of manystudies had great uncertainty related to the difficulty in measuringbedload, as well as the short duration of the studies. In general, theamount of fieldwork dedicated to quantifying bedload is limited.
3. Part II: case study
3.1. Study area
In 2005 we conducted a bedload study in the 74-km2 Mae Sa RiverCatchment in Chiang Mai Province of northern Thailand (Fig. 1). TheMae Sa River is a headwater tributary to the Ping River, which joinsthe Nan River to form the Chao Phraya, Thailand's largest river. Beforethe confluence, the Ping River enters the Bhumibol Reservoir in Tak
Hot
ChiangMai
Mae Sa
BhumibolReservoir
Ping River Basin Nan River Basin
SirikitReservoir
Tak
Nakon Sawan20 0 20 40 km
N
a
Fig. 1. (a) Location of Mae Sa study area in northern Thailand in relationship to other major rive(F, 62%); hillslope and plantation agriculture (AG, 23%), (peri)urbanized areas (UR, 8%), and glocation of hydro-meteorological measurement instruments in the catchment. Streamflow va(black numbered rectangles).
Province (Fig. 1). Located almost 500 kmnorth of Bangkok, the reservoirwas built for water storage, hydroelectric power production, floodcontrol, fisheries and saltwater intrusion management (cf. Tebakariet al., 2012).
Lithology in the Mae Sa catchment is variable. Milled granite andgneiss (both ortho- and para-gneiss) are the dominant rocks, butphyllite, limestone, and marble are also present. Soils are mostlyultisols, alfisols, and inceptisols that overlie a variably deep(1–20 m) weathered zone of iron-rich, orange-colored saprolite.Rainfall ranges from 1200 to 2000 mm, of which 80% of the totalfalls in the May–October monsoon rain season (Ziegler et al., 2011).Annual catchment runoff is approximately 20–30% of the annualrainfall total. Mean hillslope gradient, calculated from a 30-m DEM,is 0.28 (15.4°); the maximum is 1.54 (57°).
Much of the main stream is located on relatively flat valley floors,separated by a series of large waterfalls over bedrock (cascades). Theriver generally flows in a singular channel that is confined by the steepmountain topography. In some valley locations, the channel meanderson a wide riparian plain and the network is affected by agriculture—previously rice cultivation and now commercial agriculture. The chan-nel gradient for the entire catchment is 0.11, with short sections varyingfrom nearly flat to N1. Stream bedmaterial in themain channel dependson location, relative to gradient. Most steep sections are composedof large stones and boulders on bedrock, while other sections aresand-dominated, but overlay larger material, including bedrock. Thetributaries draining the surrounding mountain slopes often have steep,narrow channels (b1 m) and the stream beds are composed of largestones and boulders. In areas where the main channel flows throughrelatively flat valleys the surface bed material is largely sand.
Land use in the catchment includes forest reserves, cultivated hillslopes including plantations, rapidly-expanding greenhouse agricul-ture, and urbanized areas (Fig. 1).Much of the forested land is protectedas a national park. The catchment is also an important recreational/tourist area that features several venues surrounding the stream,including two elephant camps, a botanical park, several resorts/spas,and various ecotourism activities (Sidle and Ziegler, 2010). An extensivepaved and unpaved road system exists within the basin, linking numer-ous villages and agriculture sites. These roads are important sources of
b
rs. (b) Major land covers in the catchment include forest of various degrees of disturbancereenhouse agriculture (GH, 7%). Grid cell dimensions are 2 × 2 km. Numbers refer to theriables were monitored at location 434. Rainfall is measured at all other number stations

38 A.D. Ziegler et al. / Geomorphology 227 (2014) 31–48
coarse sediment entering the stream during infrequent mass wastingevents (Ziegler et al., 2011).
Local officials believe there has been a significant increase in sedi-ment transport in the Mae Sa river over the last couple of decades.Stream water color is typically reddish-brown during runoff events,owing to the transport of clay material that is associated with erodediron-rich horizons of the tropical residual soils that dominate the region.Additionally, distinct sediment deposits (bars, overbank deposits) ap-pear in the lower gradient reaches of the river. Recently, several waterquality studies conducted in sub-catchments indicate increased chemi-cal and sediment loadings (Ciglasch et al., 2005, 2006; Kahl et al., 2008;Sidle and Ziegler, 2010). Erosion rates as high as 80 Mg ha−1 y−1 havebeen reported for some steep cultivated fields (Ongprasert, 1995).Suspended sediment delivery rates were estimated in a preliminaryinvestigation (Ziegler et al., 2011): 1075 Mg km−2 y−1 for year 2006.This yield has since been revised to 839 Mg km−2 y−1 (see below).River discharge from the 74-km2 catchment has exceeded 30 m3 s−1
(observed in 2006).
4. Methods
4.1. Rainfall and discharge measurements
The study was conducted from 10 July to 3 September 2005, duringthe height of themonsoon rainy season. Rainfall was recorded at 1-minintervals with tipping-bucket rain gages (Onset; 15.4-cm receivingorifice) situated at 11 measurement locations in the basin (Fig. 1).Each gage, initialized at 0.254 mm tip−1, was dynamically calibratedto account for variable tipping rates associated with highly variablerainfall rates in the region (Ziegler et al., 2009). Stream stage was mea-sured automatically in an unmodified cross-section of themain channelwith a Campbell Scientific CS425 pressure transducer and CR10X datalogger (Station 434; Fig. 1b). A stage-discharge rating curve was deter-mined from 56 stage–velocity–profile measurements made during flowvolumes ranging from 0.3 to 30m3s−1 (Ziegler et al., 2011). A total of 29measurements were made during 2005, the year of this study. Thestreambed profile was monitored continuously to correct for stage–discharge relationship variations related to changes in the stream bed.
4.2. Bedload measurements
Bedload was measured with a Helley–Smith sampler (Helleyand Smith, 1971). Internal dimensions of the sampler intake were7.62 cm×7.62 cm. A standard 0.2-mmmesh collection bagwith surfacearea = 1950 cm2 was used. During each sampling interval, the samplerwas placed on the sand-bottom stream bed at 1-m intervals across thestream. Thus, each interval sample was the aggregate of 5–7 sub-samples (more subsamples were taken as stream width increasedduring runoff events). The target sample collection interval was 60 sper channel location. For consistency, the same sampling locationswere used for all measurements. Sampling was performed standing inthe stream.
The study was designed to collect samples during baseflow, risinglimb, peak, and falling limb conditions of individual events; however,some periods only contained a few base flow samples, taken on dayswhen rainfall did not occur. Each sample was dried at 50°C in the labo-ratory to a constant mass. Bedload transport rate (BLt; kg s−1) wascalculated as
BLt ¼Wstream
WHS � n�Xn
i¼1
Mi
ti:ð5Þ
where Wstream is the width of the stream, and WHS is the width of theintake of the Helley–Smith collector (0.0762 m); n is the number ofsample locations across the stream (n= 5–7);Mi is themass of bedload
collected at each location; and ti is the collection time for eachmeasurement.
To investigate the relationship between discharge and size of mate-rial transported, grain-size distributions were determined by sieving 45bedload samples into the following fractions: N2.0 mm, 1.0–2.0 mm,0.5–1.0 mm, 0.25–0.5 mm, 0.125–0.25 mm, 0.063–0.125 mm, andb 0.063 mm. From these data, the geometric mean particle diameterwas determined by Yuen et al. (2012).
4.3. Total suspended solids and turbidity measurements
We used a self-cleaning, infrared, 90° optics, Analite (McVan Instru-ments, Australia) NEP-395 turbidity probe to register a continuousturbidity signal in nephelometric turbidity units (NTU). The probe wascalibrated to a range of 0 to 3000 NTU. During deployment, the probewas housed inside a perforated PVC pipe (7.6 cm diameter), whichwas suspended from temporary bamboo bridge, approximately 2 mabove the river bed (Ziegler et al., 2011). This cantilever system allowedthe probe to remain immersed in the water column, approximately10–20 cm below the water surface for all flow ranges (Ziegler et al.,2011). Turbidity readings were recorded by the data logger every20-min and also at times when stream stage changed by a 0.5-cm in-crement (minutely during runoff events). Each recorded value was themedian of several readings taken over a period of about 45 s.
We also collected 300-mL suspended sediment samples witha hand-held US-DH-48 depth-integrated sampler to quantify totalsuspended solids (TSS). Samples were paired with turbidity readingsto provide a means of calibrating the probe to estimate TSS concentra-tions from the automated turbidity time series. Samples oftencorresponded to various stages of the rising and falling limbs of thestorm hydrographs in anticipation that a hysteresis effect would existin the Q–TSS relationship. Continuous monitoring of stream turbiditywas necessary because sediment in the Mae Sa River moves in asyn-chronous pulses; therefore, sediment rating curves based solely on dis-charge are inadequate (cf. Ziegler et al., 2011). Thus, the synopticsampling employed in the study allowed for capturing changes in theturbidity–TSS (also Q–TSS) signal associated with the rising and fallinglimbs of the stream hydrograph.
5. Results
5.1. Runoff events
Either one or both of bedload and total suspended solids were sam-pled during 23 sampling occasions in 2005 (Table 2). Both bedload andTSS were collected during 17 events; however, only during 15 eventswere bedload, TSS, turbidity, and discharge sampled completely(Table 3). Stream discharge was characterized by base flows rangingfrom 0.4 m3 s−1 to 1.3 m3 s−1, with the higher values occurring laterduring the field campaign in September (Table 2; Fig. 2). Storm re-sponse was flashy; with peak discharges (N10 m3 s−1) typically lastingonly a few minutes (Fig. 2). Turbidity, which is a proxy for totalsuspended solids, also had a flashy signal (Fig. 2). However, flushes ofturbid waters were at times asynchronous with runoff dischargepeaks, and maximum turbidity values were recorded over a widerange of measured discharges (Fig. 2). Sediment peaks often arrivedafter discharge peaks; and high sediment concentrations were oftenseen on the falling limbs of storm hydrographs, creating an anti-clockwise hysteresis effect.
5.2. Bedload transport
A total of 136 bedload samples was collected during 23 samplingevents; and the number of samples per sampling occasion variedfrom 1 to 19 (Table 2). Stream cross-section width during the bedloadmeasurements ranged from about 6–8 m during the measurements.

Table 2Summary data for sampling occasions when bedload (BL) and total suspended solid (TSS) samples were taken in 2005.
Sampling Occasions Qmin Qmax BLmin BLmax nBL TSSmin TSSmax nTSS
(m3 s−1) (m3 s−1) (kg s−1) (kg s−1) (kg m−3) (kg m−3)
10-Jul-05 0.4 0.5 0.001 0.002 3 0.03 0.05 312-Jul-05 0.4 0.5 0.001 0.002 3 0.02 0.02 213-Jul-05 0.4 2.2 0.008 0.038 9 1.33 5.35 3714-Jul-05 0.4 2.4 0.002 0.096 7 0.13 3.74 1515-Jul-05 0.4 8.6 nd nd nd 4.28 10.08 1019-Jul-05 0.4 1.0 0.005 0.009 3 0.06 0.07 322-Jul-05 0.9 2.1 0.032 0.071 4 0.51 2.02 3624-Jul-05 1.0 2.1 0.011 0.018 2 nd nd nd26-Jul-05 1.2 2.1 0.030 0.036 2 0.16 0.47 827-Jul-05 1.2 1.9 0.020 0.042 3 0.17 3.36 2713-Aug-05 1.3 1.7 0.089 0.379 9 nd nd nd16-Aug-05 1.1 1.6 0.074 0.082 2 nd nd nd17-Aug-05 1.1 2.1 0.079 0.338 9 0.10 0.78 818-Aug-05 0.6 2.5 0.119 0.187 9 0.10 1.42 1422-Aug-05 0.6 1.2 0.067 0.127 3 0.16 0.16 124-Aug-05 0.6 0.9 0.036 0.106 7 0.04 0.05 225-Aug-05 0.7 4.4 0.030 1.137 19 0.07 9.10 2926-Aug-05 0.8 27.5 0.054 0.185 2 1.54 14.05 2027-Aug-05 0.9 2.6 0.053 0.130 4 nd nd nd30-Aug-05 1.2 3.2 0.024 0.149 11 1.63 3.64 371-Sep-05 0.6 3.2 0.043 0.129 11 0.12 1.33 142-Sep-05 0.6 3.2 0.068 0.068 1 0.50 0.50 13-Sep-05 0.6 3.9 0.025 1.060 13 0.15 13.54 20
Qmin and Qmax are the minimum and maximum discharges during bedload sampling; BLmin and BLmax are the minimum and maximum recorded bedload transport rates for the entirestream cross-section; nBL is the number of bedload samples taken during the period; TSSmin and TSSmax are the minimum and maximum total suspended solid concentrations. AndnTSS is the number of TSS samples taken during the event. nd indicates that no data were collected.
39A.D. Ziegler et al. / Geomorphology 227 (2014) 31–48
Corresponding discharges ranged from 0.4 to 4.5 m3 s−1 (not reportedin the table)—although much higher flows occurred during two sam-ple occasions, forcing an end to sampling. Sampling for extreme flowsN4.5m3 s−1wasnot possible because of safety issues. Thus, our analysesfocus on “low-energy” stormflow conditions (Qi b 5m3 s−1). In the Dis-cussion section we explore the significance of not measuring high-energy flows.
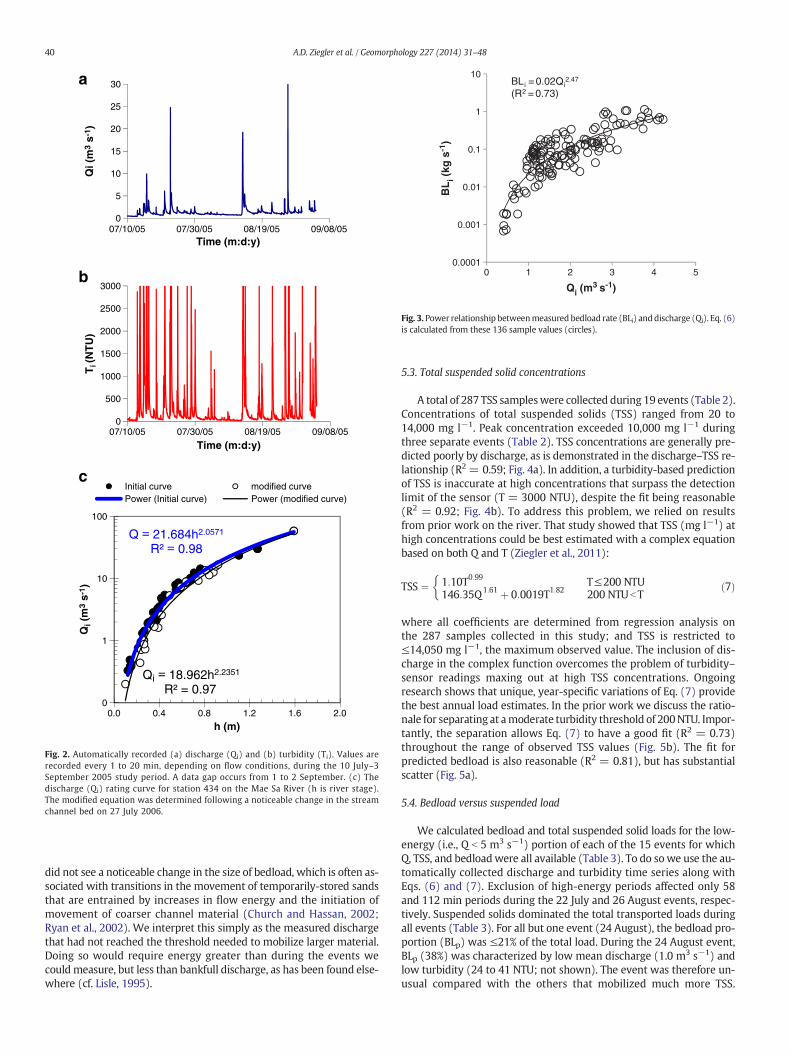
The highest measured bedload rate (N1.14 kg s−1) was associatedwith a discharge of 3.9 ms−1 during the 25 August event (intermediateof the range reported in Table 2). Values as low as 0.001 kg s−1 were ob-served during low-flow conditions (Table 2). A reasonable power func-tion relationship based on discharge (Qi), was derived from the 136samples (R2 = 0.73; Fig. 3):
BLi ¼ 0:02Qi2:47
: ð6Þ
The high degree of observed intra- and inter-event variabilityindicates that bedload transport was probably affected by the
Table 3Summary of discharge (Q), bedload (BL), total suspended solids (TSS) calculations for 15 low-
Date Start Stop D Q
(s) (m3
10-Jul-05 15:37 16:08 1860 0.612-Jul-05 14:17 16:10 6780 0.413-Jul-05 13:30 16:58 12481 1.414-Jul-05 15:37 18:11 9241 1.119-Jul-05 16:02 17:45 6180 0.822-Jul-05 13:20 15:56 9361 1.326-Jul-05 14:18 17:40 12121 1.327-Jul-05 14:45 18:04 11941 1.417-Aug-05 13:09 19:33 23041 1.418-Aug-05 16:57 19:44 10021 1.724-Aug-05 15:09 15:43 2040 1.025-Aug-05 14:30 18:40 15001 3.226-Aug-05 15:38 18:50 11521 9.530-Aug-05 16:33 21:12 16741 1.703-Sep-05 11:22 16:45 19381 2.4
D is duration; Q is discharge (QT/D), QT is total discharge, BLT is total bedload transport, TSSr is
availability of material or source of material, rather than the trans-port capacity of the flow during the measured low-energy runoffevents. We observed that sand material built up in the largelyflat study reach in between events. This material was flushed asbedload during subsequent runoff events. Although more bedloadmaterial was likely transported from upstream, we believe the primarysource for most of the events was sand material stored immediatelyabove the study reach. Although we have nomeans to directly quantifythis statement, this appears reasonable based on other measurementsof bedload particle transport (e.g., Gomi and Sidle, 2003; Hill et al.,2010).
There was a general consistency in the geometric mean particlediameter (GMPD) of the material transported by a range of flow dis-charges. All but two of the 51 samples had a GMPD corresponding tocourse sand (values ranged from 600 to 1200 μm). Eighty percent ofall material measured was 250–1000 μm, of which half was courserthan 500 μm (not shown). Grain size was not correlated with discharge(Cullen and Hoey, 2003). For the range of discharges measured, we
energy events.
QT BLT TSST BLp
s−1) (m3) (Mg) (Mg) –
1070 0.01 0.04 14%2735 0.01 0.05 21%
17454 0.64 32.99 2%10213 0.38 14.63 3%5177 0.07 0.25 21%
11723 0.32 8.92 4%15891 0.47 3.12 13%16448 0.53 16.47 3%31179 1.00 7.27 12%17342 0.84 9.54 8%2011 0.04 0.06 38%
47582 6.19 173.34 3%109370 2.71 83.10 3%29138 1.41 56.71 2%47135 4.00 126.05 3%
total suspended solid transport; BLp is the percentage of the total load that is bedload.
0
5
10
15
20
25
30Q
i (m
3 s-
1 )Q
i (m
3 s-
1 )
Time (m:d:y)
0
500
1000
1500
2000
2500
3000
Ti (
NT
U)
Time (m:d:y)
Q = 21.684h2.0571
R² = 0.98
Qi = 18.962h2.2351
R² = 0.970
1
10
100
07/10/05 07/30/05 08/19/05 09/08/05
07/10/05 07/30/05 08/19/05 09/08/05
0.0 0.4 0.8 1.2 1.6 2.0
h (m)
Initial curve modified curvePower (Initial curve) Power (modified curve)
c
b
a
Fig. 2. Automatically recorded (a) discharge (Qi) and (b) turbidity (Ti). Values arerecorded every 1 to 20 min, depending on flow conditions, during the 10 July–3September 2005 study period. A data gap occurs from 1 to 2 September. (c) Thedischarge (Qi) rating curve for station 434 on the Mae Sa River (h is river stage).The modified equation was determined following a noticeable change in the streamchannel bed on 27 July 2006.
0.0001
0.001
0.01
0.1
1
10
0 1 2 3 4 5
BL
i (kg
s-1
)
Qi (m3 s-1)
BLi =0.02Qi2.47
(R2 = 0.73)
Fig. 3. Power relationship betweenmeasured bedload rate (BLi) anddischarge (Qi). Eq. (6)is calculated from these 136 sample values (circles).
40 A.D. Ziegler et al. / Geomorphology 227 (2014) 31–48
did not see a noticeable change in the size of bedload, which is often as-sociated with transitions in the movement of temporarily-stored sandsthat are entrained by increases in flow energy and the initiation ofmovement of coarser channel material (Church and Hassan, 2002;Ryan et al., 2002). We interpret this simply as the measured dischargethat had not reached the threshold needed to mobilize larger material.Doing so would require energy greater than during the events wecouldmeasure, but less than bankfull discharge, as has been found else-where (cf. Lisle, 1995).
5.3. Total suspended solid concentrations
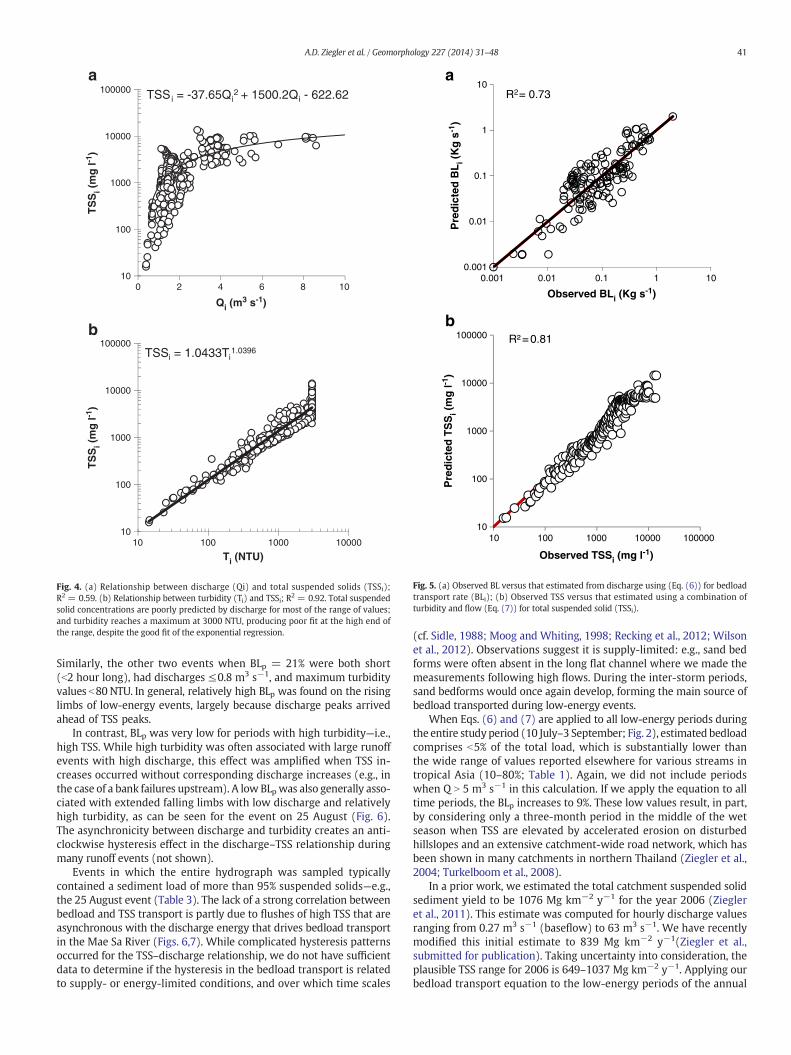
A total of 287 TSS sampleswere collected during 19 events (Table 2).Concentrations of total suspended solids (TSS) ranged from 20 to14,000 mg l−1. Peak concentration exceeded 10,000 mg l−1 duringthree separate events (Table 2). TSS concentrations are generally pre-dicted poorly by discharge, as is demonstrated in the discharge–TSS re-lationship (R2 = 0.59; Fig. 4a). In addition, a turbidity-based predictionof TSS is inaccurate at high concentrations that surpass the detectionlimit of the sensor (T = 3000 NTU), despite the fit being reasonable(R2 = 0.92; Fig. 4b). To address this problem, we relied on resultsfrom prior work on the river. That study showed that TSS (mg l−1) athigh concentrations could be best estimated with a complex equationbased on both Q and T (Ziegler et al., 2011):
TSS ¼ 1:10T0:99 T≤200 NTU146:35Q1:61 þ 0:0019T1:82 200 NTUbT
�ð7Þ
where all coefficients are determined from regression analysis onthe 287 samples collected in this study; and TSS is restricted to≤14,050 mg l−1, the maximum observed value. The inclusion of dis-charge in the complex function overcomes the problem of turbidity–sensor readings maxing out at high TSS concentrations. Ongoingresearch shows that unique, year-specific variations of Eq. (7) providethe best annual load estimates. In the prior work we discuss the ratio-nale for separating at amoderate turbidity threshold of 200NTU. Impor-tantly, the separation allows Eq. (7) to have a good fit (R2 = 0.73)throughout the range of observed TSS values (Fig. 5b). The fit forpredicted bedload is also reasonable (R2 = 0.81), but has substantialscatter (Fig. 5a).
5.4. Bedload versus suspended load
We calculated bedload and total suspended solid loads for the low-energy (i.e., Q b 5 m3 s−1) portion of each of the 15 events for whichQ, TSS, and bedloadwere all available (Table 3). To do sowe use the au-tomatically collected discharge and turbidity time series along withEqs. (6) and (7). Exclusion of high-energy periods affected only 58and 112 min periods during the 22 July and 26 August events, respec-tively. Suspended solids dominated the total transported loads duringall events (Table 3). For all but one event (24 August), the bedload pro-portion (BLp) was ≤21% of the total load. During the 24 August event,BLp (38%) was characterized by low mean discharge (1.0 m3 s−1) andlow turbidity (24 to 41 NTU; not shown). The event was therefore un-usual compared with the others that mobilized much more TSS.
TSSi = -37.65Qi2 + 1500.2Qi - 622.62
10
100
1000
10000
100000
Qi (m3 s-1)
TSSi = 1.0433Ti1.0396
10
100
1000
10000
100000
0 2 4 6 8 10
10 100 1000 10000
Ti (NTU)
b
TS
Si (
mg
l-1)
TS
Si (
mg
l-1)
a
Fig. 4. (a) Relationship between discharge (Qi) and total suspended solids (TSSi);R2 = 0.59. (b) Relationship between turbidity (Ti) and TSSi; R2 = 0.92. Total suspendedsolid concentrations are poorly predicted by discharge for most of the range of values;and turbidity reaches a maximum at 3000 NTU, producing poor fit at the high end ofthe range, despite the good fit of the exponential regression.
10
100
1000
10000
100000
Observed TSSi (mg l-1)
R² =0.81
R2= 0.73
0.001
0.01
0.1
1
10
10 100 1000 10000 100000
0.001 0.01 0.1 1 10
Pre
dic
ted
BL
i (K
g s
-1)
Observed BLi (Kg s-1)
b
Pre
dic
ted
TS
Si (
mg
l-1)
a
Fig. 5. (a) Observed BL versus that estimated from discharge using (Eq. (6)) for bedloadtransport rate (BLi); (b) Observed TSS versus that estimated using a combination ofturbidity and flow (Eq. (7)) for total suspended solid (TSSi).
41A.D. Ziegler et al. / Geomorphology 227 (2014) 31–48
Similarly, the other two events when BLp = 21% were both short(b2 hour long), had discharges ≤0.8 m3 s−1, and maximum turbidityvalues b80 NTU. In general, relatively high BLp was found on the risinglimbs of low-energy events, largely because discharge peaks arrivedahead of TSS peaks.
In contrast, BLp was very low for periods with high turbidity—i.e.,high TSS. While high turbidity was often associated with large runoffevents with high discharge, this effect was amplified when TSS in-creases occurred without corresponding discharge increases (e.g., inthe case of a bank failures upstream). A low BLpwas also generally asso-ciated with extended falling limbs with low discharge and relativelyhigh turbidity, as can be seen for the event on 25 August (Fig. 6).The asynchronicity between discharge and turbidity creates an anti-clockwise hysteresis effect in the discharge–TSS relationship duringmany runoff events (not shown).
Events in which the entire hydrograph was sampled typicallycontained a sediment load of more than 95% suspended solids—e.g.,the 25 August event (Table 3). The lack of a strong correlation betweenbedload and TSS transport is partly due to flushes of high TSS that areasynchronous with the discharge energy that drives bedload transportin the Mae Sa River (Figs. 6,7). While complicated hysteresis patternsoccurred for the TSS–discharge relationship, we do not have sufficientdata to determine if the hysteresis in the bedload transport is relatedto supply- or energy-limited conditions, and over which time scales
(cf. Sidle, 1988; Moog and Whiting, 1998; Recking et al., 2012; Wilsonet al., 2012). Observations suggest it is supply-limited: e.g., sand bedforms were often absent in the long flat channel where we made themeasurements following high flows. During the inter-storm periods,sand bedforms would once again develop, forming the main source ofbedload transported during low-energy events.
When Eqs. (6) and (7) are applied to all low-energy periods duringthe entire studyperiod (10 July–3 September; Fig. 2), estimated bedloadcomprises b5% of the total load, which is substantially lower thanthe wide range of values reported elsewhere for various streams intropical Asia (10–80%; Table 1). Again, we did not include periodswhen Q N 5 m3 s−1 in this calculation. If we apply the equation to alltime periods, the BLp increases to 9%. These low values result, in part,by considering only a three-month period in the middle of the wetseason when TSS are elevated by accelerated erosion on disturbedhillslopes and an extensive catchment-wide road network, which hasbeen shown in many catchments in northern Thailand (Ziegler et al.,2004; Turkelboom et al., 2008).
In a prior work, we estimated the total catchment suspended solidsediment yield to be 1076 Mg km−2 y−1 for the year 2006 (Ziegleret al., 2011). This estimate was computed for hourly discharge valuesranging from 0.27 m3 s−1 (baseflow) to 63 m3 s−1. We have recentlymodified this initial estimate to 839 Mg km−2 y−1(Ziegler et al.,submitted for publication). Taking uncertainty into consideration, theplausible TSS range for 2006 is 649–1037 Mg km−2 y−1. Applying ourbedload transport equation to the low-energy periods of the annual

0
500
1000
1500
2000
2500
3000
0
1
2
3
4
5
14:24 15:36 16:48 18:00 19:12 20:24 21:36 22:48 0:00 1:12T
i (N
TU
)
Qi (
m3 s
-1)
25 August (hours:min)
DischargeTurbidity
0
10
20
30
BL
p
b
a
Fig. 6. For the 25August 2005 event, the following (Tables 2 and 3): (a) proportion of totalsediment load that is bedload (BLp); and (b) corresponding discharge (Qi) and Turbidity(Ti). Note: BLp is low when turbidity is high. Asynchronous flushes of high turbiditywater and discharge peaks produce an anti-clockwise hysteresis effect in the TSS-signal(not shown).
BLi = 0.0812 TSSi0.5317
R² = 0.47
1.E-04
1.E-03
1.E-02
1.E-01
1.E+00
1.E+01
BL i (
kg s
-1)
TSSi (kg s-1)
BLp = 6.913TSSi-0.404
R² = 0.39
0.100
1.000
10.000
100.000
1.E-04 1.E-02 1.E+00 1.E+02
0.001 0.100 10.000
BL p
TSSi (kg s-1)
b
a
Fig. 7. (a) Relationship between measured total suspended solids (TSSi) and bedloadtransport (BLi) during thefield study. (b) Relationship betweenmeasured total suspendedsolids (TSSi) and the proportion of the total sediment load that is bedload (BLp).
42 A.D. Ziegler et al. / Geomorphology 227 (2014) 31–48
time series produces an estimated BLp of 18%. Predicted values in thisrange hold for calculations using flows up to 20 m3 s−1. Applying theequation to the entire discharge time series yields a BLp value of 25%,but this estimate has no physical meaning because the equation is notvalid for high flow periods.
Again, we believe bedload in Mae Sa is supply limited—and this hasimportant implications for estimating the bedload transport at highflow conditions. Specifically, under supply-limited conditions, bedloadtransport relative to TSS transport would not be expected to increasegreatly (assuming the channel is not incised). Therefore, BLp is probablynot higher than our high-end estimate of 25%, which is in-linewith thatof many rivers worldwide (Turowski et al., 2010).
From the annual calculations of TSS and bedload in theMae Sa river,we conclude that the latter likely comprises 9–25% of total sedimentyield, with 18% representing our best estimate. This percentage equatesto a catchment bedload yield of 189 Mg km−2 y−1 (the plausible rangeis 81–279 Mg km−2 y−1) versus the TSS estimate of 839 Mg km−2 y−1
(range = 649–1037 Mg km−2 y−1). Total annual sediment yield foryear 2006 is therefore an estimated 730 to 1313 Mg km−2 y−1, withthe best estimate being 1028 Mg km−2 y−1.
6. Discussion
6.1. Uncertainties
Foremost, our bedload yields are based on only a few hundred sam-ples collected during a 3-month period, and only for low-energy flows.The maximum discharge for which we could sample was 4.5 m3 s−1,which is about 13% of the largest value recorded during the study period(40 m3 s−1). In the annual yield prediction, there were 231 hourly pe-riodswhere hourly dischargewas higher than 4.5m3 s−1. These periodsrepresent only about 16% of the total annual flow. A drastic change inbedload transport during very high discharges could produce yieldshigher than our estimates, particularly if the river channel was incised.In such cases, it is plausible that the bedload percentage to the totalload could exceed the upper bound of 25% we predicted for all flows,but this is largely speculation. In all likelihood, few of the prior bedload
studies in SE Asia could make such a calculation, with a possible excep-tion being those studies using trap methods (Table 1).
The Helley–Smith sampler was initially chosen because of our as-sumption that sand would dominate the measured bedload fractionin the river. We encountered two major problems with the sampler.First, we could only deploy it for low-energy events for safety reasons.Second, the collection bag became choked with suspended sedimentand organic material when TSS concentrations exceeded values of2000–3000 mg l−1, forcing us to discard these measurements. Eventhe use of a larger collection bag did not alleviate the problem entirely(cf. Vericat et al., 2006). Use of other collection methods (e.g., traps),or a combination of methods, may have produced a better overall result(Sterling and Church, 2002; Bunte et al., 2008; Schindler et al., 2012).However, given the size of the stream and budget restrictions wewere not able to incorporate other methods. Further, the flow restric-tion in the collection bag draws attention to interchangeability of TSSand bedload material, as well as our inability to partition the materialcollected in the Helley–Smith sampler. Operationally, all materialcollected in the sampler is assumed to be bedload.
We observed following one very high flow event, with Q reaching30 m3 s−1, movement of stones with diameters exceeding 20–30 cm.Some bed scour downstream from our sampling site was also apparent.Rock movement of this size is impossible to measure with a Helley–Smith because of the narrow opening. Again, large channel traps,and in some cases radio transmitters and magnetic tracers, may havebeen useful in estimating the movement of this type of material(Ergenzinger and Custer, 1983; Church and Hassan, 2002; McNamara
43A.D. Ziegler et al. / Geomorphology 227 (2014) 31–48
and Borden, 2004; Habersack et al., 2012). As we only observed evi-dence of very coarse material once during the study period, we feelthat our assumption of a dominance of sand-transported material isstill valid for the range of flowmeasured.
Another error that may have caused an over-estimation of bedloadtransport is related to situations where one large storm removed therelatively easily transportable bedload stored in the channel near thegauging site, thereby creating a supply-limited condition (e.g., Sidle,1988). Use of our discharge-based estimate would therefore over-predict bedload during such conditions. However, this over-estimationmay balancewith the limitations outlined previously that lead to under-estimation. We therefore believe our estimate of an 18% bedload pro-portion to the total load is realistic.
We recognize the possibility of great annual and seasonal variabilityin both TSS and bedload, originating from changes in hillslope erosion,river channel and bank erosion, andmasswasting rates. Theseprocessesare affected by both annual rainfall variability, and anthropogenicactivities. For example, we witnessed the occurrence of several road-related landslides in the year prior to the study. The prior year wasalso hallmarked by a noticeable increase of tourist activities that con-tribute to accelerated erosion—chiefly elephant trekking (Sidle andZiegler, 2010), but also off-road biking and 4-wheeling. The commence-ment of the construction of several resorts, homes, and other structuresin flood plains and other areas directly connected with the stream sys-tem also increased greatly during this time. Furthermore, agriculturein the catchment has been transitioning from smallholder systems tolarger commercial endeavors, including greenhouse agriculture systemsthat require substantial landscape modification. Many of the high sedi-ment concentrations we observed during the study occurred duringlarge rainstorms situated in areas where construction or hillslope dis-turbance had occurred.
Finally we recognize that there is an unknown lag-time betweensediment production in the catchment versus when it is transportedin the stream as TSS or bedload. This time could be immediate, inthe case of landslides occurring on slopes above the stream system. Incontrast, it may be decades or longer for material eroded on hillslopesthat are not well-connected with the stream system (Sidle and Ochiai,
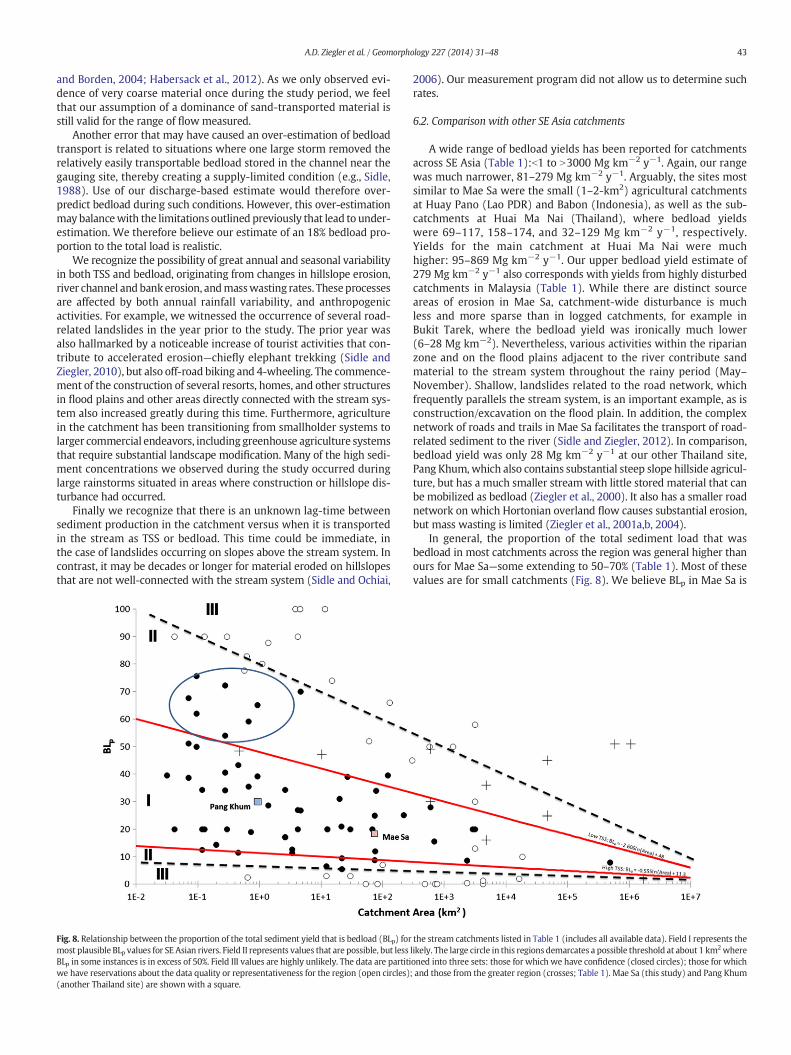
Fig. 8. Relationship between the proportion of the total sediment yield that is bedload (BLp) formost plausible BLp values for SE Asian rivers. Field II represents values that are possible, but lessBLp in some instances is in excess of 50%. Field III values are highly unlikely. The data are partitiwe have reservations about the data quality or representativeness for the region (open circles)(another Thailand site) are shown with a square.
2006). Our measurement program did not allow us to determine suchrates.
6.2. Comparison with other SE Asia catchments
A wide range of bedload yields has been reported for catchmentsacross SE Asia (Table 1):b1 to N3000 Mg km−2 y−1. Again, our rangewas much narrower, 81–279 Mg km−2 y−1. Arguably, the sites mostsimilar to Mae Sa were the small (1–2-km2) agricultural catchmentsat Huay Pano (Lao PDR) and Babon (Indonesia), as well as the sub-catchments at Huai Ma Nai (Thailand), where bedload yieldswere 69–117, 158–174, and 32–129 Mg km−2 y−1, respectively.Yields for the main catchment at Huai Ma Nai were muchhigher: 95–869 Mg km−2 y−1. Our upper bedload yield estimate of279 Mg km−2 y−1 also corresponds with yields from highly disturbedcatchments in Malaysia (Table 1). While there are distinct sourceareas of erosion in Mae Sa, catchment-wide disturbance is muchless and more sparse than in logged catchments, for example inBukit Tarek, where the bedload yield was ironically much lower(6–28 Mg km−2). Nevertheless, various activities within the riparianzone and on the flood plains adjacent to the river contribute sandmaterial to the stream system throughout the rainy period (May–November). Shallow, landslides related to the road network, whichfrequently parallels the stream system, is an important example, as isconstruction/excavation on the flood plain. In addition, the complexnetwork of roads and trails in Mae Sa facilitates the transport of road-related sediment to the river (Sidle and Ziegler, 2012). In comparison,bedload yield was only 28 Mg km−2 y−1 at our other Thailand site,Pang Khum, which also contains substantial steep slope hillside agricul-ture, but has a much smaller streamwith little stored material that canbe mobilized as bedload (Ziegler et al., 2000). It also has a smaller roadnetwork on which Hortonian overland flow causes substantial erosion,but mass wasting is limited (Ziegler et al., 2001a,b, 2004).
In general, the proportion of the total sediment load that wasbedload in most catchments across the region was general higher thanours for Mae Sa—some extending to 50–70% (Table 1). Most of thesevalues are for small catchments (Fig. 8). We believe BLp in Mae Sa is
the stream catchments listed in Table 1 (includes all available data). Field I represents thelikely. The large circle in this regions demarcates a possible threshold at about 1 km2whereoned into three sets: those for which we have confidence (closed circles); those for which; and those from the greater region (crosses; Table 1). Mae Sa (this study) and Pang Khum
44 A.D. Ziegler et al. / Geomorphology 227 (2014) 31–48
relatively low for two reasons. Firstly, the total suspended solid load intheMae Sa river is high throughout much of the rainy season. Sedimentconcentrations exceeding 2000–3000mg l−1 were common formoder-ate to large storms; and concentrations ranging from 10,000–14,000mgl−1were observed during brief spikes during large storms. Secondly, theaccuracy of TSS measurements in many of the other studies reportingboth suspended and bedload yields is not known.
Very few studies were conducted for more than one year, and there-fore, fail to capture the temporal variability of bedload transport. Vari-ability is high because of differing degrees of anthropogenic activityand unpredictable storm activity. Great variability in bedload transportin the Jengka catchment inMalaysiawas related to logging disturbances(Kasran, 1996). Anthropogenic disturbances that accelerated hillslopeerosion may increase total suspended loads, thereby reducing the con-tribution of bedload to total sediment loads (cf. Kasran, 1996). Thiswas demonstrated in the Bukit Tarek experimental catchments, whereBLp decreased from a value of 60% before logging, to 40% after logging(Yusop et al., 2006). If however mass wasting occurs, the bedload pro-portion may become a larger component of the total load, especially iflandslides and debris flows are directly linked to streams (Imaizumiand Sidle, 2012). Importantly, large rainfall events often associatedwith tropical storms late in the monsoon season (Wood et al., 2008;Lim et al., 2012) can mobilize the bulk of the annual load in some sys-tems (e.g., Shallow, 1956; Peart and Jayawardena, 1994). The pres-ence/absence of large storms was largely responsible for periods ofhigh and low bedload transport during the 15-year study in the smallcatchment in Hong Kong (Peart and Fok, 2006).
Although our estimates had errors related to sampling with theHelley–Smith sampler, they are useful from amanagement perspective.We now believe our total sediment yield estimate is higher thanwhat has generally been reported/assumed for rivers and streams inThailand. The scant literature on sediment transport in Thailand showsthe annual TSS yield in theMae Sa River (679–1037Mg km−2) is severaltimes higher than those reported for other rivers draining catchmentsb100 km−2 (Meybeck et al., 2003; Hartcher and Post, 2008): MaeSuk (100–154 Mg km−2), Mae Kong Kha (46–69 Mg km−2); andHuai Mae Ya (100 Mg km−2). Furthermore, the values are an order ortwo higher than the mean 14-y (1993–2006) annual sediment yield(53 Mg km−2 y−1) of the Ping River, to which Mae Sa drains (Woodand Ziegler, 2008; also see Alford (1992)). Thus, Mae Sa may be ahotspot for sediment entering the Ping river—at least for the year ofour study—and this has implications for reservoir management.
7. Part III: implications for reservoir management
The objective of combining a summary of prior studies in SE Asiaalong with our case study in Mae Sa was to explore trends in bedloadtransport variables for various-sized catchments in the region. Suchcomparisons have direct application for river management, includingimproving estimates of reservoir filling times. In Fig. 8, we partition theBLp data (including long-term means as well as annual values if avail-able) into data we think are reliable (solid circles) or potentially prob-lematic (open circles). Examples of the latter include estimates andback-calculations from limited data, as well as data originating fromstudies with considerable experimental error, or those representingunusual circumstances. In fairness, many of the data that we identify asreliable also have errors and associated uncertainty. Also shown arevalues from neighboring regions (crosses; Table 1).
With these uncertainties inmind, we identified fields correspondingto plausibility (Fig. 8). Field I delineates the BLp values that are mostrepresentative for the range of identified catchment areas. The Field IIvalues are possible, but they tend to be associated with situationsthat are unusual. Examples include severe catchment disturbances onthe high end (e.g. landslides), or diminished/disrupted stream on thelow end flow (for example obstructed by upstream dams). One of the
high values was determined for an undisturbed forest streamwithmin-imal suspended sediment. Field III values are improbable or unrealistic.
For Field I, values of 20–50% are possible for small catchments(b1 km2). Catchments on the order of 1000 km2 may have values rang-ing from 10 to 30%. Even for very large catchments BLp ranges from 5 to25%, but data are very limited. These data demonstrate that bedload intropical rivers and streams can be a substantial proportion of the totalload, as indicated in Section 2 (e.g., Roberts, 1991; Lai, 1993; Nagleet al., 1999; Saynor et al., 2006; Erskine et al., 2011). Also shown inFig. 8 is a threshold at about 1 km2where BLp in some instances is in ex-cess of 50% (demarcatedwith the large circle in Field II). In several of thereviewed studies, researchers remarked upon the episodic nature highbedload volumes with respect to the occurrence of large storms and/or disturbance. These phenomena have a significant effect on both theavailability of bedload material and its transport, particularly for shorttime scales. Again, most of the data shown in Fig. 8 are from veryshort campaigns. The high values may in some cases correspond to ex-treme years within a long time series for which the mean would belower. At larger catchment sizes, the effects of these short-term ex-tremes are not noticeable because the time scale of bedload movementis much slower. Similarly, some of the low values may also be related toextreme situations.
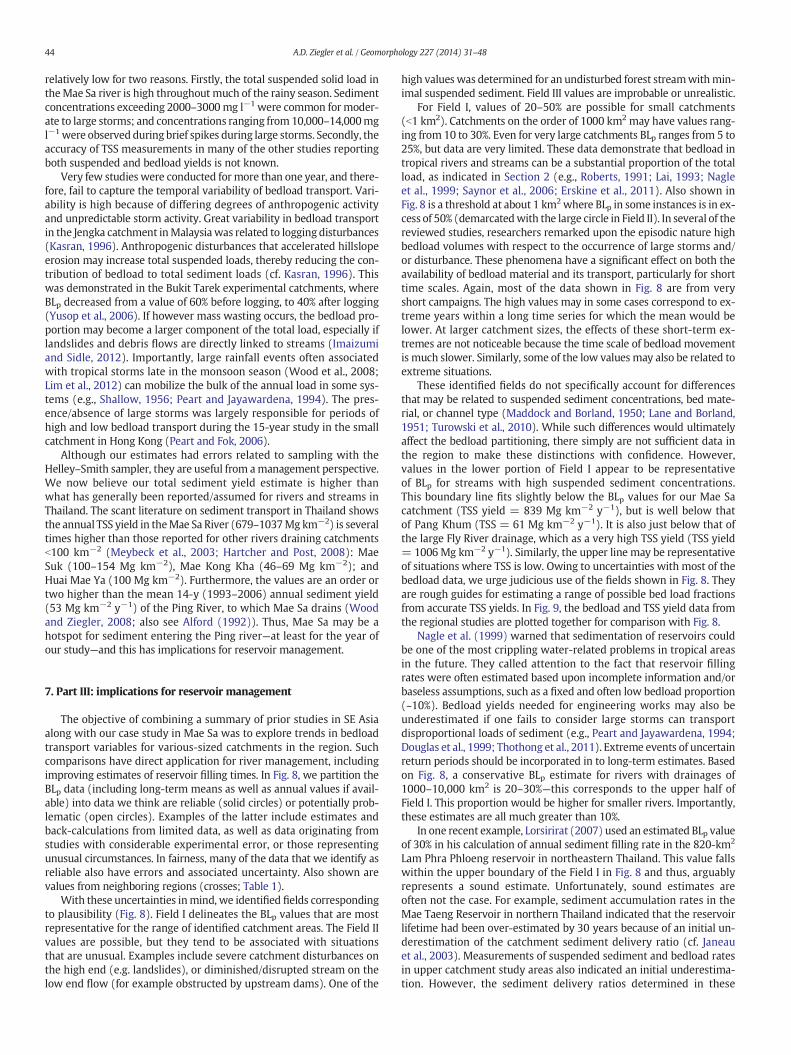
These identified fields do not specifically account for differencesthat may be related to suspended sediment concentrations, bed mate-rial, or channel type (Maddock and Borland, 1950; Lane and Borland,1951; Turowski et al., 2010). While such differences would ultimatelyaffect the bedload partitioning, there simply are not sufficient data inthe region to make these distinctions with confidence. However,values in the lower portion of Field I appear to be representativeof BLp for streams with high suspended sediment concentrations.This boundary line fits slightly below the BLp values for our Mae Sacatchment (TSS yield = 839 Mg km−2 y−1), but is well below thatof Pang Khum (TSS = 61 Mg km−2 y−1). It is also just below that ofthe large Fly River drainage, which as a very high TSS yield (TSS yield= 1006 Mg km−2 y−1). Similarly, the upper line may be representativeof situations where TSS is low. Owing to uncertainties with most of thebedload data, we urge judicious use of the fields shown in Fig. 8. Theyare rough guides for estimating a range of possible bed load fractionsfrom accurate TSS yields. In Fig. 9, the bedload and TSS yield data fromthe regional studies are plotted together for comparison with Fig. 8.
Nagle et al. (1999) warned that sedimentation of reservoirs couldbe one of the most crippling water-related problems in tropical areasin the future. They called attention to the fact that reservoir fillingrates were often estimated based upon incomplete information and/orbaseless assumptions, such as a fixed and often low bedload proportion(~10%). Bedload yields needed for engineering works may also beunderestimated if one fails to consider large storms can transportdisproportional loads of sediment (e.g., Peart and Jayawardena, 1994;Douglas et al., 1999; Thothong et al., 2011). Extreme events of uncertainreturn periods should be incorporated in to long-term estimates. Basedon Fig. 8, a conservative BLp estimate for rivers with drainages of1000–10,000 km2 is 20–30%—this corresponds to the upper half ofField I. This proportion would be higher for smaller rivers. Importantly,these estimates are all much greater than 10%.
In one recent example, Lorsirirat (2007) used an estimated BLp valueof 30% in his calculation of annual sediment filling rate in the 820-km2
Lam Phra Phloeng reservoir in northeastern Thailand. This value fallswithin the upper boundary of the Field I in Fig. 8 and thus, arguablyrepresents a sound estimate. Unfortunately, sound estimates areoften not the case. For example, sediment accumulation rates in theMae Taeng Reservoir in northern Thailand indicated that the reservoirlifetime had been over-estimated by 30 years because of an initial un-derestimation of the catchment sediment delivery ratio (cf. Janeauet al., 2003). Measurements of suspended sediment and bedload ratesin upper catchment study areas also indicated an initial underestima-tion. However, the sediment delivery ratios determined in these
Fig. 9. The relationship between bedload and total suspended solid yields for the SE Asianstreams. These data correspond with those shown in Fig. 8. The data are partitioned intothree sets: those for which we have confidence (closed circles); those for which wehave reservations about the data quality or representativeness for the region (opencircles); and those from the greater region (crosses; Table 1). Mae Sa (this study) isshown with a square.
45A.D. Ziegler et al. / Geomorphology 227 (2014) 31–48
small-catchment studies were half what was needed to account for thereservoir sedimentation. This example demonstrates the need for com-plete sediment budgets and accurate determinations of sediment deliv-ery for reservoir filling calculations.
Rarely have accurate sediment budgets been determined for catch-ments draining reservoirs worldwide prior to their building (Nagleet al., 1999). Yang et al. (2011) write that only after the constructionof 50,000 dams along the Yangtze River, with changes in sedimentload negatively affecting streams and deltaic regions, did researchbegin to focus on sediment loads. Rarely are sedimentation issues ad-dressed prior to dam building (Nagle et al., 1999). There are many ex-amples in the South and SE Asia region of unpredicted rapid declinesin reservoir storage capacity and lifetimes (Kothyari, 1996; Janeauet al., 2003; Wang et al., 2007; Fu et al., 2008; Thothong et al., 2011;Siti et al., 2012). Of concern now in SE Asia is the aggressive buildingof dams onmany tributary andmain stems of rivers such as theMekongand Salween without reliable sediment load data needed to estimatepotential impacts. Some believe the impacts could be far-reaching andcatastrophic (Ziv et al., 2012; Ziegler et al., 2013).
8. Conclusion
Despite uncertainties, our bedload estimates for theMae Sa river arein line with what others have found for SE Asian streams. The bedloadyield estimates were on the high end of what has been reported. In con-trast, the proportion of bedload comprising the total sediment loadwasrelatively low, probably because of the high suspended solid load in thestream. Bedload transport during the study may have been elevated bycoarse material that entered the stream from landslide affected areasduring the prior rainy season. High total suspended solid loads resultfrom erosion on steep-slope and intensive agricultural areas, roads,and other surfaces impacted by anthropogenic activities (e.g., elephanttrails, urbanized areas).
Collectively, our newmeasurements and the data from prior studiessuggest the bedload contribution to total sediment loads is not insignif-icant, as has been often assumed in the past. The limited data suggestthat bedload proportion could exceed 20–40% for streams larger than10 km2; higher for smaller streams. This finding reinforces the needfor accurate estimates of river suspended and bedload sediment loads
prior to building dams in the region. Past examples of rapid infillingof reservoirs and premature closure likely result, in part, fromunderestimating sediments loads, particularly the bedload component,as well as failing to factor in very high sediment loads associated withlarge storm events.
The 2011 Chao Phraya River flood in Thailand demonstrated the im-portance of understanding phenomena affecting river flow routing andreservoir storagemanagement, including sediment loads that could po-tentially reduce reservoir storage volumes (Komori et al., 2012; Ziegleret al., 2012). The evolution of road systems, expansion and intensifica-tion of agriculture, development on wetlands and river flood plains,and increasing population density in many headwater catchments inSE Asia are undoubtedly altering the input of bedload material tostreams, and should continue to do so in the future as land cover con-tinues to change (Nagle et al., 1999; Sidle et al., 2006; Sidle andZiegler, 2010, 2012; Fox et al., 2012; Sidle et al., 2013). From a largerperspective, the uncertain effects of climate change and its effect onthe global hydrological cycle and storm activity create additional chal-lenges for those tasked with managing water resources and mitigatinghazards associated with river systems.
Ourmeasurements and reviewdemonstrate that some streams in SEAsia may be hotspots for sediment entering larger rivers above reser-voirs (cf. Milliman and Syvitski, 1992). Throughout the region, damsare being built on the main branches and tributary streams of manyimportant river systems without sufficient information for estimatingreservoir filling times. Greater attention should be given to estimatingall phases of sediment and elemental fluxes from more river systemsin the region. Advances are also needed to reduce the uncertainty inthe estimates. Little progress has been made in these areas in the lasthalf century.
Acknowledgments
This work was supported in part by grants from the followingagencies APN (ARCP2006-07NMY, ARCP2007-01CMY), SARCS (95/01/CW-005), NASA (IDS/0365-0079), NSF (EAR-0000546). Special thanksis given to our colleagues Jefferson M Fox, Thomas W. Giambelluca,and Mike A Nullet, who were instrumental in the establishment ofmonitoring network atMae Sa.We also thankR.J.Wasson for commentson the manuscript. This document has been reviewed in accordancewith the U.S. Environmental Protection Agency policy and approvedfor publication. Mention of trade names or commercial products doesnot constitute an endorsement or recommendation for use.
References
Ab. Ghani, A., Zakaria, N.A., Abdullah, R., Chang, C.K., Sinnakaudan, S.K., Mohd. Sidek, L.,2003. River Sediment Data Collection and Analysis Study, Contract Research No. JPS(PP)/SG/2/2000. Department of Irrigation and Drainage, Malaysia, Kuala Lumpur(Available at: http://redac.eng.usm.my/html/projects/sediment/).
Ab. Ghani, A.A., Azamathulla, H.M., Chang, C.K., Zakaria, N.A., Hasan, Z., 2011. Prediction oftotal bed material load for rivers in Malaysia: a case study of Langat, Muda and KurauRivers. Environ. Fluid Mech. 11, 207–318.
Abdul Rahim, N., Kasran, B., Azman, H., 1985. Hydrological regimes of dipterocarp forestcatchments in Peninsular Malaysia. In: Sapalco, S.R., Baltazor, E.M., Gorospe, M.V.,Cavandang, V.Q. (Eds.), Proceedings of Seminar onWatershed Research andManage-ment Practices Serdang. ASEAN–US Watershed Project.
Alford, D., 1992. Streamflowand sediment transport frommountainwatersheds of theChaoPhraya Basin, Northern Thailand: a reconnaissance study. Mt. Res. Dev. 12, 257–268.
Alongi, D., Amaral, A., Carvalho, N., McWilliam, A., Rouwenhorst, J., Tirendi, F., Trott, L.,Wasson, R.J., 2009. The Timor-Leste coastal/marine habitat mapping for tourismand fisheries development project. Project No. 6. River Catchments and MarineProductivity in Timor Lest: Caraulun and Laclo Catchments; South and North Coasts.Charles Darvin University 1–90 (Available at: http://www.cdu.edu.au/research/atsef/36091-project6-secured-final.pdf).
Annandale, G.W., 2006. Reservoir sedimentation. Encyclopedia of Hydrological Sciences.John Wiley & Sons, Ltd. 1–13. http://dx.doi.org/10.1002/0470848944.hsa086.
Ariffin, J., 2004. Development of Sediment Transport Models for Rivers in Malaysia UsingRegression Analysis and Artificial Neural Network. (PhD) University of ScienceMalaysia, Penang, Malaysia.

46 A.D. Ziegler et al. / Geomorphology 227 (2014) 31–48
Azamathulla, H.M., Chang, C.K., Ghani, A., Ariffin, J., Zakaria, N.A., Hasan, Z.A., 2009. AnANFIS-based approach for predicting the bed load for moderately sized rivers.J. Hydro Environ. Res. 3, 35–44.
Bricquet, J.P., Janeau, J.L., Boonsaner, A., Huon, J.P.L., Boulais, C., Lestrelin, G., Kurian, M.,2004. Catchment approach to combating soil erosion in Thailand. Annual report 2003.IWMI Southeast Asia Regional Office, Bangkok, Thailand, pp. 125–151 (Available at:www.publications.iwmi.org/pdf/h037208.pdf).
Bruijnzeel, L.A., 1983. Hydrological and Biogeochemical Aspects of Man-made Forestsin South-central Java, Indonesia. (Ph.D. Thesis) Free University, Amsterdam 1–260(Available at: http://hydrology-amsterdam.nl/personalpages/Sampurno/Bruijnzeel_1983.pdf).
Buffington, J.M., Montgomery, D.R., 1999. Effects of sediment supply on surface texturesof gravel-bed rivers. Water Resour. Res. 35, 3523–3530.
Bunte, K., Abt, S.R., Potyondy, J.P., Swingle, K.W., 2008. A comparison of coarse bedload trans-port measuredwith bedload traps and Helley–Smith samplers. Geodin. Acta 21, 53–66.
Carbonnel, J.P., Guiscafre, J., 1965. Grand lac du Cambodge: sedimentologie ethydrologie1962–63. Ministere des Affaires Etrangeres, Paris 1–401 (Available at:http://horizon.documentation.ird.fr/exl-doc/pleins_textes/pleins_textes_6/b_fdi_39-40/11144.pdf).
Chang, C.K., 2006. Sediment Transport in Kulim River, Kedah. (MSc Thesis) UniversitiSainsMalaysia, Penang.
Chang, C.K., Ab. Ghani, A., 2011. Sediment transport in Kulim River, Kedah, Malaysia. In:Ginsberg, Silvia Susana (Ed.), Sediment Transport. InTech. ISBN: 978-953-307-189-3,pp. 175–196. http://dx.doi.org/10.5772/15078 (Available at: http://www.intechopen.com/books/sediment-transport/sediment-transport-in-kulim-river-kedah-malaysia).
Chang, C.K., Ab. Ghani, A., Lim, H.W., 2007. Development of modified Einstein bed-loadequation for sandy stream in Malaysia. 2nd International Conference on ManagingRivers in the 21st Century: Solutions Towards Sustainable River Basins (Available athttp://redac.eng.usm.my/html/publish/2007_16.pdf).
Chappell, N.A., Tych, W., Yusop, Z., Rahim, N.A., Kasran, B., 2005. Spatially significanteffects of selective tropical forestry on water, nutrients, and sediment flows: amodelling-supported review. In: Bonell, M., Bruijnzeel, L.A. (Eds.), Forests, Water,and People in the Humid Tropics. Cambridge Press and UNESCO, pp. 513–553.
Chew, C.G., 1999. Economic Valuation of Soil Erosion and Sedimentation in CameronHigh-lands. (Masters Thesis) Faculty of Economics and Management, Universiti PutraMalaysia 1–11 (Available at: http://psasir.upm.edu.my/8241/1/FEP_1999_3_A.pdf).
Choy, F.K., 2002. Impact of Land Use Change on Hydroelectric Power Generation inCameron Highlands. (Masters thesis) University of Malaya 42–76.
Church, M., 2006. Bed material transport and the morphology of alluvial river channels.Annu. Rev. Earth Planet. Sci. 34, 325–354.
Church, M., Hassan, M.A., 2002. Mobility of bed material in Harris Creek. Water Resour.Res. 38 (11), 1237. http://dx.doi.org/10.1029/2001WR000753.
Church, M., Hassan, M.A., Wolcott, J.F., 1998. Stabilizing self-organized structures ingravel-bed-stream channels: field and experimental observations. Water Resour.Res. 34, 3169–3179.
Ciglasch, H., Amelung,W., Totrakool, S., Kaupenjohann, M., 2005.Water flow patterns andpesticide fluxes in an upland soil in northern Thailand. Eur. J. Soil Sci. 56, 765–777.
Ciglasch, H., Busche, J., Amelung, W., Totrakool, S., Kaupenjohann, M., 2006. Insecticidedissipation after repeated field application to a northern Thailand ultisol. J. Agric.Food Chem. 54, 8551–8559.
Coleman, J.M., Wright, L.D., 1975. Modern river deltas: variability of processes and sandbodies. Deltas: Models for Exploration. Houston Geological Society, pp. 99–149.
Cullen, J.R., Hoey, T.B., 2003. The causes of bedload pulses in a gravel channel: the impli-cations of bedload grain-size distributions. Earth Surf. Process. Landf. 28, 1411–1428.
Dadson, S.J., 2003a. Erosion of an Active Mountain Belt. (PhD Thesis) University ofCambridge, Wolfson College.
Dadson, S.J., Hovius, N., Chen, H., Dade, W.B., Hsieh, M.-L., Willett, S.D., Hu, J., Horng, M.-J.,Chen, M.-C., Stark, C.P., Lague, D., Lin, J., 2003b. Links between erosion, runoff variabil-ity and seismicity in the Taiwan Orogen. Nature 426, 648–651.
Detphachanh, S., 2000. Sedimentation Dynamics of a Small Hill Forest Catchment in UluLangat, Selangor, Malaysia. (Masters Thesis) Universiti Putra Malaysia 1–24.
Dietrich, W.E., Krichner, J.W., Ikeda, H., Iseya, F., 1989. Sediment supply and the develop-ment of the coarse surface layer in gravel-bedded river. Nature 340, 215–217.
Douglas, I., 1999. Hydrological investigations of forest disturbance and land cover impactsin South-East Asia: a review. Phil. Trans. R. Soc. Biol. Sci. 354, 1725–1738.
Douglas, I., Bidin, K., Balamurugan, G., Chappell, N.A., Walsh, R.P.D., Greer, T., Sinun, W.,1999. The role of extreme events in the impacts of selective tropical forestry on ero-sion during harvesting and recovery phases at Danum Valley, Sabah. Phil. Trans. R.Soc. Biol. Sci. 354, 1749–1761.
Ergenzinger, P.J., Custer, S.G., 1983. Determination of bedload transport using naturallymagnetic tracers: first experiences at Squaw Creek, Gallatin County, Montana.Water Resour. Res. 19, 187–193.
Erskine, W.D., Saynor, M.J., 2000. Assessment of the off-site geomorphic impacts ofuraniummining onMagela Creek, Northern Territory, Australia. Supervising ScientistReport 256Supervising Scientist, Canberra 1–59.
Erskine, W.D., Saynor, M.J., Evans, K.G., Moliere, D.R., 2011. Bedload transport, hydrologyand river hydraulics in the Ngarradj Creek catchment, Jabiluka, Northern Territory,Australia. Supervising Scientist Report 199Supervising Scientist, Darwin NT 1–75.
Fox, J., Vogler, J.B., Sen, O.L., Giambelluca, T.W., Ziegler, A.D., 2012. Simulating land-coverchange in montane mainland Southeast Asia. Environ. Manag. 49, 968–979.
Fu, K.D., He, D.M., Lu, X.X., 2008. Sedimentation in the Manwan reservoir in the UpperMekong and its downstream impacts. Quat. Int. 186, 91–99.
Garcia, C., Laronne, J.B., Sala, M., 2000. Continuous monitoring of bedload flux in a moun-tain gravel-bed river. Geomorphology 34, 23–31.
Geoffrey, J.G., Yusop, Z., 2005. Bed load transport from a regenerated forest catchment inSarawak. JurnalKejuruteraanAwam 17, 69–72.
Gomez, B., 1991. Bedload transport. Earth Sci. Rev. 31, 89–132.Gomi, T., Sidle, R.C., 2003. Bed load transport in managed steep-gradient headwater
streams of Southeastern Alaska. Water Resour. Res. 39 (12), 1–14. http://dx.doi.org/10.1029/2003WR002440.
Habersack, H.M., Nachtnebel, H.P., Laronne, L.B., 2001. The continuous measurementof bedload discharge in a large alpine gravel bed river. J. Hydraul. Res. 39,125–133.
Habersack, H., Kreisler, Aigner, J., Liedermann, M., Seitz, H., 2012. Spatio-temporalvariability of bedload transport. River Flow 2012: Proceedings of the InternationalConference on Fluvial Hydraulics, 1, pp. 423–430.
Harris, P.T., Baker, E.K., Cole, A.R., Short, S.A., 1993. A preliminary study of sedimentationin the tidally dominated Fly River Delta, Gulf of Papua. Cont. Shelf Res. 13, 441–472.
Hartcher, M.G., Post, D.A., 2008. The impact of improved landuse cover on the range ofmodelled sediment yield from two sub-catchments of the Mae Chaem, Thailand.Math. Comput. Simul. 78, 367–378.
Hassan, M.A., Church, M., 2000. Experiments on surface structure and partial sedimenttransport on a gravel bed. Water Resour. Res. 36, 1885–1895.
Helley, E.J., Smith,W., 1971. Development and calibration of a pressure difference bedloadsampler. USGS Water Resources Division Open-file report, pp. 1–18.
Henderson, G.S., Witthawatchutikul, P., 1984. The effect of road construction on sedimen-tation in a forested catchment at Rayong, Thailand. In: O'Loughlin, C.L., Pearce, A.J.(Eds.), Symposium on effects of forest land use on erosion and slope stability. IUFRO/East-West Centre/NZFS/USDA, University of Hawaii, Honolulu.
Hill, K.M., DellAngelo, L., Meerschaert, M.M., 2010. Heavy-tailed travel distancein gravel bed transport: an exploratory enquiry. J. Geophys. Res. 115, F00A14.http://dx.doi.org/10.1029/2009JF001276.
Hinderer, M., 2012. From gullies to mountain belts: a review of sediment budgets at var-ious scales. Sediment. Geol. 280, 21–59.
Hoey, T., 1992. Temporal variations in bedload transport rates and sediment storage ingravel-bed rivers. Prog. Phys. Geogr. 16, 319–338.
Hu, B., Yang, Z., Wang, H., Bi, N., Li, G., 2009. Sedimentation in the Three Gorges Dam andthe future trend of Changjiang (Yangtze River) sediment flux to the sea. Hydrol. EarthSyst. Sci. 13, 2253–2264.
Imaizumi, F., Sidle, R.C., 2012. Effect of forest harvesting on hydrogeomorphic processes insteep terrain of central Japan. Geomorphology 169–170, 109–122.
Institute of Meteorology and Hydrology, Hanoi, (IMH), 1998. Control of soil erosion andsedimentation in the central Highlands of Vietnam. Environment Unit, MRC, RegionalWorkshop on Soil Erosion and Sedimentation Studies: Closing Phase I/InitiatingPhase II, 11–14 November 1997, Vientiane, Lao PDR. Environment Unit, MekongRiver Commission Secretariat, Bangkok, pp. 127–151.
Janeau, J.L., Maglinao, A.R., Lorent, C., Bricquent, J.P., Boonsaner, A., 2003. The Off-SiteEffect of Soil Erosion: A Case Study of the Mae Thang Reservoir in NorthernThailand. International Water Management Institute, Bangkok, Thailand 191–202.
Kahl, G., Ingwersen, J., Nutniyom, P., Totrakool, S., Pansombat, K., Thavornyutikarn, P.,Streck, T., 2008. Loss of pesticides from a litchi orchard to an adjacent stream innorthern Thailand. Eur. J. Soil Sci. 59, 71–81.
Kasran, B., 1988. Effect of logging on sediment yield in a hill dipterocarp forest in Penin-sular Malaysia. J. Trop. For. Sci. 1, 56–66.
Kasran, B., 1996. Bedload sediment yield in a logged-over tropical forest. J. Trop. For. Sci. 8(3), 427–429.
Kasran, B., Nik, A.R., Zulkifli, Y., 1996. Hasil Enapan Di KawasanPertanian TanahTinggi. Prosiding: Seminar HidrologiDataranTinggi. JawatankuasaKebangsaanMalaysia bagi. “International Hydrological Program (IHP)”, Kuala Lumpur,Malaysia, pp. 40–49.
Komori, D., Nakamura, S., Kiguchi, M., Nishijima, A., Yamazaki, D., Suzuki, S., Kawasaki, A.,Oki, K., Oki, T., 2012. Characteristics of the 2011 Chao Phraya River Flood in CentralThailand. Hydrol. Res. Lett. 6, 41–46.
Korup, O., 2012. Earth's portfolio of extreme sediment transport events. Earth Sci. Rev.112, 115–125.
Kothyari, U.C., 1996. Erosion and sedimentation problems in India. Erosion and SedimentYield: Global and Regional Perspectives (Proceedings of the Exeter Symposium,July 1996), no.236. IAHS Publication, Oxfordshire, UK, pp. 531–539.
Lai, F.S., 1993. Sediment yield from logged, steep upland catchments in PeninsularMalaysia. Hydrology of Warm Humid Regions (Proceedings of the YokohamaSymposium), no.216. IAHS Publication, Oxfordshire, UK, pp. 216–229.
Lai, F.S., Detphachanh, S., 2006. Sediment production during an unusually dry year in thesteep forested Sungai Pangsun catchment, Selangor, Peninsular Malaysia. For. Ecol.Manag. 224, 157–165.
Lai, F.S., Lee, M.J., Mohd Rizal, S., 1995. Changes in sediment discharge resulting fromcommercial logging in the Sungai Lawing basin, Selangor, Malaysia. Effects of Scaleon Interprétation and Management of Sediment and Water Quality (Proceedingsof an International Symposium held at Boulder, July 1995), no. 226. IAHS Publ.,Oxfordshire, UK, pp. 55–62.
Lane, E.W., Borland, W.M., 1951. Estimating bed load. Trans. Am. Geophys. Union 32,121–123.
Laronne, J.B., Reid, L., 1993. Very high rates of bedload sediment transport by ephemeraldesert rivers. Nature 366, 148–150.
Lim, H.S., Boochaphun, K., Ziegler, A.D., 2012. Modifiers and amplifiers of high andlow flows on the Ping River in Northern Thailand (1921–2009): the roles of cli-matic events and anthropogenic activity. Water Resour. Manag. 26,4203–4224.
Lisle, T.E., 1995. Particle size variations between bed load and bed material in naturalgravel bed channels. Water Resour. Res. 31, 1107–1118.
Liu, H., Lan, H., Zhou, Yue, 2011. Characteristics of spatial distribution of debris flow andthe effect of their sediment yield in main downstream of Jinsha River, China. Environ.Earth Sci. 64, 1653–1666.

47A.D. Ziegler et al. / Geomorphology 227 (2014) 31–48
Lorsirirat, K., 2007. Effect of forest cover change on sedimentation in Lam PhraPhloengreservoir, Northeastern Thailand. In: Sawada, H., Araki, M., Chappell, N.A., LaFrankie,J.V., Shimizu, A. (Eds.), Forest Environments in the Mekong River Basin. Springer,New York, pp. 168–178.
Maddock, T., Borland, W.M., 1950. Sedimentation Studies for the Planning of Reservoirsby the Bureau of Reclamation. Technical Report. United States Department of theInterior, Bureau of Reclamation, Branch of Project Planning.
Maglinao, A.R., Valentin, C., a. Case One. Project Title—Catchment Approach to ManagingSoil Erosion in Asia. FAO Coporate Document Repository. Available at: http://www.fao.org/wairdocs/tac/y4953e/y4953e05.htm.
McNamara, J.P., Borden, C., 2004. Observations on the movement of coarse gravelusing implanted motion-sensing radio transmitters. Hydrol. Process. 18,1871–1884.
Meybeck, M., Laroche, L., Durr, H.H., Syvitski, J.P.M., 2003. Global variability ofdaily total suspended solids and their fluxes in rivers. Glob. Planet. Chang.39, 65–93.
Milliman, J.D., Farnswarth, K.L., 2011. River Discharge to the Coastal Oceans. A GlobalSynthesis. Cambridge University Press, New York.
Milliman, J.D., Meade, R.H., 1983. World-wide delivery of river sediment to the oceans.J. Geol. 91, 1–21.
Milliman, J.D., Syvitski, J.P.M., 1992. Geomorphic/tectonic control of sedimentdischarge to the ocean: the importance of small mountainous rivers. J. Geol. 100,525–544.
Moog, D.B., Whiting, P.J., 1998. Annual hysteresis in bed load rating curves. Water Resour.Res. 34, 2393–2399.
Nagle, G.N., Fahey, T.J., Lassoie, J.P., 1999. Management of sedimentation in tropical water-sheds. Environ. Manag. 23, 441–452.
Ongprasert, S., 1995. Lemon grass (Cymbopogon citrates) strips: capacity to con-trol soil erosion and their effect on soil fertility. Soil Fertility Conservation Re-search Report 1994. Mae Jo University, Thailand and KU Leuven, Belgium,pp. 84–96.
Orange, D., Pham, D.R., Tran, D.T., des Tureaux, T.H., Laissus, M., Nguyen, D.P., Do, D.P.,Nguyen, V.T., Nieullet, N., Ballesteros, S., Lequeux, B., Phan, H.H.A., Lamezec, Y.,Mitard, C., Mahe, M., Bernard, R., Ducos, H., Zemp, D., Janeau, J.-L., Jouquet, P.,Podwojewski, P., Valentin, C., 2012. Long-term measurements on sloping lands innorthern Vietnam: impact of land use change on bed load output. Proceedings ofthe 3rd International Conference on Conservation Agriculture in Southeast Asia,Proceedings. Hanoi Vietnam, December 10–15, 2012 (Available at: http://horizon.documentation.ird.fr/exl-doc/pleins_textes/divers13-06/010058354.pdf).
Parsons, A.J., 2011. How useful are catchment sediment budgets? Prog. Phys. Geogr. 36,60–71.
Peart, M.R., Fok, L., 2006. Output of bed load sediment from a small upland drainage basinin Hong Kong. Sediment Dynamics and the Hydromorphology of Fluvial Systems(Proceedings of the Dundee Symposium July 2006), no. 306. IAHS Publication,Oxfordshire, UK, pp. 82–88.
Peart, M.R., Jayawardena, A.W., 1994. Some observations on bed load movement in asmall stream in Hong Kong. In: Olive, L.J., Loughran, R.J., Kesby, J.A. (Eds.), Variabilityin Stream Erosion and Sediment Transport (Proceedings of the Canberra SymposiumDecember 1994), no. 224. IAHS Publication, Oxfordshire, UK, pp. 71–76.
Pratt-Sitaula, B., Garde, M., Burbank, D.W., Oskin, M., Heimsath, A., Gabet, E., 2007.Bedload-to-suspended load ratio and rapid bedrock incision from Himalayanlandslide-dam record. Quat. Res. 68, 111–120.
Recking, A., 2012. Influence of sediment supply on mountain streams bedload transport.Geomorphology 175–176, 139–150.
Recking, A., Liébault, F., Peteuil, C., Jolimet, T., 2012. Testing bedload transportequations with consideration of time scales. Earth Surf. Process. Landf. 37,774–789.
Rijsdijk, A., 2012. Surface runoff and sediment yields from tropical volcanic uplandwater-sheds as influenced by climatic, geological, and land-use factors. In: Higgitt, D. (Ed.),Perspectives on Environmental Management and Technology in Asian River Basins.Springer, New York, pp. 69–92.
Roberts, R.G., 1991. Sediment Budgets and Quaternary History of the Magela Creek Catch-ment, Tropical Northern Australia. (Ph.D Dissertation) University of Wollongong1–569.
Rovira, A., Batalla, R.J., Sala, M., 2005. Fluvial sediment budget of a Mediterranean river:the lower Tordera (Catalan Coastal Ranges, NE Spain). Catena 60, 19–42.
Ryan, S.E., Porth, L.S., Troendle, C.A., 2002. Defining phases of bedload transport usingpiecewise regression. Earth Surf. Process. Landf. 27, 971–990.
Saynor, M.J., Erskine, W.D., Moliere, D.R., Evans, K.G., 2006. Water, solute and sedimentyields for a seasonal tropical river in northern Australia. 30th Hydrology and WaterResources Symposium, 4–7 Dec., 2006, Launceston, TAS, pp. 1–6.
Schindler, W.Y., Michel, C., Brukhardt-Holm, P., Banninger, D., Alewell, C., 2012. Measure-ment of spatial and temporal fine sediment dynamics in a small river. Hydrol. EarthSyst. Sci. 16, 1501–1515.
Shallow, P.G., 1956. River flow in the Cameron Highlands. Hydro-electric TechnicalMemorandum No. 3 of the Central Electricity Board, Federation of Malaya 27.
Shrestha, A.K., Wannick, A.E., 1989. Construction of the Marsyangdi Project in Nepal.International Water Power and Dam Construction, March, 1989UNESCO.
Sidle, R.C., 1988. Bed load transport regime of a small forest stream.Water Resour. Res. 24,207–218.
Sidle, R.C., Ochiai, H., 2006. Landslides: processes, prediction, and land use. Am. Geophys-ical Union, Water Resource Monograph, No. 18. AGU, Washington, D.C., p. 312.
Sidle, R.C., Ziegler, A.D., 2010. Elephant trail runoff and sediment dynamics in northernThailand. J. Environ. Qual. 39, 871–881.
Sidle, R.C., Ziegler, A.D., 2012. The dilemma of mountain roads. Nat. Geosci. 5,437–438.
Sidle, R.C., Ziegler, A.D., Negishi, J.N., Nik, A.R., Siew, R., 2006. Erosion processes in steepterrain—truths, myths, and uncertainties related to forest management in SE Asia.For. Ecol. Manag. 224, 199–225. http://dx.doi.org/10.1016/j.foreco.2005.12.019.
Sidle, R.C., Benson, W.H., Carriger, J.F., Kamai, T., 2013. A broader perspective on ecosys-tem sustainability: consequences for decision-making. Proc. Natl. Acad. Sci. U. S. A.110 (23), 9201–9208.
Sinnakaudan, S.K., Sulaiman, M.S., Teoh, S.H., 2010. Total bed material load equation forhigh gradient rivers. J. Hydro Environ. Res. 4, 243–251.
Sirdari, Z.Z., 2013. Bedload Transport of Small Rivers in Malaysia. (Ph.D Dissertation)UniversitiSains Malaysia 1–311.
Siti, H.A.T., Yusoff, M.S., Zorkeflee, A.H., 2012. Modeling of sedimentation pattern in BukitMerah Reservoir, Perak, Malaysia. Procedia Eng. 50, 201–210.
Slaymaker, O., 2003. The sediment budget as conceptual framework and managementtool. Hydrobiologia 494, 71–82.
Smith, R.D., Sidle, R.C., Porter, P.E., 1993a. Effects on bedload transport of experimental re-moval of woody debris from a forest gravel-bed stream. Earth Surf. Process. Landf. 18,455–468.
Smith, R.D., Sidle, R.C., Porter, P.E., Noel, J.R., 1993b. Effects of experimental removal ofwoody debris on the channel morphology of a forest, gravel-bed stream. J. Hydrol.152, 153–178.
Sterling, S.M., Church, M., 2002. Sediment trapping characteristics of a pit trap and theHelley–Smith sampler in a cobble gravel bed river. Water Resour. Res. 38, 1901–1911.
Struck, M., Andermann, C., Bista, R., Korup, O., 2013. Towards a complete contemporarysediment budget of a major Himalayan river: Kali Gandaki, Nepal. Geophysical Re-search Abstracts, vol. 15 (EGU2013-7008-2. EGU General Assembly 2013. Availableat: http://meetingorganizer.copernicus.org/EGU2013/EGU2013-7008-2.pdf).
Talib, S.H.A., Yusoff, M.S., Hasan, Z.A., 2012. Modeling of sedimentation pattern in BukitMerah Reservoir, Perak, Malaysia. Procedia Eng. 50, 201–210.
Tebakari, T., Yoshitani, J., Suvanpimol, P., 2012. Impact of large-scale reservoir opera-tion on flow regime in the Chao Phraya River basin, Thailand. Hydrol. Process. 26,2411–2420.
Thothong, W., Huon, S., Janeau, J.-L., Boonsaner, A., Rouw, A., Planchon, O., Bardoux, G.,Parkpian, P., 2011. Impact of land use change and rainfall on sediment and carbonaccumulation in a water reservoir of North Thailand. Agric. Ecosyst. Environ. 140,521–533.
Toan, T.D., Orange, D., Podwojewski, P., Phai, D.D., Phien, T., Maugin, J., Rinh, P.V., 2003.Soil erosion and land use in the Dong Cao Catchment in Northern Vietnam. Interna-tionalWater Management Institute (IWMI) IWMI Publications 165–179 (Available athttp://publications.iwmi.org/pdf/H036272.pdf).
Turkelboom, R., Poesen, J., Trebuil, G., 2008. Themultiple land degradation effects by land-use intensification in tropical steeplands: a catchment study from northern Thailand.Catena 75, 102–116. http://dx.doi.org/10.1016/j.catena.2008.04.012.
Turowski, J.M., Ricernmann, D., Dadson, S.J., 2010. The partitioning of the total sedimentload of a river into suspended load and bedload: a review of empirical data. Sedimen-tology 57, 1126–1146.
Valentin, C., Agus, F., Alamban, R., Boosaner, A., Bricquet, J.P., Chaplot, V., de Guzman, T., deRouw, A., Januea, J.L., Orange, D., Phachomphonh, K., Do Duy, Phai, Podwojewski, P.,Ribolzi, O., Silvera, N., Subagyono, K., Thiebaus, J.P., Tran Duc, Toan, Vadari, T., 2008.Runoff and sediment losses from 27 catchments in Southeast Asia: impact of rapidland use changes and conservation practices. Agriculture Ecosystems and Environ-ment 128, 225–238. http://dx.doi.org/10.1016/j.agee.2008.06.004.
Vericat, D., Church, M., Batalla, R.J., 2006. Bed load bias: comparison of measurementsobtained using two (76 and 152 mm) Helley–Smith samplers in a gravel bed river.Water Resour. Res. 42. http://dx.doi.org/10.1029/2005WR004025.
Walsh, J.P., Ridd, P.V., 2008. Chapter 4 processes, sediments, and stratigraphy of the FlyRiver Delta. Dev. Earth Environ. Sci. 9, 153–176.
Wang, Z.-Y., Wu, B., Wang, G., 2007. Fluvial processes and morphological response in theYellow andWeiheRivers to closure andoperation of SanmenxiaDam. Geomorphology91, 65–79.
Wang, J.-J., Lu, X.X., Kummu, M., 2011. Sediment load estimates and variations in theLower Mekong River. River Res. Appl. 27, 33–46.
Wasson, R.J., 2008. Upland deforestation, erosion, and downstream impacts. In: Sanchez,I.B., Alonso, C.L. (Eds.), Deforestation Research Progress. Nova Science Publishers Inc.,New York, pp. 51–65.
Wilson, C.G., Papanicolaou, A.N.T., Denn, K.D., 2012. Partitioning fine sedimentloads in a headwater system with intensive agriculture. J. Soils Sediments 12,966–981.
Wood, S.H., Ziegler, A.D., 2008. Floodplain sediment from a 100-year-recurrenceflood in 2005 of the Ping River in northern Thailand. Hydrol. Earth Syst. Sci. 12,959–973.
Yahaya, N.K., 1999. Development of Sediment Rating Curves for Rivers in Malaysia. CaseStudies of Pari, Kerayong, and Kulim Rivers. (MSc Thesis) Universit Sains Malaysia,Penang.
Yang, S.L., Milliman, J.D., Li, P., Xu, K., 2011. 50,000 dams later: erosion of the YangtzeRiver and its delta. Glob. Planet. Chang. 75, 14–20.
Yarnell, S.M., Mount, J.F., Larsen, E.W., 2006. The influence of relative sediment supply onriverine habitat heterogeneity. Geomorphology 80, 310–324.
Yeh, K.-C., Wang, S.S.Y., Chen, H., Liao, C.-T., Jia, Y., Zhang, Y., 2010. Numerical simulationof sediment transport andmorphological change of upstream and downstream reachof Chi–Chi weir. In: Angermann, L. (Ed.), Numerical Simulations—Examples andApplications in Computational Fluid Dynamics. InTech, Croatia. ISBN: 978-953-307-153-4 (Available at: http://www.intechopen.com/download/get/type/pdfs/id/12623).
Yu, G.-A., Wang, Z.-Y., Zhang, K., Chang, T.-C., Liu, H., 2009. Effect of incoming sedi-ment on the transport rate of bed load in mountain streams. Int. J. SedimentRes. 24, 260–273.

48 A.D. Ziegler et al. / Geomorphology 227 (2014) 31–48
Yuen, J.Q., Olin, P., Benner, S.G., Sutherland, R.A., Ziegler, A.D., 2012. Accumulation of po-tentially toxic elements in road deposited sediments in residential and light industrialneighborhoods in Singapore. J. Environ. Manag. 101, 151–163.
Yusop, Z., Douglas, I., Nik, A.R., 2006. Export of dissolved and undissolved nutri-ents from forested catchments in Peninsular Malaysia. For. Ecol. Manag. 224,26–44.
Ziegler, A.D., Giambelluca, T.W., Sutherland, R.A., 2000. Estimation of basin sediment fluxin the Pang Khum Experimental Watershed in Northern Thailand: the contributionsof roads and agricultural lands. Land–Water linkages in rural watershed electronicworkshop. FAO, United Nations.
Ziegler, A.D., Giambelluca, T.W., Sutherland, R.A., Vana, T.T., Nullet, M.A., 2001a. Contribu-tion of Horton overland flow contribution to runoff on unpaved mountain roads innorthern Thailand. Hydrol. Process. 15, 3203–3208.
Ziegler, A.D., Sutherland, R.A., Giambelluca, T.W., 2001b. Acceleration of Horton overlandflow & erosion by footpaths in an agricultural watershed in Northern Thailand. Geo-morphology 41, 249–262.
Ziegler, A.D., Giambelluca, T.W., Sutherland, R.A., Nullet, M.A., Yarnasarn, S., Pinthong, J.,Preechapanya, P., Jaiaree, S., 2004. Toward understanding the cumulative impacts ofroads in agricultural watersheds of Montane Mainland Southeast Asia. Agric. Ecosyst.Environ. 104, 145–158.
Ziegler, A.D., Giambelluca, T.W., Nullet, M.A., Sutherland, R.A., Tantasarin, C., Vogler, J.B.,Negishi, J.N., 2009. Throughfall in an evergreen-dominated forest stand in northernThailand: comparison of mobile and stationary methods. Agric. For. Meteorol. 149,373–384.
Ziegler, A.D., Lu, X.X., Tantasarin, C., 2011. Sediment load monitoring in the Mae Sa catch-ment in northern Thailand. Sediment Problems and Sediment Management in AsianRiver Basins (Proceedings of the workshop held at Hyderabad, India), no. 349. IAHSPublication, pp. 86–91.
Ziegler, A.D., Petney, T.N., Andrews, R.H., Grundy-Warr, C., Baird, I.G., Wasson, R.J.,Sithithaworn, P., 2013. Dams and disease triggers on the Mekong River. PLoSNeglected Tropical Diseases 7 (6), 1–4.
Ziegler, A.D., Lim, H.S., Tantasarin, C., Jachowski, N., Wasson, R.J., 2012. Floods, false hope,and the future. Hydrol. Process. 26, 1748–1750.
Ziegler, A.D., Benner, S.G., Tantasirin, C., Wood, S.H., Sutherland, R.A., Sidle, R.C., Jachowski,N.R.A., Lu, X., Snidvongs, A., Giambelluca, T.W., 2014. Turbidity-based sedimentmonitoring in northern Thailand: hysteresis, variability, and uncertainty. J. Hydrol.(submitted for publication).
Ziv, G., Baran, E., Nam, S., Rodríguez-Iturbe, I., Levina, S.A., 2012. Trading-off fish biodiver-sity, food security, and hydropower in the Mekong River Basin. Proc. Natl. Acad. Sci.109, 5609–5614.