high rates of bedload transport measured from infilling
TRANSCRIPT

Pikk
High rates of bedload transport measured from infilling rate of largestrudel-scour craters in the Beaufort Sea, Alaska
Erk Reimnitz and E. W. Kempema
U.S. Geological Survey345 Middlefield Road
Menlo Park, California 94025

,
High rates of bedload transport measured from infilling rate of large strudel-scour craters in the Beaufort Sea, Alaska
.By: Erk Reimnitz and Edward W. Kempema, U. S. Geological Survey,
345 Middlefield Road, Menlo Park, California 94025
ABSTRACT
Strudel scours are craters in the sea floor as much as 25 m wide and 6 m
deep, that are excavated by vertical drainage flow during the yearly spring
flooding of vast reaches of shorefast ice surrounding arctic deltas; they form
-2 -1at a rate of about 2.5 km yr . We monitored tm such craters in the
Beaufort Sea and found that in relatively unprotected sites they fill in by
deposition from bedload in 2 to 3
results in sand layers dipping at
strudel-scour crater, tiereas the
vertical. At the very bottom the
years. Net westward sediment transport
the angle of repose westward into the
west wall of the crater remains steep to
crater traps almost all bedload: sand,. .
pebbles, and organic detritus. As itiilling progresses, the materials are
increasingly Winnowd, and bypassing must occur. Over a 20-m-wide sector, an
exposed strudel scour trapped 360 m3 of bedload during twa seasons; this
-1 -1infilling represents a bedload transport rate of 9 m3 yr m . This rate
should be applicable to a 4.5-km-wide zone with equal exposure and similar or
shallo=r depth. Within this zone, the transport rate is 40,500 m3 yr-’,
similar to estimated longshore transport rates on local barrier beaches.
Based on of the established rate of cut and fill, all the delta-front deposits
should consist of strudel-scour fill. Vibracores typically show dipping
interbedded sand and lenses of organic material draped over very steep
erosional contacts, and an absence of horizontal continuity of strata--
criteria that should uniquely identify high-latitude deltaic deposits. Given
a short 2- to 3-year lifespan, most strudel scours seen in surveys must be old
1

and partially filled. The same holds tme for ice gouges and other
●
depressions not adjusted to summer
features record events of only the
of bottom reuorking of the shallow
turbidity, such as dredging, muld
waves and currents, and therefore such
past few years. In view of such high rates
shelf, any human activities causing
have little effect on the environment.
However, huge amounts of transitory material trapped by long causeways planned
for offshore development wuld result in major changes in the environment.
INTRODUCTION
The yearly spring flooding of vast expanses of shorefast ice on the inner
shelf in the Arctic, and the commonly violent draining of these floodwaters
through the ice, result in the formation of large scour craters called strudel
scours. Strudel scours, and their subsequent sediment fill, are important
erosional and depositional features of high-latitude deltaic environments
(REIMNITZ, et al., 1974). Recognition of these features may serve as a
criterion for identifying similar paleoenvironments. Industry considers
strudel scours to be one of the most serious geologic hazards to pipelines on
shallo~shelf areas affected by the phenomenon (L. J. Toimil, oral
communication, 1981). The purpose of this report is to present data and
observations on the infilling rate of tv.o strudel scours in diverse
environments of the shallow Beaufort Sea shelf near Prudhoe Bay, Alaska. Both
scours were similar in size, with lips at 2.5-m witer depth, but one was
sheltered by a nearby barrier island, tiereas the other was located on an
exposed prodelta.
A comparison of the measured rapid rate of strudel-scour excavation and
infilling with the generally slow rate of delta accretion in arctic regions
2

demonstrates strudel-scour fill as an important compositional component of
prodeltas. We present strong evidence that this strudel-scour fill consists
of materials supplied almost entirely by bedload transport. Thus; the rate of
infilling allows calculations of bedload transport rates that probably are
more reliable than those that could be obtained by any other means known to
us. Among the requirements for an efficient bedload transport sampler
(Hubbell, 1964) are the following:
(1)
(2)
(3)
(4)
(5)
(6)
it is very large compared to seabed relief, and therefore gives a good
average,
it should not alter bedload discharge
it should collect the largest as well
it should give all particles an equal
of size and direction of movement,
sampler is stable, and
by changing local flow patterns,
as the smallest
opportunity for.
bedload particles,
entrance, regardless
sampling period is long relative to period of changing hydraulic
conditions.
As the strudel scours monitored meet these requirements
better than most man-made devices, the bedload transport rates
from this study should be close to actual rates of transport.
BACKGROUND INFORMATION
determined
Wave and current rewrking of the inner-shelf surface is restricted to
the short open-water season starting in July and extending to the onset of
freezeup in late September to early October. Current-meter records from
November to January show maximum flow velocities decreasing from 10- to less
than 2-cm s“ (MATTHEWS, 1981). Diving observations made under the ice during
the winter revealed only very low current velocities. Under-ice current
3

. observations made during the time and within the area of overflow are too
sketchy to indicate whether rewrking of bottom sediment occurs during
overflow. Currents do not increase noticeably until about mid-July, *en the
ice breaks up (BARNES, 1982). The rivers of northern Alaska begin carrying
water to the sea by the end of May or early June, *en the fast ice is 1.7 to
2 m thick and still intact. This ice is inundated by 0.5 to 1.5 m of fresh
water for distances of as much as 15 km or even more from the river mouths
(REIMNITZ and BRUDER, 1972; REIMNITZ et al., 1974; WALKER, 1974). Figure 1
shows a part of the Beaufort Sea shelf in the vicinity of the Prudhoe Bay
oilfields at a time *en those rivers with headmters in the Brooks Range are
beginning to flow, while those with draimge basins entirely within the
coastal plain are still dormant.
When the coastal-plain drainage systems thaw and the flooding is at its
maximum, the inundated ice areas may nearly merge, espec”lally between the
Colville and Kuparuk Rivers. Within a few days, however, most of the flood-
waters drain off the ice. This draining occurs at orifices within the ice
(Fig. 2) that serve as focal points for vertically oriented axial jets with
vertical motion; these orifices are called strudel, after the German wxd for
“whirlpool” (REIMNITZ and BRUDER, 1972). Because seawater depths in the
flooded areas are generally shallower than 6 m, the vertical jet encounters
the bottom and may excavate craters more than 4 m deep and 20 m across
(strudel scours) below the drainage points. The formerly flooded areas of
fast ice generally show only very small amounts of fine-grained surficial
sediment after draining is completed (REIMNITZ and BRUDER). There is a
growing body of information indicating that the Sagavanirktok River contri-
butes very little sediment at the time of river overflow.

.
.The Holocene marine sediment in the study area is only 2 to 10 m thick
(REIMNITZ et al., 1974), and delta accretion is virtuallY absent in the area
(RE~NITZ et al., 1979). This Holocene sediment generally consists of fine
muddy sand (BARNES, et al. , 1980); the underlying Pleistocene sediment ranges
in composition from overconsolidated silty clay (REIMNITZ and KEMP~A, 1980)
to gravel (RE~NITZ et al., 1974). In most areas this older sediment lies
within the range of penetration by modern strudel scours and deposits of
relict and modern sediment are mixed by the scouring action. This mixing
results in wide lateral variation and great complexity in the surficial-
sediment types in the areas affected by strudel scour (REIMNITZ et al., 1974;
BARNES et al., 1980). Because of the cut- and-fill process, high-resolution
seismic records taken within the area of river overflow show an absence of
coherent subbottom reflectors. Vibracores taken in a~ctic shallow-water-delta
areas contain sedimentary structures that are interpreted as representing
strudel scour fill (BARNES et al. , 1979) as discussed below. These
structures, however, are too small and without horizontal continuity, to be
resolvable on seismic records. Previously, REIMNITZ et al. (1974) speculated
that strudel-scour relief seen near river mouths may represent several decades
of strudel scour and that the scours fill in only slowly; the present studies,
however, indicate otherwise.
METHODS OF STUDY
The key to the study of the infilling rate of strudel scours was precise
navigation, which allowed us to revisit the same strudel scours in successive
field seasons. This precision was provided by range/range mvigation systems
(Del Norte Trisponder and Motorola Miniranger*) aboard the 13-m research
*Any use of trade names and trademarks in this report is for descriptive purposesonly and does not constitute endorsement by the U.S. Geological Survey
5

vessel Karluk. Side-scan sonar and a narrow beam
=re used to locate and survey particular strudel
high-resolution fathometer
scours. To determine the
maximum depth of a particular crater, many
directions, with closely spaced buoys used
crossings were made in various
as reference points. “Once the
deepest point of the crater =s located, we let the boat drift across with the
fathometer running. This technique provided detailed cross sections.
One of the tw strudel scours monitored ws also marked by
driven into the center by divers, by a 45-kg weight placed next
and by a 35-m-long steel cable stretching from this weight to a
a metal post
to the post,
Danforth
anchor well away from the rim of the crater. The cable ws located in
successive years and led divers back to the post. The post was notched at
10-cm intervals to provide detailed observations of sediment accretion.
RESULTS
. .
Strudel scour A
One of the strudel scours monitored is located near Egg Island Channel
(A, Fig. 1), a tidal channel connecting Simpson
The bathymetric map (Fig. 3) is the result of a
Lagoon with the open ocean.
detailed bathymetric survey of
the channel on
Figure 3 shows
September 3, 1978, during tiich we
the position of the strudel scour,
crossed the strudel scour.
the trackline crossing it,
and
Egg
5*5
the fathogram recorded along this track. In this fathogram, the axis of
Island Channel lies at a depth of 6 m, the center of the strudel scour at
m, and the surrounding lagoon floor at 2.4 m. No attempt was made,
however, to determine the maximum depth of this crater during this first year
6

of” record, although from past experience with strudel-scour surveys, a maximum
depth of 1 m greater than shown on this chance crossing is likely.
Strudel scour A was resurveyed on August 24, 1980, with more than 20
trackline crossings; Figure 3 shows the deepest cross section rec”orded. The
crater was still a symmetrical cone, but its maximum depth in 1980 ws
4.4 m. Considering that 2 years earlier the strudel scour was more than
5.5 m deep (possibly 6.5 m), 1.5 to 2.1 m of sediment had accumulated within
that period. Sediment reworking is known to occur from July through
September, but may also occur during the overflow in June. Therefore the
strudel scour actually trapped sediment for 8 months, at a sediment deposition
rate of 15 to 25 cm per month.
Strudel scour B
A side-scan-sonar search for specific strudel scours on the Sagavanirktok
delta on
(Fig. 1)
September 17, 1978, resulted in the selection
in an area generally 2.5 m deep. The base of
of strudel scour B
the scour-crater -s
3.5 m below the surrounding sea floor, and the crater was 16 to 25 m in
diameter (Fig. 4). The
by an irregular pattern
the fathogram as 20- to
Fig. 4). During dives
found small scarps cut
side-scan sonar shows the surrounding sea floor marked
of distinct curving to jagged reflectors, visible on
30-cm-high ledges (northeast side of strudel scour,
along the steel grappling cable across this terrain, we
into firm-bedded sandy silt, which could be broken off
by hand. Low terrain betwsen these scarps was blanketed by fine
upper lip of the crater itself was a 10- to 50-cm-high scarp cut
sand. The
into bedded
sandy silt. Entering the crater from the east side and descending to the
floor, we first traversed several small scarps of bedded silt, thinly draped
7
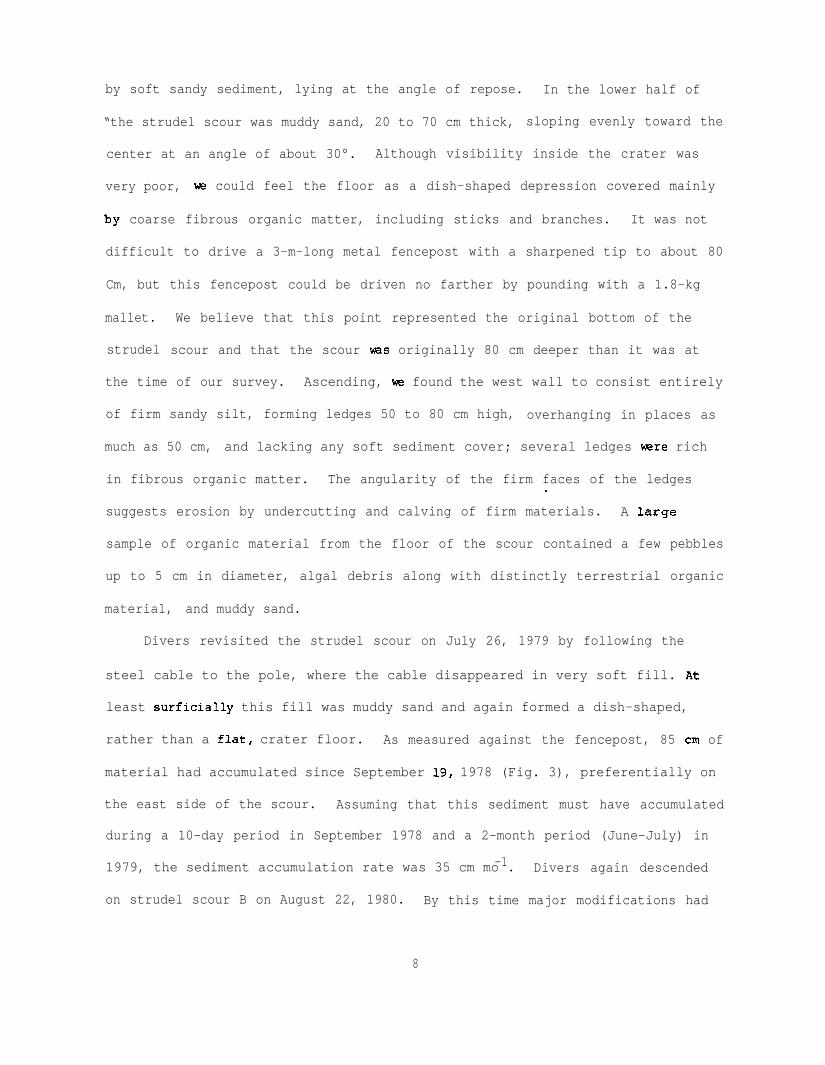
by soft sandy sediment, lying at the angle of repose. In the lower half of
“the strudel scour was muddy sand, 20 to 70 cm thick, sloping evenly toward the
center at an angle of about 30°. Although visibility inside the crater was
very poor, w could feel the floor as a dish-shaped depression covered mainly
by coarse fibrous organic matter, including sticks and branches. It was not
difficult to drive a 3-m-long metal fencepost with a sharpened tip to about 80
Cm, but
mallet.
strudel
this fencepost could be driven no farther by pounding with a 1.8-kg
We believe that this point represented the original bottom of the
scour and that the scour W%S originally 80 cm deeper than it was at
the time of our survey. Ascending, we found the west wall to consist entirely
of firm sandy silt, forming ledges 50 to 80 cm high, overhanging in places as
much as 50 cm, and lacking any soft sediment cover; several ledges were rich
in fibrous organic matter. The angularity of the firm faces of the ledges.
suggests erosion by undercutting and calving of firm materials. A large
sample of organic material from the floor of the scour contained a few pebbles
up to 5 cm in diameter, algal debris along with distinctly terrestrial organic
material, and muddy sand.
Divers revisited the strudel scour on July 26, 1979 by following the
steel cable to the pole, where the cable disappeared in very soft fill. At
least surficially this fill was muddy sand and again formed a dish-shaped,
rather than a flat, crater floor. As measured against the fencepost, 85 cm of
material had accumulated since September 19, 1978 (Fig. 3), preferentially on
the east side of the scour. Assuming that this sediment must have accumulated
during a 10-day period in September 1978 and a 2-month period (June-July) in
-11979, the sediment accumulation rate was 35 cm mo . Divers again descended
on strudel scour B on August 22, 1980. By this time major modifications had
8

. occurred on the sea floor~ and the strudel scour was nearly filled. We
follo=d the cable to the point Mere it disappeared vertically into the sedi-
ment, extending toward the former strudel-scour floor.
The surface of the strudel-scour fill was rippled fine sand.’ The top of
the fencepost did not protrude because we had purposely kept it below the
level of the surrounding terrain to avoid ice damage. The cable extending
away from the crater was slack and draped across or around ledges of firm
bedded sandy silt with anqular fresh-appearing scarps as much as 50 cm hiqh.
Betkeen ledges, the
considerable effort
adjacent to strudel
when 2-m visibility
cable was deeply buried in fine muddy sand that required
to clear. Fiqure 5 shows a sonograph of the rouqh terrain
scour B, as recorded on the date of the final inspection,
and fresh-appearing exposures on this day allowed a closer
study of the firm friable bedded sandy silt exposed in scarps. Individual
beddinq planes were highly contorted on a small scale and over distances of 1
to 2 m showed
horizontal to
large-scale distortions that changed the attitude from
nearly vertical. Bedded exposures in places were rich in coarse
fibrous organic material.
In the period between the 1979 and 1980 observations of strudel scour B,
at most 4 months of open-water and sediment-transport conditions and infilling
of the strudel scour had elapsed. Durinq this period, 2.65 m of fill
accumulated in the scour, at an averaqe infilling rate of approximately
-160 cm mo .
SPACING OF STRUDEL SCOURS
REINNITZ et al. (1974) used side-scan-sonar records to map the
distribution of strudel scours in coastal areas of the Beaufort Sea. Because
9

of the difficulties in identifying with certainty all strudel ficours within
the seafloor areas scanned, they preferred to present only counts of strudel
scours per kilometer of
floor. Many
convinced us
additional
that those
high. Not all isolated
positive identification
ship’s track rather than per square kilometer of sea
years of
original
shallow-water mrk in the
counts (maximum 25 scours
same areas have
km-l) are much too
patches of high reflectivity are strudel scours, and
requires considerable fathometer-survey time.
Therefore, we used the best available aerial photographs for counting the
number of strudels in the previous winter’s ice canopy of the study area.
Figure 6 shows the Sagavanirktok delta on June 26, 1970, Men one of us also
made ground and aerial observations in the area. All the river water had
drained off the ice 2 to 3 weeks earlier, and only the outer fringes of the
formerly inundated ice remained intact. In order to count the number of
strudel, we drew circles to mark areas with distinct, apparently coherent
channel patterns on the ice. Surficial draimge channels feeding a particular
strudel do not seem to extend farther than about 100 m; thus, even where the
exact spot of drainage through the ice cannot be detected in this photograph,
a strudel lies somewhere within each circle. These circles mark major
strudel, likely to result in substantial bottom excavations. In addition,
however, many more minor strudels are present. In the ice areas so studied,
there vas an average of 2.5 major strudel per square kilometer.
DISCUSSION
The tw strudel scours monitored in this study, situated in strongly con-
trasting environments, represent highly efficient natural sediment traps.
Strudel scour A was sheltered from all sides by barrier islands or by areas
10

slfallower than 2 m. Westerly storms, resulting in high sea levels, could
provide for longer fetch than the predomimnt northeasterly wind and,
probably, for bottom re=rking at the site. Such storms did not occur during
the monitoring period. ‘IMUS, sediment transport in the area =S associated
mainly with currents flowing through the nearby tidal channel. The flow is
either lagoonward or sea=rd, and we have measured surface current velocities
-1unrelated to tides of about 100 cm s . During a period of several months
(May-November, 1979), a current-meter array deployed in the axis of the tidal
channel ws buried by sediment to about 2 m above the original channel floor
(Brian Matthews, oral communication, 1979). The lower accumulation rateS in
the strudel scour, not subject to scouring by horizontal currents, are
unexplained.
Strudel scour B is exposed to a fetch of 20 km from the northeast, the
domimnt wind direction. Much of the area between strudel scour B and the
windward barrier islands has a water depth of 6 to 7 m; furthermore, there is
no flow obstacle to wind-driven currents that develop here with easterly winds
(Barnes, et al., 1977). The more exposed position of this site relative to
that of strudel scour A probably accounts for the more rapid infilling of
strudel scour B.
A current meter moored for most of one summer at a depth of 5.5 m several
kilometers north of strudel scour B, recorded mainly westward currents,
averaging 15 cm s‘1 but peaking at 53 cm s-1 (Barnes et al., 1977). No major
storms occurred during those 52 days of recording, although peak velocities
were high enough to move coarse sand easily. Also, numerous bottom drifters
released in Stefansson Sound washed ashore far wstward of their release
points (our own unpublished data, 1979); thus, net water movement near the
11

.
bottom clearly is westmrd. The magnitude of westwerd bedload transport at
. another site on the Sagavanirktok delta, with nearly identical setting, 2.5-m
water depth and 13-m s-1 easterly winds, was observed during a diving
investigation in 1976 (Reimnitz and Toimil, 1977). Near-bottom currents of 25
to 50 cm s-1 moved fine sand, kelp, willow leaves, grassy material, and twigs
in 1- to 2-m-wide current-parallel streaks.
divers observed drag marks formed by pebbles
the bottom.
These data and the following additional
At the time of the investigation,
with attached kelp moving along
observations on strudel scour B
suggest that its fill represents largely bedload transport: (1) the fathogram
and diving observations show an asymmetric cross section, with the deepest
point closer to the southwest wall and foreset beds of fine
angle of repose from the northeast lip of the crater toward
(2) the fill consists largely of sand-size material, coarse
sand draped at the
the center;
fibrous organic
matter, and a few pebbles, whereas summer-suspended matter is largely silt and
clay size (DRAKE, 1977); the fibrous organic matter is rarely seen on the sea
surface but is abundant on the bottom, and (3) observed at tw intermediate
stages of infilling, the strudel scour was conical, whereas infilling from
suspension load should have resulted in nearly horizontal bedding planes and a
flat floor.
Another strong argument in support of our contention that the strudel-
scour fill represents mainly bedload transport is provided by the data from
seven suspended-sediment traps deployed nearby in 1980. These traps, which
had orifices of 30.5 cm at a height of 30.5 cm above the bottom, ~re placed
in a 2-km2 area 4 km east of our study area, in water 3.5 m deep from mid-July
1980 to about the end of the year. The traps were deployed to monitor
12

se’dimentation around an artificial drilling island
During the 5 to 6 months of deployment, an average
during construction.
of 13.5 cm of sediment
with a median diameter of 0.1 mm accreted in the traps (NORTHERN TECHNICAL
SERVICES, 1981). This accumulation represents approximately one seasoml
sedimentation cycle plus artificial contributions from gravel island
construction. Yet the accumulation rate in the suspended sediment traps was
an order of magnitude lower than that in strudel scour B.
During the 1978 and 1979 diving inspections, w found coarse fibrous
organic matter and a few pebbles near the bottom of the crater; higher above
these organic deposits, sandy materials rested along the sides. During the
final inspection dive, when infilling was complete, the surficial deposits of
the strudel scour consisted of clean sand. This vertical sequence of
materials probably is typical of all strudel scour fill in this area. The
internal sedimentary structures of strudel-scour fill should reveal the
mechanism of lateral infilling, and sediment textures should display better
sorting in the uppermost section of the fill which reflects the final stages
of infilling.
In support of the above speculation on the mture of strudel scour fill,
Figure 7 shows a 1.5-m-long vibracore collected 2,000 m southwest of strudel
scour B. BARNES et al. (1979) reported that this core is typical of a series
of 12 cores taken in shallow waters on four arctic river deltas. Only
features relevant to strudel scouring of the seabed, and the strudel-scour
infilling are mentioned here. The core shows evidence of several erosional
episodes: rip-up material and mudballs, a thick unit of coarse fibrous
organic matter on an erosional surface, and a thick unit of steeply dipping
bedded sand on an erosional surface; the core also contains several ripple-
bedded sand units. The orientation of the coring device was recorded, and the
13

beds dip westerly. This core may record several scour-and-fill events. Most
‘important, very little sediment suggesting settling from suspension is seen in
this and the
the material
depressions.
other 11 shallow-delta cores of BARNES et al. (1979); the bulk of
probably was supplied as bedload, and deposited in scour
The structures observed by divers in 30- to 50-cm-high ledges on
the sea floor surrounding strudel scour B wuld also agree with the concept of
erosion, bedload transport, and deposition, as described above.
Assuming that the fill of strudel scour B indeed represents bedload and
that the crater is an efficient trap, we can use the rate
calculate the rate of bedload transport past the site. A
cross section of the crater measured 20 m wide at the sea
of infilling to
north-south oriented
floor. The crater
volume, calculated from the first-measured profiles and assuming a conical
shape, was 360 m3. In reality, the original shape was probably more cylin-. .
drical than conical, judging from the nearly vertical wsst wall. Thus, the
3crater collected 180 m of bedload in a year. Divided by the 20-In width of
the trap, the bedload transport rate past a l-m seafloor segment is 9 m3yr-
1 . During the final stages of infilling, the ~11-sorted sands collected to
form a cap for the fill, and the former crater was no longer an efficient trap
for bedload. We believe that the final stages of infilling occurred during
particularly windy fall days of 1979, not during the summer of 1980, when we
last looked at strudel scour B. Thus, because of the decreasing efficiency
and early completion, and the conical shape conservatively used in the
calculations, the actual bedload transport rate is certainly higher than the
calculated rate. Because weather records for the tvm seasons of bedload
trapping show very little winds from the west and strongest winds from the
east, the calculated bedload-transport rate is probably nearly equal to the
net westmrd transport rate.
14

‘ The following considerations will demonstrate the significance of the
above measurements. The transport rate of 9 m3yr-Im-l past strudel scour B,
which probably applies to a wide area, suggests very high rates of sediment
movement on the shelf. From the shore to
gently sloping surface, about 4.5 km wide
angle to the westward transport. Strudel
the 3-m isobath the delta front is a
in a section oriented at a right
scour B lies near the outer edge of
this platform, where transport rates probably are lower than at shallower
depths shoremrd. If the measured transport rate is applied to the total
width of this platform, a value of 40,500 m3yr-1 of sediment is derived, most
likely a conservative estimate. NLklMEDAL (1979), on the basis of his own
calculations and a summary of published data from the north shores of Alaska,
estimates the transport rate along present barrier beaches at “a few tens of
thousands of m3yr-1.,1 This longshore-transport estimate nearly equals our
measured bedload-transport rate over only a mrrow segment of the shallow
shelf. Resolution Island, an artificial island built several hundred yards
from strudel scour B, contains 131,000 m3 of gravel, a small volume relative
to the sediment volume moved by nature. A comparison of the yearly bedload
transport rate to the small amount of sediment that actually accumulated at
the site since the last transgression,
environment. The base of the Holocene
base of the modern Sagavanirktok River
reveals the dynamic nature of the
marine sediment in the area, or the
delta seen in seismic reflection
records, lies only 2 to 3 m below the sea
drilling (EVANS et al., 1980).
The high rates of bedload transport,
floor. This depth was confirmed by
together with the low rates of
sediment accretion, attest to the dynamics of this depositional environ-
me nt. The fresh ledges observed by divers and seen on side-scan sonar, and
the deep burial of our grappling cable below clean sand, are further evi-
15

dence. These findings suggest that the abundant ice gouges seen in shallow
‘shelf areas exposed to drifting ice, represent only a few years of ice
activity. BARNES and REIMNITZ (1979) sho%d that waves and currents in one
relatively ice-free
terrain into one of
leaving remmnts of
season with long fetch can transform a heavily ice-gouged
sediment waves extending out to 10-m water depths without
previously existing gouges. This bottom rewrking
probably occurred during only one or tm storms.
Given such high transport rates under natural conditions, the effects of
most dredging, drilling-mud discharge, and island-construction activity on the
environment muld seem to be insignificant. Howsver, the contemplated con-
struction of long causeways for offshore oil development, which probably wvuld
trap much of the sediment in transit (BARNES and MINKLER, 1982), would result
in drastic changes to the environment within only a few decades.
The ongoing strudel scouring and subsequent infilling of such excavations
result in characteristic structures that should serve as unmistakable criteria
for the recognition of ancient high-latitude deltaic deposits formed in
similar environments to a kater depth of at least 5 m. The following
considerations reveal just how dominant the structures resulting from such cut
and fill action should be. An average of 2.5 large strudel per square
kilometer were mapped in the ice canopy off the Sagavanirktok River. We
estimate that all these drainage systems were large enough to create a typical
15-m-diameter 3-m-deep scour depression on the sea floor below. Given these
values, any square
subbottom depth of
every 2,300 years;
require more time.
kilometer of sea floor in this area would be reworked to a
at least 2 m, where the craters still have vertical walls,
remrking to the full 6-m depth of strudel scouring muld
BARNES et al. (1979) noted the typical delta sequence seen
16
in 12
not e d
vibracores and the importance of strudel scour structures. They further
that of three vibracores taken over a 50-m distance, each vibracore
shored a typical delta sequence: bedded and crossbedded
alternating with layers of fibrous organic matter. None
units, however, could be correlated over distances of 20
clean sand layers
of these distinct
to 30 m. The
vibracore taken near strudel scour B clearly indicates the futility of trying
to trace individual beds even for short distances.
CONCLUSIONS
(1) Strudel scours as much as 25 m across and 6 m deep are excavated at a rate of
2.5 km-2yr-1 and are infilled with sediment after 2 to 3 years. At this
rate the entire delta front of arctic rivers should be totally rewrked in.
several thousand years and, therefore, should consist entirely of strudel-
scour deposits.
(2) Strudel scours trap materials supplied almost exclusively by bedload
transport. For the first year or two, they are efficient natural traps
and, therefore, should provide accurate bedload-transport rates.
(3) The calculated transport rate past one strudel scour is 9 m3yr-lm-1. This
rate, applied to a 4.5-km-wide strip of shallow water with similar condi-
-1tions, gives a bedload-transport rate of 40,500 m3yr , comparable to
estimates of longshore transport rates along local barrier beaches.
(4) This rapid infilling rate implies that the chances of seeing a strudel
scour without fill and, therefore, measuring the maximum depth on any one
survey is small, and further implies that all strudel scours, as well as
shallow--ter ice gouges, record only the most recent events.
17

(5) The characteristic deposits and.
overlain by bedded sand
repose, and the absence
structures: steep erosional unconformities
and coarse fibrous organic matter at the angle of
of horizontal continuity can be used to identify
ancient deposits from similar environments.
6) In view of the very high rates of sediment transport determined for natural
conditions,
operations,
the sediment input from human activities, such as dredging
seems insignificant. However, long causeways planned for the
offshore oil development muld act as groins and result in large-scale
shoreline modifications.
ACKNOWLEDQ4ENTS
This study wes funded in part by the Bureau
interagency agreement with the
stration, as part of the Outer
Program. We thank Doug
and diving observations
Maurer
of Land Mamgement through
National Oceanic and Atmospheric Admini-
Continental Shelf Environmental Assessment
for
on strudel
his help in the early phases of fieldwork
scour B.
18
FIGURE CAPTIONS
Figure 1. Landsat images of Prudhoe Bay area (between A and B) on June 6,.
1976, showing larger rivers flowing out across the fast ice. In
many years, flooded ice areas nearly merge in this area.
Figure 2. Overflow water from Kuparuk River draining at a strudel situated on
a crack in 2-m-thick fast ice. Overflow at this point is estimated
to be 1 to 1.5 m deep, and the water
deep. Distance across center of the
below the ice
photograph is
is 1 to 2 m
about 15 m.
Figure 3. Site of strudel scour A adjacent to Egg Island Channel, in
relatively sheltered locality. Inset shows fathogram across tidal
channel and scour in 1978, with 1980 profile superimposed. 1978
crossing of strudel scour A was by chance, and scour could have
been deeper than actually measured.
Figure 4. Fathogram of deepest profile of strudel scour B in 1978, and tm
successive years. Divers found vertical walls on upper 1 m of left
(~st) side and estimated original scour depth by driving the stake
shown .
Figure 5. Sonograph of sea floor adjacent to strudel-scour B after complete
infilling in 1980, showing the rough relief with fresh-appearing
ledges seen by divers.
19

. .
Figure 6. Orthophoto of Sagavanirktok delta showing remnants of fast ice on. .
June 26, 1970. Drainage systems feeding former strudel are
circled.
Figure 7. Resin peel of a vibracore taken 2,000 m from strudel scour B. Core
records several scour-and-fill events. Core is oriented with right
side to west (from Barnes et al., 1979).
.
20

REFERENCES
BARNES P. W. (1982) Hazards. In: Beaufort Sea Synthesis-Sale 71, D. W. ,
NORTON, and W. M. SACKINGER, editors, NOAA, Office of Marine Polution
Assessment, Juneau, Alaska, p. 89 (in press).
BARNES P. W. and P. W. MINKLER (1982) Sedimentation related to causeway
construction, Prudhoe Bay, Alaska. In: National Oceanic and Atmospheric
Administration, Environmental Assessment
Shelf: Principal Investigators Reports,
Report, 7 pp.
of the Alaskan Continental
Attachment A of 1981 Annual
BARNES P. W., ERK REl14NITZ, and DAVID McDOWELL (1977) Current meter and water
level observations in Stefansson Sound, summer, 1976. In: Miscellaneous
hydrologic and geologic observations on the inner Beaufort Sea shelf,
Alaska. P. W. BARNES, ERK REIMNITZ, D. E. DRAKE, and L. J. TOIMIL, U.S.
Geological Survey Open-File Report 77-477, B-1 to B-7.
BARNES P. W. and ERK REIMNITZ, (1979) Ice gouge obliteration and sediment
redistribution event - 1977-1978, Beaufort Sea, Alaska. U.S. Geological
Survey Open-File Report 79-848, 22 pp.
BARNES P. W., ERK REIMNITZ, L. J. TOIMIL, D. M. McD~ELL, and D. K. MAURER,
(1979) Vibracores, Beaufort Sea, Alaska: Descriptions and preliminary
interpretation. U.S. Geological Survey Open-File Report 79-351, 103 pp.
BARNES P. W., ERK REIMNITZ,
textures-- Beaufort Sea,
80-196, 41 pp.
and ROBIN ROSS (1980) Nearshore surficial sediment
Alaska. U.S. Geological Survey Open-File Report
21

DRAKE D. E. (1977) Suspended matter in nearshore waters of the Beaufort Sea
(1976) In: Miscellaneous hydrologic and geologic observations on
inner Beaufort Sea shelf, Alaska. P. W. BARNES, ERK REIMNITZ, D.
DRAKE, and L. J. TOI141L, U.S. Geological Survey Open-File Report
c-1 to C13.
EVANS C. D., J. J. WILSON, J. C. LaBELLE, J. L. WISE, S. CUCCARESE,
D. TRUDGEN, R. BECKER, A. L. CCFIISKEY, J. BALDRIDE, and S. WILSON
the
E.
77-477,
(1980)
Environmental review of summer construction of gravel islands: Sag Delta
No. 7 and No. 8, Stefansson Sound, Alaska, Arctic Environmental
Information and Data Center (AEIDC), Prepared for Sohio Alaska petrole~
Company.
HUBBELL D. W., (1964)
Geological Survey
MATTHEWS J. B. (1981)
Apparatus and techniques for measuring bedload.
Water-Supply Paper 1748, 74 pp.
Observations of under-ice circulation in a shallow
lagoon in the Alaskan Beaufort Sea. Ocean Management, 6, 223-234.
NORTHERN TECHNICAL SERVICES (1981) Environmental effects of 9ravel island
construction. Endeavor and Resolution Islands, Beaufort Sea, Alaska,
Prepared for Sohio Alaska Petroleum Company, Anchorage, Alaska, 62 pp.
NUMMEDAL, DAG, (1979) Coarse-grained sediment dymmics--Beaufort Sea,
Alaska. In: Proceedings of Port and Ocean Engineering Under Arctic
Conditions, NorWgian Institute of Technology, 845-858.
REIMNITZ, ERK and K. F. BRUDER (1972) River discharge into an ice-covered
ocean and related sediment dispersal, Beaufort Sea, coast of Alaska.
Geological Society of America Bulletin, v. 83, no. 3, 861-866.
REIMNITZ ERK, C. A. RODEICK and S. C. WOLF (1974) Strudel scour: A unique
arctic marine geologic phenomenon. Journal of Sedimentary Petrology,
v. 44, no. 2, 409-420.
22

.
.REIMNITZ, ERK, and L. J. TOJ.MIL (1977) Dive-site observations in the Beaufort
Sea, Alaska--l976. Natioml Oceanic and Atmospheric Administration,
Environmental Assessment of the Alaskan Continental Shelf: Principal
Investigators Reports, Apr. - June 1977, 2, 457-558.
REIMNITZ ERK, K. H. DUNTON and P. W. BARNES, (1979) Anchor ice and lack of
delta accretions in the tictic --A possible link. Geological Society of
America, Abstracts with Programs, v. 11, no. 7, 501.
REIMNITZ, ERK and E. W. KENPEMA (1980) Super sea-ice kettles in the arctic
nearshore zone - Reindeer Island. In: National Oceanic and Atmospheric
Administration, Environmental Assessment of the Alaskan Continental
Shelf: Annual Reports of Principal Investigators for the year ending
March, 1980, v. 4, 344-355.
WALKER H. J. (1974) The
interactions. In:
Colville River and the Beaufort Sea: Some
The Coast and Shelf of the Beau+ort Sea. J. C. REED
and J. E. SATER, editors, Proceedings of the Arctic Institute of North
America Symposium on Beaufort Sea Coast and Shelf Research, Arlington,
Virginia, Arctic Institute of North Ameria, 513-540.
23

L..
OTC 4310
Observations on the Mode and Rate of Decay of an Artificial IceIsland in the Alaskan Beaufort Seaby Erik Reimnitz, Edward Kempema, and C. Robin Ross, U.S. Geo/ogica/ Survey
This paper was presented at the 14th Annual OTC in Houston, Texas, May 3-6, 1982. The material is subjectto correction by the author. Permission to copy is restricted to an abstract of not more than 300 words.
In the Arctic ice is abundant and cheap, andtherefore has long been considered as structuralmaterial for offshore drilling platforms. InFebruary 1979 Exxon constructed an ice island 400 min diameter and 10 m thick, in water 3.5 m deep,about 6 km north of Prudhoe Bay, Alaska. The pur-pose of the experiment was to learn whether such anisland could survive one summer and then serve as aplatform for an extended drilling period the fol-lowing winter. Our studies of the decay of thisisland are based on: a) surface observation andphotography, b) diving observations and bottomphotos, c) fathometer, subbottom profiler and side-scan sonar surveys, and d) spot measurements ofwater salinity, temperature, and turbidity aroundthe island.
Thermal erosion, promoted by turbulent heattransfer from wave action and a relatively warmsurface water layer surrounding the island, re-sulted in a 3- to 5-m-deep notch at sea level,frequent calving, and a cantilevered, vertical .scarp above sea level around the island. Thewinds, waves, and surface currents that transportwarm river water past the island are predominantlyfrom the east. Therefore, thermal erosion andcalving were most rapid on the east side; they hadtruncated the island to the original center pointby late August. By early September, the last rem-nants of the island floated away. The submergedpart of the island, below the sea-level notch,consisted of an extensive pedestal reaching as muchas 15 m beyond the island and feathering out to 10cm thick at the lip. The outer 5 m of this pedes-tal was elevated above the flat sea floor, forminga gap UP to .25 CM wide that exposed the smooth baseof the island to divers. Average island shoreerosion, effected largely by calving, ranged from2.5- to 5-m/day. The pedestal retreated across thesea floor at the same rapid rate, but melting,rather than calving, was probably the major causeof erosion. Hydraulic processes did not have timeto develop cut-and-fill structures in the seafloor. In short, the test showed that unprotectedice islands in shallow, warm coastal waters have nochance of survival through the summer.
INTRODUCTION
Ice interacts with the marine environment inmany different ways, and through these interactions
becomes an important geologic agent. The U.S.Geological Survey has conducted research on ice-related processes for many years. Recent petroleumdevelopments in northern Canada and Alaska havefocused attention on ice in the marine environmentand on the effects of the ice on shores and theshelf surface. During the winter of 1978-1979, acircular ice island with a diameter of 400 m wasbuilt in the shallow waters of Stefansson Sound,about 6 km north of Prudhoe Bay, Alaska (Fig. 1).This large, firmly grounded mass of ice of knownage, size, and shape provided a unique opportunityto study the effects of summer conditions until theisland was destroyed by natural processes beforewinter.
BACKGROUND INFORMATION
In the Arctic ice is abundant and cheap andtherefore has long been considered as a potentialstructural material for offshore drilling plat-forms.l,2r3,4 Several field experiments with icedrilling islands have been conducted in Alaskanwaters. In 1969, attempts were made to firmlyanchor a grounded, natural ice island by ballastingit with an added surface layer of ice.
5 This island
was located at about 25-m water depth, where it wasfully exposed to drifting pack ice. For reasonsnot enti~ely clear, this island broke up during thestudies. In early 1977 an artificial ice islandwas built by Union Oil Co. at 3-m water depth inHarrison Bay. An exploratory well wae drilled fromthis island before the ice decayed in July, 1977.Being located within the smooth, immobile fast iceof Harrison Bay, this island was relatively safefrom the effects of shifting ice, but the nearbydischarge of warm Colville River water, whichresulted in early ice-free conditions in the area, 7
was largely responsible for the fast decay of thisartificial ice island.
In February 1979, Exxon began construction ofan experimental ice island in Stefansson Sound,about 6 kilometers north of Prudhoe Bay (Fig. 1).
121

The purpose was to learn whether this test struc-ture could survive one summer and then serve as aplatform for an extended drilling season during thefollowing winter.
Studies of icebergs show that th~ir deter-ioration is basically due to melting. The icemasses receive energy by radiation, convection, andconduction from the air, water, and sun. According
to Kollmeyer, 9 turbulent heat transfer is of primeimportance for ice decay. Thus, icebergs haveextended lives as long as they remain protected bysea ice, which reduces wave turbulence. Wave
turbulence prevents a static, cold-wat:r boundarylayer from forming around the iceberg. The
pronounced notches at sea level that are usuallyseen around drifting ice, attest to the effec-tiveness of wave turbulence in reducing the size ofice. There is, however, an important differencebetween the processes effective on drifting ice andthose effective on grounded ice. A grounded ice
mass is no longer moving with the water, and there-fore it encounters relatively higher flow veloci-
ties to transport away cold melt water. Because of
these considerations, a brief description of themarine environment at the ice island site is inorder.
The water depth at the Exxon ice island siteis nearly 3.5 m. The bottom, which is essentiallyflat, consists of very fine, muddy sand. Duringwinter the site lies within the zone of floatingfast ice. The floating ice moves only a fewmeters, and it reaches a thickness of up to 2 m atthe end of the winter. During summer, the area isprotected from pack-ice incursions by a chain ofbarrier islands. Beginning in late May or earlyJune, the Sagavanirktok River (Fig. 1) dischargesrelatively warm water only a few kilometers east ofthe site. With the dominant easterly winds, thiewarm water flows westward past the ice island. In1976, for a period of 52 days starting in lateJuly, oceanographic sensors were deployed 1 m offthe bottom near the ice island area. These seneors
provided information about salinity, temperatu~~,tides, and currents for the open-water season.The astronomical tidal range is only about 15 cm,whereas sea-level fluctuations from changing windsand barometric pressures normally are several timeslarger. The recorded average near-bottom currentvelocity was 15 cm/see, with one peak of 53 cm/see,sufficient to erode and transport coarse sand. Ourextensive boat and diving experience in the areaindicates that surface current velocities commonlyare several times higher than bottom velocities.The bottom-water temperature during the period ofrecord ranged from -0.9 to 7.5°C; the water at thesurface was generally several degrees warmer. Thesalinity ranged from 12.8 to 30.6 parts per thou-sand. In July 1972, regional surveys in the areashowed a freshwater plume with salinity of about 2parts per thousand extending from the SagavanirktokRiver past the site. Further studies by Woodward-Clyde Consultantsll show that the water mass inPrudhoe Bay and vicinity is largely stratified,especially under easterly wind conditions. The
Upper layer iS primarily Sagavanirktok River water,being relatively warm (i.e. 6‘-9°C) and relativelyfresh (i.e. 15 to 20 ppt). The lower layer iswater of almost totally oceanic origin, beingcolder, (1°-40C), and more saline (30-33 ppt).
Wave activity begins in late June at the islandsite; the fetch to the east increases to itsmaximum by late July. Because of the restrict~dfetch and the shallow water, we have never observedwaves higher than 1 m in the area.
THE ICE ISLAND
A single, large, rotating sprinkler system fedby seawater pumps was used to construct the circu-lar, dome-shaped ice island (Fig. 2). In the ini-tial stages, the thin fast ice apparently wasstrengthened by surface flooding, with rotating au-gers used as Archimedes screws to lift water to theice surface. But the spraying process res&ts inconsiderably more rapid freezing of water. Be-cause the sprayed water was free to spread out ontothe surrounding floating sheet of ice, the accre-ting ice assumed a dome shape. Surface runofftoward the perimeter consisted of brine from saltexcluded in the freezing process. Beyond the peri-
meter, the brine presumably drained through thesurrounding floating fast ice. Pumping was contin-
ued until the island had an elevation of about 7 mat the center and was firmly grounded on the seafloor. The total ice thickness ranged from 10 m inthe middle of the island to 6 or 7 m near thefringes”. The diameter of the island was nearly400 m.
METHODS OF STUDY
Observations and data collected around the iceisland during the summer of 1979 consist of:a) aerial and shipboard observations and photo-graphy of the island’s decay; b) diving observa-tions and underwater photography of the ice/bottomcontact; c) fathometer, sub-bottom profiler, andside-scan sonar surveys around the island; andd) spot measurements of water salinity, tempera-ture, and light transmissivity around the island.
RESULTS
Surface observations.- Our first observations ofthe island were made in the middle of July. Atthat time the island was circular (Fig. 1) andslightly dome-shaped. surface drainage gullies,shear cliffs at the water’s edge, active calving,and scattered ice drifting in the wake of theisland were evidence that the decay was in fullprogress. Continued calving, resulting from lackof hydrostatic pressure on unsupported faces, wasenhanced by deep erosional notches at sea levelthat were cut horizontally into cliffs withinseveral hours after calving (Fig. 4). The dominant
northeasterly winds and westward currents carryingrelatively warm, fresh river water on the surfaceresulted in the most rapid erosion on the island’s“weatherside .“ Thus the island soon assumed anasymmetric shape, as shown in Figure 5 in which thelocation of the pivot point of the formerly centralsprayer system is near the eastern shore. Toreduce undercutting and calving, a large tarpaulin,weighted at the baee by a chain, had been drapedover a portion of the island’s perimeter. This
tarp was carried away with calved ice by lateJuly . “By the first week in September, the iceisland had been reduced so much that it was hardlyrecognizable. On September 10th, long before themajor fall storms set in, the last remnants of theisland had floated away.
122
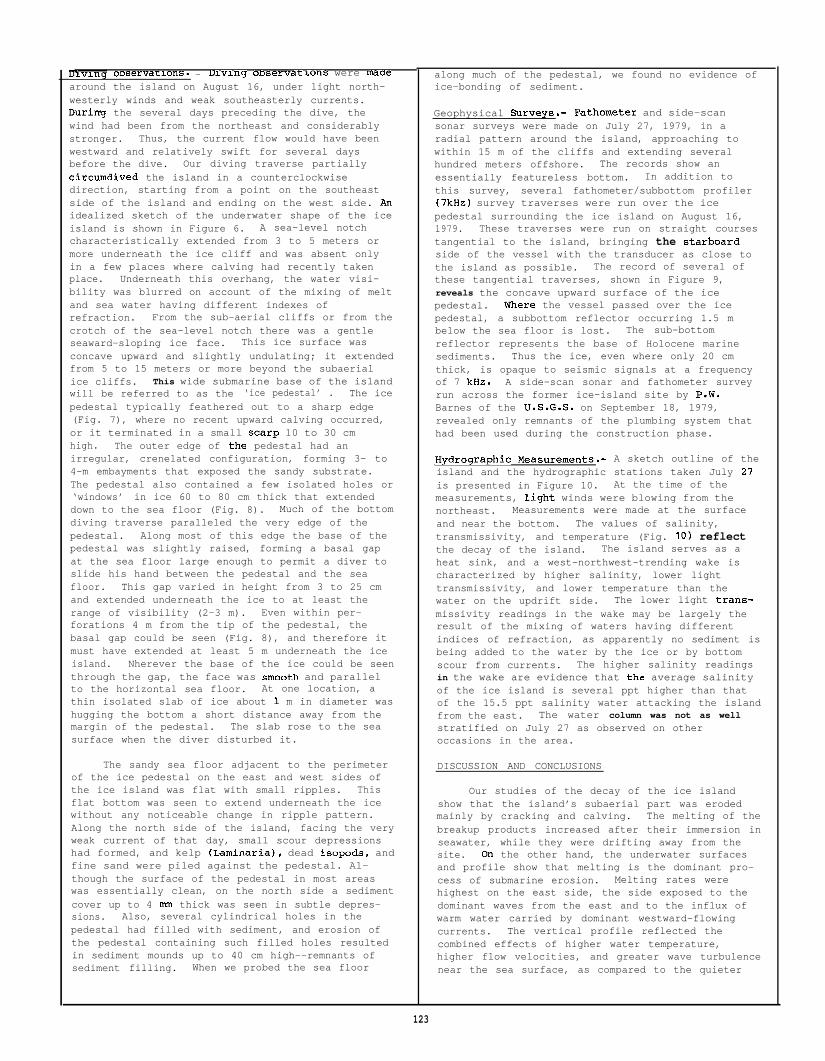
mvmg oDservatlons. - Ulvlng oDservat Ions were maae
around the island on August 16, under light north-westerly winds and weak southeasterly currents.Durinq the several days preceding the dive, thewind had been from the northeast and considerablystronger. Thus, the current flow would have beenwestward and relatively swift for several daysbefore the dive. Our diving traverse partiallycircumdived the island in a counterclockwisedirection, starting from a point on the southeastside of the island and ending on the west side. ~idealized sketch of the underwater shape of the iceisland is shown in Figure 6. A sea-level notchcharacteristically extended from 3 to 5 meters ormore underneath the ice cliff and was absent onlyin a few places where calving had recently takenplace. Underneath this overhang, the water visi-bility was blurred on account of the mixing of meltand sea water having different indexes ofrefraction. From the sub-aerial cliffs or from thecrotch of the sea-level notch there was a gentleseaward-sloping ice face. This ice surface was
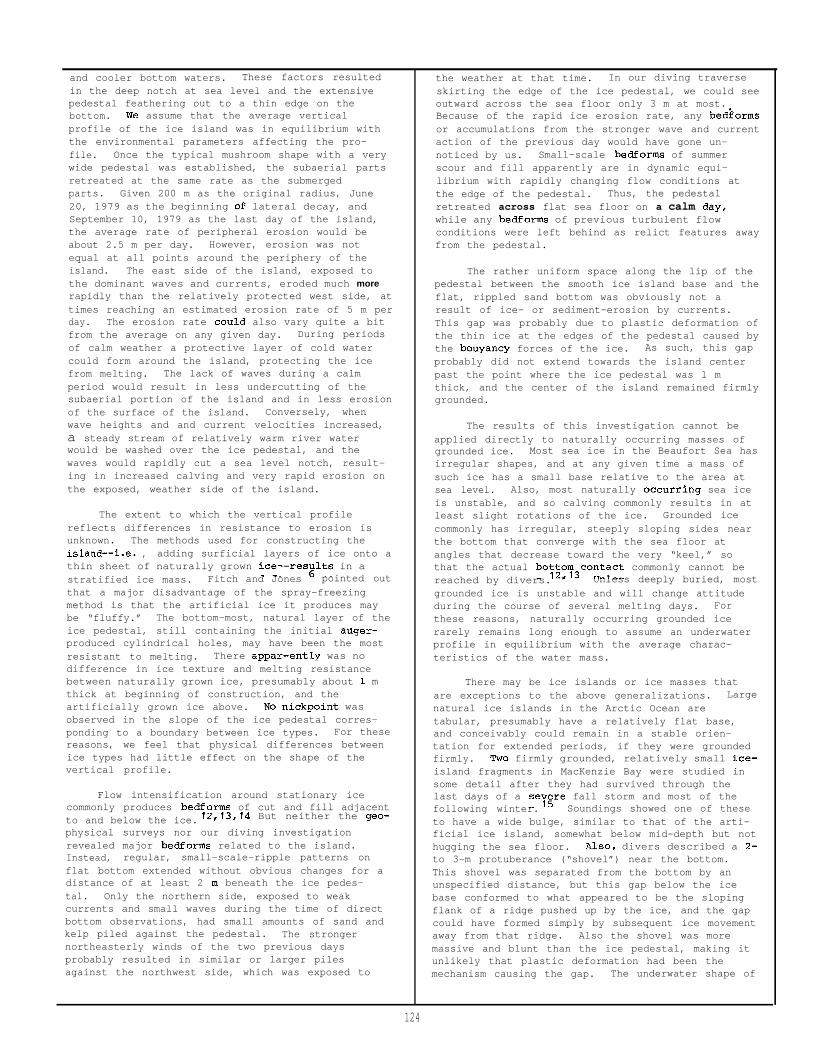
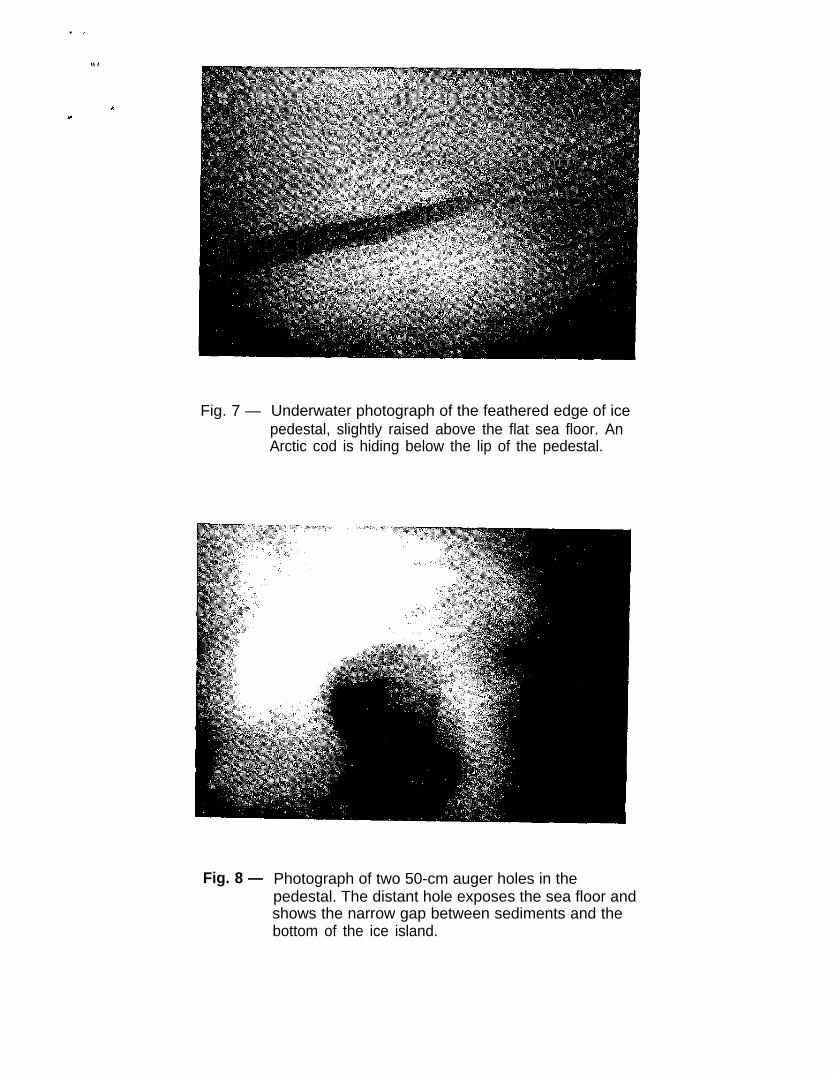
concave upward and slightly undulating; it extendedfrom 5 to 15 meters or more beyond the subaerialice cliffs. This wide submarine base of the islandwill be referred to as the ‘ice pedestal’ . The icepedestal typically feathered out to a sharp edge(Fig. 7), where no recent upward calving occurred,or it terminated in a small scarp 10 to 30 cmhigh. The outer edge of the pedestal had anirregular, crenelated configuration, forming 3- to4-m embayments that exposed the sandy substrate.The pedestal also contained a few isolated holes or‘windows’ in ice 60 to 80 cm thick that extendeddown to the sea floor (Fig. 8). Much of the bottomdiving traverse paralleled the very edge of thepedestal. Along most of this edge the base of thepedestal was slightly raised, forming a basal gapat the sea floor large enough to permit a diver toslide his hand between the pedestal and the seafloor. This gap varied in height from 3 to 25 cmand extended underneath the ice to at least therange of visibility (2-3 m). Even within per-forations 4 m from the tip of the pedestal, thebasal gap could be seen (Fig. 8), and therefore itmust have extended at least 5 m underneath the iceisland. Nherever the base of the ice could be seenthrough the gap, the face was smooth and parallelto the horizontal sea floor. At one location, athin isolated slab of ice about 1 m in diameter washugging the bottom a short distance away from themargin of the pedestal. The slab rose to the seasurface when the diver disturbed it.
The sandy sea floor adjacent to the perimeterof the ice pedestal on the east and west sides ofthe ice island was flat with small ripples. Thisflat bottom was seen to extend underneath the icewithout any noticeable change in ripple pattern.Along the north side of the island, facing the veryweak current of that day, small scour depressionshad formed, and kelp (Laminaria), dead isopods, andfine sand were piled against the pedestal. Al-though the surface of the pedestal in most areaswas essentially clean, on the north side a sedimentcover up to 4 mm thick was seen in subtle depres-sions. Also, several cylindrical holes in thepedestal had filled with sediment, and erosion ofthe pedestal containing such filled holes resultedin sediment mounds up to 40 cm high--remnants ofsediment filling. When we probed the sea floor
along much of the pedestal, we found no evidence ofice-bonding of sediment.
Geophysical Surveys.- Fathometer and side-scansonar surveys were made on July 27, 1979, in aradial pattern around the island, approaching towithin 15 m of the cliffs and extending severalhundred meters offshore. The records show anessentially featureless bottom. In addition to
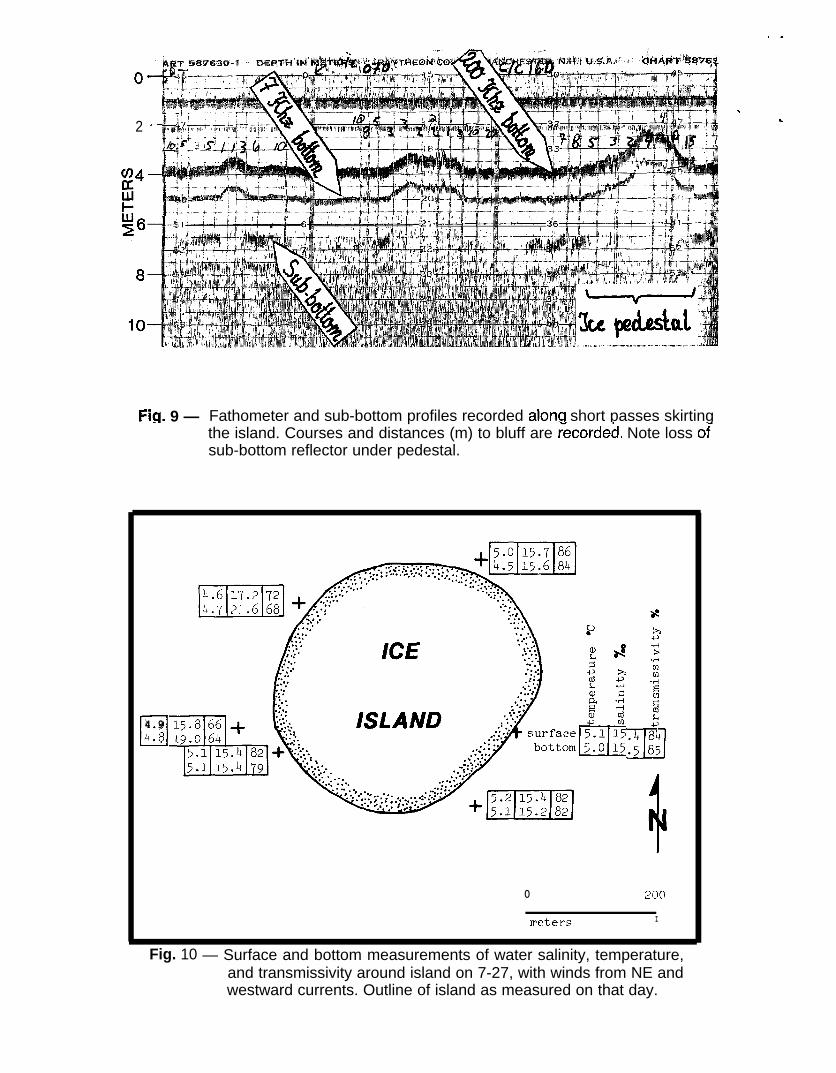
this survey, several fathometer/subbottom profiler(7kHz) survey traverses were run over the icepedestal surrounding the ice island on August 16,1979. These traverses were run on straight coursestangential to the island, bringing the starboardside of the vessel with the transducer as close tothe island as possible. The record of several ofthese tangential traverses, shown in Figure 9,reveals the concave upward surface of the icepedestal. Nhere the vessel passed over the icepedestal, a subbottom reflector occurring 1.5 mbelow the sea floor is lost. The sub-bottomreflector represents the base of Holocene marinesediments. Thus the ice, even where only 20 cmthick, is opaque to seismic signals at a frequencyof 7 kHz. A side-scan sonar and fathometer surveyrun across the former ice-island site by P.W.Barnes of the U.S.G.S. on September 18, 1979,revealed only remnants of the plumbing system thathad been used during the construction phase.
Hydroqraphic Measurements.- A sketch outline of theisland and the hydrographic stations taken July 27is presented in Figure 10. At the time of themeasurements, light winds were blowing from thenortheast. Measurements were made at the surfaceand near the bottom. The values of salinity,transmissivity, and temperature (Fig. 10) reflectthe decay of the island. The island serves as aheat sink, and a west-northwest-trending wake ischaracterized by higher salinity, lower lighttransmissivity, and lower temperature than thewater on the updrift side. The lower light trans-
missivity readings in the wake may be largely theresult of the mixing of waters having differentindices of refraction, as apparently no sediment isbeing added to the water by the ice or by bottomscour from currents. The higher salinity readingsin the wake are evidence that the average salinityof the ice island is several ppt higher than thatof the 15.5 ppt salinity water attacking the islandfrom the east. The water column was not as well
stratified on July 27 as observed on otheroccasions in the area.
DISCUSSION AND CONCLUSIONS
Our studies of the decay of the ice islandshow that the island’s subaerial part was erodedmainly by cracking and calving. The melting of thebreakup products increased after their immersion inseawater, while they were drifting away from thesite. on the other hand, the underwater surfacesand profile show that melting is the dominant pro-cess of submarine erosion. Melting rates werehighest on the east side, the side exposed to thedominant waves from the east and to the influx ofwarm water carried by dominant westward-flowingcurrents. The vertical profile reflected thecombined effects of higher water temperature,higher flow velocities, and greater wave turbulencenear the sea surface, as compared to the quieter
123
and cooler bottom waters. These factors resultedin the deep notch at sea level and the extensivepedestal feathering out to a thin edge on thebottom. We assume that the average verticalprofile of the ice island was in equilibrium withthe environmental parameters affecting the pro-file. Once the typical mushroom shape with a verywide pedestal was established, the subaerial partsretreated at the same rate as the submergedparts. Given 200 m as the original radius, June20, 1979 as the beginning of lateral decay, andSeptember 10, 1979 as the last day of the island,the average rate of peripheral erosion would beabout 2.5 m per day. However, erosion was notequal at all points around the periphery of theisland. The east side of the island, exposed tothe dominant waves and currents, eroded much morerapidly than the relatively protected west side, attimes reaching an estimated erosion rate of 5 m perday. The erosion rate could also vary quite a bitfrom the average on any given day. During periodsof calm weather a protective layer of cold watercould form around the island, protecting the icefrom melting. The lack of waves during a calmperiod would result in less undercutting of thesubaerial portion of the island and in less erosionof the surface of the island. Conversely, whenwave heights and and current velocities increased,a steady stream of relatively warm river waterwould be washed over the ice pedestal, and thewaves would rapidly cut a sea level notch, result-ing in increased calving and very rapid erosion onthe exposed, weather side of the island.
The extent to which the vertical profilereflects differences in resistance to erosion isunknown. The methods used for constructing theisland--i.e. , adding surficial layers of ice onto athin sheet of naturally grown ice--res~lts in astratified ice mass. Fitch and Jones pointed out
that a major disadvantage of the spray-freezingmethod is that the artificial ice it produces maybe “fluffy.” The bottom-most, natural layer of theice pedestal, still containing the initial auger-produced cylindrical holes, may have been the mostresistant to melting. There appar-ently was nodifference in ice texture and melting resistancebetween naturally grown ice, presumably about 1 mthick at beginning of construction, and theartificially grown ice above. NO nickpoint wasobserved in the slope of the ice pedestal corres-ponding to a boundary between ice types. For thesereasons, we feel that physical differences betweenice types had little effect on the shape of thevertical profile.
Flow intensification around stationary icecommonly produces bedforms of cut and fill adjacent
12,13,14 But neither the geo-to and below the ice.physical surveys nor our diving investigationrevealed major bedforms related to the island.Instead, regular, small-scale-ripple patterns onflat bottom extended without obvious changes for adistance of at least 2 m beneath the ice pedes-tal. Only the northern side, exposed to weakcurrents and small waves during the time of directbottom observations, had small amounts of sand andkelp piled against the pedestal. The strongernortheasterly winds of the two previous daysprobably resulted in similar or larger pilesagainst the northwest side, which was exposed to
the weather at that time. In our diving traverseskirting the edge of the ice pedestal, we could seeoutward across the sea floor only 3 m at most.Because of the rapid ice erosion rate, any bedkormsor accumulations from the stronger wave and currentaction of the previous day would have gone un-noticed by us. Small-scale bedforms of summerscour and fill apparently are in dynamic equi-librium with rapidly changing flow conditions atthe edge of the pedestal. Thus, the pedestalretreated across flat sea floor on a calm clay,while any bedforms of previous turbulent flowconditions were left behind as relict features awayfrom the pedestal.
The rather uniform space along the lip of thepedestal between the smooth ice island base and theflat, rippled sand bottom was obviously not aresult of ice- or sediment-erosion by currents.This gap was probably due to plastic deformation ofthe thin ice at the edges of the pedestal caused bythe bouyancy forces of the ice. As such, this gap
probably did not extend towards the island centerpast the point where the ice pedestal was 1 mthick, and the center of the island remained firmlygrounded.
The results of this investigation cannot beapplied directly to naturally occurring masses ofgrounded ice. Most sea ice in the Beaufort Sea hasirregular shapes, and at any given time a mass ofsuch ice has a small base relative to the area atsea level. Also, most naturally OCCUrring sea iceis unstable, and so calving commonly results in atleast slight rotations of the ice. Grounded icecommonly has irregular, steeply sloping sides nearthe bottom that converge with the sea floor atangles that decrease toward the very “keel,” sothat the actual bo::o;3contact commonly cannot bereached by divers. ‘ Unless deeply buried, most
grounded ice is unstable and will change attitudeduring the course of several melting days. Forthese reasons, naturally occurring grounded icerarely remains long enough to assume an underwaterprofile in equilibrium with the average charac-teristics of the water mass.
There may be ice islands or ice masses thatare exceptions to the above generalizations. Largenatural ice islands in the Arctic Ocean aretabular, presumably have a relatively flat base,and conceivably could remain in a stable orien-tation for extended periods, if they were groundedfirmly. llro firmly grounded, relatively small ice-island fragments in MacKenzie Bay were studied insome detail after they had survived through thelast days of a se~~re fall storm and most of thefollowing winter. Soundings showed one of theseto have a wide bulge, similar to that of the arti-ficial ice island, somewhat below mid-depth but nothugging the sea floor. AISO, divers described a 2-to 3-m protuberance (“shovel”) near the bottom.This shovel was separated from the bottom by anunspecified distance, but this gap below the icebase conformed to what appeared to be the slopingflank of a ridge pushed up by the ice, and the gapcould have formed simply by subsequent ice movementaway from that ridge. Also the shovel was moremassive and blunt than the ice pedestal, making itunlikely that plastic deformation had been themechanism causing the gap. The underwater shape of
124

a grounded ice-island fragment off ~dhoe Bay wasinvestigated by Breslau and Trammel in April1969., The lateral sounding techniques theyemployed were inadequate to show precisely therelationship between the ice and the sea floor. Apedestal similar to the one on the artificial iceisland we studied apparently had not formed there.
Our studies showed that an unprotected arti-ficial ice island in the relatively warm coastalwaters is unsuitable as a longterm drilling plat-form. The chances of such an ice island survivinga summer probably would be much higher if theisland were placed in the cooler waters seaward ofbarrier islands, especially in a year with much iceand no fetch for waves and currents.
ACKNOWLEDGMENTS
This study was supported jointly by the U.S.Geological Survey and the Bureau of Land Managementthrough interagency agreement with the NationalOceanic and Atmospheric Administration under amultiyear program responding to needs of petroleumdevelopment of the Alaska continental shelf. Theprogram is managed by the Outer Continental ShelfEnvironmental Assessment Program (OCSEAP).
REFERENCES
1.
2.
3.
4.
McKay, A.R., 1970, Man-made ice structures ofArctic marine use: I.A.H.R. Symp., Ice andIts Action on Hydraulic Structures, Reykjavik,Sept. 7-10, 1970.Behlke, C.E., and McKay, A.R., 1969,Artificial sea ice structures for Alaskanports: A.S.C.E. Ocean Eng. Conf., Miami,December 10-12, 1969.Kingery, W.E., cd., 1963, Ice and Snow,Properties, Processes and Applications: TheMIT Press, Cambridge.Peyton, H.R., Johnson, P.R., and Behlke, C.E.,1967, Saline conversion and ice structuresfrom artificially grown sea ice: U. of AlaskaArctic Environmental Eng. Lab. and Inst. ofWater Resources Research Dept. No. 4,Septenber 1967.
5.
6.
7.
8.
9.
10.
11.
12.
13.
14.
15.
Breslau, L.R., James, J.E., and Trammell,M.D., 1970, The underwater shape of a groundedice island off Prudhoe Bay: in Preprints of1970 Offshore Technology Conf~ence, Part II,p. 753-766.Fitch, J.L., and Jones, L.G., 1974, Artificialice islands could cut Arctic costs: The Oiland Gas Journal, November 11, 1974,
P. 173-181.Reimnitz, Erk, and Bruder, K.F., 1972, Riverdischarge into an ice-covered ocean andrelated sediment dispersal, Beaufort Sea,coast of Alaska: Geological Society ofAmerica Bulletin, v. 83, no. 3, p. 861-866.Robe, R.Q., 1980, Iceberg drift anddeterioration, in S.E. Colbeck, cd., Dynamics—of Snow and Ice Masses, Academic Press, NewYork, N.Y., p. 211-259.Kollmeyer, R.C., 1966, U.S. Coast GuardOceanographic Report #n, CG373-11, p. 41-52.Barnes, P.W., Reimnitz, Erk, Drake, D.E., andToimil, L.J., 1977, Miscellaneous hydrologicand geologic observations on the innerBeaufort Sea shelf, Alaska: U.S. GeologicalSurvey Open-File Report 77-477.Woodward-Clyde Consultants, 1981, Waterfloodmonitoring program status report, 31 August,1981.Reimnitz, Erk, Barnes, P.W., Forgatsch, T.C.,and Rodeick, C.A., 1972, Influence ofgrounding ice on the Arctic shelf of Alaska:Marine Geology, v. 13, p. 323-334.Reimnitz, Erk, and Barnes, P.W., 1974, Sea iceas a geologic agent on the Beaufort Sea shelfof Alaska, in Reed, J.C. and Sater, J.E.,eds., The C=st and Shelf of the BeaufortSea. Proceedings of the Arctic Institute ofNorth America Symposium on Beaufort Sea Coastand Shelf Research, Arlington, Virginia,p. 301-353.Reimnitz, Erk, and Kempema, E.W., 1982,Dynamic ice-wallow relief of northern Alaska’snearshore: Journal of Sedimentary Petrology(in press).Kovacs, A., and Mellor, M., 1971, Sea icepressure ridges and ice islands: CREARE Inc.,Science and Technology, Technical Note no.122, Au~st 1971.
125

.
Fig. 1 — Unretouched mid-July U-2 photograph of iceisland and surrounding islands: Reindeer (1),Argo (2), Niakuk (3), Gull (4), and theSagavanirktok River (5)

.
Fig. 2 — View of center-pivot sprinkler system duringconstruction of the island in March
Fig. 3 — Ice island on 7-20, with the pivot point marking thecenter. Surface gullies, scalloped edges and a wakeof calved ice debris indicate that erosion is in fullprogress.

,>
.
Fig. 4 — Vertical scarp of ice island, where recent calving occurred. A new horizontalsea-level notch has already been cut, setting the stage for the next calving.

,,
,
.

*
“’
Fig. 7 — Underwater photograph of the feathered edge of icepedestal, slightly raised above the flat sea floor. AnArctic cod is hiding below the lip of the pedestal.
Fig. 8 — Photograph of two 50-cm auger holes in thepedestal. The distant hole exposes the sea floor andshows the narrow gap between sediments and thebottom of the ice island.
0
2
Fig. 9 — Fathometer and sub-bottom profiles recorded alorm short passes skirtingthe island. Courses and distances (m) to bluff are ;ecorded. Note loss OFsub-bottom reflector under pedestal.
34.94.%
o p{q~
rretet-s I
..
Fig. 10 — Surface and bottom measurements of water salinity, temperature,and transmissivity around island on 7-27, with winds from NE andwestward currents. Outline of island as measured on that day.