be selective, back better business mix - myirisbreport.myiris.com/nfasipl/tatconse_20151216.pdf ·...
TRANSCRIPT

See Appendix A-1 for analyst certification, important disclosures and the status of non-US analysts.
Global Markets Research
AN
CH
OR
RE
PO
RT
India IT services: Outlook 2016 – Navigating tech transitions
Be selective, back better business mix
Indian IT services is grappling with the challenges of reinventing the old and driving the new, as technology changes (Digital - social, mobile, analytics, cloud and IoT) and business gradually controls a higher share of IT budgets. So, while continuing themes such as segment penetration and market share gains are still relevant, newer technology transitions is a story of some gain and some pain. As demand diverges across segments and macro is less supportive, business mix assumes greater importance in stock selection.
HCLT (High IMS/BPO/Engg services exposure) and CTSH (Strong Digital, high healthcare/manufacturing exposure) are our top Buys.
Key themes and analysis in this Anchor Report include:
Penetration levels across segments, what drives growth and how are individual companies placed to gain market share?
Underlying trends driving tech transitions, how they affect the old and add to the new areas and which companies benefit the most?
How are macro demand indicators tracking and how they correlate with sector demand?
16 December 2015
Research analysts
India Technology/Services & Software
Ashwin Mehta - NFASL [email protected] +91 22 4037 4465
Rishit Parikh - NFSPL [email protected] +91 22 4037 4360

Anchor themesWe prefer companies that have a better skew towards growing segments and are available at reasonable valuations.
Nomura vs consensusHCLT, CTSH and INFO are our top Buys.
Research analysts
India Technology/Services & Software
Ashwin Mehta - NFASL [email protected] +91 22 4037 4465
Rishit Parikh - NSFSPL [email protected] +91 22 4037 4360
India IT services
EQUITY: SOFTWARE & SERVICES
Outlook 2016: Navigating tech transitions
Tech transitions driving push-pull of old vs new leading to caution on FY17F demand Demand outlook unexciting, back better business mix Indian IT services are in transition due to new technology trends (Digital – social, mobile, analytics, cloud and IoT) and shifts in spending authority at clients from IT to business. Thus, we expect diverging demand trends across segments and changes in the nature of demand within segments too. This coupled with weakening macro demand indicators (client financials and US PMI) limits the potential for demand to accelerate in FY17F. We recommend staying selective and prefer IT services names with: 1) a higher skew towards faster growing areas (eg, digital, infrastructure management services (IMS)/engineering services, Europe, healthcare/manufacturing); 2) potential for market-share gains in the more sluggish segments (e.g ADM/BFSI); and 3) less exposure to work subject to cannibalisation. While fundamentally demand looks less than exuberant, reasonable valuations at near five-year averages and USD strength lend defensiveness to the sector.
Key tech transitions that are likely to shape the demand for the industry As CIO budgets contract, segment penetration, market share gains and level of automation will remain big growth drivers. However, increases in non-CIO spend will shift demand in favour of Digital leading to significant transitions like 1) on-premise s/w to SaaS; 2) on-premise datacenters to cloud; 3) under-exploited corporate data silos to open data flows; 4) desktop-based systems to mobility and 5) from mandate of reliability of IT systems to dual mandate of reliability and agility. The negative impacts on legacy work and newer opportunities will co-exist; hence business mix will decide which companies do better. Accenture clearly has lead versus Indian IT, but we expect HCLT/TCS to gain from back-end digital and CTSH/INFO/TCS to gain from front-end digital demand.
Top Buys: HCLT, CTSH and INFO HCLT (~60% exposure to IMS/engineering services and business process outsourcing (BPO), coupled with reasonable valuations), CTSH (strong digital capabilities, market-share gains in BFSI and nearly half of revenues from faster growing healthcare/ manufacturing), followed by INFO (focus on non-CIO spending and improved performance in legacy segments). Fig. 1: Stocks for action
Source: Bloomberg, Nomura estimates. Note: Pricing as of 11 December 2015
Company Code Rating Mkt Cap(USD mn)
Avg. TO(USD mn)
Targetprice
Price (as of11-Dec)
Upside(%)
Cognizant CTSH US Buy 35,450 214 72↓ 58.30 23%
HCL Tech HCLT IN Buy 17,704 29 1,020 841 21%
Infosys INFO IN Buy 36,150 65 1,225 1,053 16%
TCS TCS IN Neutral 70,281 45 2,500 2,386 5%
Tech Mahindra TECHM IN Neutral 7,760 12 560 537 4%
Wipro WPRO IN Neutral 20,897 13 570 566 1%
Mphasis MPHL IN Reduce 1,486 3 410 473 -13%
Hexaware HEXW IN Reduce 1,065 4 200 236 -15%
Global Markets Research 16 December 2015
See Appendix A-1 for analyst certification, important disclosures and the status of non-US analysts.

Nomura | India IT services 16 December 2015
2
Contents
Coverage Summary ................................................................................. 3
Indian IT: Cautious on demand in FY17F ................................................ 4
What is contributing to or dragging down Indian IT growth? ........................... 5
Shift in IT spend from CIO to non CIO (business) is shaping the demand
trends in the sector .......................................................................................... 7
CIO spend squeeze: Segment penetration, market-share gains and level of
automation would be key growth drivers ......................................................... 8
Non-CIO spend increases: To spawn newer tech demand in
SMAC/IoT/security ......................................................................................... 11
Sector seeing significant transitions – business mix/execution to navigate
these transitions will determine success ....................................................... 13
Demand becoming more macro dependent: Client financials and US PMI
suggest worsening demand trends ................................................................ 20
Valuations and USD strength lend defensiveness ........................................ 22
Be selective, back better business mix – HCLT, CTSH followed by INFO are
our top Buys ................................................................................................... 24
Cognizant .............................................................................................. 27
HCL Technologies ................................................................................. 31
Infosys ................................................................................................... 35
Tata Consultancy Services .................................................................... 39
Tech Mahindra ....................................................................................... 42
Wipro ..................................................................................................... 46
Appendix A-1 ......................................................................................... 50

Nomura | India IT services 16 December 2015
3
Coverage Summary Fig. 2: IT coverage universe – relative valuation
Note: Pricing as of 11December 2015. FY16F corresponds to fiscal year end Dec-15 for CTSH, HEXW, while it corresponds to Jun-16 for HCLT and Mar-16 for others
Source: Bloomberg, Nomura estimates
Fig. 3: Indian IT coverage universe – growth comparison
Note: EPS in local currency, FY16F corresponds to fiscal year end Dec-15 for CTSH, HEXW, while it corresponds to Jun-16 for HCLT and Mar-16 for others. For Wipro, revenue growth and EBIT margin is for IT service divisions
Source: Nomura estimates
Company Ticker Rating FY16F FY17F FY16F FY17FHCL Tech. HCLT IN BUY 17.7 841 1,020 16x 15.4 13.5 11.1 9.4Cognizant CTSH US BUY 35.5 58 72 20x 21.9 18.1 12.9 10.4Infosys INFO IN BUY 36.1 1,053 1,225 18x 18.3 16.3 12.2 10.5TCS TCS IN NEUTRAL 70.3 2,386 2,500 18x 19.4 17.6 14.1 12.4Wipro WPRO IN NEUTRAL 20.9 566 570 14x 15.2 14.3 11.2 10.0Tech Mahindra TECHM IN NEUTRAL 7.8 537 560 14x 16.1 14.1 11.1 9.2Hexaware HEXW IN REDUCE 1.1 236 200 12x 18.0 15.2 12.3 10.3Mphasis MPHL IN REDUCE 1.5 473 410 11x 13.9 13.0 8.2 7.4
EV/EBITDA (x)Mkt cap (USDbn)
Price (LC)
Target Price (LC)
Target P/E multiple
P/E (x)
FY15 FY16F FY17FCAGR
(FY15-17F) FY15 FY16F FY17F FY15 FY16F FY17FCAGR
(FY15-17F)HCL Tech. 11.1 8.6 14.4 11 22.3 21.2 21.1 51.4 54.8 62.3 10Cognizant 16.1 20.9 13.9 17 18.4 17.4 18.1 2.35 2.66 3.22 17Infosys 5.6 8.5 11.2 10 25.9 24.9 25.0 53.9 57.5 64.5 9TCS 15.0 7.8 10.7 9 26.9 27.0 26.5 110.9 123.1 135.3 10Wipro 7.0 4.4 8.8 7 22.0 21.0 20.4 35.1 37.3 39.6 6Tech Mahindra 18.3 11.4 9.0 10 15.6 13.7 14.7 29.6 33.4 38.1 14Hexaw are 8.9 15.4 11.5 13 16.8 16.1 16.9 10.6 13.1 15.5 21Mphasis (7.8) (1.2) 3.2 1 13.3 14.0 14.8 32.2 34.1 36.4 6
USD revenue growth (%) EBIT margin (%) EPS

Nomura | India IT services 16 December 2015
4
Indian IT: Cautious on demand in FY17F In India, we are cautious on the possibility of demand acceleration in FY17F, mainly owing to the diverging demand trends and weakening macro indicators:
• Sector remains in transition and demand trends are diverging across segments: The industry is grappling with fast changing demand dynamics across segments, driven by technology changes and a shift in spending authority from IT to business within client organisations. Even within segments, the nature of demand is shifting, with 1) deal size and duration getting smaller, 2) increasing complexity, and 3) annuity characteristics of business seeing a change with more transformational project based work coming from clients. Further, IT services vendors need to adjust to the dual mandate of reliability and agility of IT systems, which have repercussions from staffing/skills/sales and investment perspectives. These transitions are leading to diverging demand trends across segments:
– New vs legacy offerings: Smaller newer technology offerings (digital – social, mobile, analytics, cloud and IoT) and IMS/engineering services are growing well, but this is being countered by larger more sluggish legacy segments like application development and maintenance (ADM) and enterprise application services (EAS).
ADM is seeing deflationary impacts as automation, competitive pressures and rationalization in the app landscape counter legacy app modernisation efforts.
EAS is seeing cannibalisation of on-premise software implementation and support work, despite growth in SaaS (software as a service) and analytics, which are smaller.
IMS, a faster growing service, is also seeing a change in the nature of demand with: 1) a shift from more annuity monitoring/troubleshooting work to more project-based transformational work across cloud/mobility, 2) a shift from manpower-led to software/automation-led work, and 3) new opportunities to take complete ownership of work related to multiple cloud instances (public/private). Increasing complexity and changes in the nature of the work are causing volatility in this segment.
– US vs Europe: The US market has grown steadily in the 10% y-y range for the past six quarters, but has not accelerated despite stronger macro. Meanwhile, Europe is outperforming on growth (ex-currency impact), driven by cost-focused demand.
– Across verticals: BFSI/retail/telecom/energy, which contribute ~60% of tier-1 IT revenues, are underperforming, while healthcare/manufacturing are growing well.
We expect these divergent trends to continue in FY17F and believe that in such a scenario, stocks with better business mix will drive growth and share price performance.
• Macro demand indicators are not supportive and suggest decelerating trends: We see worsening key macro demand indicators, which typically affect demand with a 2-3 quarter lag: 1) decelerating or negative revenue growth trends across key client industries such as oil & gas, BFS, consumer, retail, and manufacturing at Fortune 500 US corporates; 2) the US PMI at 48.6 in Nov-15 is at the lowest level since Jun-09, vs its previous peak of 58.1 in Aug-14; and 3) ~20% lower monthly private job additions in the US in 2015 YTD vs 2014. This has already started to get reflected in the softer 2HFY16F outlook at tier-1 IT companies, with weak guidance at Infosys/Wipro, a pre-2Q warning at HCLT, and the cautious tone at TCS. Weaker exit rates for FY16F will likely limit the potential for demand acceleration in FY17F.
The above mentioned factors make us cautious on revenue acceleration in FY17F versus FY16F, and we look for constant currency growth of 12% over FY16-18F (vs 14%+ in FY16F) for tier-1 IT (including CTSH).
What prevents us from taking a more negative stance is that relatively: 1) valuations at 17.8x one-year forward P/E for tier-1 IT (incl. CTSH) (~3% premium to five-year historical averages), while not cheap, are not very expensive either; 2) a stronger USD plays to the sector’s advantage and lends certain defensiveness to the sector; and 3) Indian IT is still available at higher than historical valuation discounts versus other defensive sectors like FMCG and pharma.
Nomura | India IT services 16 December 2015
5
What is contributing to or dragging down Indian IT growth?
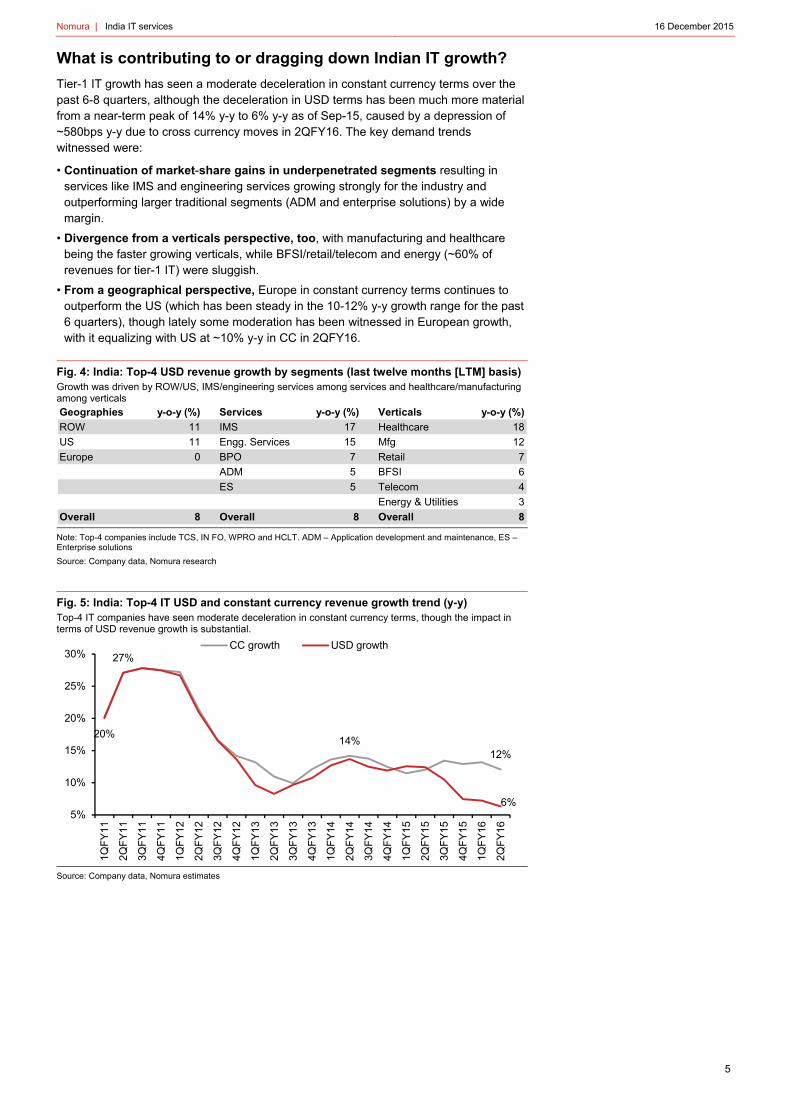
Tier-1 IT growth has seen a moderate deceleration in constant currency terms over the past 6-8 quarters, although the deceleration in USD terms has been much more material from a near-term peak of 14% y-y to 6% y-y as of Sep-15, caused by a depression of ~580bps y-y due to cross currency moves in 2QFY16. The key demand trends witnessed were:
• Continuation of market-share gains in underpenetrated segments resulting in services like IMS and engineering services growing strongly for the industry and outperforming larger traditional segments (ADM and enterprise solutions) by a wide margin.
• Divergence from a verticals perspective, too, with manufacturing and healthcare being the faster growing verticals, while BFSI/retail/telecom and energy (~60% of revenues for tier-1 IT) were sluggish.
• From a geographical perspective, Europe in constant currency terms continues to outperform the US (which has been steady in the 10-12% y-y growth range for the past 6 quarters), though lately some moderation has been witnessed in European growth, with it equalizing with US at ~10% y-y in CC in 2QFY16.
Fig. 4: India: Top-4 USD revenue growth by segments (last twelve months [LTM] basis) Growth was driven by ROW/US, IMS/engineering services among services and healthcare/manufacturing among verticals
Note: Top-4 companies include TCS, IN FO, WPRO and HCLT. ADM – Application development and maintenance, ES – Enterprise solutions
Source: Company data, Nomura research
Fig. 5: India: Top-4 IT USD and constant currency revenue growth trend (y-y) Top-4 IT companies have seen moderate deceleration in constant currency terms, though the impact in terms of USD revenue growth is substantial.
Source: Company data, Nomura estimates
Geographies y-o-y (%) Services y-o-y (%) Verticals y-o-y (%)
ROW 11 IMS 17 Healthcare 18
US 11 Engg. Services 15 Mfg 12
Europe 0 BPO 7 Retail 7
ADM 5 BFSI 6
ES 5 Telecom 4
Energy & Utilities 3
Overall 8 Overall 8 Overall 8
27%
14%12%
20%
6%5%
10%
15%
20%
25%
30%
1QF
Y11
2QF
Y11
3QF
Y11
4QF
Y11
1QF
Y12
2QF
Y12
3QF
Y12
4QF
Y12
1QF
Y13
2QF
Y13
3QF
Y13
4QF
Y13
1QF
Y14
2QF
Y14
3QF
Y14
4QF
Y14
1QF
Y15
2QF
Y15
3QF
Y15
4QF
Y15
1QF
Y16
2QF
Y16
CC growth USD growth

Nomura | India IT services 16 December 2015
6
Growth by geography: US is steady though not accelerating, Europe is seeing some moderation after outperformance in CC terms and strong ROW depressed by currency.
Fig. 6: US revenue growth (y-y) US growth steady at 10-12% for 6 quarters
Source: Company data, Nomura research
Fig. 7: Europe revenue growth (y-y) Europe lately seeing some weakening
Source: Company data, Nomura estimates
Fig. 8: ROW revenue growth (y-y) ROW impacted substantially by CC moves
Source: Company data, Nomura estimates
Growth by vertical: Healthcare leads growth, retail shows improvements after being sluggish, and manufacturing shows steady demand trends, BFSI/energy and telecom underperform, where rebounds are required for any positive surprises.
Fig. 9: BFSI growth (y-y) Seen deceleration, rebound illusive
Source: Company data, Nomura estimates
Fig. 10: Manufacturing growth (y-y) Some moderation lately after strong growth
Source: Company data, Nomura estimates
Fig. 11: Retail growth (y-y) Some improvement lately, sustainability key
Source: Company data, Nomura estimates
Fig. 12: Energy & Utilities growth (y-y) Pain from oil price fall continues to weigh
Source: Company data, Nomura estimates
Fig. 13: Telecom & media growth (y-y) Continues to underperform
Source: Company data, Nomura estimates
Fig. 14: Healthcare growth (y-y) Remains the strongest growing vertical
Source: Company data, Nomura estimates
12%10%
0%
5%
10%
15%
20%
1QF
Y12
1QF
Y13
1QF
Y14
1QF
Y15
1QF
Y16
10%
0%
-10%
0%
10%
20%
30%
40%
1QF
Y11
3QF
Y11
1QF
Y12
3QF
Y12
1QF
Y13
3QF
Y13
1QF
Y14
3QF
Y14
1QF
Y15
3QF
Y15
1QF
Y16
CC growth
USD growth
17%
3%0%
10%
20%
30%
40%
50%
1QF
Y11
3QF
Y11
1QF
Y12
3QF
Y12
1QF
Y13
3QF
Y13
1QF
Y14
3QF
Y14
1QF
Y15
3QF
Y15
1QF
Y16
CC growth
USD growth
11%
6%
0%
5%
10%
15%
20%
25%
30%
1QF
Y12
3QF
Y12
1QF
Y13
3QF
Y13
1QF
Y14
3QF
Y14
1QF
Y15
3QF
Y15
1QF
Y16
CC growth
USD growth
12%
8%
0%
5%
10%
15%
20%
25%
30%
35%
1QF
Y12
3QF
Y12
1QF
Y13
3QF
Y13
1QF
Y14
3QF
Y14
1QF
Y15
3QF
Y15
1QF
Y16
CC growth
USD growth
14%
8%
0%
5%
10%
15%
20%
25%
30%
35%
40%
1QF
Y12
3QF
Y12
1QF
Y13
3QF
Y13
1QF
Y14
3QF
Y14
1QF
Y15
3QF
Y15
1QF
Y16
CC growth
USD growth
5%
-3%
-5%
5%
15%
25%
35%
45%
55%
1QF
Y12
3QF
Y12
1QF
Y13
3QF
Y13
1QF
Y14
3QF
Y14
1QF
Y15
3QF
Y15
1QF
Y16
CC growth
USD growth
8%
1%
-10%
-5%
0%
5%
10%
15%
20%
1QF
Y12
3QF
Y12
1QF
Y13
3QF
Y13
1QF
Y14
3QF
Y14
1QF
Y15
3QF
Y15
1QF
Y16
CC growth
USD growth
24%
20%
10%
12%
14%
16%
18%
20%
22%
24%
26%
1QF
Y12
3QF
Y12
1QF
Y13
3QF
Y13
1QF
Y14
3QF
Y14
1QF
Y15
3QF
Y15
1QF
Y16
CC growth
USD growth

Nomura | India IT services 16 December 2015
7
Growth by service line: Engineering services and IMS lead, though some moderation has been seen in IMS lately, BPO/Testing outperform aggregate growth, while ADM/ES are sluggish Fig. 15: ADM growth (y-y) Tech shifts/pricing pressure drive sluggishness
Source: Company data, Nomura estimates
Fig. 16: ES growth (y-y) Decelerating trends, though INFO outperforms
Source: Company data, Nomura estimates
Fig. 17: IMS growth (y-y) Still healthy, but decelerates materially
Source: Company data, Nomura estimates
Fig. 18: BPO growth (y-y) Growing in line with top-4 growth
Source: Company data, Nomura estimates
Fig. 19: Engg. Services growth (y-y) Is the strongest growing service line
Source: Company data, Nomura estimates
Fig. 20: Testing growth (y-y) Outperforming aggregate growth
Source: Company data, Nomura estimates
Note: We have assumed similar cross currency impacts for services as seen in overall revenues, given lack of such granularity. Constant currency growth might be overstated in ADM/Engg. Services due to possible US skew, while could be understated in IMS where European skew is higher.
Shift in IT spend from CIO to non CIO (business) is shaping the demand trends in the sector
While IT spending has grown historically at around 4% y-y, there is a reallocation of authority in terms of who controls the spend, as is visible in Fig. 21 and Fig. 22, wherein CIO spend is expected to come down to near half of overall IT spend, from near three-fourths as early as six years ago. In effect, the absolute CIO spend is also seeing a reduction because of this trend.
This shift has several repercussions for IT demand:
• CIO spend squeeze: To lead to segment penetration, market-share gains and level of automation becoming key determinants of growth.
• Non-CIO spend increases: To spawn newer tech demand in SMAC/IoT/security.
10%
4%0%
5%
10%
15%
20%
25%
30%
1QF
Y12
3QF
Y12
1QF
Y13
3QF
Y13
1QF
Y14
3QF
Y14
1QF
Y15
3QF
Y15
1QF
Y16
CC growth
USD growth
10%
4%0%
5%
10%
15%
20%
25%
30%
35%
40%
1QF
Y12
3QF
Y12
1QF
Y13
3QF
Y13
1QF
Y14
3QF
Y14
1QF
Y15
3QF
Y15
1QF
Y16
CC growth
USD growth
15%
9%
5%
10%
15%
20%
25%
30%
35%
1QF
Y12
3QF
Y12
1QF
Y13
3QF
Y13
1QF
Y14
3QF
Y14
1QF
Y15
3QF
Y15
1QF
Y16
CC growth
USD growth
12%
6%
0%
5%
10%
15%
20%
25%
1QF
Y12
3QF
Y12
1QF
Y13
3QF
Y13
1QF
Y14
3QF
Y14
1QF
Y15
3QF
Y15
1QF
Y16
CC growth
USD growth19%
13%
0%
5%
10%
15%
20%
25%
30%
1QF
Y12
3QF
Y12
1QF
Y13
3QF
Y13
1QF
Y14
3QF
Y14
1QF
Y15
3QF
Y15
1QF
Y16
CC growth
USD growth
13%
7%
0%5%
10%15%20%25%30%35%40%45%
1QF
Y12
3QF
Y12
1QF
Y13
3QF
Y13
1QF
Y14
3QF
Y14
1QF
Y15
3QF
Y15
1QF
Y16
CC growth
USD growth

Nomura | India IT services 16 December 2015
8
Fig. 21: Distribution of IT spend by decision maker (% share)Business buyers are likely to control near half of IT services spends by 2016, which was as low as near one fourth of spends six years ago
Source: Forrester, Offshore Insights, NASSCOM, Note P= projected
Fig. 22: Absolute IT spend by decision maker (USD bn) while IT department controlled budgets shrink both in share and absolute spends
Source: Forrester, Offshore Insights, NASSCOM, Note P=projected
CIO spend squeeze: Segment penetration, market-share gains and level of automation would be key growth drivers
The squeeze in CIO spends will likely lead to:
• Increased offshore penetration in underpenetrated segments: An increased cost optimization pressure would likely lead to greater offshoring in low-penetration segments like IMS, BPO, engineering services and Europe (Fig. 23, Fig. 24, Fig. 25). From within verticals, healthcare and manufacturing and possibly energy (once the current curtailments in overall operations subside due to oil price fall and clients focus on cost optimization) would likely see continued demand (Fig. 26 & Fig. 27).
• Commoditization pressures in high-penetration segments: In segments like ADM where the penetration of Indian IT companies is of the order of 40%, the same cost optimization efforts will likely lead to pricing pressures (Fig 28) and hence sluggish demand. In addition, new technology transitions will also put pressure on ADM demand as 1) clients choose software over custom development; 2) some applications become redundant as legacy applications are rationalised as clients go digital, leading to reduced support requirements; and 3) the segment faces the deflationary effects of automation.
Fig. 23: Indian IT market share by service line (%) IMS, BPO and engineering services less penetrated, while ADM is substantially penetrated at ~40%
Note: Based on 2015E data
Source: Zinnov, NASSCOM, Nomura research
1%10%
25%36%
74%
53%
0%
10%
20%
30%
40%
50%
60%
70%
80%
2010 2012 2014P 2016P
Workforce Lines of Business IT
5
114
337
15
136
335
37
169
321
60
209
304
Workforce Lines of Business IT
2010 2012 2014P 2016P
Service line break-upGlobal spending
(USDbn)Indian IT's share
(%)
Traditional service lines (ADM)
Overall ADM 105 40.0%
Under penetrated service lines
Package Implementation & Consulting 154 6.3%
IT Consulting 33 9.4%
Systems Integration 121 5.5%
IMS 270 4.6%
Netw ork Consulting & Integration 43 1.4%
IS Outsourcing (RIM) 227 5.2%
BPO 167 15.6%
Engineering Services 614 3.9%
Global IT spend (excl H/W) 1,254 9.5%

Nomura | India IT services 16 December 2015
9
Fig. 24: Distribution of global IT spend by geography (%) Of the overall Global IT Services spend of ~USD660bn, Europe is near 80% of the US spends at ~USD240bn
Note: Based on 2015 data Source: NASSCOM, Nomura research
Fig. 25: India IT services market share by geography (%) Europe and ROW remain the underpenetrated geographies, which should continue to grow better than the US in our view
Note: Based on 2015 data Source: NASSCOM, Nomura estimates
Fig. 26: Vertical-wise split (%) of global IT services spend BFSI is the largest spender on IT services and most penetrated as well.
Note: Based on 2012 data Source: NASSCOM, Nomura research
Fig. 27: India IT services market share by verticals (%) Under penetration in manufacturing and emerging areas (Health/Energy)
Note: Based on 2012 data Source: NASSCOM, Nomura estimates
Fig. 28: Infosys: Constant currency offshore pricing trend (base 100) Commoditisation pressures in highly penetrated ADM is a big driver of offshore pricing declines at INFO
Source: Company data, Nomura research
Hence, what drives growth in this scenario in the CIO spend areas is: 1) market-share gains driven by capabilities in certain segments; 2) automation levels, which will impact both ability to win deals and to protect margins under commoditisation pressures; 3) mix of segments with higher exposure to faster growing areas likely leading to better growth.
Americas, 44
EMEA, 36
Asia Pacific, 20
12%
7%
4%
Americas Europe ROW0%
2%
4%
6%
8%
10%
12%
14%
BFSI, 21
Manufacturing, 20
Hitech/ Telecom,
10
Government, 16
Emerging, 33
Manufacturing, 20
Government, 16
18%17%
7% 7%
1%
BFSI Hitech/Telco Mfg. Emerging Govt.
India IT market share (%)
97
95
97
96
94
96
98
97 97
95
93
91
94
90
92
94
96
98
100
102
4QF
Y12
1QF
Y13
2QF
Y13
3QF
Y13
4QF
Y14
1QF
Y14
2QF
Y14
3QF
Y14
4QF
Y14
1QF
Y15
2QF
Y15
3QF
Y15
4QF
Y15
1QF
Y16
2QF
Y16

Nomura | India IT services 16 December 2015
10
Despite increasing importance of newer technology spends, the trend of India IT gaining market share remains a continuing growth driver, in our view.
Fig. 29: India IT and top-3 MNC revenue trends and changes in the share of aggregate revenues India IT has gained 6.1% share in the past 8 quarters and is now half of the top-3 global players in terms of size vs one-third two years ago
Note: Top-five Indian players include Infosys, TCS, HCL Tech, Cognizant and Wipro, while Top-3 MNCs include Accenture, IBM and HP. Source: Company data, Nomura research
We believe growth in IMS/BPO/engineering services and testing within services, Europe among geographies, and healthcare/manufacturing among verticals will be continuing trends in FY17F and beyond. However, we remain cautious on ADM demand in FY17F. On account of this, we find HCLT benefiting from strong positioning in IMS/engineering services (Fig 30-33) and less exposure to ADM than peers, while CTSH should benefit from higher exposure to healthcare/manufacturing and market-share gains in BFSI/US.
Fig. 30: Deal renewal opportunity (USD bn) ~USD150bn worth of deals coming up for rebid over CY16-18, where churn towards newer players is expected to be of the order of 40% and ~80% of these deals are IMS led deals.
Note: Excludes government vertical and BPO opportunities
Source: ISG, HCLT, Nomura estimates
Fig. 31: Deal renewal opportunity by geography (%) CY16-18 Europe is the biggest area of deal rebid with near 60% of the deal rebids originating from Europe. This coupled with under penetration makes us positive on the prospects of growth in IMS and Europe
Note: Excludes government vertical and BPO opportunities
Source: ISG, H CLT, Nomura research
Fig. 32: E and R&D revenues (USD mn) across India IT HCLT is the largest in India and third largest globally in engineering services; and it is the 2nd largest Indian player in IMS. From a contribution perspective too, HCLT generated ~54% of its revenues from IMS + engineering services (vs 11-36% at peers)
Source: Company data, Nomura research
Fig. 33: E and R&D outsourcing addressable market (FY15) India currently captures only ~25% of the outsourced service provider (SP) market of USD36bn, which is 1/6th of the total addressable market (TAM)
Source: Zinnov, NASSCOM, Nomura research
Revenue (USDbn) 3QCY13 4QCY13 1QCY14 2QCY14 3QCY14 4QCY14 1QCY15 2QCY15 3QCY15 Change( 8 qtrs)Top-5 Indian IT 10.6 10.9 11.1 11.5 11.9 12.2 12.2 12.7 13.1 2.5Top-3 MNC 29.2 29.7 28.8 29.4 29.1 28.4 26.4 27.0 26.9 -2.3Overall 39.8 40.6 39.9 40.9 41.0 40.6 38.7 39.7 40.0 0.2Share Indian IT (%) 26.6% 26.8% 27.8% 28.1% 29.1% 30.0% 31.6% 32.0% 32.8% 6.1%Share MNC IT (%) 73.4% 73.2% 72.2% 71.9% 70.9% 70.0% 68.4% 68.0% 67.2% -6.1%
51
46
50
CY16F CY17F CY18F
EMEA, 58Americas, 24
APAC, 18
HCLT TCS WPRO INFO Overall
Engineering Services
LTM revenue (USD bn) 1.1 0.7 0.5 0.3 2.7
Revenue contribution (%) 19 5 8 3 7
LTM growth y-y (%) 25 7 11 8 15
3 year CAGR (%) 13 13 2 8 10
IMS
LTM revenue (USD bn) 2.1 2.3 2.0 0.7 7.2
Revenue contribution (%) 35 15 28 8 19
LTM growth y-y (%) 11 27 15 14 17
3 year CAGR (%) 26 26 13 17 21
India USD9bn
USD614bn,Global
500 E & RD spend
USD216bn,
Outsource TAM
USD 36bn,Current SP revenues
USD 9bn,India SP revenues

Nomura | India IT services 16 December 2015
11
Non-CIO spend increases: To spawn newer tech demand in SMAC/IoT/security
The focus of the non-CIO or business is likely to be more on front-end revenue generating areas and overall improvement in customer experience, which will likely drive demand for newer technology areas like digital – social, mobile, analytics, cloud, security and IoT (internet of things). Ability to win business in this area will be determined by skill sets, investments in capabilities, partnerships with start-ups, and a strong consulting front end.
We believe the demand in digital will have two elements – front end and back end. Front end comprises work related to customer experience, analytics, digital marketing, developing enterprise mobile apps with vertical domain capabilities, and SaaS implementations, while back end comprises work related to cloud transformation, mobility transformation, legacy app modernization, creation/management of big data, and security. We believe Indian IT is likely to have a bigger role in back end vs front end digital.
We believe global IT companies like Accenture have an edge versus tier-1 Indian IT companies in the digital space both in terms of scale as well as capabilities. This is especially true in the front-end digital areas where consulting capabilities and better C level connects play to their advantage. In addition, Accenture also scores on having strong downstream capabilities by virtue of it having ~257,000 people in offshore delivery locations (larger than the offshore headcount of all tier-1 IT players ex TCS). Another area where we believe Indian IT players are deficient is the security space, which is one of the top most priorities for clients going digital. (Fig 34 & Fig 35)
Fig. 34: Comparison of Accenture versus Indian IT players in terms of size, expectations and classifications in Digital Accenture generates ~23% (ex-cloud) of its revenues from digital, vs single-digit contributions from digital for top Indian IT companies (ex TCS)
Source: Company data, Nomura research
Company Scale Whats included in Digital?
Accenture
-Generated ~USD7bn in revenues in FY15, nearly 23% of the total.-Digital comprises of Accenture Interactive (USD2bn), Analytics (USD 4bn) and Mobility (USD 2bn)-Currently has 36,000 digital professionals
Social, Analytics, Mobile, Interactive platforms/solutions (Does not include cloud w hich is nearly USD3.5bn in revenues annually)
TCS-Generated annualized revenues of ~USD2.2bn in the 2QFY16, nearly 13.3% of its revenues from digital.-Expects to train 100,000 employees on digital technologies by FY2016
AI, Robotics, Mobility and Channels, Cloud, Big Data, Analytics and Social segments
Infosys
-Generated ~USD800mn in revenues in FY15, nearly 8% of it reveneus from digital.-Expects to train all employees on design thinking by year end
SMAC (Social, mobile, analytics and cloud)
CTSH-Generated ~USD500mn in revenues in 2013, nearly 5% of its revenues then from digital.
SMAC (Social, mobile, analytics and cloud)
TechM-Expects its digital revenue to cross USD500mn (~10% of total) by end of CY2015
NMACS (Netw orks, Mobile, Analytics, Cloud, Security, Social and Sensors)
Wipro-Expects to generate ~USD1bn in revenues in 3 years (from Mar-2015) from digital -Expects to train 10,000 employees on digital technologies in 2016
SMAC (Social, mobile, analytics and cloud)

Nomura | India IT services 16 December 2015
12
Fig. 35: Headcount comparison of Accenture (offshore) and Indian IT companies (overall) In addition, to larger scale and stronger front-end digital capabilities, Accenture has substantially augmented its offshore delivery capabilities to capture downstream digital demand
Source: Company data, Nomura research
So while we believe taking share against a player like Accenture might be difficult for Indian IT players, there is still scope to win share against other players and get downstream work once pure consulting companies (with limited downstream delivery capabilities) have advised clients. In addition, digital is a new area wherein none of the players have a substantial lead (as opposed to the traditional system integration area where global players did have a substantial lead) and hence capability gaps can be reduced or specialization can be built in specific areas (e.g. Cognizant in healthcare)
We believe digital will be additive for India IT over the medium term. However, over the near term, companies will have to bear with significant transitions in existing services and changes in the nature of demand within segments due to the shift towards newer technologies. So growth in the interim will be more dependent on 1) exposure to segments which are growing versus segments that are getting cannibalized due to the changes in the nature of demand; and 2) how players adjust to new realities in terms of sales, staffing, skill levels and partnerships for IP through own development, using open source and through acquisitions.
From among the tier-1 Indian IT players, we see CTSH, TCS and INFO being the stronger players in front-end digital capabilities, while HCLT/TCS would likely be the stronger players in the back-end digital elements, especially in the biggest transformation areas like mobility and cloud, given their strong IMS practices. Presence in security, which is likely to be among the top priorities for organizations as they undergo digital transformation, is an area where we believe Indian IT companies have weaker capabilities. IoT demand should benefit players with stronger engineering services and analytics capabilities. From an engineering services perspective, we believe HCLT is the strongest player, while from an analytics perspective we believe CTSH/INFO/TCS would be stronger. We highlight our view on the IT services work involved under SMAC and who benefits the most from those capabilities in Fig. 36. The segments which are blank are typically areas where we believe the Indian IT companies have a weaker presence and players like Accenture/IBM would the stronger players.
Headcount comparison Current headcount LTM growth 3-year CAGR
Accenture 256,846 25% 17%
Indian IT 1,016,863 9% 9%
HCLT 105,571 11% 7%
Cognizant 219,300 10% 13%
Infosys 187,976 14% 7%
TCS 335,620 7% 10%
Wipro 168,396 9% 6%

Nomura | India IT services 16 December 2015
13
Fig. 36: IT services work involved in SMAC and how are IT companies positioned? HCLT/TCS stronger on back-end SMAC related work, while CTSH/INFO/TCS stronger on the front end side. Blank areas are where we think global IT companies like Accenture/IBM or consulting companies are stronger and Indian IT has a more limited play.
Source: Nomura research
Sector seeing significant transitions – business mix/execution to navigate these transitions will determine success
The next question that typically investors have is whether the new technology spends will be incremental or this will come at the cost of the legacy spends. Clearly the sector is going through multiple transitions, which will lead to additional opportunities but also cannibalize existing business. Hence, the mix of business and execution would determine growth for individual players in such a scenario. Over the medium term, we think this will be additive for Indian IT but near term the cannibalization aspects could weigh.
SMAC segment IT services work involved Best placed companiesSocial media analytics
Consulting on social media strategy and implementation to enhance effectiveness on this medium Technology solutions or BPO offerings to integrate w ith CRM, offer analytics and BI offerings analyze customer feedback, brand perception etc. and provide decision support for closing gaps/increasing effectiveness.
Typically players strong in analytics - CTSH/TCS/INFO
Media engagement solutions for real time engagement on a global scale
Enterprise mobility related offerings
Provide data remotely to implement w orkflow , provide services and enable sales on the go through extension of enterprise solutions applications like supply chain management,customer relationship management and enterprise resource management on to mobiles
Companies strong in ES - INFO/HCLT/TCS
Develop industry specif ic applications eg mobile banking, trading, customer services, mobile commerce, transportation etc.Extension of end user computing (a big area of spend in the IMS area) to mobiles/tablets. This is the big area of transformation for enterprises. Largely IMS w ork - TCS and HCLT
Big Data offerings
Big Data production ‐ Gather raw data on an industrial scale from both structured and unstructured sources like Social media, databases, Internet of Things, transactions, documents etc. TCS/CTSH/INFOBig Data Management ‐ Data architecture, storage, security, data w arehousing and maintaining data quality related w ork TCS/CTSH/INFOBig Data Analytics ‐ Related to making commercial uses of data through draw ing insights.e.g. BFSI ‐ trade monitoring, analytics, risk & compliance related, Retail ‐ real time analyis of purchases, customer behaviour insights and driving targetted sales, Telecom ‐ fraud/failure detection, netw ork planning & optimization, Healthcare ‐ analysis of treatment & outcome, real time monitoring, Manufacturing ‐ demand forecasting, supply chain management, product feedbacks
Analytics players - TCS/CTSH/INFO
Cloud computing offerings
Related to provisioning servers, storage, database services across public, private or hybrid cloud options and rearchitecting the current datacenters. This is part of most IMS deal rebids currently. IMS players - HCLT/TCSLegacy application modernisation and testing to make applications cloud compliant
TCS/CTSH/INFO - CTSH is largest in testing
Softw are as a service implementation, support, integration w ith legacy systems, analytics and business process reingeering related w ork. INFO/TCS/CTSHPlatform BPO offerings as a service under a pay as you go model. TCSEnabling front end analytics through use of the cloud. TCS/CTSH

Nomura | India IT services 16 December 2015
14
Fig. 37: Top technology shifts under way that are causing IT services transitions
Source: ZDNet, Nomura research
The key transitions that the industry is going through are: 1) on-premise software to SaaS; 2) on-premise datacenters to cloud; 3) under-exploited corporate data silos to open data flows; 4) desktop-based systems to mobility and omni-channel apps; 5) from mandate of reliability of IT systems to dual mandate of reliability and agility.
Delving deeper into each of the transitions and the repercussions:
1. On-premise software to SaaS • Key technology trend: SaaS software spend is expected to grow at ~5x the growth of
on-premise software over 2013-18. CRM (customer relationship management, where players like Salesforce are prominent) and ERM (enterprise resource management, which includes areas like human capital management where players like Successfactors and Workday are prominent) are likely to contribute ~80% of SaaS spend in 2015. In CRM and ERM, ~45% and ~30% of the total software spend is already SaaS spend, respectively. These are areas where the cannibalisation of on-premise is most prominent as SaaS adoption expands.
Fig. 38: SaaS versus on-premise software growth across categories SaaS software is growing at ~5x the growth rate of on premise software, this trend has repercussions for Indian IT services, which are involved in the implementation and support of both these categories
SaaS vs On-premise growth (in %) 2015 SaaS to
total S/W spend2013-18 SaaS
Growth 2013-18 On-
premise growth
CRM 44.4% 19.6% -3.9%
Engineering 2.3% 21.3% 4.4%
ERM 28.9% 17.2% 1.6%
Ops Manufacturing 8.7% 13.7% 5.6%
SCM 5.0% 14.1% 5.1%
Enterprise Applications 20.7% 17.6% 3.1%
Source: IDC, Nomura estimates

Nomura | India IT services 16 December 2015
15
Fig. 39: CRM software spending (USD bn) CRM is the fastest adopter of SaaS, where cannibalisation is most pronounced
Source: IDC, Nomura estimates
Fig. 40: ERM software spending (USD bn) … followed by ERM
Source: IDC, Nomura estimates
• Why is this change happening? Client needs to shift capex to opex, lower expenses and make their costs variable based on usage.
Fig. 41: On-premise model: Cost analysis On premise has high upfront license, continuing maintenance and intermittent upgrade costs
Source: BCG, Nomura estimates
Fig. 42: SaaS model: Cost analysis SaaS costs are driven by usage and maintenance is non-existent, but over a period add-ons and cross selling leads to growth opportunities
Source: BCG, Nomura estimates
• Repercussions: In a SaaS scenario, there are shorter implementation cycles, limited upgrade related revenues, limited hosting and application management revenue versus on-premise. Although over a period higher add-on work related to integration/analytics are opportunities as data flows much more freely. This could lead to cannibalization of implementation and support revenues as on-premise shifts to SaaS. In addition, within on-premise software areas like core ERP there is work happening on consolidation and simplification wherein clients are focused on reducing multiple instances of the software running. This in turn has a negative impact on support revenues for IT services players. So mix of business between on-premise implementation and support versus SaaS/Analytics determines growth in enterprise solutions (ES) segment.
• Results: Slower growth in HCLT in ES, declines in TCS in ES, and better performance of CTSH and INFO in these areas are possibly the result of these trends in our view. Also, in Accenture as it grows its base of SaaS/analytics portions the cannibalization of legacy work is now having a lesser impact leading to better consulting growths, while for IBM shrinkage in revenues is being seen as legacy ERP portions are large.
10
20
15
12
2
4
6
8
10
12
14
16
18
20
22
2014 2015 2016F 2017F 2018F
SaaS, CAGR=19.6% On-premise, CAGR = -3.9%
13
24
3638
8
12
16
20
24
28
32
36
40
2014 2015 2016F 2017F 2018F
SaaS, CAGR = 17.2% On-premise, CAGR = 1.6%
20
20
8
0
20
40
60
80
100
120
140
One Two Three Four Five Average
Initial License Maintenance Upgrades
48
34 344
17
20
40
60
80
100
120
140
One Two Three Four Five Average
Subscriptions Usage Growth
Add-ons and cross-selling
55
Nomura | India IT services 16 December 2015
16
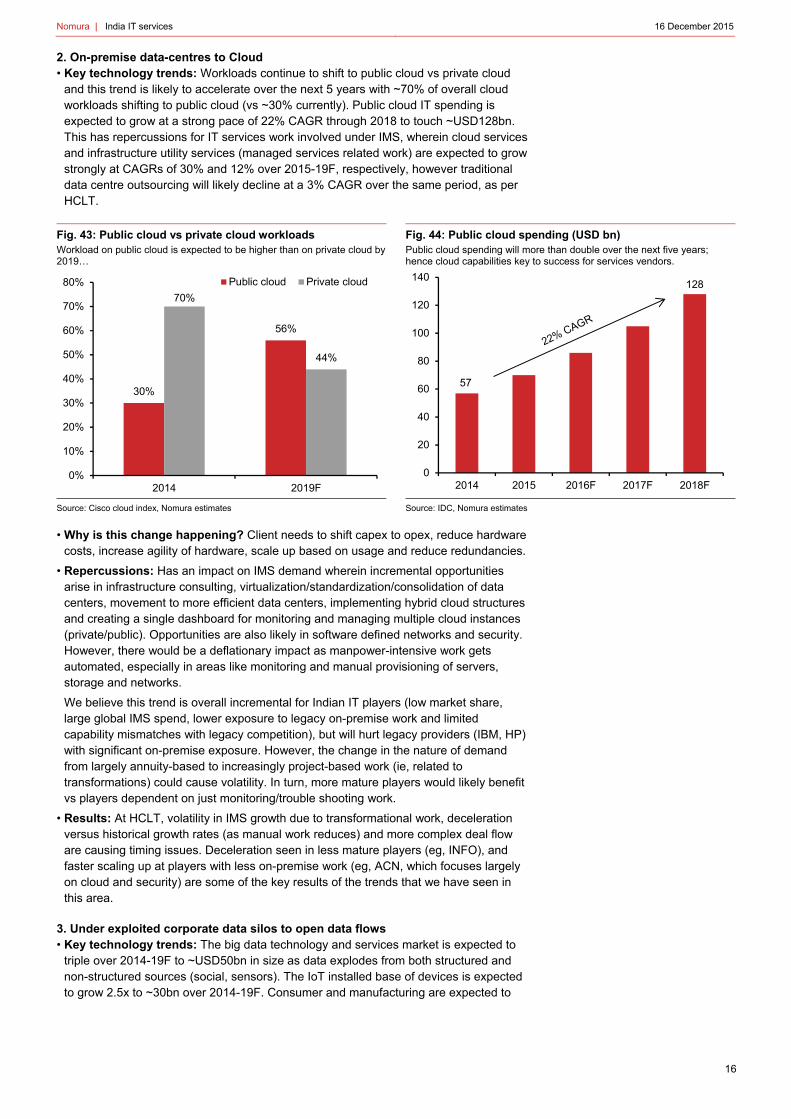
2. On-premise data-centres to Cloud • Key technology trends: Workloads continue to shift to public cloud vs private cloud
and this trend is likely to accelerate over the next 5 years with ~70% of overall cloud workloads shifting to public cloud (vs ~30% currently). Public cloud IT spending is expected to grow at a strong pace of 22% CAGR through 2018 to touch ~USD128bn. This has repercussions for IT services work involved under IMS, wherein cloud services and infrastructure utility services (managed services related work) are expected to grow strongly at CAGRs of 30% and 12% over 2015-19F, respectively, however traditional data centre outsourcing will likely decline at a 3% CAGR over the same period, as per HCLT.
Fig. 43: Public cloud vs private cloud workloads Workload on public cloud is expected to be higher than on private cloud by 2019…
Source: Cisco cloud index, Nomura estimates
Fig. 44: Public cloud spending (USD bn) Public cloud spending will more than double over the next five years; hence cloud capabilities key to success for services vendors.
Source: IDC, Nomura estimates
• Why is this change happening? Client needs to shift capex to opex, reduce hardware costs, increase agility of hardware, scale up based on usage and reduce redundancies.
• Repercussions: Has an impact on IMS demand wherein incremental opportunities arise in infrastructure consulting, virtualization/standardization/consolidation of data centers, movement to more efficient data centers, implementing hybrid cloud structures and creating a single dashboard for monitoring and managing multiple cloud instances (private/public). Opportunities are also likely in software defined networks and security. However, there would be a deflationary impact as manpower-intensive work gets automated, especially in areas like monitoring and manual provisioning of servers, storage and networks.
We believe this trend is overall incremental for Indian IT players (low market share, large global IMS spend, lower exposure to legacy on-premise work and limited capability mismatches with legacy competition), but will hurt legacy providers (IBM, HP) with significant on-premise exposure. However, the change in the nature of demand from largely annuity-based to increasingly project-based work (ie, related to transformations) could cause volatility. In turn, more mature players would likely benefit vs players dependent on just monitoring/trouble shooting work.
• Results: At HCLT, volatility in IMS growth due to transformational work, deceleration versus historical growth rates (as manual work reduces) and more complex deal flow are causing timing issues. Deceleration seen in less mature players (eg, INFO), and faster scaling up at players with less on-premise work (eg, ACN, which focuses largely on cloud and security) are some of the key results of the trends that we have seen in this area.
3. Under exploited corporate data silos to open data flows • Key technology trends: The big data technology and services market is expected to
triple over 2014-19F to ~USD50bn in size as data explodes from both structured and non-structured sources (social, sensors). The IoT installed base of devices is expected to grow 2.5x to ~30bn over 2014-19F. Consumer and manufacturing are expected to
30%
56%
70%
44%
0%
10%
20%
30%
40%
50%
60%
70%
80%
2014 2019F
Public cloud Private cloud
57
128
0
20
40
60
80
100
120
140
2014 2015 2016F 2017F 2018F

Nomura | India IT services 16 December 2015
17
contribute ~50% of overall IoT spend, with retail, transportation and healthcare being the other big spenders. Services and platforms would be the biggest portions of IoT spending and hence a big opportunity area for IT services companies.
Fig. 45: Big data technology and services market Big data IT spend expected to nearly triple over 2014-2019F
Source: IDC, Nomura estimates
Fig. 46: IoT installed base IoT devices installed base to touch 30bn by 2020
Source: IDC, Nomura estimates
Fig. 47: Expected IoT spending by verticals by 2018F Consumer and manufacturing would drive ~50% of IoT spend in 2018
Source: IDC, Nomura estimates
Fig. 48: IoT revenues split across segments (in USD bn) Services and platforms account for the biggest proportions of IoT spend, hence a significant opportunity for IT services companies.
Source: IDC, Nomura estimates
16.5
48.6
0
5
10
15
20
25
30
35
40
45
50
2014 2015 2016F 2017F 2018F 2019F
12
30
0
5
10
15
20
25
30
2014 2015 2016F 2017F 2018F 2019F 2020F
Consumer, 29%
Manufacturing, 20%
Government , 12%
Retail, 7%
Transportation, 7%
Healthcare, 7%
Utilities, 4%
Communications and Media, 4%
Banking , 3% Others, 6%
0
50
100
150
200
250
300
350
2013 2014 2015 2016F 2017F 2018F 2019F 2020F
Devices Connectivity Platforms Analytics Services
Services to grow at 20% CAGR over 2015-20

Nomura | India IT services 16 December 2015
18
• Why is this change happening? This change is driven by client needs to generate greater insights into customer behaviour, improve customer experience and aid decision support. In addition, in areas like industrial/consumer IoT this opens up a newer revenue stream for customers, where they would require help from IT service providers to reach out to enterprise customers. For example, GE expects more than USD15 billion in software and solutions revenue by 2020 driven by Predix - the cloud-based platform for creating industrial internet applications.
• Repercussions: Players strong in business intelligence and analytics would benefit from big data demand, while players strong in engineering services + analytics would gain from IoT work. Further, vertical knowledge to generate better insights and help decision support would lend greater strengths to the Big Data and IoT practices of services providers, in our view. There would be opportunities in the ADM space to facilitate open data flows across applications and external/internal data sources.
• Results: Strong growth in engineering services is partly contributed by IoT demand (though it is still low in terms of contribution but holds significant promise), and companies that are growing better in the enterprise solutions (ES) area are likely to be players with smaller on-premise exposure, higher SaaS exposure and higher analytics strengths.
We expect CTSH/INFO/TCS to benefit more from big data demand, while HCLT should be a strong contender in IoT (especially industrial IoT) given its strength in engineering services. This would be one area where we believe companies would look towards acquiring assets or developing own IP to augment analytics capabilities and vertical expertise.
4. Desktop-based systems to mobility and omni-channel apps • Technology trends: Historically, enterprise app environments have been focused on
desktops with fragmented user experiences. However, as mobility catches up and customers access enterprise apps from across channels, there is a need for apps to be more open (providing access to other apps through APIs – application programming interfaces), to provide a uniform user experience across channels, and to be developed with a mobile first approach. This entails a change at the backend as well to support these changed user requirements.
• Why is this change happening? Due to proliferation of smartphones and tablets, customers/employees now have superior computing power at hand anytime, anywhere, and hence clients cannot neglect any of these modes of access.
• Repercussions: This will have an impact on enterprise solutions (ES) and IMS demand with work related to BYOD (Bring your own device) or enabling mobility for clients, exposing corporate apps on mobiles and advanced security aspects will come into play. Typically, IMS players stronger in the end-user computing segment will gain – HCLT/TCS are bigger in this area, in our view, which will benefit from mobility transformation. However, desktop outsourcing related work will likely see shrinkage. Players stronger in enterprise solutions and ADM areas, coupled with stronger vertical expertise, will benefit from app development and work related to extending enterprise apps to mobiles. CTSH/INFO should be bigger beneficiaries in this area, in our view.
5. From mandate of reliability of IT systems to dual mandate of reliability and agility • Technology trends: Given that IT systems now have a dual mandate of being reliable
(old school) and agile or more innovative (new school), this will lead to changes in the organizational structures from hierarchical to networked, and IT departments from uni-modal (focusing on reliability and predictability) to bi-modal (reliability and innovating at scale) and tri modal (focused on reliability, focused on process improvement in traditional areas and focused on innovating at scale).
• Why is this change happening? Hierarchical and waterfall approaches will not be able to help organizations tackle digital disruption and organisations need to gain efficiencies in traditional areas, which can then be redeployed to drive innovation.
• Repercussions: Different people within the organization would be given this responsibility to drive reliability, agility and process change, and hence service providers will have to adjust their sales processes to target these different needs, eg,

Nomura | India IT services 16 December 2015
19
for reliability-related work, farming was very important, and now for agility, hunting capabilities would be important. The work profile in the agility areas is changing from do as directed to more consultative selling, suggesting what is possible, how can business models be disrupted, and how can internal processes be reengineered.
Second, to drive innovation at scale, investments will have to happen on IP both own and acquired and leveraging of open source aggressively. To achieve this inorganic strategies and collaborations with startups at the cutting edge of technology/solutions will become important success drivers.
Third, organizations within service providers themselves will require a change which will require staff reskilling, a change from the historical pyramid structure to building more differentiated skills, adoption of different development methodologies (eg, Agile, Devops) with greater automation (artificial intelligence/machine learning).
• Results: First, this change in technology has seen an increase in M&A wherein more than 60% of the acquisitions for global majors have been in the SMAC space (close to 40% for India IT). Though for Indian IT, a still larger chunk of acquisitions has been towards, expanding specific vertical domain knowledge, geographical reach and consulting capabilities. Second, efforts to reskill have been announced across companies, with TCS looking at skilling ~100,000 people on digital, INFO indicating ~70,000 people would be trained on design thinking, and WPRO indicating ~10,000 people would be trained in digital in 2016. Third, efforts to build IP solutions/platforms incorporating artificial intelligence have been announced across companies, to automate traditional work.
Fig. 49: Acquisition by area for IBM, Accenture & Tier-1 IT from 2012 to date (nos.) Accenture and IBM have been substantially more acquisitive versus Indian IT in emerging spend areas
Source: Bloomberg, Nomura research
Fig. 50: Acquisition spend of Accenture versus Indian IT companies (USD bn) Accenture has acquired close to 40 companies since 2012 (of which ~60% are in digital space) leading to a total spend of ~USD2.5bn, significantly higher than most Indian IT companies (ex CTSH which acquired Trizetto for ~ USD2.7bn)
Source: Company data, Nomura research
Acquisition area IBM Accenture Tier 1 Indian IT
Emerging spend areas
Analytics 9 8 2
Digital Marketing 2 9 3
Cloud Computing 16 6 3
Mobility 3 1 2
Sub Total 30 24 10
Traditional spend areas
Products, platforms & solutions 0 3 0
Industry solutions 0 6 7
IT Services/Consulting 2 8 7
Technology 3 0 2
Sub Total 5 17 16
Overall 35 41 26
% emerging 86% 59% 38%
3.0
2.5
0.6 0.5
0.2
0.0
0.5
1.0
1.5
2.0
2.5
3.0
3.5
Cognizant Accenture Infosys Wipro TCS

Nomura | India IT services 16 December 2015
20
Demand becoming more macro dependent: Client financials and US PMI suggest worsening demand trends
We believe near-term demand indicators like client financials and US PMI suggest worsening trends, despite expectations of an increase in nominal US GDP from 2.5% in 2015 to 4.1% in 2016, as per our house view, and an increase in business spending to 3.7% in 2016 vs 3% in 2015, which augur well from a medium-term demand perspective (possibly towards 2HFY17F). These indicators impact demand with a 2-3 quarter lag. Hence, we believe a softer 2HFY16F and a weak start to FY17F will likely limit chances of an acceleration in FY17F.
• Client financials: We are witnessing deterioration in Fortune 500 US companies with decelerated or negative revenue growth across a range of sectors over the past 3-4 quarters. The correlation of revenue growth in Fortune 500 companies across verticals with the corresponding revenue growth in that segment for tier-1 IT shows the improvement or deterioration in client financials impacts demand with a 2-3 quarter lag (refer to figures below).
• US PMI has hit the lowest level since June 2009 at 48.6, down from a near term peak of 58. This indicator correlates well with both the CNXIT (IT stock index performance) and the demand for tier-1 IT in the US. Demand in the US lags the PMI by 2-3 months, in our view.
• US private jobs data too suggest that the monthly average job additions YTD in 2015 are nearly 20% lower than 2014 levels. IT services being a linear sector dependent on job addition correlates with US private job additions.
Fig. 51: US Fortune 500 revenue and operating income progression over the past two years Deterioration in client financials with deceleration or negative revenue growth seen across most sectors in the US. Typically, demand lags client financial improvement/deterioration by 2-3 quarters
Note: L2P indicates a move from loss to profit, while P2L indicates vice-versa. Source: Bloomberg, Nomura research
2014 2015y-o-y growth (%) Q1 Q2 Q3 Q4 Q1 Q2 Q3BFSRevenue (3) (1) 4 (2) 2 0 (3)Operating income (4) (14) 22 (12) 20 19 8InsuranceRevenue 0 7 8 5 5 0 3Operating income 9 37 10 (20) 17 (22) 20RetailRevenue 2 4 4 2 1 0 (0)Operating income (5) 0 6 9 6 5 0Oil & GasRevenue (2) 4 (5) (19) (38) (33) (37)Operating income (17) (7) (8) (59) (76) (78) (83)TelecomRevenue 7 5 4 5 2 3 1Operating income 9 5 4 P2L 4 3 2ConsumerRevenue (3) (1) (3) (2) (4) (5) (7)Operating income 2 (0) (7) (27) (16) (22) 43PharmaRevenue 3 8 6 6 5 2 5Operating income 14 25 6 14 11 (0) 18Mfg - HiTechRevenue 9 11 9 6 2 (3) (2)Operating income 53 55 33 25 0 (17) (9)Mfg - ChemicalsRevenue 3 3 1 0 (8) (8) (11)Operating income 8 6 9 (17) 3 3 10Mfg - AutoRevenue 0 1 (2) (3) (5) (4) (3)Operating income (56) (7) (50) (13) 103 42 29Aero and DefenseRevenue 3 3 3 5 1 2 1Operating income 10 4 12 18 5 2 (4)

Nomura | India IT services 16 December 2015
21
Fig. 52: BFSI client revenue growth vs Tier 1 IT BFSI growth (2-quarter lag) Over the last 2 quarters, BFS client revenue growth has decelerated, which could depress growth in this vertical for tier 1 IT
Source: Bloomberg, Nomura research
Fig. 53: Energy client revenue growth vs Tier 1 IT Energy growth (2-quarter lag) Near-term pain, but stabilisation could push up cost focused outsourcing in the medium term
Source: Bloomberg, Nomura research
Fig. 54: Manufacturing (Hi-Tech + Auto) client revenue growth vs Tier 1 IT Mfg growth (2-quarter lag) Manufacturing revenue growth for Tier 1 IT has seen moderation in line with financials
Source: Bloomberg, Nomura research
Fig. 55: Retail client revenue growth vs Tier 1 IT retail growth (1-quarter lag) Stabilisation visible in retail, but sustainability key to watch especially in light of further deceleration in client revenue growth
Source: Bloomberg, Nomura research
Fig. 56: US manufacturing PMI vs CNX IT Index Weakening of US PMI is reflected in IT stock performance with a lag, which could imply some further weakening
Source: Bloomberg, Nomura research
Fig. 57: US PMI vs Tier-1 IT US growth with a two-quarter lagFall in US PMI will likely be reflected in weaker US y-y growth (ex TriZetto) over the next 2 quarters before an improvement from 1Q/2QFY17F
Source: Bloomberg, Nomura research
-30%
-20%
-10%
0%
10%
20%
0%
10%
20%
30%
40%
Dec-10 Dec-11 Dec-12 Dec-13 Dec-14 Dec-15
Tier 1 IT Fortune 500 (RHS)
-50%
-40%
-30%
-20%
-10%
0%
10%
20%
30%
-10%
0%
10%
20%
30%
40%
50%
Dec-10 Dec-11 Dec-12 Dec-13 Dec-14 Dec-15
Tier 1 IT Fortune 500 (RHS)
-5%
0%
5%
10%
15%
20%
-5%
0%
5%
10%
15%
20%
Mar-11 Mar-12 Mar-13 Mar-14 Mar-15 Mar-16
Tier 1 IT Fortune 500 (RHS)
-2%
0%
2%
4%
6%
8%
0%
10%
20%
30%
40%
50%
Dec-10 Dec-11 Dec-12 Dec-13 Dec-14 Dec-15
Tier 1 IT Fortune 500 (RHS)
30
40
50
60
70
1,500
4,500
7,500
10,500
13,500
Jan
-06
Jan
-07
Jan
-08
Jan
-09
Jan
-10
Jan
-11
Jan
-12
Jan
-13
Jan
-14
Jan
-15
CNXIT Index (LHS)
US Mfg PMI (RHS)
0%
10%
20%
30%
40%
50%
30
35
40
45
50
55
60
65
Mar
-06
Mar
-07
Mar
-08
Mar
-09
Mar
-10
Mar
-11
Mar
-12
Mar
-13
Mar
-14
Mar
-15
US Mfg PMI (LHS)
Tier-1 IT US y-y growth (2qtr lag) (RHS)

Nomura | India IT services 16 December 2015
22
Fig. 58: US private job addition trends (in 000's) Average monthly private job additions in 2015 are near 20% lower than those in 2014. A sustained pick up in job additions could translate to strong IT services demand
Source: Bloomberg, Nomura research
Valuations and USD strength lend defensiveness
IT stocks have corrected after the 2QFY16 results on moderation in the 2HFY16F outlook. However, the stocks have still outperformed the Nifty from an LTM perspective. We believe two factors that will limit material downside risks for the stocks are: 1) valuations, which at ~17.8x 1-year forward P/E for tier-1 IT are close to the 5-year historical average and thus are not too expensive; 2) USD strengthening and associated INR depreciation lately should play to the advantage of IT stocks lending defensiveness to earnings, even in a scenario of slight deceleration and 3) Compared to other defensive sectors FMCG and Pharma, IT sector still trades at lower than historical discounts. These reasons prevent us from being overly negative on the names, even though we are cautious on demand going into FY17F.
Fig. 59: Tier-1 IT 1-yr fwd P/E trend vs 5-yr average Tier 1 IT is trading at ~3% premium to its 5-year average
Source: Bloomberg, Nomura estimates
Fig. 60: Tier-1 IT (ex CTSH) vs Sensex P/E Tier 1 IT trades at a ~10% premium to the Sensex
Source: Bloomberg, Nomura research
200 193 204
254
202
5
55
105
155
205
255
305
355
405
455Ja
n-1
1
Ap
r-11
Jul-1
1
Oct
-11
Jan
-12
Ap
r-12
Jul-1
2
Oct
-12
Jan
-13
Ap
r-13
Jul-1
3
Oct
-13
Jan
-14
Ap
r-14
Jul-1
4
Oct
-14
Jan
-15
Ap
r-15
Jul-1
5
Oct
-15
private job additions m-m avg for the year
17.8
17.3
5
10
15
20
25
30
Jan-05 Jan-07 Jan-09 Jan-11 Jan-13 Jan-15
Aggregate Tier-1 IT P/E avg P/E 24
-23
100
-25
-15
-5
5
15
25
Dec-10 Dec-11 Dec-12 Dec-13 Dec-14 Dec-15
IT P/E prem/(disc) to Sensex Avg

Nomura | India IT services 16 December 2015
23
Fig. 61: Tier-1 IT P/E (ex CTSH) vs pharma P/E multiples Tier-1 IT is currently trading at lower than historical discounts to pharma
Source: Bloomberg, Nomura research
Fig. 62: Tier-1 IT P/E (ex CTSH) vs FMCG P/E multiples … while being marginally ahead of historical discounts to FMCG
Source: Bloomberg, Nomura research
Fig. 63: IT stock performance over LTM ACN and CTSH have outperformed peers over LTM. WPRO/TCS/TECHM and IBM have materially lagged
Source: Bloomberg, Nomura research
Fig. 64: IT sector relative performance over LTM IT sector returns have been better than Nifty
Source: Bloomberg, Nomura research
Fig. 65: Inter-tech median performance over LTM IT services median stock return has underperformed only Software & Internet sectors over the last 12 months among tech subsectors
Source: Bloomberg, Nomura research
2
-41
-29-20
-50
-40
-30
-20
-10
0
10
Dec-10 Dec-11 Dec-12 Dec-13 Dec-14 Dec-15
IT P/E prem/(disc) to Pharma Avg -17
-64
-49
-45
-75
-65
-55
-45
-35
-25
-15
Dec-10 Dec-11 Dec-12 Dec-13 Dec-14 Dec-15
IT P/E prem/(disc) to FMCG Avg
29
1511
94
-3
-13-17-20
-10
0
10
20
30
40
ACN Cognizant HCL Tech Infosys Wipro TCS IBM TechM
2 1
-5-7 -7 -8 -9 -10 -11
-20
-35-40
-35
-30
-25
-20
-15
-10
-5
0
5
Ph
arm
a IT
Au
to
FM
CG
Nift
y
Oil
Cap
Goo
ds
Po
wer
Ba
nks
Rea
lty
Met
als 27
15
10
4
2
-24
-30 -25 -20 -15 -10 -5 0 5 10 15 20 25 30
Internet
Software
IT Services
Comm.Equipment
Semis
Computers &Peripherals

Nomura | India IT services 16 December 2015
24
Be selective, back better business mix – HCLT, CTSH followed by INFO are our top Buys
The continuing themes in the sector are: 1) strong traction in IMS, engineering services and BPO among services, 2) healthcare and manufacturing among verticals, 3) US macro not yet being reflected while Europe continues to show strength on cost-focused outsourcing, with likelihood of some worsening in US growth given the macro deterioration, and 4) Lower cannibalisation and greater benefits from digital. So, essentially the business mix is becoming a crucial factor in determining stock preferences alongside execution in order to determine the fortunes of tier-1 IT companies.
• Share of growing segments: IMS/BPO/engineering services and testing vs. ADM/consulting and SI – HCLT and TCS score higher than INFO on this parameter, but INFO/CTSH are gaining share in larger segments ADM/consulting & SI. Even though WPRO has a higher contribution from faster growing services (vs INFO/TCS), execution and much higher drag in other services is an issue for growth.
Fig. 66: Share of fast growing service lines (LTM) % HCLT and TCS have a higher share of fast growing service lines (IMS/BPO/Engg Services/Testing) vs. INFO
Source: Company data, Nomura research
Fig. 67: Growth comparison between service lines (LTM) % Faster growing services (IMS/BPO/Engg. services/testing) have grown materially faster than other services across companies.
Note: Fast growing segments for Infosys is calculated excluding a one-off revenue of $23mn, including which the growth would have been 11%
Source: Company data, Nomura research
• Share of Europe versus US: HCLT and TCS have higher European share which might be currently hurting in reported terms due to cross currency, but longer-term demand trends are more positive in Europe. However, divergence in European growth is significant with HCLT growing the fastest, TCS and INFO seeing similar growth inline with aggregate tier 1 IT and WPRO seeing minimal growth. Here too, while WPRO’s share from Europe is higher than INFO/TCS execution, higher share of the sluggish energy sector within Europe and weaker overall positioning is driving flattish growth trends at WPRO.
59
45
39
26
HCLT Wipro TCS Infosys
16
12
14
7
2
-2
7
5
HCLT Wipro TCS Infosys
LTM growth fast-growing service lines
LTM growth other service lines

Nomura | India IT services 16 December 2015
25
Fig. 68: Revenue share of US/Europe (LTM) % HCLT and TCS have a higher share of revenue from Europe. However, there is significant divergence in growth, with HCLT fastest, TCS/INFO growing inline with aggregate and WPRO flat
Source: Company data, Nomura research
Fig. 69: Growth comparison between geographies Europe in constant currency terms has consistently outperformed growth in US, though lately some moderation has been seen. We expect outperformance of Europe to be sustained going forward.
Source: Company data, Nomura research
• Share of BFSI/retail versus growing segments like manufacturing/healthcare: HCLT/INFO and CTSH score on this parameter, while TCS has a handicap of having a relatively larger BFSI/retail practice. BFSI growth to be largely dependent on market share gains as we remain cautious on incremental spending in light of weakening client financials.
Fig. 70: Share of manufacturing + healthcare vs. BFSI + retail (LTM) % HCLT and INFO have a higher share of the fast growing verticals vs WPRO/TCS
Source: Company data, Nomura research
Fig. 71: Growth comparison – manufacturing + healthcare vs.BFSI + retail (LTM) % Verticals like manufacturing +healthcare have grown faster than BFSI + retail at most companies
Source: Company data, Nomura research
• Lower cannibalisation and greater benefits from digital: The determinants of which company grows better are 1) share of on premise implementation and support vs SaaS – in ES practice and stronger consulting capabilities (CTSH, INFO), 2) greater ability to handle complexity in IMS practice, crucial for winning large deals in cloud/mobility transformation (HCLT/TCS) 3) Strong analytics and engineering services practice to benefit from IoT (HCLT) and 4) Stronger analytics capabilities to benefit from Big Data (CTSH/INFO/TCS). Overall, we believe HCLT will likely benefit the most from back-end digital and IoT, while CTSH should benefit from stronger front-end digital capabilities. We like INFO strategy of trying to target the newer technology spends through investment in IP (organic/inorganic/collaboration), bringing about organisational changes and increased aggression in traditional services (ADM/ES) by leveraging automation – reflected in better top clientele traction and ES turning the corner after underperforming for the last three years. While, TCS has strengths on both front-end
58
52 52
63
3126 27
23
HCL Tech Wipro TCS Infosys
US Europe
10%
10%
0%
5%
10%
15%
20%
25%
1QF
Y13
2QF
Y13
3QF
Y13
4QF
Y13
1QF
Y14
2QF
Y14
3QF
Y14
4QF
Y14
1QF
Y15
2QF
Y15
3QF
Y15
4QF
Y15
1QF
Y16
2QF
Y16
US Europe cc
35
50
58
4142 40
33 33
HCLT Infosys TCS Wipro
BFSI + Retail Mfg + Healthcare
8
45
7
21
10
7
14
0
5
10
15
20
25
TCS Infosys Wipro HCLT
BFSI + Retail Mfg + Healthcare
Nomura | India IT services 16 December 2015
26
and back-end digital, we believe currently the skew towards higher on-premise support in ES and larger presence in ADM will create a handicap for growth.
Pecking order: HCLT > CTSH > INFO > TCS > TECHM > WPRO • HCLT (HCLT IN, Buy, TP: INR1,020): We are positive on HCLT due to its: 1) superior
positioning in IMS (~35% of revenue) and likely market share gains in upcoming deal rebids (worth ~USD150bn over CY16-18); and 2) largest presence in engineering services (~19% of revenue), which we believe over the medium term could see similar trends as IMS on larger deals, increased interest in Europe and market share gains for Indian IT. We believe valuations are reasonable at ~13.5x FY17F P/E (EPS: 62.6) at a discount of ~18-24% to similar growing peers INFO/TCS. We expect HCLT to perform better than peers in 2HFY16F.
• CTSH (CTSH US, Buy, TP: USD72): We like CTSH as we believe it is well positioned relative to peers to benefit from: 1) nearly half of its revenues coming from healthcare and manufacturing (faster growing segments for Indian IT) 2) market share gains in BFSI and stronger positioning in the US; and 3) stronger front-end digital capabilities. This, we believe, is likely to enable the company to post best-in-class revenue and EPS CAGR of ~14% and ~18% respectively over FY15-17F.
• INFO (INFO IN, Buy, TP INR1,225): We retain Buy on INFO as we believe the company is on the right path in terms of: 1) improving client connect and traction in traditional services like ADM/Consulting & SI – which is reflected in improved performance over the last two quarters; 2) better control on operations with margins being retained within guided range of 24-26% EBIT, despite aggression on growth; and 3) focus on investing for the future and creating differentiation by targeting non-CIO IT spends. We expect INFO to grow revenues ahead of TCS over FY16/17F, leading to valuation gaps equalising.
• TCS (TCS IN, Neutral, TP INR2,500): We stay Neutral on TCS as weaker developed market traction and slower growth in ADM/Enterprise solutions will likely result in TCS growing below INFO in FY16/17F (after 5 years of outperformance). Further, we think 2HFY16F growth expectations could have downside risk. While stock valuations are still at a premium to similar growing INFO/HCLT. We expect a ~9%/~10.5% USD revenue/EPS CAGR at TCS over FY15-17F.
• TechM (TECHM IN, Neutral, TP INR560): We stay Neutral on TECHM as what has driven growth in the past is starting to get sluggish: 1) Telecom (53% of revenue) is facing slow decision making and intensifying competition; 2) top 10 client concentration (43% of revenue) is likely to be a drag; and 3) Enterprise segment while currently performing might hit a wall on subscale presence. We see limited organic growth of ~1% in FY16F and expect 10% USD revenue and 12% EPS CAGR over FY16-18F.
• WPRO (WPRO IN, Neutral, TP INR570): Wipro remains our least-preferred India Tier 1 IT company as we believe it will continue to underperform on growth driven by: 1) weaker positioning in developed markets; and 2) stronger entrenched competition in key growth segments like BFSI/IMS/BPO. We expect weaker-than-industry growth at 7% vs. 9-17% at HCLT/INFO/TCS/CTSH over FY15-17F.
We maintain Reduce on HEXW and Mphasis.

Rating Remains BuyTarget Price Reduced from 76.00 USD 72.00
Closing price 11 December 2015 USD 58.30
Potential upside +23.5%
Anchor themesWe prefer companies that have a better skew towards growing segments and are available at reasonable valuations.
Nomura vs consensusOur TP is 5% below consensus on slight conservatism on multiples in light of near term demand uncertainty due to healthcare M&A.
Research analysts
India Technology/Services & Software
Ashwin Mehta - NFASL [email protected] +91 22 4037 4465
Rishit Parikh - NSFSPL [email protected] +91 22 4037 4360
Key company data: See next page for company data and detailed price/index chart.
Cognizant CTSH.OQ CTSH US
EQUITY: SOFTWARE & SERVICES
Premium for outperformance to stay
Strength in the US/BFSI/digital and high exposure to healthcare/manufacturing keep us positive
Action: Best-in-class revenue and EPS growth profile; Buy We maintain our Buy rating for the stock as it benefits from: 1) market share gains in BFSI; 2) higher exposure to fast-growing verticals (manufacturing/healthcare) at ~50% of revenue 3) a limited presence in sluggish segments (telecom/energy); and 4) stronger digital capabilities (especially front-end). We believe the near-14% stock correction since its (3Q15) results (vs. 4% correction in Nasdaq index) adequately prices in the risk of 1) A slight miss in their 4Q revenue growth guidance due to Chennai flood impacts (~60bps q-q) and 2) a conservative FY16F revenue growth guidance due to the likely impact of a temporary lull in demand caused by impending large M&As in healthcare (although a long-term positive as CTSH is present in both sides of M&As in most cases). We expect CTSH to outperform peers with a revenue CAGR of 14% and an EPS CAGR of 18% over FY15-17F.
Catalyst: Strong FY16F revenue growth guidance after 4QFY15F results
Expect FY16F guidance to be conservative at start of the year We expect CTSH to guide for a conservative 12%+ revenue growth for FY16F after its 4Q15F results as it remains cautious on: 1) the impact of healthcare M&As; and 2) past misses on start of the year guidance in FY13/14. However, we expect CTSH to progressively improve its growth guidance in 2016F and build in ~14% y-y growth in the year (ahead of its tier 1 IT peers). CTSH’s focus on high reinvestments, lower margin thresholds and strong front-end digital capabilities should help it outperform peers over the medium-term.
Moderate multiples on healthcare M&A uncertainty; TP cut to USD72 Our TP of USD72 (vs USD76 earlier) is based on a lower multiple of 20x (vs 21x previously) 1-year forward EPS of USD3.6 (up to Sept-17F). We lower the target multiple to factor in the uncertainty around growth due to impending M&As in healthcare. However we continue to expect CTSH to trade at a premium over its tier 1 Indian IT peers on better growth expectations.
Year-end 31 Dec FY14 FY15F FY16F FY17F
Currency (USD) Actual Old New Old New Old New
Revenue (mn) 10,263 12,428 12,405 14,142 14,132 16,215 16,193
Reported net profit (mn) 1,439 1,646 1,631 1,984 1,972 2,301 2,273
Normalised net profit (mn) 1,439 1,646 1,631 1,984 1,972 2,301 2,273
FD normalised EPS 2.35 2.68 2.66 3.24 3.22 3.75 3.71
FD norm. EPS growth (%) 16.6 14.2 13.1 20.6 21.0 16.0 15.3
FD normalised P/E (x) 24.8 N/A 21.9 N/A 18.1 N/A 15.7
EV/EBITDA (x) 16.0 N/A 12.9 N/A 10.4 N/A 8.4
Price/book (x) 4.6 N/A 3.8 N/A 3.1 N/A 2.6
Dividend yield (%) na N/A na N/A na N/A na
ROE (%) 20.7 19.3 19.2 19.2 19.1 18.3 18.2
Net debt/equity (%) net cash net cash net cash net cash net cash net cash net cash
Source: Company data, Nomura estimates
Global Markets Research 16 December 2015
See Appendix A-1 for analyst certification, important disclosures and the status of non-US analysts.

Nomura | Cognizant 16 December 2015
28
Key data on Cognizant Relative performance chart
Source: Thomson Reuters, Nomura research
Notes:
Performance (%) 1M 3M 12MAbsolute (USD) -14.1 -7.2 13.2 M cap (USDmn) 35,450.4Absolute (USD) -14.1 -7.2 13.2 Free float (%) 99.0Rel to MSCI India -13.2 -5.4 23.2 3-mth ADT (USDmn) 225.1 Income statement (USDmn) Year-end 31 Dec FY13 FY14 FY15F FY16F FY17FRevenue 8,843 10,263 12,405 14,132 16,193Cost of goods sold -5,384 -6,274 -7,669 -8,738 -10,021Gross profit 3,459 3,989 4,736 5,394 6,171SG&A -1,662 -1,969 -2,397 -2,657 -3,044Employee share expense -119 -135 -187 -184 -211Operating profit 1,678 1,885 2,153 2,553 2,917EBITDA 1,850 2,085 2,474 2,907 3,321Depreciation -172 -200 -322 -353 -405Amortisation
EBIT 1,678 1,885 2,153 2,553 2,917Net interest expense
Associates & JCEs
Other income 10 39 32 93 135Earnings before tax 1,688 1,924 2,184 2,646 3,051Income tax -459 -485 -554 -675 -778Net profit after tax 1,229 1,439 1,631 1,972 2,273Minority interests
Other items
Preferred dividends
Normalised NPAT 1,229 1,439 1,631 1,972 2,273Extraordinary items
Reported NPAT 1,229 1,439 1,631 1,972 2,273Dividends 0 0 0 0Transfer to reserves 1,229 1,439 1,631 1,972 2,273Valuations and ratios
Reported P/E (x) 28.7 24.6 21.8 18.0 15.6Normalised P/E (x) 28.7 24.6 21.8 18.0 15.6FD normalised P/E (x) 28.9 24.8 21.9 18.1 15.7Dividend yield (%) na na na na naPrice/cashflow (x) 26.4 31.9 21.6 17.6 15.4Price/book (x) 5.7 4.6 3.8 3.1 2.6EV/EBITDA (x) 17.1 16.0 12.9 10.4 8.4EV/EBIT (x) 18.9 17.7 14.9 11.8 9.6Gross margin (%) 39.1 38.9 38.2 38.2 38.1EBITDA margin (%) 20.9 20.3 19.9 20.6 20.5EBIT margin (%) 19.0 18.4 17.4 18.1 18.0Net margin (%) 13.9 14.0 13.1 14.0 14.0Effective tax rate (%) 27.2 25.2 25.3 25.5 25.5Dividend payout (%) 0.0 0.0 0.0 0.0 0.0ROE (%) 22.4 20.7 19.2 19.1 18.2ROA (pretax %) 41.7 30.6 26.4 29.5 31.7Growth (%)
Revenue 20.4 16.1 20.9 13.9 14.6EBITDA 22.5 12.7 18.7 17.5 14.3Normalised EPS 16.6 16.4 13.1 21.0 15.3Normalised FDEPS 17.3 16.6 13.1 21.0 15.3Source: Company data, Nomura estimates
Cashflow statement (USDmn) Year-end 31 Dec FY13 FY14 FY15F FY16F FY17FEBITDA 1,850 2,085 2,474 2,907 3,321Change in working capital 2 -384 -126 -135 -149Other operating cashflow -505 -582 -692 -745 -856Cashflow from operations 1,347 1,118 1,657 2,027 2,316Capital expenditure -282 -366 -353 -370 -370Free cashflow 1,065 753 1,304 1,657 1,946Reduction in investments 0 0 0 0 0Net acquisitions Dec in other LT assets -179 -2,792 82 0 0Inc in other LT liabilities 0 0 0 0 0Adjustments CF after investing acts 886 -2,039 1,386 1,657 1,946Cash dividends 0 0 0 0 0Equity issue 53 165 -93 88 88Debt issue -65 1,862 -694 -22 -18Convertible debt issue Others 10 39 32 93 135CF from financial acts -3 2,067 -755 160 205Net cashflow 884 27 632 1,816 2,151Beginning cash 2,864 3,747 3,775 4,406 6,223Ending cash 3,747 3,775 4,406 6,223 8,374Ending net debt -3,747 -2,137 -3,469 -5,342 -7,549 Balance sheet (USDmn) As at 31 Dec FY13 FY14 FY15F FY16F FY17FCash & equivalents 3,747 3,775 4,406 6,223 8,374Marketable securities 0 0 0 0 0Accounts receivable 1,875 2,293 2,659 3,067 3,519Inventories 0 0 0 0 0Other current assets 269 353 337 389 446Total current assets 5,892 6,421 7,402 9,679 12,339LT investments 0 0 0 0 0Fixed assets 1,081 1,247 1,278 1,295 1,260Goodwill 576 3,367 3,285 3,285 3,285Other intangible assets 0 0 0 0 0Other LT assets 586 684 823 893 971Total assets 8,135 11,719 12,788 15,151 17,855Short-term debt 0 1,638 938 881 825Accounts payable 1,775 1,892 2,116 2,441 2,801Other current liabilities Total current liabilities 1,775 3,530 3,054 3,323 3,626Long-term debt Convertible debt Other LT liabilities 224 449 455 490 528Total liabilities 1,999 3,979 3,509 3,813 4,155Minority interest Preferred stock 0 0 0 0 0Common stock 550 562 562 562 562Retained earnings 5,586 7,179 8,717 10,777 13,138Proposed dividends Other equity and reserves Total shareholders' equity 6,136 7,740 9,278 11,338 13,700Total equity & liabilities 8,135 11,719 12,788 15,151 17,855
Liquidity (x)Current ratio 3.32 1.82 2.42 2.91 3.40Interest cover na na na na naLeverageNet debt/EBITDA (x) net cash net cash net cash net cash net cashNet debt/equity (%) net cash net cash net cash net cash net cash
Per shareReported EPS (USD) 2.03 2.37 2.68 3.24 3.73Norm EPS (USD) 2.03 2.37 2.68 3.24 3.73FD norm EPS (USD) 2.02 2.35 2.66 3.22 3.71BVPS (USD) 10.16 12.73 15.23 18.62 22.50DPS (USD) 0.00 0.00 0.00 0.00 0.00Activity (days)Days receivable 70.2 74.1 72.9 74.1 74.2Days inventory 0.0 0.0 0.0 0.0 0.0Days payable 106.8 106.7 95.4 95.4 95.5Cash cycle -36.6 -32.5 -22.5 -21.3 -21.2Source: Company data, Nomura estimates
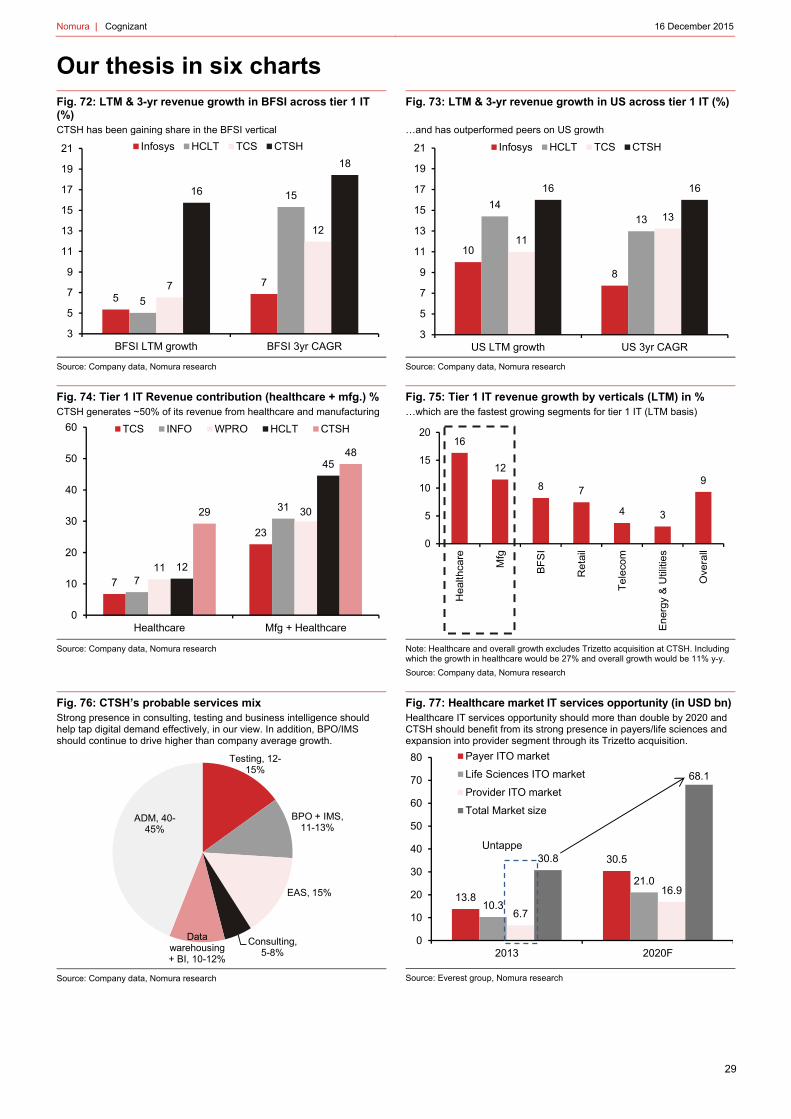
Nomura | Cognizant 16 December 2015
29
Our thesis in six charts Fig. 72: LTM & 3-yr revenue growth in BFSI across tier 1 IT (%) CTSH has been gaining share in the BFSI vertical
Source: Company data, Nomura research
Fig. 73: LTM & 3-yr revenue growth in US across tier 1 IT (%) …and has outperformed peers on US growth
Source: Company data, Nomura research
Fig. 74: Tier 1 IT Revenue contribution (healthcare + mfg.) % CTSH generates ~50% of its revenue from healthcare and manufacturing
Source: Company data, Nomura research
Fig. 75: Tier 1 IT revenue growth by verticals (LTM) in % …which are the fastest growing segments for tier 1 IT (LTM basis)
Note: Healthcare and overall growth excludes Trizetto acquisition at CTSH. Including which the growth in healthcare would be 27% and overall growth would be 11% y-y.
Source: Company data, Nomura research
Fig. 76: CTSH’s probable services mix Strong presence in consulting, testing and business intelligence should help tap digital demand effectively, in our view. In addition, BPO/IMS should continue to drive higher than company average growth.
Source: Company data, Nomura research
Fig. 77: Healthcare market IT services opportunity (in USD bn)Healthcare IT services opportunity should more than double by 2020 and CTSH should benefit from its strong presence in payers/life sciences and expansion into provider segment through its Trizetto acquisition.
Source: Everest group, Nomura research
5
7
5
15
7
12
16
18
3
5
7
9
11
13
15
17
19
21
BFSI LTM growth BFSI 3yr CAGR
Infosys HCLT TCS CTSH
10
8
1413
11
13
16 16
3
5
7
9
11
13
15
17
19
21
US LTM growth US 3yr CAGR
Infosys HCLT TCS CTSH
7
23
7
31
11
30
12
45
29
48
0
10
20
30
40
50
60
Healthcare Mfg + Healthcare
TCS INFO WPRO HCLT CTSH16
12
8 7
4 3
9
0
5
10
15
20
Health
care
Mfg
BF
SI
Reta
il
Tele
com
En
erg
y &
Util
ities
Ove
rall
Testing, 12-15%
BPO + IMS, 11-13%
EAS, 15%
Consulting, 5-8%
Data warehousing + BI, 10-12%
ADM, 40-45%
13.8
30.5
10.3
21.0
6.7
16.9
30.8
68.1
0
10
20
30
40
50
60
70
80
2013 2020F
Payer ITO market
Life Sciences ITO market
Provider ITO market
Total Market size
Untappe

Nomura | Cognizant 16 December 2015
30
Incorporate Chennai flood impact in FY15F, FY16/17F estimates largely unchanged
We incorporate the Chennai floods impact (~60bp q-q) given Cognizant employs ~60000 (~27% of its workforce) in Chennai and also incorporate cross currency impacts (~10bp), in addition to the moderation of macro demand indicators and uncertainty due to impending M&As in healthcare. This leads us to moderate our FY15F USD revenue growth to 20.9% (vs 21.1% earlier) and 4Q revenue growth to 1.1% q-q (vs 1.8% q-q earlier). Our revenue growth expectations for FY16/17F at 13.9/14.6% are largely unchanged.
Fig. 78: Estimate revisions
Source: Company, Nomura estimates
FY15F FY16F FY17F FY15F FY16F FY17F FY17F
Revenue (USDmn) 12,405 14,132 16,193 12,428 14,142 16,215 -0.2 -0.1 -0.1
EBIT margin (%) 17.4 18.1 18.0 17.5 18.2 18.2 -10bp -10bp -20bp
Tax Rate (%) 25.3 25.5 25.5 25.3 25.5 25.5 0bp 0bp 0bp
Diluted EPS (USD) 2.66 3.22 3.71 2.68 3.24 3.75 -0.9 -0.6 -1.2
FY15F FY16F
New Old Change (%)

Rating Remains BuyTarget Price Remains INR 1020
Closing price 11 December 2015 INR 841
Potential upside +21.3%
Anchor themesWe prefer companies that have a better skew towards growing segments and are available at reasonable valuations.
Nomura vs consensusOur TP is largely in line with consensus.
Research analysts
India Technology/Services & Software
Ashwin Mehta - NFASL [email protected] +91 22 4037 4465
Rishit Parikh - NSFSPL [email protected] +91 22 4037 4360
Key company data: See next page for company data and detailed price/index chart.
HCL Technologies HCLT.NS HCLT IN
EQUITY: SOFTWARE & SERVICES
Better business mix at play
Comfort around growth and discounted valuations vs. peers warrant Buy Action: Best-in-class skew towards fast-growing services; Buy We are positive on HCLT due to its: 1) superior positioning in infrastructure management systems (IMS) (~35% of revenue) and likely market share gains in upcoming deal rebids (worth ~USD150bn over 2016-18F); and 2) the largest presence in engineering services (~19% of revenue), which we believe over the medium term could follow the trend in IMS on large deals, increased interest in Europe and market share gains for Indian IT. HCLT’s strong deal flow builds comfort around revenue growth, and we estimate a USD revenue CAGR of ~12% over FY15-18F (including the Volvo IT purchase). We believe valuations are attractive at 13.4x FY17F P/E (EPS: INR62.6), at discounts of 18-24% vs. peers with similar growth (INFO/TCS). Better-than-peer group performance in 2HFY16F could be a trigger for the stock, in our view.
Catalysts: Revenue rebound in IMS and return to guided margin range. Positive on the 2H outlook and retained margin guidance We moderate 2Q USD revenue growth to 1.3% q-q (vs 2.6% q-q earlier) on impacts from Chennai floods (~90bps q-q) and cross currency (~40bp q-q). However, we expect growth to recover in 2H16F given: 1) signings of deals worth USD1bn+ and an unexecuted order book 10% higher than the historical high level; 2) management’s positive outlook on IMS as it is better positioned to benefit from deal rebids worth ~USD150bn over 2016-18F; and 3) flow-through of revenue from 10 large deals that are currently in the transition phase. We expect EBIT margins to sustain at ~21% (in line with guidance) in FY16F as the company leverages investments in delivery centres and increases offshoring of work related to rebadged employees. Incorporate Volvo IT acquisition, TP of INR1020 (unchanged) We build 9/16/12% CAGRs over FY15-18 in Apps/IMS/BPO, with applications revenue aided by the Volvo IT acquisition. Dilutive impact of this acquisition will counter USD-INR assumptions of 66 (64.5 earlier) keeping our EPS estimates unchanged. TP on 16x 1 yr fwd EPS of INR64 up to Sep-17F.
Year-end 30 Jun FY15 FY16F FY17F FY18F
Currency (INR) Actual Old New Old New Old New
Revenue (mn) 370,620 418,874 426,093 469,543 487,991 527,185 546,362
Reported net profit (mn) 72,551 76,458 76,296 87,912 87,994 98,012 98,503
Normalised net profit (mn) 72,551 77,428 77,266 87,912 87,994 98,012 98,503
FD normalised EPS 51.41 54.87 54.75 62.21 62.27 69.35 69.70
FD norm. EPS growth (%) 14.1 6.7 6.5 13.4 13.7 11.5 11.9
FD normalised P/E (x) 16.3 N/A 15.4 N/A 13.5 N/A 12.1
EV/EBITDA (x) 12.3 N/A 11.1 N/A 9.4 N/A 8.3
Price/book (x) 4.8 N/A 4.1 N/A 3.5 N/A 3.0
Dividend yield (%) 1.9 N/A 2.6 N/A 2.7 N/A 3.3
ROE (%) 32.4 28.4 28.4 27.8 27.8 26.6 26.7
Net debt/equity (%) net cash net cash net cash net cash net cash net cash net cash
Source: Company data, Nomura estimates
Global Markets Research 16 December 2015
See Appendix A-1 for analyst certification, important disclosures and the status of non-US analysts.

Nomura | HCL Technologies 16 December 2015
32
Key data on HCL Technologies Relative performance chart
Source: Thomson Reuters, Nomura research
Notes:
Performance (%) 1M 3M 12MAbsolute (INR) -1.4 -8.7 8.3 M cap (USDmn) 17,712.7Absolute (USD) -2.3 -9.1 1.1 Free float (%) 25.0Rel to MSCI India -0.4 -6.9 18.4 3-mth ADT (USDmn) 23.3 Income statement (INRmn) Year-end 30 Jun FY14 FY15 FY16F FY17F FY18FRevenue 329,180 370,620 426,093 487,991 546,362Cost of goods sold -208,767 -242,029 -281,584 -323,843 -365,900Gross profit 120,413 128,591 144,509 164,149 180,462SG&A -41,083 -46,081 -54,200 -61,296 -67,201Employee share expense
Operating profit 79,330 82,510 90,309 102,852 113,261EBITDA 86,660 87,020 95,886 109,196 119,817Depreciation -7,330 -4,510 -5,577 -6,344 -6,556Amortisation
EBIT 79,330 82,510 90,309 102,852 113,261Net interest expense 0 0 -175 0 0Associates & JCEs
Other income -160 9,120 8,723 9,960 13,026Earnings before tax 79,170 91,630 98,857 112,812 126,287Income tax -15,480 -19,080 -21,591 -24,819 -27,783Net profit after tax 63,690 72,550 77,266 87,994 98,503Minority interests 0 1 0 Other items 0 0 0 Preferred dividends
Normalised NPAT 63,690 72,551 77,266 87,994 98,503Extraordinary items 0 0 -970 0 0Reported NPAT 63,690 72,551 76,296 87,994 98,503Dividends -17,995 -26,835 -37,123 -38,818 -47,265Transfer to reserves 45,695 45,715 39,173 49,176 51,239Valuations and ratios
Reported P/E (x) 18.4 16.3 15.5 13.4 12.0Normalised P/E (x) 18.4 16.3 15.3 13.4 12.0FD normalised P/E (x) 18.7 16.3 15.4 13.5 12.1Dividend yield (%) 1.3 1.9 2.6 2.7 3.3Price/cashflow (x) 17.3 24.1 22.4 15.5 14.1Price/book (x) 5.8 4.8 4.1 3.5 3.0EV/EBITDA (x) 12.6 12.3 11.1 9.4 8.3EV/EBIT (x) 13.8 13.0 11.8 10.0 8.8Gross margin (%) 36.6 34.7 33.9 33.6 33.0EBITDA margin (%) 26.3 23.5 22.5 22.4 21.9EBIT margin (%) 24.1 22.3 21.2 21.1 20.7Net margin (%) 19.3 19.6 17.9 18.0 18.0Effective tax rate (%) 19.6 20.8 21.8 22.0 22.0Dividend payout (%) 28.3 37.0 48.7 44.1 48.0ROE (%) 37.1 32.4 28.4 27.8 26.7ROA (pretax %) 41.1 37.2 34.7 34.6 34.4Growth (%)
Revenue 27.7 12.6 15.0 14.5 12.0EBITDA 50.6 0.4 10.2 13.9 9.7Normalised EPS 57.7 13.4 6.4 13.8 11.9Normalised FDEPS 58.1 14.1 6.5 13.7 11.9Source: Company data, Nomura estimates
Cashflow statement (INRmn) Year-end 30 Jun FY14 FY15 FY16F FY17F FY18FEBITDA 86,660 87,020 95,886 109,196 119,817Change in working capital -1,483 -11,583 -17,837 -3,686 -2,920Other operating cashflow -16,556 -26,275 -25,114 -28,758 -32,354Cashflow from operations 68,621 49,163 52,935 76,752 84,544Capital expenditure -11,512 -11,245 -17,703 -14,520 -14,520Free cashflow 57,109 37,918 35,232 62,232 70,024Reduction in investments 419 76 -23 0 0Net acquisitions -1,910 -548 -5,804 0 0Dec in other LT assets 0 0 0 0 0Inc in other LT liabilities 0 0 0 0 0Adjustments CF after investing acts 55,618 37,446 29,405 62,232 70,024Cash dividends -17,995 -26,835 -37,123 -38,818 -47,265Equity issue 12,174 981 3,937 1,694 3,380Debt issue 549 -2,819 -4,690 0 0Convertible debt issue Others -160 9,120 7,578 9,960 13,026CF from financial acts -5,432 -19,554 -30,298 -27,164 -30,858Net cashflow 50,186 17,892 -893 35,069 39,165Beginning cash 49,812 99,998 117,890 116,997 152,065Ending cash 99,998 117,890 116,997 152,065 191,231Ending net debt -92,489 -113,200 -116,997 -152,065 -191,231 Balance sheet (INRmn) As at 30 Jun FY14 FY15 FY16F FY17F FY18FCash & equivalents 99,998 117,890 116,997 152,065 191,231Marketable securities Accounts receivable 77,083 94,860 109,302 125,181 140,154Inventories 0 0 0 0 0Other current assets 21,245 23,380 29,882 33,325 37,321Total current assets 198,326 236,130 256,181 310,571 368,706LT investments 156 80 103 103 103Fixed assets 31,465 38,200 50,326 58,503 66,466Goodwill 51,492 52,040 57,844 57,844 57,844Other intangible assets Other LT assets 23,465 30,660 34,182 38,122 42,692Total assets 304,904 357,110 398,636 465,142 535,811Short-term debt Accounts payable 81,966 92,320 90,925 104,592 118,356Other current liabilities 14,615 12,590 17,091 19,061 21,346Total current liabilities 96,581 104,910 108,017 123,653 139,702Long-term debt 7,509 4,690 0 0 0Convertible debt Other LT liabilities 0 0 0Total liabilities 104,090 109,600 108,017 123,653 139,702Minority interest 0 0 0 0 0Preferred stock 0 0 0 0 0Common stock Retained earnings 200,814 247,510 290,620 341,489 396,109Proposed dividends Other equity and reserves Total shareholders' equity 200,814 247,510 290,620 341,489 396,109Total equity & liabilities 304,904 357,110 398,636 465,142 535,811
Liquidity (x)Current ratio 2.05 2.25 2.37 2.51 2.64Interest cover na na 517.2 na naLeverageNet debt/EBITDA (x) net cash net cash net cash net cash net cashNet debt/equity (%) net cash net cash net cash net cash net cash
Per shareReported EPS (INR) 45.61 51.70 54.31 62.57 70.03Norm EPS (INR) 45.61 51.70 55.00 62.57 70.03FD norm EPS (INR) 45.06 51.41 54.75 62.27 69.70BVPS (INR) 143.81 176.39 206.88 242.81 281.60DPS (INR) 11.01 16.01 22.02 23.00 28.00Activity (days)Days receivable 77.0 84.7 87.7 87.7 88.6Days inventory 0.0 0.0 0.0 0.0 0.0Days payable 128.8 131.4 119.1 110.2 111.2Cash cycle -51.9 -46.8 -31.4 -22.5 -22.6Source: Company data, Nomura estimates

Nomura | HCL Technologies 16 December 2015
33
Our thesis in six charts Fig. 79: HCLT generates ~55% of its revenue from IMS/engg services, segments which are growing faster for Indian IT…Revenue breakdown (in %)
Source: Company data, Nomura estimates
Fig. 80: …where HCLT is strongly positioned, as witnessed in the growth over the past three years 3-year CAGR for IMS and engineering services
Source: Company data, Nomura research
Fig. 81: While the IMS segment has been recording ~21% CAGR over the past 5 years for tier 1 IT… Revenue from IMS for Indian IT
Source: Company data, Nomura research
Fig. 82: …penetration levels still remain low and present further growth possibilities IMS penetration for Indian IT is sub 5% vs ~40% in ADM
Source: NASSCOM, Nomura estimates
Fig. 83: E&RD revenue (USD mn) across Indian IT HCLT is the largest Indian provider and the third-largest globally in engineering services and R&D
Source: Company data, Nomura research
Fig. 84: …the addressable market for E&RD outsourcing is ~6x of the current outsourced service providers’ revenues India captures only ~25% of this outsourced market of USD36bn
Note: SP - Service provider, TAM – Total addressable market
Source: Zinnov, NASSCOM, Nomura estimates
EAS14%
Custom application
26%
Engg and R&D19%
IMS35%
BPO5%
13 13
10 8
2
26 26
21
17
13
HCLT TCS Overall INFO WPRO
Engg Services IMS
2.6 3.4
4.1
5.1
6.1
7.2
0
1
2
3
4
5
6
7
8
LTM -5 LTM -4 LTM -3 LTM -2 LTM -1 LTM
21% CAGR
2.4%
2.9%
3.3%3.6%
4.0%
4.6%
1.0%
1.5%
2.0%
2.5%
3.0%
3.5%
4.0%
4.5%
5.0%
FY10 FY11 FY12 FY13 FY14 FY15
HCLT TCS Wipro Infosys Overall
LTM revenue (USD mn) 1,139 721 545 309 2,714
LTM revenue contribution (% 19 5 8 3 7
LTM grow th y-y (%) 25 7 11 8 15
3 year CAGR (%) 13 13 2 8 10
USD614bn,
Global 500 E & RD spend
USD216bn,
Outsource TAM
USD 36bn,Currently
outsourced SP revenues
USD 9bn,India SP revenues

Nomura | HCL Technologies 16 December 2015
34
Incorporate Volvo IT acquisition, EPS estimates unchanged
We incorporate impacts of Chennai floods (~90bp q-q) and cross currency (~40bp q-q) leading to moderation of our 2QFY16F revenue growth expectations to 1.3% q-q (vs 2.6% q-q). We also incorporate the revenues from Volvo IT acquisitions (effective Apr-16, annual revenue run rate of USD190mn and assumption of mid- single digit EBITDA margins). We build USD revenue growth of 8.6/14.4% overall (7.8/12.2% organic) over FY16/17F. The dilutive impact of Volvo IT on margins will likely be countered by better USD-INR assumptions of 66 (vs 64.5 earlier) leading to EPS estimates largely remaining unchanged. We expect EBIT margins to stay in the 21% range (in line with guidance) over FY15-18F.
Fig. 85: Estimate revisions
Source: Nomura estimates
FY16F FY17F FY18F FY16F FY17F FY18F FY16F FY17F FY18F
Revenue (USDmn) 6,466 7,394 8,278 6,473 7,280 8,173 -0.1 1.6 1.3
USD/INR rate 62.3 65.9 66.0 62.3 64.7 64.5 0.0 1.8 2.3
Revenue (INRbn) 370.6 426.1 488.0 370.6 418.9 469.5 0.0 1.7 3.9
EBITDA margin (%) 22.5 22.4 21.9 22.7 22.9 22.3 -20 bps -50 bps -40 bps
Tax Rate (%) 21.8 22.0 22.0 21.8 22.0 22.0 0 bps 0 bps 0 bps
Diluted EPS (INR) 54.8 62.3 69.7 54.9 62.2 69.4 -0.2 0.1 0.5
New old Change (%)

Rating Remains BuyTarget Price Remains INR 1225
Closing price 11 December 2015 INR 1053
Potential upside +16.4%
Anchor themesWe prefer companies that have a better skew towards growing segments and are available at reasonable valuations.
Nomura vs consensusOur TP is in line with consensus.
Research analysts
India Technology/Services & Software
Ashwin Mehta - NFASL [email protected] +91 22 4037 4465
Rishit Parikh - NSFSPL [email protected] +91 22 4037 4360
Key company data: See next page for company data and detailed price/index chart.
Infosys INFY.NS INFO IN
EQUITY: SOFTWARE & SERVICES
Turnaround initiatives showing progress
Positive on better traction in larger segments, improved client connect & investment focus
Action: Directionally on the right path, Buy While higher street expectations on FY17F revenue growth and margins could be a near-term depressant, we believe INFO is on the right path in terms of turnaround, with 1) improving client connect (top-10 clients grew over 5% q-q in the past two quarters) and deal signings (~USD 1bn in 2Q), 2) better traction in larger segments like ADM (now growing at par with TCS) / Consulting & SI (growing materially better than TCS) and US (growing better than TCS), 3) better control on operations, and 4) focus on investing for the future and creating differentiation by targeting non-CIO IT spends. We expect a USD revenue CAGR of 12% over FY16-18F, better than TCS, which we think will likely lead to valuations equalizing between them. Retain Buy.
Catalyst: Better-than-guided performance
Soft 2H, but still likely to outperform TCS over FY16/17F While the company guided for a slower 2H on account of higher furloughs, ongoing weakness in energy and seasonality in retail, growth in 3Q will further get impacted by the Chennai floods (30bps q-q) and cross currency (30bp q-q) leading us to moderate our forecast of USD revenue growth to 8.5% (from 8.9% earlier and vs 7.8% y-y for TCS) for FY16F. We slightly moderate our FY17F USD revenue estimates to 11.2% (vs 11.8% previously and 10.7% y-y at TCS) in the backdrop of weaker exit rates in 4Q and softness in macro indicators (Client financials, US PMI). Our earnings estimates remain largely unchanged as lower growth is offset by INR depreciation (reset USD/INR assumptions to 66.0 from 64.5).
Retain Buy, TP unchanged at INR1225 We look for stable EBIT margins at ~25% levels over FY15-18F and an EPS CAGR of ~12% over FY16-18F. Our TP of INR1,225 is based on an unchanged multiple of 18x 1-year forward EPS of 68.2 (up to Sep-17F).
Year-end 15 Mar FY15 FY16F FY17F FY18F
Currency (INR) Actual Old New Old New Old New
Revenue (mn) 533,190 611,780 617,167 683,786 693,232 767,746 778,698
Reported net profit (mn) 123,300 130,686 131,377 146,789 147,448 164,598 164,719
Normalised net profit (mn) 123,300 130,686 131,377 146,789 147,448 164,598 164,719
FD normalised EPS 53.95 57.18 57.48 64.22 64.51 72.01 72.06
FD norm. EPS growth (%) 15.8 6.0 6.5 12.3 12.2 12.1 11.7
FD normalised P/E (x) 19.5 N/A 18.3 N/A 16.3 N/A 14.6
EV/EBITDA (x) 14.0 N/A 12.1 N/A 10.5 N/A 9.1
Price/book (x) 4.4 N/A 4.0 N/A 3.6 N/A 3.2
Dividend yield (%) 2.1 N/A 2.3 N/A 2.4 N/A 2.8
ROE (%) 24.1 22.9 23.0 23.2 23.3 23.0 23.0
Net debt/equity (%) net cash net cash net cash net cash net cash net cash net cash
Source: Company data, Nomura estimates
Global Markets Research 16 December 2015
See Appendix A-1 for analyst certification, important disclosures and the status of non-US analysts.

Nomura | Infosys 16 December 2015
36
Key data on Infosys Relative performance chart
Source: Thomson Reuters, Nomura research
Notes:
Performance (%) 1M 3M 12MAbsolute (INR) -4.9 -3.5 9.6 M cap (USDmn) 36,014.4Absolute (USD) -5.8 -3.9 2.3 Free float (%) 84.0Rel to MSCI India -4.0 -1.7 19.7 3-mth ADT (USDmn) 66.0 Income statement (INRmn) Year-end 15 Mar FY14 FY15 FY16F FY17F FY18FRevenue 501,330 533,190 617,167 693,232 778,698Cost of goods sold -320,036 -327,761 -385,626 -433,858 -489,125Gross profit 181,294 205,429 231,541 259,374 289,573SG&A -60,884 -67,109 -78,080 -86,099 -95,780Employee share expense
Operating profit 120,410 138,320 153,460 173,275 193,793EBITDA 134,150 149,010 167,468 188,526 209,367Depreciation -13,740 -10,690 -14,007 -15,251 -15,574Amortisation
EBIT 120,410 138,320 153,460 173,275 193,793Net interest expense
Associates & JCEs
Other income 26,690 34,270 30,939 34,398 38,206Earnings before tax 147,100 172,590 184,399 207,673 231,999Income tax -40,620 -49,290 -53,022 -60,225 -67,280Net profit after tax 106,480 123,300 131,377 147,448 164,719Minority interests 0 0 0 0 0Other items
Preferred dividends
Normalised NPAT 106,480 123,300 131,377 147,448 164,719Extraordinary items 0 0 0 0 0Reported NPAT 106,480 123,300 131,377 147,448 164,719Dividends -42,116 -60,511 -65,140 -68,568 -79,539Transfer to reserves 64,364 62,789 66,237 78,879 85,180Valuations and ratios
Reported P/E (x) 22.6 19.5 18.3 16.3 14.6Normalised P/E (x) 22.6 19.5 18.3 16.3 14.6FD normalised P/E (x) 22.6 19.5 18.3 16.3 14.6Dividend yield (%) 1.5 2.1 2.3 2.4 2.8Price/cashflow (x) 25.4 31.9 17.5 20.2 18.1Price/book (x) 5.1 4.4 4.0 3.6 3.2EV/EBITDA (x) 15.7 14.0 12.1 10.5 9.1EV/EBIT (x) 17.5 15.0 13.2 11.4 9.9Gross margin (%) 36.2 38.5 37.5 37.4 37.2EBITDA margin (%) 26.8 27.9 27.1 27.2 26.9EBIT margin (%) 24.0 25.9 24.9 25.0 24.9Net margin (%) 21.2 23.1 21.3 21.3 21.2Effective tax rate (%) 27.6 28.6 28.8 29.0 29.0Dividend payout (%) 39.6 49.1 49.6 46.5 48.3ROE (%) 24.4 24.1 23.0 23.3 23.0ROA (pretax %) 49.1 45.8 44.4 46.3 46.8Growth (%)
Revenue 24.2 6.4 15.7 12.3 12.3EBITDA 16.1 11.1 12.4 12.6 11.1Normalised EPS 13.0 15.8 6.6 12.2 11.7Normalised FDEPS 13.0 15.8 6.5 12.2 11.7Source: Company data, Nomura estimates
Cashflow statement (INRmn) Year-end 15 Mar FY14 FY15 FY16F FY17F FY18FEBITDA 134,150 149,010 167,468 188,526 209,367Change in working capital 3,420 -26,520 21,533 -9,012 -8,962Other operating cashflow -42,700 -47,140 -51,592 -60,225 -67,280Cashflow from operations 94,870 75,350 137,409 119,289 133,126Capital expenditure -29,480 -35,370 -34,880 -28,000 -28,000Free cashflow 65,390 39,980 102,529 91,289 105,126Reduction in investments 0 0 0 0 0Net acquisitions Dec in other LT assets 0Inc in other LT liabilities 0 0 0 0 0Adjustments 0 0 0 0CF after investing acts 65,390 39,980 102,529 91,289 105,126Cash dividends -42,116 -60,511 -65,140 -68,568 -79,539Equity issue 12,966 9,541 -19,623 0 0Debt issue Convertible debt issue Others 26,690 34,270 30,939 34,398 38,206CF from financial acts -2,460 -16,700 -53,824 -34,170 -41,333Net cashflow 62,930 23,280 48,705 57,119 63,792Beginning cash 239,650 302,580 325,860 374,565 431,684Ending cash 302,580 325,860 374,565 431,684 495,476Ending net debt -302,580 -325,860 -374,565 -431,684 -495,476 Balance sheet (INRmn) As at 15 Mar FY14 FY15 FY16F FY17F FY18FCash & equivalents 302,580 325,860 374,565 431,684 495,476Marketable securities Accounts receivable 111,620 125,580 149,317 167,721 188,398Inventories 0 0 0 0 0Other current assets 45,930 78,170 54,135 61,321 69,081Total current assets 460,130 529,610 578,018 660,726 752,956LT investments 0 0 0 0 0Fixed assets 103,860 128,540 149,413 162,162 174,588Goodwill Other intangible assets Other LT assets 5,920 3,770 2,340 2,340 2,340Total assets 569,910 661,920 729,771 825,228 929,883Short-term debt Accounts payable 43,370 51,550 61,603 69,138 77,991Other current liabilities 51,240 62,740 73,923 82,965 93,589Total current liabilities 94,610 114,290 135,526 152,103 171,579Long-term debt Convertible debt Other LT liabilities 0 0 0 0 0Total liabilities 94,610 114,290 135,526 152,103 171,579Minority interest 0 0 0 0 0Preferred stock 0 0 0 0 0Common stock 2,860 5,720 2,860 2,860 2,860Retained earnings 472,440 541,910 591,385 670,264 755,444Proposed dividends Other equity and reserves Total shareholders' equity 475,300 547,630 594,245 673,124 758,304Total equity & liabilities 569,910 661,920 729,771 825,228 929,883
Liquidity (x)Current ratio 4.86 4.63 4.27 4.34 4.39Interest cover na na na na naLeverageNet debt/EBITDA (x) net cash net cash net cash net cash net cashNet debt/equity (%) net cash net cash net cash net cash net cash
Per shareReported EPS (INR) 46.59 53.95 57.48 64.51 72.07Norm EPS (INR) 46.59 53.95 57.48 64.51 72.07FD norm EPS (INR) 46.59 53.95 57.48 64.51 72.06BVPS (INR) 207.95 239.60 259.99 294.50 331.77DPS (INR) 15.75 22.25 23.75 25.00 29.00Activity (days)Days receivable 75.3 81.2 81.5 83.5 83.5Days inventory 0.0 0.0 0.0 0.0 0.0Days payable 42.6 52.9 53.7 55.0 54.9Cash cycle 32.6 28.3 27.8 28.5 28.6Source: Company data, Nomura estimates

Nomura | Infosys 16 December 2015
37
Our thesis in six charts Fig. 86: CSI USD revenue growth (y-y) After three year of underperformance, INFO now growing materially ahead of TCS in consulting and system integration (1/3rd of INFO revenues)
Source: Company, Nomura research
Fig. 87: North America USD revenue growth (y-y) Similarly, in North America (63% of INFO revenues) after consistently underperforming TCS, INFO is now starting to turn the corner
Source: Company, Nomura research
Fig. 88: Top-10 clients revenue growth Client mining is showing improved traction with top-10 clients growing 5%+q-q in the last 2 quarters.
Source: Company, Nomura research
Fig. 89: Deal wins trend (USD mn) While increased sales focus is reflecting in deal wins showing a significant improvement with ~USD1bn signed in 2Q, a historical high for Infosys
Source: Company, Nomura research
Fig. 90: Utilization levels (excl. trainees) in 2QFY16 Lower than peer group utilization levels and focus on automation could help in keeping EBIT margins stable in the 25% range
Source: Company, Nomura research
Fig. 91: Pricing trends (base 100) … and counter material pricing pressure due to commoditization and increased aggression in legacy segments like ADM
Source: Company, Nomura research
10%
-2%
-10%
0%
10%
20%
30%
3QF
Y14
4QF
Y14
1QF
Y15
2QF
Y15
3QF
Y15
4QF
Y15
1QF
Y16
2QF
Y16
Infosys TCS
13%
9%
0%
2%
4%
6%
8%
10%
12%
14%
16%
18%
20%
3QF
Y13
4QF
Y13
1QF
Y14
2QF
Y14
3QF
Y14
4QF
Y14
1QF
Y15
2QF
Y15
3QF
Y15
4QF
Y15
1QF
Y16
2QF
Y16
TCS Infosys
-2.5%
-0.8%-0.2%
3.2%
-1.4% -1.4%
5.9%5.1%
-3%
0%
3%
6%
9%
3QF
Y14
4QF
Y14
1QF
Y15
2QF
Y15
3QF
Y15
4QF
Y15
1QF
Y16
2QF
Y16
550450
500
700 700600
213
414
688
983
1QF
Y14
2QF
Y14
3QF
Y14
4QF
Y14
1QF
Y15
2QF
Y15
3QF
Y15
4QF
Y15
1QF
Y16
2QF
Y16
81%
82%
85%
86%
Infosys Wipro HCL TCS
Utilization Levels (2QFY16)
100 99
9797
100100
98
96
93
96
90
92
94
96
98
100
102
2QFY15 3QFY15 4QFY15 1QFY16 2QFY16
Onsite Offshore

Nomura | Infosys 16 December 2015
38
Change of estimates
We believe that the USD revenue growth in 3QFY16F will be impacted by Chennai floods (~30bp q-q) and cross currency (~30bp q-q), in addition to the muted guidance of flat to -2.3% q-q growth for 3Q/4Q. This leads us to moderate our FY16F USD revenue growth to 8.5% (vs 8.9% earlier). Overall, we expect a USD revenue growth of 8.5%/11.2%/12.3% (versus 8.9%/11.8%/12.4% earlier), a slight moderation due to weaker exit rates in 4QFY16F. Despite USD-INR assumption reset to 66 (vs 64.5 earlier) our EPS estimates are largely unchanged due to slight growth and other income moderation.
Fig. 92: Changes of estimates
New Old Change (%)
FY16F FY17F FY18F FY16F FY17F FY18F FY16F FY17F FY18F
Revenue (USDmn) 9,448 10,504 11,798 9,483 10,601 11,903 -0.4 -0.9 -0.9
Revenue (INRbn) 617.2 693.2 778.7 611.8 683.8 767.7 0.9 1.4 1.4
EBITDA margin (%) 27.1 27.2 26.9 27.3 27.3 27.0 -20 bps -10 bps -10 bps
Tax Rate (%) 28.8 29.0 29.0 28.8 29.0 29.0 0 bps 0 bps 0 bps
Diluted EPS (INR) 57.5 64.5 72.1 57.2 64.2 72.0 0.5 0.4 0.1
Source: Nomura estimates

Rating Remains NeutralTarget Price Remains INR 2500
Closing price 11 December 2015 INR 2386
Potential upside +4.8%
Anchor themesWe prefer companies that have a better skew towards growing segments and are available at reasonable valuations.
Nomura vs consensusOur TP is 10% lower than consensus on caution on multiples in light of tapering growth.
Research analysts
India Technology/Services & Software
Ashwin Mehta - NFASL [email protected] +91 22 4037 4465
Rishit Parikh - NSFSPL [email protected] +91 22 4037 4360
Key company data: See next page for company data and detailed price/index chart.
Tata Consultancy Services
TCS.NS TCS IN
EQUITY: SOFTWARE & SERVICES
Larger segments see growth moderation
Growth likely to underperform INFO over FY16/17F after five years of outperformance
Action: Valuation premiums could equalize; stay Neutral Slowing growth in developed markets (US/Europe), weaker traction in large segments like ADM/Enterprise solutions/BFSI and higher-than-peer margins in a scenario where commoditization pressures are increasing keep us cautious on TCS. Also we note 1) Weak exit USD revenue growth of sub-10% y-y in 4QFY16F, and 2) our cautious stance on demand in light of weakening macro indicators (Client financials, US PMI), will likely lead to TCS underperforming INFO on revenue growth in FY16/17F (after five years of outperformance). In such a scenario, we believe the valuation premium vs INFO is unlikely to sustain. We look for USD revenue growth of 7.8/10.7% y-y in FY16/17F (vs 8.5/11.2% at INFO). We maintain our Neutral stance, with a TP of INR2500. HCL Technologies (HCLT IN), Cognizant (CTSH US) followed by Infosys (INFO IN) are our top Buy rated stocks.
Catalyst: Faster-than-anticipated growth
Slower momentum in key segments, growth to be lower than INFO TCS is seeing slower momentum in key segments, with 1) INFO growing better in US/BFSI and equalising on growth in Europe, 2) Enterprise solutions revenue growth is declining after outperformance over the last three years and gaps with INFO increasing to double digit percentages, and 3) While IMS growth is still healthy, it has seen moderation lately.
Maintain Neutral with TP of INR2,500 Our target price of INR 2,500 is based on a target multiple of 18x (in line with Infosys) 1-year forward EPS of INR139.1 up to Sep-17. TCS currently trades at a premium of ~7% to Infosys, on our estimates, which we think is unwarranted and over time valuations should equalise. Risks include INR appreciation, any negative news flow on US immigration and slower-than-anticipated growth or margin dilution.
Year-end 31 Mar FY15 FY16F FY17F FY18F
Currency (INR) Actual Old New Old New Old New
Revenue (mn) 946,484 1,087,997 1,087,997 1,217,087 1,217,087 1,356,561 1,356,561
Reported net profit (mn) 196,484 240,915 240,915 264,742 264,742 288,941 288,941
Normalised net profit (mn)
216,961 240,915 240,915 264,742 264,742 288,941 288,941
FD normalised EPS 110.85 123.09 123.09 135.26 135.26 147.63 147.63
FD norm. EPS growth (%) 13.5 11.0 11.0 9.9 9.9 9.1 9.1
FD normalised P/E (x) 21.5 N/A 19.4 N/A 17.6 N/A 16.2
EV/EBITDA (x) 16.2 N/A 14.0 N/A 12.4 N/A 11.1
Price/book (x) 8.1 N/A 6.8 N/A 5.5 N/A 4.5
Dividend yield (%) 3.3 N/A 1.7 N/A 1.8 N/A 1.9
ROE (%) 34.8 38.2 38.2 34.4 34.4 30.6 30.6
Net debt/equity (%) net cash net cash net cash net cash net cash net cash net cash
Source: Company data, Nomura estimates
Global Markets Research 16 December 2015
See Appendix A-1 for analyst certification, important disclosures and the status of non-US analysts.

Nomura | Tata Consultancy Services 16 December 2015
40
Key data on Tata Consultancy Services Relative performance chart
Source: Thomson Reuters, Nomura research
Notes:
Performance (%) 1M 3M 12MAbsolute (INR) -3.4 -6.5 -4.3 M cap (USDmn) 69,947.2Absolute (USD) -4.3 -6.9 -10.7 Free float (%) 23.0Rel to MSCI India -2.4 -4.8 5.8 3-mth ADT (USDmn) 86.7 Income statement (INRmn) Year-end 31 Mar FY14 FY15 FY16F FY17F FY18FRevenue 818,094 946,4841,087,997 1,217,0871,356,561Cost of goods sold -433,984 -529,393 -607,755 -687,361 -778,506Gross profit 384,110 417,091 480,243 529,726 578,055SG&A -146,031 -162,848 -186,338 -206,785 -229,961Employee share expense
Operating profit 238,079 254,243 293,905 322,942 348,094EBITDA 251,322 272,941 312,638 343,677 371,219Depreciation -13,243 -18,698 -18,734 -20,735 -23,125Amortisation
EBIT 238,079 254,243 293,905 322,942 348,094Net interest expense
Associates & JCEs
Other income 15,891 31,396 24,773 27,390 34,078Earnings before tax 253,970 285,639 318,678 350,332 382,172Income tax -60,712 -66,564 -75,993 -84,080 -91,721Net profit after tax 193,258 219,075 242,685 266,252 290,451Minority interests -2,089 -2,114 -1,771 -1,510 -1,510Other items 0 0 0 0 0Preferred dividends
Normalised NPAT 191,169 216,961 240,915 264,742 288,941Extraordinary items 0 -20,477 0 0 0Reported NPAT 191,169 196,484 240,915 264,742 288,941Dividends -73,275 -182,898 -94,251 -99,015 -106,087Transfer to reserves 117,893 13,586 146,663 165,728 182,853Valuations and ratios
Reported P/E (x) 24.4 23.8 19.4 17.6 16.2Normalised P/E (x) 24.4 21.5 19.4 17.6 16.2FD normalised P/E (x) 24.4 21.5 19.4 17.6 16.2Dividend yield (%) 1.3 3.3 1.7 1.8 1.9Price/cashflow (x) 29.1 21.7 24.3 19.4 18.3Price/book (x) 8.4 8.1 6.8 5.5 4.5EV/EBITDA (x) 17.6 16.2 14.0 12.4 11.1EV/EBIT (x) 18.6 17.4 14.9 13.2 11.8Gross margin (%) 47.0 44.1 44.1 43.5 42.6EBITDA margin (%) 30.7 28.8 28.7 28.2 27.4EBIT margin (%) 29.1 26.9 27.0 26.5 25.7Net margin (%) 23.4 20.8 22.1 21.8 21.3Effective tax rate (%) 23.9 23.3 23.8 24.0 24.0Dividend payout (%) 38.3 93.1 39.1 37.4 36.7ROE (%) 39.7 34.8 38.2 34.4 30.6ROA (pretax %) 59.8 54.2 56.7 56.2 54.2Growth (%)
Revenue 29.9 15.7 15.0 11.9 11.5EBITDA 39.0 8.6 14.5 9.9 8.0Normalised EPS 37.1 13.5 11.0 9.9 9.1Normalised FDEPS 37.1 13.5 11.0 9.9 9.1Source: Company data, Nomura estimates
Cashflow statement (INRmn) Year-end 31 Mar FY14 FY15 FY16F FY17F FY18FEBITDA 251,322 272,941 312,638 343,677 371,219Change in working capital -28,115 10,822 -42,758 -17,186 -23,356Other operating cashflow -62,801 -68,678 -77,763 -85,590 -93,231Cashflow from operations 160,406 215,085 192,117 240,902 254,632Capital expenditure -34,373 -30,200 -25,261 -32,570 -34,570Free cashflow 126,033 184,885 166,855 208,332 220,062Reduction in investments 0 0 0 0 0Net acquisitions Dec in other LT assets -12,327 -15,746 -8,851 -18,151 -20,028Inc in other LT liabilities 0 0 0 0 0Adjustments -7,076 1,691 -746 0 0CF after investing acts 106,630 170,830 157,258 190,181 200,034Cash dividends -73,275 -182,898 -94,251 -99,015 -106,087Equity issue 25,243 -10,417 -41,887 0 0Debt issue 3,028 802 2,257 1,582 1,945Convertible debt issue 0 0 0 0 0Others 15,891 31,396 24,773 27,390 34,078CF from financial acts -29,113 -161,117 -109,109 -70,043 -70,065Net cashflow 77,517 9,713 48,149 120,138 129,969Beginning cash 168,063 245,580 255,292 303,442 423,580Ending cash 245,580 255,292 303,442 423,580 553,548Ending net debt -245,580 -255,292 -303,442 -423,580 -553,548 Balance sheet (INRmn) As at 31 Mar FY14 FY15 FY16F FY17F FY18FCash & equivalents 245,580 255,292 303,442 423,580 553,548Marketable securities Accounts receivable 222,360 242,670 277,733 309,019 347,486Inventories 0 0 0 0 0Other current assets 16,907 21,739 18,827 20,948 23,555Total current assets 484,846 519,701 600,001 753,547 924,590LT investments 0 0 0 0 0Fixed assets 103,644 115,716 122,813 134,648 146,093Goodwill 41,568 39,308 39,484 39,484 39,484Other intangible assets 0 0 0 0 0Other LT assets 59,067 74,813 83,664 101,815 121,843Total assets 689,125 749,537 845,9621,029,4931,232,009Short-term debt Accounts payable 110,752 146,716 136,108 152,330 170,048Other current liabilities Total current liabilities 110,752 146,716 136,108 152,330 170,048Long-term debt Convertible debt Other LT liabilities 18,117 18,919 21,175 22,757 24,701Total liabilities 128,869 165,634 157,283 175,087 194,750Minority interest 6,905 9,136 2,723 2,723 2,723Preferred stock 0 0 0 0 0Common stock 1,959 1,959 1,957 1,957 1,957Retained earnings 551,393 572,808 683,999 849,7261,032,580Proposed dividends Other equity and reserves Total shareholders' equity 553,352 574,767 685,956 851,6831,034,537Total equity & liabilities 689,125 749,537 845,9621,029,4931,232,009
Liquidity (x)Current ratio 4.38 3.54 4.41 4.95 5.44Interest cover na na na na naLeverageNet debt/EBITDA (x) net cash net cash net cash net cash net cashNet debt/equity (%) net cash net cash net cash net cash net cash
Per shareReported EPS (INR) 97.67 100.39 123.09 135.26 147.63Norm EPS (INR) 97.67 110.85 123.09 135.26 147.63FD norm EPS (INR) 97.67 110.85 123.09 135.26 147.63BVPS (INR) 282.72 293.66 350.47 435.15 528.57DPS (INR) 32.00 79.00 40.00 42.00 45.00Activity (days)Days receivable 88.1 89.7 87.5 88.0 88.3Days inventory 0.0 0.0 0.0 0.0 0.0Days payable 83.8 88.8 85.2 76.6 75.6Cash cycle 4.3 0.9 2.4 11.4 12.7Source: Company data, Nomura estimates

Nomura | Tata Consultancy Services 16 December 2015
41
Our thesis in six charts Fig. 93: TCS vs INFO USD revenue growth (% y-y) After outperforming for five years, TCS is starting to underperform INFO on USD revenue growth. We expect TCS to underperform INFO on growth in FY16/17F
Source: Company, Nomura estimates
Fig. 94: ES USD revenue growth (% y-y) Within larger segments like enterprise solutions TCS is showing material differentials after outgrowing INFO over last 3 years.
Source: Company, Nomura research
Fig. 95: USD revenue growth in North America (% y-y) Within North America, TCS is now underperforming INFO on growth…
Source: Company, Nomura research
Fig. 96: USD revenue growth in Europe (% y-y) … while the gap in growth has narrowed in Europe
Source: Company, Nomura research
Fig. 97: IMS USD revenue growth (% y-y) While TCS is growing the fastest in IMS, there has been a sharp moderation lately
Source: Company, Nomura research
Fig. 98: BFSI USD revenue growth (% y-y) In BFSI, where TCS has consistently outperformed INFO, but of late it has started to underperform both INFO and CTSH
Source: Company, Nomura research
7.1% 6.5%
5.6%
3.2%
5.8%
8.7% 7.4%
12.0%
16.7% 17.7%
14.3%
11.3%
9.3%
5.8%
6.7%
9.6%
0%
4%
8%
12%
16%
20%
1QF
Y15
2QF
Y15
3QF
Y15
4QF
Y15
1QF
Y16
2QF
Y16
3QF
Y16
F
4QF
Y16
F
Infosys TCS28%
10%
20%
-2%-5%
0%
5%
10%
15%
20%
25%
30%
35%
1QF
Y14
2QF
Y14
3QF
Y14
4QF
Y14
1QF
Y15
2QF
Y15
3QF
Y15
4QF
Y15
1QF
Y16
2QF
Y16
Infosys TCS
8%
13%
17%
9%
4%
6%
8%
10%
12%
14%
16%
18%
3QF
Y14
4QF
Y14
1QF
Y15
2QF
Y15
3QF
Y15
4QF
Y15
1QF
Y16
2QF
Y16
Infosys TCS
14%
1%
28%
-10%
-5%
0%
5%
10%
15%
20%
25%
30%
35%3Q
FY
14
4QF
Y14
1QF
Y15
2QF
Y15
3QF
Y15
4QF
Y15
1QF
Y16
2QF
Y16
Infosys TCS
13%
0%
10%
20%
30%
40%
1QF
Y13
2QF
Y13
3QF
Y13
4QF
Y13
1QF
Y14
2QF
Y14
3QF
Y14
4QF
Y14
1QF
Y15
2QF
Y15
3QF
Y15
4QF
Y15
1QF
Y16
2QF
Y16
19%
9%6%
-5%
0%
5%
10%
15%
20%
25%
1QF
Y13
2QF
Y13
3QF
Y13
4QF
Y13
1QF
Y14
2QF
Y14
3QF
Y14
4QF
Y14
1QF
Y15
2QF
Y15
3QF
Y15
4QF
Y15
1QF
Y16
2QF
Y16
Cognizant Infosys TCS

Rating Remains NeutralTarget Price Remains INR 560
Closing price 11 December 2015 INR 537
Potential upside +4.3%
Anchor themesWe prefer companies that have a better skew towards growing segments and are available at reasonable valuations.
Nomura vs consensusOur TP is ~7% lower than consensus as we are less optimistic on valuation multiples.
Research analysts
India Technology/Services & Software
Ashwin Mehta - NFASL [email protected] +91 22 4037 4465
Rishit Parikh - NSFSPL [email protected] +91 22 4037 4360
Key company data: See next page for company data and detailed price/index chart.
Tech Mahindra TEML.NS TECHM IN
EQUITY: SOFTWARE & SERVICES
High concentration risks keeps us cautious
High telecom exposure/client concentration and sub-scale enterprise segment could be drag
Action: Past growth drivers are current risks; Neutral We expect TECHM to underperform tier 1 IT companies’ organic revenue growth given: 1) High exposure to telecoms (~53% of revenue), which has been the most sluggish of the verticals for the industry, seeing slow decision making and an M&A-related lull in demand; 2) Drag from high client concentration (top-10 clients contribute 44% of revenue) in a scenario where client spend is not increasing materially; and 3) Enterprise segment, while currently performing, might hit a wall on subscale presence (non-enterprise verticals are near half to one-fourth the size of the smallest tier 1 IT peer). We expect organic USD revenue growth of 1% in FY16F (dragged down by telecoms with ~ 6% y-y declines) and 9% y-y in FY17F (again dragged by down telecoms with ~7% y-y growth). Overall we look for 9.5% USD revenue and 12% EPS CAGRs over FY16-18F. Retain Neutral.
Catalyst: Rebound in telecom and faster margin recovery
Could be the slowest growing tier 1 IT company in FY17F We are cutting our FY17/18F USD revenue growth estimates by 1 percentage point (pp) to 9/9.9% as we believe 1) Telecom growth may remain sluggish and the M&A integration opportunity might not be as large for TECHM as a lot is convergence M&As (telecom with cable, broadband, DTH, Media) where companies like Accenture might have an edge and 2) Weaker client footprint in BFSI would limit material outperformance on enterprise segment growth.
Reiterate Neutral, TP unchanged at INR560 on new INR/USD estimates Despite slower growth estimates, our EPS estimates are unchanged on our revised USD/INR forecast of 66 (vs 65 previously). Our TP is based on 14x 1-year forward EPS up to Sep-17 of INR39.6, a discount of ~20% to INFO/TCS on slower growth, lower margins and higher concentration risk. Downside risks include INR appreciation, weak growth in telecom and any client issues.
Year-end 31 Mar FY15 FY16F FY17F FY18F
Currency (INR) Actual Old New Old New Old New
Revenue (mn) 224,779 264,580 266,591 292,881 293,624 324,662 322,698
Reported net profit (mn) 26,278 29,503 29,628 33,829 33,884 37,324 37,020
Normalised net profit (mn) 25,992 29,503 29,628 33,829 33,884 37,324 37,020
FD normalised EPS 29.59 33.21 33.35 38.08 38.14 42.01 41.67
FD norm. EPS growth (%) -1.1 12.2 12.7 14.7 14.4 10.3 9.3
FD normalised P/E (x) 18.1 N/A 16.1 N/A 14.1 N/A 12.9
EV/EBITDA (x) 12.0 N/A 11.1 N/A 9.2 N/A 8.2
Price/book (x) 3.7 N/A 3.2 N/A 2.7 N/A 2.3
Dividend yield (%) 1.1 N/A 1.1 N/A 1.3 N/A 1.5
ROE (%) 24.5 21.9 22.0 21.1 21.1 19.9 19.7
Net debt/equity (%) net cash net cash net cash net cash net cash net cash net cash
Source: Company data, Nomura estimates
Global Markets Research 16 December 2015
See Appendix A-1 for analyst certification, important disclosures and the status of non-US analysts.

Nomura | Tech Mahindra 16 December 2015
43
Key data on Tech Mahindra Relative performance chart
Source: Thomson Reuters, Nomura research
Notes:
Performance (%) 1M 3M 12MAbsolute (INR) 2.2 2.3 -18.0 M cap (USDmn) 7,728.7Absolute (USD) 1.2 1.8 -23.5 Free float (%) 16.0Rel to MSCI India 4.8 5.7 -6.4 3-mth ADT (USDmn) 25.9 Income statement (INRmn) Year-end 31 Mar FY14 FY15 FY16F FY17F FY18FRevenue 188,313 224,779 266,591 293,624 322,698Cost of goods sold -121,700 -156,205 -189,678 -207,092 -229,892Gross profit 66,613 68,574 76,913 86,532 92,805SG&A -29,998 -33,509 -40,403 -43,474 -47,047Employee share expense
Operating profit 36,615 35,065 36,510 43,058 45,758EBITDA 41,836 41,144 43,895 50,690 54,145Depreciation -5,221 -6,079 -7,385 -7,632 -8,387Amortisation
EBIT 36,615 35,065 36,510 43,058 45,758Net interest expense -797 -297 -646 -698 -698Associates & JCEs
Other income 1,129 1,006 3,974 3,765 5,301Earnings before tax 36,947 35,774 39,838 46,125 50,362Income tax -9,820 -9,472 -10,020 -11,992 -13,094Net profit after tax 27,127 26,302 29,818 34,132 37,268Minority interests -336 -310 -190 -248 -248Other items -1,213 0 0 0 0Preferred dividends
Normalised NPAT 25,578 25,992 29,628 33,884 37,020Extraordinary items 3,496 286 0 0 0Reported NPAT 29,074 26,278 29,628 33,884 37,020Dividends -4,880 -6,204 -6,232 -7,271 -8,309Transfer to reserves 24,194 20,074 23,396 26,614 28,710Valuations and ratios
Reported P/E (x) 15.4 17.4 15.7 13.7 12.6Normalised P/E (x) 17.5 17.6 15.7 13.7 12.6FD normalised P/E (x) 17.9 18.1 16.1 14.1 12.9Dividend yield (%) 0.9 1.1 1.1 1.3 1.5Price/cashflow (x) 25.6 53.2 25.8 14.7 14.5Price/book (x) 4.9 3.7 3.2 2.7 2.3EV/EBITDA (x) 11.5 12.0 11.1 9.2 8.2EV/EBIT (x) 13.2 14.0 13.3 10.8 9.7Gross margin (%) 35.4 30.5 28.9 29.5 28.8EBITDA margin (%) 22.2 18.3 16.5 17.3 16.8EBIT margin (%) 19.4 15.6 13.7 14.7 14.2Net margin (%) 15.4 11.7 11.1 11.5 11.5Effective tax rate (%) 26.6 26.5 25.2 26.0 26.0Dividend payout (%) 16.8 23.6 21.0 21.5 22.4ROE (%) 36.3 24.5 22.0 21.1 19.7ROA (pretax %) 32.5 24.2 21.0 23.0 23.0Growth (%)
Revenue 31.4 19.4 18.6 10.1 9.9EBITDA 36.6 -1.7 6.7 15.5 6.8Normalised EPS 30.4 -0.5 12.0 14.4 9.3Normalised FDEPS 27.0 -1.1 12.7 14.4 9.3Source: Company data, Nomura estimates
Cashflow statement (INRmn) Year-end 31 Mar FY14 FY15 FY16F FY17F FY18FEBITDA 41,836 41,144 43,895 50,690 54,145Change in working capital -12,213 -22,427 -14,071 -5,502 -7,223Other operating cashflow -11,722 -9,853 -11,320 -12,690 -13,932Cashflow from operations 17,902 8,864 18,504 32,498 32,991Capital expenditure -8,328 -10,831 -9,389 -8,000 -8,000Free cashflow 9,574 -1,967 9,115 24,498 24,991Reduction in investments 236 -794 -229 0 0Net acquisitions -586 -12,649 -193 0 0Dec in other LT assets 0 0 0 0 0Inc in other LT liabilities 0 0 0 0 0Adjustments CF after investing acts 9,223 -15,409 8,693 24,498 24,991Cash dividends -4,880 -6,204 -6,232 -7,271 -8,309Equity issue 2,680 11,045 1,211 0 0Debt issue -8,002 6,222 1,184 0 0Convertible debt issue 0 0 0 0 0Others 332 709 3,328 3,067 4,603CF from financial acts -9,870 11,772 -510 -4,204 -3,706Net cashflow -647 -3,637 8,183 20,294 21,284Beginning cash 36,374 35,727 32,090 40,273 60,567Ending cash 35,727 32,090 40,273 60,567 81,851Ending net debt -35,203 -25,344 -32,343 -52,637 -73,921 Balance sheet (INRmn) As at 31 Mar FY14 FY15 FY16F FY17F FY18FCash & equivalents 35,727 32,090 40,273 60,567 81,851Marketable securities 0 0 0 0 0Accounts receivable 55,102 71,463 81,638 88,957 98,566Inventories 0 0 0 0 0Other current assets 23,937 32,034 33,334 36,246 40,069Total current assets 114,766 135,587 155,245 185,770 220,486LT investments 12,194 12,987 13,216 13,216 13,216Fixed assets 22,966 27,717 29,721 30,089 29,702Goodwill 5,640 18,289 18,482 18,482 18,482Other intangible assets 0 0 0 0 0Other LT assets 3,830 3,901 5,011 5,461 6,050Total assets 159,396 198,481 221,676 253,018 287,937Short-term debt 0 0 0 0 0Accounts payable 48,808 45,557 49,060 52,356 56,682Other current liabilities 16,807 22,088 15,989 17,423 19,304Total current liabilities 65,614 67,645 65,049 69,778 75,986Long-term debt 525 6,746 7,930 7,930 7,930Convertible debt 0 0 0 0 0Other LT liabilities 0 0 0 0 0Total liabilities 66,139 74,391 72,979 77,708 83,916Minority interest 1,438 1,601 1,684 1,684 1,684Preferred stock 0 0 0 0 0Common stock 2,335 4,804 4,812 4,812 4,812Retained earnings 89,484 117,685 142,201 168,814 197,524Proposed dividends 0 0 0Other equity and reserves 0 0 0Total shareholders' equity 91,819 122,489 147,013 173,626 202,336Total equity & liabilities 159,396 198,481 221,676 253,018 287,937
Liquidity (x)Current ratio 1.75 2.00 2.39 2.66 2.90Interest cover 45.9 118.1 56.5 61.7 65.6LeverageNet debt/EBITDA (x) net cash net cash net cash net cash net cashNet debt/equity (%) net cash net cash net cash net cash net cash
Per shareReported EPS (INR) 34.91 30.90 34.23 39.15 42.77Norm EPS (INR) 30.71 30.56 34.23 39.15 42.77FD norm EPS (INR) 29.92 29.59 33.35 38.14 41.67BVPS (INR) 110.25 144.01 169.84 200.59 233.76DPS (INR) 5.00 6.00 6.00 7.00 8.00Activity (days)Days receivable 92.4 102.8 105.1 106.0 106.1Days inventory 0.0 0.0 0.0 0.0 0.0Days payable 138.4 110.2 91.3 89.4 86.6Cash cycle -46.0 -7.5 13.8 16.7 19.5Source: Company data, Nomura estimates

Nomura | Tech Mahindra 16 December 2015
44
Our thesis in six charts Fig. 99: Telecom USD revenue growth comparison (y-y) In telecom, most sluggish vertical for Indian IT, TECHM is now underperforming tier 1 IT after significant outperformance before
Source: Company, Nomura research
Fig. 100: Telecom exposure across tier 1 IT (%) in 2QFY16 TECHM's high exposure to telecom at ~53% of revenues is a key risk to growth
Source: Company, Nomura research
Fig. 101: TECHM Top 10 clients growth (y-y) TECHM has seen a sharp deceleration in top 10 client growth as ramp-downs at BT and consolidation situations at clients hurt revenues
Source: Company, Nomura research
Fig. 102: Top 10 client concentration of TechM vs tier 1 IT TECHM's high client concentration at 43% of revenues (versus nearly half of that at its tier 1 IT peers) is another growth depressant near term.
Source: Company, Nomura research
Fig. 103: Growth trends in the enterprise segment (y-y) While enterprise growth has been steady in 9-12% range on better deal participation and improved sales efficiencies….
Source: Company, Nomura research
Fig. 104: Non telecom vertical revenue comparison (USD mn)…TechM's smaller scale at half or near a quarter of its nearest tier 1 IT competition in these verticals can be a longer term handicap.
Source: Company, Nomura research
1%
-7%-10%
0%
10%
20%
30%
40%
3QF
Y13
1QF
Y14
3QF
Y14
1QF
Y15
3QF
Y15
1QF
Y16
Aggregate tier 1 IT TechM53%
13%11% 10% 8%
0%
10%
20%
30%
40%
50%
60%
TechMahindra
Wipro TCS HCLT Infosys
26%
2%
-5%-10%
-5%
0%
5%
10%
15%
20%
25%
30%
2QF
Y14
3QF
Y14
4QF
Y14
1QF
Y15
2QF
Y15
3QF
Y15
4QF
Y15
1QF
Y16
2QF
Y16
43%
22% 23%20% 18%
Tec
hM
HC
LT
Info
sys
Wip
ro
Cog
niza
nt
13%
9%
10%
6%
8%
10%
12%
14%
1QF
Y14
2QF
Y14
3QF
Y14
4QF
Y14
1QF
Y15
2QF
Y15
3QF
Y15
4QF
Y15
1QF
Y16
2QF
Y16
675
348243
1,370
1,612
544
0
200
400
600
800
1,000
1,200
1,400
1,600
1,800
Manufacturing BFSI Retail
Tech M Smallest Tier 1 competitor
2.0x
4.5x
2.0x

Nomura | Tech Mahindra 16 December 2015
45
Growth moderation countered by new INR forecast; EPS estimates unchanged
We cut our revenue growth estimates for FY17/18F to 9/9.9% (~1pp lower) on higher caution in telecom and in general our cautious view on demand in light of weakening demand indicators. TECHM is unlikely to see a material impact of Chennai floods like other tier 1 IT peers on small presence. Our EPS estimates are largely unchanged despite lower USD revenue due to our revised USD/INR forecast of 66 (vs 65 previously).
Fig. 105: Estimate revisions
Source: Company, Nomura estimates
FY16F FY17F FY18F FY16F FY17F FY18F FY16F FY17F FY18FRevenue (USDmn) 4,080 4,449 4,889 4,085 4,506 4,995 -0.1 -1.3 -2.1USD/INR 65.3 66.0 66.0 64.8 65.0 65.0 0.9 1.5 1.5Revenue (INRbn) 267 294 323 265 293 325 0.8 0.3 -0.6EBIT margin (%) 13.7 14.7 14.2 13.6 14.6 14.2 10 bps 10 bps 0 bpsDiluted EPS (INR) 33.4 38.1 41.7 33.2 38.1 42.0 0.4 0.2 -0.8
New Old Change (%)

Rating Remains NeutralTarget Price Remains INR 570
Closing price 11 December 2015 INR 566
Potential upside +0.7%
Anchor themesWe prefer companies that have a better skew towards growing segments and are available at reasonable valuations.
Nomura vs consensusOur TP is ~8% below consensus on 1)~3% lower FY17F EPS on weaker growth and margin assumptions versus consensus, and 2) less conviction on valuations in light of continued underperformance versus peers.
Research analysts
India Technology/Services & Software
Ashwin Mehta - NFASL [email protected] +91 22 4037 4465
Rishit Parikh - NSFSPL [email protected] +91 22 4037 4360
Key company data: See next page for company data and detailed price/index chart.
Wipro WIPR.NS WPRO IN
EQUITY: SOFTWARE & SERVICES
Remains the least preferred in tier-1 IT
Execution remains an issue, continue to expect lag on growth vs peers
Action: Retain our cautious view Wipro remains our least preferred stock in tier-1 IT and we believe it will continue to underperform on growth vs peers, due to: 1) weaker positioning in developed markets (US + Europe LTM growth contribution is ~50% vs significantly higher for peers); 2) stronger entrenched competition in key growth segments like BFSI/IMS/BPO and declining market share in IMS versus TCS/HCLT; 3) weaker client mining; and 4) drag from legacy segments (non BPO/IMS/Engg services). As a result we expect weaker-than-industry growth at 9% vs. 11-14% and EPS growth at 7% vs 10-18% at TCS/INFO/HCLT/CTSH over FY16-18F, after material underperformance in FY16F.
Catalyst: Better-than-expected revenue growth
2H outlook moderation, underperformance to continue in FY17F We moderate our 3Q revenue growth expectations to 1.4% q-q vs 2% q-q earlier on 1) Chennai flood impacts (~30bp q-q), and 2) incremental cross currency impact (~40bp q-q) in 3Q. Despite incorporating contributions from the Cellent acquisition (USD92mn in revenues, starting Mar-16, ~1.1% contribution in FY17F), we still expect WPRO to post sub-5% growth in FY16F and sub-10% growth in FY17F. Contrary to management expectations of medium-term margin improvement, we build ~100bp EBIT margin drop over FY16-18F to 20% levels, as the company might have to play disruptive and invest more to correct its growth underperformance.
Valuation: Retain TP of INR570, remain Neutral Our TP is based on 14x 1-year forward EPS of INR40.9 up to Sep-17. Wipro currently trades at ~15-20% discounts to INFO/TCS on FY17F EPS, which we think is justified given lower growth expectation vs peers and weaker positioning. Wipro remains our least preferred stock in tier-1 IT.
Year-end 31 Mar FY15 FY16F FY17F FY18F
Currency (INR) Actual Old New Old New Old New
Revenue (mn) 469,545 508,720 511,808 550,514 559,195 596,911 605,472
Reported net profit (mn) 86,528 90,824 91,938 97,896 97,589 104,659 105,049
Normalised net profit (mn) 86,528 90,824 91,938 97,896 97,589 104,659 105,049
FD normalised EPS 35.08 36.89 37.34 39.70 39.57 42.37 42.53
FD norm. EPS growth (%) 10.8 5.1 6.4 7.6 6.0 6.7 7.5
FD normalised P/E (x) 16.1 N/A 15.2 N/A 14.3 N/A 13.3
EV/EBITDA (x) 12.1 N/A 11.2 N/A 10.0 N/A 9.0
Price/book (x) 3.4 N/A 3.1 N/A 2.7 N/A 2.4
Dividend yield (%) 2.1 N/A 2.1 N/A 2.1 N/A 2.1
ROE (%) 23.0 21.3 21.5 20.6 20.5 19.3 19.4
Net debt/equity (%) net cash net cash net cash net cash net cash net cash net cash
Source: Company data, Nomura estimates
Global Markets Research 16 December 2015
See Appendix A-1 for analyst certification, important disclosures and the status of non-US analysts.
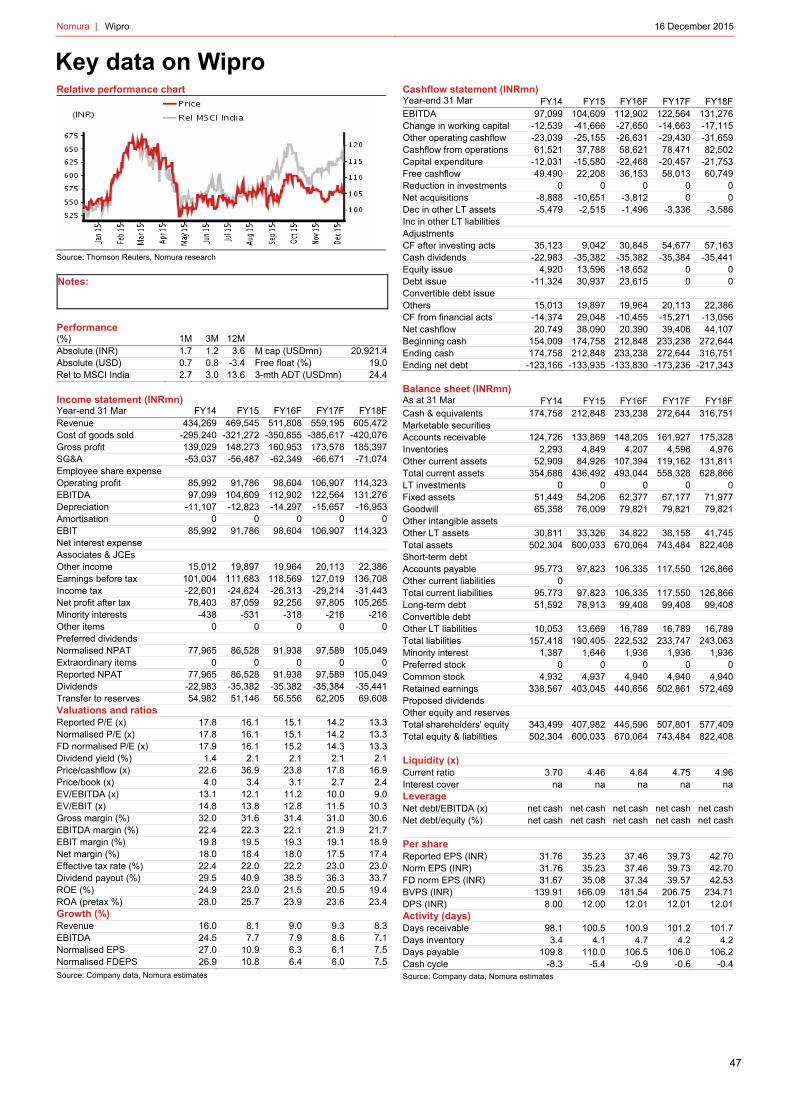
Nomura | Wipro 16 December 2015
47
Key data on Wipro Relative performance chart
Source: Thomson Reuters, Nomura research
Notes:
Performance (%) 1M 3M 12MAbsolute (INR) 1.7 1.2 3.6 M cap (USDmn) 20,921.4Absolute (USD) 0.7 0.8 -3.4 Free float (%) 19.0Rel to MSCI India 2.7 3.0 13.6 3-mth ADT (USDmn) 24.4 Income statement (INRmn) Year-end 31 Mar FY14 FY15 FY16F FY17F FY18FRevenue 434,269 469,545 511,808 559,195 605,472Cost of goods sold -295,240 -321,272 -350,855 -385,617 -420,076Gross profit 139,029 148,273 160,953 173,578 185,397SG&A -53,037 -56,487 -62,349 -66,671 -71,074Employee share expense
Operating profit 85,992 91,786 98,604 106,907 114,323EBITDA 97,099 104,609 112,902 122,564 131,276Depreciation -11,107 -12,823 -14,297 -15,657 -16,953Amortisation 0 0 0 0 0EBIT 85,992 91,786 98,604 106,907 114,323Net interest expense
Associates & JCEs
Other income 15,012 19,897 19,964 20,113 22,386Earnings before tax 101,004 111,683 118,569 127,019 136,708Income tax -22,601 -24,624 -26,313 -29,214 -31,443Net profit after tax 78,403 87,059 92,256 97,805 105,265Minority interests -438 -531 -318 -216 -216Other items 0 0 0 0 0Preferred dividends
Normalised NPAT 77,965 86,528 91,938 97,589 105,049Extraordinary items 0 0 0 0 0Reported NPAT 77,965 86,528 91,938 97,589 105,049Dividends -22,983 -35,382 -35,382 -35,384 -35,441Transfer to reserves 54,982 51,146 56,556 62,205 69,608Valuations and ratios
Reported P/E (x) 17.8 16.1 15.1 14.2 13.3Normalised P/E (x) 17.8 16.1 15.1 14.2 13.3FD normalised P/E (x) 17.9 16.1 15.2 14.3 13.3Dividend yield (%) 1.4 2.1 2.1 2.1 2.1Price/cashflow (x) 22.6 36.9 23.8 17.8 16.9Price/book (x) 4.0 3.4 3.1 2.7 2.4EV/EBITDA (x) 13.1 12.1 11.2 10.0 9.0EV/EBIT (x) 14.8 13.8 12.8 11.5 10.3Gross margin (%) 32.0 31.6 31.4 31.0 30.6EBITDA margin (%) 22.4 22.3 22.1 21.9 21.7EBIT margin (%) 19.8 19.5 19.3 19.1 18.9Net margin (%) 18.0 18.4 18.0 17.5 17.4Effective tax rate (%) 22.4 22.0 22.2 23.0 23.0Dividend payout (%) 29.5 40.9 38.5 36.3 33.7ROE (%) 24.9 23.0 21.5 20.5 19.4ROA (pretax %) 28.0 25.7 23.9 23.6 23.4Growth (%)
Revenue 16.0 8.1 9.0 9.3 8.3EBITDA 24.5 7.7 7.9 8.6 7.1Normalised EPS 27.0 10.9 6.3 6.1 7.5Normalised FDEPS 26.9 10.8 6.4 6.0 7.5Source: Company data, Nomura estimates
Cashflow statement (INRmn) Year-end 31 Mar FY14 FY15 FY16F FY17F FY18FEBITDA 97,099 104,609 112,902 122,564 131,276Change in working capital -12,539 -41,666 -27,650 -14,663 -17,115Other operating cashflow -23,039 -25,155 -26,631 -29,430 -31,659Cashflow from operations 61,521 37,788 58,621 78,471 82,502Capital expenditure -12,031 -15,580 -22,468 -20,457 -21,753Free cashflow 49,490 22,208 36,153 58,013 60,749Reduction in investments 0 0 0 0 0Net acquisitions -8,888 -10,651 -3,812 0 0Dec in other LT assets -5,479 -2,515 -1,496 -3,336 -3,586Inc in other LT liabilities Adjustments CF after investing acts 35,123 9,042 30,845 54,677 57,163Cash dividends -22,983 -35,382 -35,382 -35,384 -35,441Equity issue 4,920 13,596 -18,652 0 0Debt issue -11,324 30,937 23,615 0 0Convertible debt issue Others 15,013 19,897 19,964 20,113 22,386CF from financial acts -14,374 29,048 -10,455 -15,271 -13,056Net cashflow 20,749 38,090 20,390 39,406 44,107Beginning cash 154,009 174,758 212,848 233,238 272,644Ending cash 174,758 212,848 233,238 272,644 316,751Ending net debt -123,166 -133,935 -133,830 -173,236 -217,343 Balance sheet (INRmn) As at 31 Mar FY14 FY15 FY16F FY17F FY18FCash & equivalents 174,758 212,848 233,238 272,644 316,751Marketable securities Accounts receivable 124,726 133,869 148,205 161,927 175,328Inventories 2,293 4,849 4,207 4,596 4,976Other current assets 52,909 84,926 107,394 119,162 131,811Total current assets 354,686 436,492 493,044 558,328 628,866LT investments 0 0 0 0 0Fixed assets 51,449 54,206 62,377 67,177 71,977Goodwill 65,358 76,009 79,821 79,821 79,821Other intangible assets Other LT assets 30,811 33,326 34,822 38,158 41,745Total assets 502,304 600,033 670,064 743,484 822,408Short-term debt Accounts payable 95,773 97,823 106,335 117,550 126,866Other current liabilities 0Total current liabilities 95,773 97,823 106,335 117,550 126,866Long-term debt 51,592 78,913 99,408 99,408 99,408Convertible debt Other LT liabilities 10,053 13,669 16,789 16,789 16,789Total liabilities 157,418 190,405 222,532 233,747 243,063Minority interest 1,387 1,646 1,936 1,936 1,936Preferred stock 0 0 0 0 0Common stock 4,932 4,937 4,940 4,940 4,940Retained earnings 338,567 403,045 440,656 502,861 572,469Proposed dividends Other equity and reserves Total shareholders' equity 343,499 407,982 445,596 507,801 577,409Total equity & liabilities 502,304 600,033 670,064 743,484 822,408
Liquidity (x)Current ratio 3.70 4.46 4.64 4.75 4.96Interest cover na na na na naLeverageNet debt/EBITDA (x) net cash net cash net cash net cash net cashNet debt/equity (%) net cash net cash net cash net cash net cash
Per shareReported EPS (INR) 31.76 35.23 37.46 39.73 42.70Norm EPS (INR) 31.76 35.23 37.46 39.73 42.70FD norm EPS (INR) 31.67 35.08 37.34 39.57 42.53BVPS (INR) 139.91 166.09 181.54 206.75 234.71DPS (INR) 8.00 12.00 12.01 12.01 12.01Activity (days)Days receivable 98.1 100.5 100.9 101.2 101.7Days inventory 3.4 4.1 4.7 4.2 4.2Days payable 109.8 110.0 106.5 106.0 106.2Cash cycle -8.3 -5.4 -0.9 -0.6 -0.4Source: Company data, Nomura estimates

Nomura | Wipro 16 December 2015
48
Our thesis in six charts Fig. 106: Y-Y Revenue growth in US for Wipro vs Tier-1 IT (ex CTSH) Wipro has underperformed its tier-1 IT peers in the US, though over the last 2 years underperformance gaps have closed
Source: Company, Nomura research
Fig. 107: CC Y-Y Revenue growth in Europe for Wipro vs Tier-1 IT (ex CTSH) .. However, the underperformance in Europe is stark at near double digits in cc terms
Source: Company, Nomura research Fig. 108: Revenue growth in top-5 clients (y-y) Execution has been weak, as witnessed by weak client mining …
Source: Bloomberg, Nomura research
Fig. 109: Share of IMS revenues within the top-4 Indian tier-1 IT .. and in IMS (fastest growing segments for Indian IT) where it was a leader, It has lost market share to HCLT/TCS.
Source: Company, Nomura estimates
Fig. 110: Growth comparison between service lines (LTM) % Legacy service lines have been a drag for Wipro vs other Tier-1 IT players
Note: Fast growing services are IMS, BPO, engineering services and testing, while other services are legacy like ADM/ES.
Source: Company, Nomura research
Fig. 111: IT Services EBIT margins and utilisation trends (%) Weaker growth continues to weigh on margins despite improvements in utilisations (excl. trainees)
Source: Company, Nomura research
23%
10%12%
7%
-5%
0%
5%
10%
15%
20%
25%
30%
1QF
Y11
3QF
Y11
1QF
Y12
3QF
Y12
1QF
Y13
3QF
Y13
1QF
Y14
3QF
Y14
1QF
Y15
3QF
Y15
1QF
Y16
Top 4 Indian IT Wipro
10%10%
21%
1%
-10%
0%
10%
20%
30%
40%
1QF
Y11
3QF
Y11
1QF
Y12
3QF
Y12
1QF
Y13
3QF
Y13
1QF
Y14
3QF
Y14
1QF
Y15
3QF
Y15
1QF
Y16
Top 4 Indian IT Wipro
14%
-6%-10%
-5%
0%
5%
10%
15%
20%
3QF
Y14
4QF
Y14
1QF
Y15
2QF
Y15
3QF
Y15
4QF
Y15
1QF
Y16
2QF
Y16
26% 28% 32% 29%
28%29% 29% 33%
35% 31% 29% 28%
0%
20%
40%
60%
80%
100%
Mar-12 Mar-13 Mar-14 Sep-15
Wipro TCS Infosys HCLT
16
1214
7
2
-2
75
HCLT Wipro TCS Infosys
LTM growth fast-growing service linesLTM growth other service lines
8225
21
18
21
24
27
70
75
80
85
1QF
Y13
2QF
Y13
3QF
Y13
4QF
Y13
1QF
Y14
2QF
Y14
3QF
Y14
4QF
Y14
1QF
Y15
2QF
Y15
3QF
Y15
4QF
Y15
1QF
Y16
2QF
Y16
Utilisation (LHS) Margins (RHS)

Nomura | Wipro 16 December 2015
49
Organic growth expectations moderated; EPS unchanged
We reduce our USD revenue growth expectations for FY16F to 4.4% y-y (vs 4.7% earlier), incorporating 1) Chennai flood impacts (~30bp q-q in 3Q), and 2) Cross currency impacts (~40bp q-q). We also marginally moderate our organic revenue growth expectations for FY17/18F by ~1pp, in line with our cautious stance on demand. Reported USD revenues are largely unchanged on incorporation of the Cellent acquisition (USD92mn in revenues, starting Mar-16), which will likely contribute ~1.1% y-y growth in FY17F. Overall we look for USD revenue growth of 4.4%/8.8%/8.8% over FY16/17/18F. We have also reset our USD/INR assumptions to 66.0 (64.5 earlier).
Fig. 112: Estimate revisions
Source: Nomura estimates
FY16F FY17F FY18F FY16F FY17F FY18F FY16F FY17F FY18FIT services revenue (USDmn) 7,390 8,042 8,746 7,412 8,044 8,762 -0.3 0.0 -0.2USD/INR rate 65.7 66.0 66.0 64.8 64.5 64.5 1.3 2.3 2.3IT services revenue (Rs bn) 483.5 528.6 574.9 480.4 519.9 566.3 0.6 1.7 1.5IT services EBIT margin (%) 21.0 20.4 20.0 21.0 20.4 20.0 0 bps 0 bps 0 bpsCons. revenue (Rs bn) 511.8 559.2 605.5 508.7 550.5 596.9 0.6 1.6 1.4Tax Rate (%) 22.2 23.0 23.0 22.2 22.5 22.5 0 bps 50 bps 50 bpsDiluted EPS (Rs) 37.3 39.6 42.5 36.9 39.7 42.4 1.2 -0.3 0.4
New Change (%)Old

Nomura | India IT services 16 December 2015
50
Appendix A-1 Analyst Certification
We, Ashwin Mehta and Rishit Parikh, hereby certify (1) that the views expressed in this Research report accurately reflect our personal views about any or all of the subject securities or issuers referred to in this Research report, (2) no part of our compensation was, is or will be directly or indirectly related to the specific recommendations or views expressed in this Research report and (3) no part of our compensation is tied to any specific investment banking transactions performed by Nomura Securities International, Inc., Nomura International plc or any other Nomura Group company.
Issuer Specific Regulatory Disclosures The term "Nomura Group" used herein refers to Nomura Holdings, Inc. or any of its affiliates or subsidiaries, and may refer to one or more Nomura Group companies.
Materially mentioned issuers Issuer Ticker Price Price date Stock rating Previous rating Date of changeSector rating Cognizant CTSH US USD 59.76 14-Dec-2015 Buy Neutral 03-Jan-2012 N/A HCL Technologies HCLT IN INR 845 15-Dec-2015 Buy Neutral 10-Sep-2009 N/A Hexaware Technologies HEXW IN INR 236 15-Dec-2015 Reduce Neutral 30-Apr-2014 N/A Infosys INFO IN INR 1078 15-Dec-2015 Buy Reduce 14-Aug-2013 N/A Mphasis MPHL IN INR 481 15-Dec-2015 Reduce Neutral 03-Nov-2014 N/A Tata Consultancy Services TCS IN INR 2376 15-Dec-2015 Neutral Buy 14-Oct-2015 N/A Tech Mahindra TECHM IN INR 520 15-Dec-2015 Neutral Buy 18-Jun-2015 N/A Wipro WPRO IN INR 559 15-Dec-2015 Neutral Buy 04-Oct-2013 N/A
Rating and target price changes
Issuer Ticker Old stock rating New stock rating Old target price New target price
Cognizant CTSH US Buy Buy USD 76.00 USD 72.00
Cognizant: Valuation Methodology Our target price of USD72 is based on 20x one-year forward EPS (up to Sep-17) of USD3.6. Our target P/E multiple is at a ~11% premium to our valuation multiple for TCS/INFO. The benchmark index for this stock is MSCI India. Cognizant: Risks that may impede the achievement of the target price Key downside risks include further weakness in global macro and any slowdown in demand in healthcare.
Important Disclosures Online availability of research and conflict-of-interest disclosures Nomura research is available on www.nomuranow.com/research, Bloomberg, Capital IQ, Factset, MarkitHub, Reuters and ThomsonOne. Important disclosures may be read at http://go.nomuranow.com/research/globalresearchportal/pages/disclosures/disclosures.aspx or requested from Nomura Securities International, Inc., on 1-877-865-5752. If you have any difficulties with the website, please email [email protected] for help.
The analysts responsible for preparing this report have received compensation based upon various factors including the firm's total revenues, a portion of which is generated by Investment Banking activities. Unless otherwise noted, the non-US analysts listed at the front of this report are not registered/qualified as research analysts under FINRA/NYSE rules, may not be associated persons of NSI, and may not be subject to FINRA Rule 2711 and NYSE Rule 472 restrictions on communications with covered companies, public appearances, and trading securities held by a research analyst account. Nomura Global Financial Products Inc. (“NGFP”) Nomura Derivative Products Inc. (“NDPI”) and Nomura International plc. (“NIplc”) are registered with the Commodities Futures Trading Commission and the National Futures Association (NFA) as swap dealers. NGFP, NDPI, and NIplc are generally engaged in the trading of swaps and other derivative products, any of which may be the subject of this report. Any authors named in this report are research analysts unless otherwise indicated. Industry Specialists identified in some Nomura International plc research reports are employees within the Firm who are responsible for the sales and trading effort in the sector for which they have coverage. Industry Specialists do not contribute in any manner to the content of research reports in which their names appear.
Distribution of ratings (Global) The distribution of all ratings published by Nomura Global Equity Research is as follows: 50% have been assigned a Buy rating which, for purposes of mandatory disclosures, are classified as a Buy rating; 40% of companies with this rating are investment banking clients of the Nomura Group*. 41% have been assigned a Neutral rating which, for purposes of mandatory disclosures, is classified as a Hold rating; 53% of companies with this rating are investment banking clients of the Nomura Group*. 9% have been assigned a Reduce rating which, for purposes of mandatory disclosures, are classified as a Sell rating; 19% of companies with this rating are investment banking clients of the Nomura Group*. As at 30 September 2015. *The Nomura Group as defined in the Disclaimer section at the end of this report.
Explanation of Nomura's equity research rating system in Europe, Middle East and Africa, US and Latin America, and Japan and Asia ex-Japan from 21 October 2013 The rating system is a relative system, indicating expected performance against a specific benchmark identified for each individual stock, subject to limited management discretion. An analyst’s target price is an assessment of the current intrinsic fair value of the stock based on an appropriate valuation methodology determined by the analyst. Valuation methodologies include, but are not limited to, discounted cash flow

Nomura | India IT services 16 December 2015
51
analysis, expected return on equity and multiple analysis. Analysts may also indicate expected absolute upside/downside relative to the stated target price, defined as (target price - current price)/current price.
STOCKS A rating of 'Buy', indicates that the analyst expects the stock to outperform the Benchmark over the next 12 months. A rating of 'Neutral', indicates that the analyst expects the stock to perform in line with the Benchmark over the next 12 months. A rating of 'Reduce', indicates that the analyst expects the stock to underperform the Benchmark over the next 12 months. A rating of 'Suspended', indicates that the rating, target price and estimates have been suspended temporarily to comply with applicable regulations and/or firm policies. Securities and/or companies that are labelled as 'Not rated' or shown as 'No rating' are not in regular research coverage. Investors should not expect continuing or additional information from Nomura relating to such securities and/or companies. Benchmarks are as follows: United States/Europe/Asia ex-Japan: please see valuation methodologies for explanations of relevant benchmarks for stocks, which can be accessed at: http://go.nomuranow.com/research/globalresearchportal/pages/disclosures/disclosures.aspx; Global Emerging Markets (ex-Asia): MSCI Emerging Markets ex-Asia, unless otherwise stated in the valuation methodology; Japan: Russell/Nomura Large Cap.
SECTORS A 'Bullish' stance, indicates that the analyst expects the sector to outperform the Benchmark during the next 12 months. A 'Neutral' stance, indicates that the analyst expects the sector to perform in line with the Benchmark during the next 12 months. A 'Bearish' stance, indicates that the analyst expects the sector to underperform the Benchmark during the next 12 months. Sectors that are labelled as 'Not rated' or shown as 'N/A' are not assigned ratings. Benchmarks are as follows: United States: S&P 500; Europe: Dow Jones STOXX 600; Global Emerging Markets (ex-Asia): MSCI Emerging Markets ex-Asia. Japan/Asia ex-Japan: Sector ratings are not assigned.
Explanation of Nomura's equity research rating system in Japan and Asia ex-Japan prior to 21 October 2013 STOCKS Stock recommendations are based on absolute valuation upside (downside), which is defined as (Target Price - Current Price) / Current Price, subject to limited management discretion. In most cases, the Target Price will equal the analyst's 12-month intrinsic valuation of the stock, based on an appropriate valuation methodology such as discounted cash flow, multiple analysis, etc. A 'Buy' recommendation indicates that potential upside is 15% or more. A 'Neutral' recommendation indicates that potential upside is less than 15% or downside is less than 5%. A 'Reduce' recommendation indicates that potential downside is 5% or more. A rating of 'Suspended' indicates that the rating and target price have been suspended temporarily to comply with applicable regulations and/or firm policies in certain circumstances including when Nomura is acting in an advisory capacity in a merger or strategic transaction involving the subject company. Securities and/or companies that are labelled as 'Not rated' or shown as 'No rating' are not in regular research coverage of the Nomura entity identified in the top banner. Investors should not expect continuing or additional information from Nomura relating to such securities and/or companies.
SECTORS A 'Bullish' rating means most stocks in the sector have (or the weighted average recommendation of the stocks under coverage is) a positive absolute recommendation. A 'Neutral' rating means most stocks in the sector have (or the weighted average recommendation of the stocks under coverage is) a neutral absolute recommendation. A 'Bearish' rating means most stocks in the sector have (or the weighted average recommendation of the stocks under coverage is) a negative absolute recommendation.
Target Price A Target Price, if discussed, reflects in part the analyst's estimates for the company's earnings. The achievement of any target price may be impeded by general market and macroeconomic trends, and by other risks related to the company or the market, and may not occur if the company's earnings differ from estimates.
Disclaimers This document contains material that has been prepared by the Nomura entity identified on page 1 and/or with the sole or joint contributions of one or more Nomura entities whose employees and their respective affiliations are also specified on page 1 or identified elsewhere in the document. The term "Nomura Group" used herein refers to Nomura Holdings, Inc. or any of its affiliates or subsidiaries and may refer to one or more Nomura Group companies including: Nomura Securities Co., Ltd. ('NSC') Tokyo, Japan; Nomura International plc ('NIplc'), UK; Nomura Securities International, Inc. ('NSI'), New York, US; Nomura International (Hong Kong) Ltd. (‘NIHK’), Hong Kong; Nomura Financial Investment (Korea) Co., Ltd. (‘NFIK’), Korea (Information on Nomura analysts registered with the Korea Financial Investment Association ('KOFIA') can be found on the KOFIA Intranet at http://dis.kofia.or.kr); Nomura Singapore Ltd. (‘NSL’), Singapore (Registration number 197201440E, regulated by the Monetary Authority of Singapore); Nomura Australia Ltd. (‘NAL’), Australia (ABN 48 003 032 513), regulated by the Australian Securities and Investment Commission ('ASIC') and holder of an Australian financial services licence number 246412; P.T. Nomura Indonesia (‘PTNI’), Indonesia; Nomura Securities Malaysia Sdn. Bhd. (‘NSM’), Malaysia; NIHK, Taipei Branch (‘NITB’), Taiwan; Nomura Financial Advisory and Securities (India) Private Limited (‘NFASL’), Mumbai, India (Registered Address: Ceejay House, Level 11, Plot F, Shivsagar Estate, Dr. Annie Besant Road, Worli, Mumbai- 400 018, India; Tel: +91 22 4037 4037, Fax: +91 22 4037 4111; CIN No: U74140MH2007PTC169116, SEBI Registration No. for Stock Broking activities : BSE INB011299030, NSE INB231299034, INF231299034, INE 231299034, MCX: INE261299034; SEBI Registration No. for Merchant Banking : INM000011419; SEBI Registration No. for Research: INH000001014 and NIplc, Madrid Branch (‘NIplc, Madrid’). ‘CNS Thailand’ next to an analyst’s name on the front page of a research report indicates that the analyst is employed by Capital Nomura Securities Public Company Limited (‘CNS’) to provide research assistance services to NSL under a Research Assistance Agreement. ‘NSFSPL’ next to an employee’s name on the front page of a research report indicates that the individual is employed by Nomura Structured Finance Services Private Limited to provide assistance to certain Nomura entities under inter-company agreements. THIS MATERIAL IS: (I) FOR YOUR PRIVATE INFORMATION, AND WE ARE NOT SOLICITING ANY ACTION BASED UPON IT; (II) NOT TO BE CONSTRUED AS AN OFFER TO SELL OR A SOLICITATION OF AN OFFER TO BUY ANY SECURITY IN ANY JURISDICTION WHERE SUCH OFFER OR SOLICITATION WOULD BE ILLEGAL; AND (III) BASED UPON INFORMATION FROM SOURCES THAT WE CONSIDER RELIABLE, BUT HAS NOT BEEN INDEPENDENTLY VERIFIED BY NOMURA GROUP. Nomura Group does not warrant or represent that the document is accurate, complete, reliable, fit for any particular purpose or merchantable and does not accept liability for any act (or decision not to act) resulting from use of this document and related data. To the maximum extent permissible all warranties and other assurances by Nomura group are hereby excluded and Nomura Group shall have no liability for the use, misuse, or distribution of this information. Opinions or estimates expressed are current opinions as of the original publication date appearing on this material and the information, including the opinions and estimates contained herein, are subject to change without notice. Nomura Group is under no duty to update this document. Any comments or statements made herein are those of the author(s) and may differ from views held by other parties within Nomura Group. Clients should consider whether any advice or recommendation in this report is suitable for their particular circumstances and, if appropriate, seek professional advice, including tax advice. Nomura Group does not provide tax advice.

Nomura | India IT services 16 December 2015
52
Nomura Group, and/or its officers, directors and employees, may, to the extent permitted by applicable law and/or regulation, deal as principal, agent, or otherwise, or have long or short positions in, or buy or sell, the securities, commodities or instruments, or options or other derivative instruments based thereon, of issuers or securities mentioned herein. Nomura Group companies may also act as market maker or liquidity provider (within the meaning of applicable regulations in the UK) in the financial instruments of the issuer. Where the activity of market maker is carried out in accordance with the definition given to it by specific laws and regulations of the US or other jurisdictions, this will be separately disclosed within the specific issuer disclosures. This document may contain information obtained from third parties, including ratings from credit ratings agencies such as Standard & Poor’s. Reproduction and distribution of third-party content in any form is prohibited except with the prior written permission of the related third-party. Third-party content providers do not guarantee the accuracy, completeness, timeliness or availability of any information, including ratings, and are not responsible for any errors or omissions (negligent or otherwise), regardless of the cause, or for the results obtained from the use of such content. Third-party content providers give no express or implied warranties, including, but not limited to, any warranties of merchantability or fitness for a particular purpose or use. Third-party content providers shall not be liable for any direct, indirect, incidental, exemplary, compensatory, punitive, special or consequential damages, costs, expenses, legal fees, or losses (including lost income or profits and opportunity costs) in connection with any use of their content, including ratings. Credit ratings are statements of opinions and are not statements of fact or recommendations to purchase hold or sell securities. They do not address the suitability of securities or the suitability of securities for investment purposes, and should not be relied on as investment advice. Any MSCI sourced information in this document is the exclusive property of MSCI Inc. (‘MSCI’). Without prior written permission of MSCI, this information and any other MSCI intellectual property may not be reproduced, re-disseminated or used to create any financial products, including any indices. This information is provided on an "as is" basis. The user assumes the entire risk of any use made of this information. MSCI, its affiliates and any third party involved in, or related to, computing or compiling the information hereby expressly disclaim all warranties of originality, accuracy, completeness, merchantability or fitness for a particular purpose with respect to any of this information. Without limiting any of the foregoing, in no event shall MSCI, any of its affiliates or any third party involved in, or related to, computing or compiling the information have any liability for any damages of any kind. MSCI and the MSCI indexes are services marks of MSCI and its affiliates. Russell/Nomura Japan Equity Indexes are protected by certain intellectual property rights of Nomura Securities Co., Ltd. and Russell Investments. Nomura Securities Co., Ltd. and Russell Investments do not guarantee the accuracy, completeness, reliability, or usefulness thereof and do not account for business activities and services that any index user and its affiliates undertake with the use of the Indexes. Investors should consider this document as only a single factor in making their investment decision and, as such, the report should not be viewed as identifying or suggesting all risks, direct or indirect, that may be associated with any investment decision. Nomura Group produces a number of different types of research product including, among others, fundamental analysis and quantitative analysis; recommendations contained in one type of research product may differ from recommendations contained in other types of research product, whether as a result of differing time horizons, methodologies or otherwise. Nomura Group publishes research product in a number of different ways including the posting of product on Nomura Group portals and/or distribution directly to clients. Different groups of clients may receive different products and services from the research department depending on their individual requirements. Figures presented herein may refer to past performance or simulations based on past performance which are not reliable indicators of future performance. Where the information contains an indication of future performance, such forecasts may not be a reliable indicator of future performance. Moreover, simulations are based on models and simplifying assumptions which may oversimplify and not reflect the future distribution of returns. Certain securities are subject to fluctuations in exchange rates that could have an adverse effect on the value or price of, or income derived from, the investment. The securities described herein may not have been registered under the US Securities Act of 1933 (the ‘1933 Act’), and, in such case, may not be offered or sold in the US or to US persons unless they have been registered under the 1933 Act, or except in compliance with an exemption from the registration requirements of the 1933 Act. Unless governing law permits otherwise, any transaction should be executed via a Nomura entity in your home jurisdiction. This document has been approved for distribution in the UK and European Economic Area as investment research by NIplc. NIplc is authorised by the Prudential Regulation Authority and regulated by the Financial Conduct Authority and the Prudential Regulation Authority. NIplc is a member of the London Stock Exchange. This document does not constitute a personal recommendation within the meaning of applicable regulations in the UK, or take into account the particular investment objectives, financial situations, or needs of individual investors. This document is intended only for investors who are 'eligible counterparties' or 'professional clients' for the purposes of applicable regulations in the UK, and may not, therefore, be redistributed to persons who are 'retail clients' for such purposes. This document has been approved by NIHK, which is regulated by the Hong Kong Securities and Futures Commission, for distribution in Hong Kong by NIHK. This document has been approved for distribution in Australia by NAL, which is authorized and regulated in Australia by the ASIC. This document has also been approved for distribution in Malaysia by NSM. In Singapore, this document has been distributed by NSL. NSL accepts legal responsibility for the content of this document, where it concerns securities, futures and foreign exchange, issued by their foreign affiliates in respect of recipients who are not accredited, expert or institutional investors as defined by the Securities and Futures Act (Chapter 289). Recipients of this document in Singapore should contact NSL in respect of matters arising from, or in connection with, this document. Unless prohibited by the provisions of Regulation S of the 1933 Act, this material is distributed in the US, by NSI, a US-registered broker-dealer, which accepts responsibility for its contents in accordance with the provisions of Rule 15a-6, under the US Securities Exchange Act of 1934. The entity that prepared this document permits its separately operated affiliates within the Nomura Group to make copies of such documents available to their clients. This document has not been approved for distribution to persons other than ‘Authorised Persons’, ‘Exempt Persons’ or ‘Institutions’ (as defined by the Capital Markets Authority) in the Kingdom of Saudi Arabia (‘Saudi Arabia’) or 'professional clients' (as defined by the Dubai Financial Services Authority) in the United Arab Emirates (‘UAE’) or a ‘Market Counterparty’ or ‘Business Customers’ (as defined by the Qatar Financial Centre Regulatory Authority) in the State of Qatar (‘Qatar’) by Nomura Saudi Arabia, NIplc or any other member of Nomura Group, as the case may be. Neither this document nor any copy thereof may be taken or transmitted or distributed, directly or indirectly, by any person other than those authorised to do so into Saudi Arabia or in the UAE or in Qatar or to any person other than ‘Authorised Persons’, ‘Exempt Persons’ or ‘Institutions’ located in Saudi Arabia or 'professional clients' in the UAE or a ‘Market Counterparty’ or ‘Business Customers’ in Qatar . By accepting to receive this document, you represent that you are not located in Saudi Arabia or that you are an ‘Authorised Person’, an ‘Exempt Person’ or an ‘Institution’ in Saudi Arabia or that you are a 'professional client' in the UAE or a ‘Market Counterparty’ or ‘Business Customers’ in Qatar and agree to comply with these restrictions. Any failure to comply with these restrictions may constitute a violation of the laws of the UAE or Saudi Arabia or Qatar. NO PART OF THIS MATERIAL MAY BE (I) COPIED, PHOTOCOPIED, OR DUPLICATED IN ANY FORM, BY ANY MEANS; OR (II) REDISTRIBUTED WITHOUT THE PRIOR WRITTEN CONSENT OF A MEMBER OF NOMURA GROUP. If this document has been distributed by electronic transmission, such as e-mail, then such transmission cannot be guaranteed to be secure or error-free as information could be intercepted, corrupted, lost, destroyed, arrive late or incomplete, or contain viruses. The sender therefore does not accept liability for any errors or omissions in the contents of this document, which may arise as a result of electronic transmission. If verification is required, please request a hard-copy version. Nomura Group manages conflicts with respect to the production of research through its compliance policies and procedures (including, but not limited to, Conflicts of Interest, Chinese Wall and Confidentiality policies) as well as through the maintenance of Chinese walls and employee training. Additional information is available upon request and disclosure information is available at the Nomura Disclosure web page: http://go.nomuranow.com/research/globalresearchportal/pages/disclosures/disclosures.aspx Copyright © 2015 Nomura International (Hong Kong) Ltd. All rights reserved.

Nomura Asian Equity Research Group
Hong Kong Nomura International (Hong Kong) Limited 30/F Two International Finance Centre, 8 Finance Street, Central, Hong Kong Tel: +852 2536 1111 Fax: +852 2536 1820
Singapore
Nomura Singapore Limited 10 Marina Boulevard Marina Bay Financial Centre Tower 2, #36-01, Singapore 018983, Singapore Tel: +65 6433 6288 Fax: +65 6433 6169
Taipei Nomura International (Hong Kong) Limited, Taipei Branch 17th Floor, Walsin Lihwa Xinyi Building, No.1, Songzhi Road, Taipei 11047, Taiwan, R.O.C. Tel: +886 2 2176 9999 Fax: +886 2 2176 9900
Seoul Nomura Financial Investment (Korea) Co., Ltd. 17th floor, Seoul Finance Center, 84 Taepyeongno 1-ga, Jung-gu, Seoul 100-768, Korea Tel: +82 2 3783 2000 Fax: +82 2 3783 2500
Kuala Lumpur Nomura Securities Malaysia Sdn. Bhd. Suite No 16.5, Level 16, Menara IMC, 8 Jalan Sultan Ismail, 50250 Kuala Lumpur, Malaysia Tel: +60 3 2027 6811 Fax: +60 3 2027 6888
India Nomura Financial Advisory and Securities (India) Private Limited Ceejay House, Level 11, Plot F, Shivsagar Estate, Dr. Annie Besant Road, Worli, Mumbai- 400 018, India Tel: +91 22 4037 4037 Fax: +91 22 4037 4111
Indonesia PT Nomura Indonesia Suite 209A, 9th Floor, Sentral Senayan II Building Jl. Asia Afrika No. 8, Gelora Bung Karno, Jakarta 10270, Indonesia Tel: +62 21 2991 3300 Fax: +62 21 2991 3333
Sydney Nomura Australia Ltd. Level 25, Governor Phillip Tower, 1 Farrer Place, Sydney NSW 2000 Tel: +61 2 8062 8000 Fax: +61 2 8062 8362
Tokyo Equity Research Department Financial & Economic Research Center Nomura Securities Co., Ltd. 17/F Urbannet Building, 2-2, Otemachi 2-chome Chiyoda-ku, Tokyo 100-8130, Japan Tel: +81 3 5255 1658 Fax: +81 3 5255 1747, 3272 0869
Caring for the environment: to receive only the electronic versions of our research, please contact your sales representative.