suzlon energy suzl.ns suel in - myirisbreport.myiris.com/nfasipl/suzenerg_20150406.pdf · repower),...
TRANSCRIPT
Rating Starts at BuyTarget price Starts at INR 38
Closing price 1 April 2015 INR 26
Potential upside +43.7%
Anchor themesSuzlon Energy is a play on the emerging wind power sector in India. It has been India's market leader in this segment but has suffered multiple crises mostly related to an overstretched balance sheet. It is now a potential turnaround story.
Nomura vs consensusOur TP is in line with the Street, but we note that the stock is not well covered.
Research analysts
India Capital Goods
Amar Kedia - NFASL [email protected] +91 22 4037 4182
Key company data: See page 2 for company data and detailed price/index chart
Suzlon Energy SUZL.NS SUEL IN
EQUITY: POWER & UTILITIES
Wind with chance of sun; initiate w/Buy
Strategic corporate moves fuel turnaround story
Action: Initiate at Buy with TP of INR38; c.44% upside potential Suzlon Energy (SUEL) is a potential turnaround story in the emerging wind power sector in India, where it has traditionally been a market leader due to its strong end-to-end EPC and O&M capability. From a position of strength, SUEL has gone through multiple crises over the past five years including debt default. However, it has since taken corrective steps to substantially repair its balance sheet by selling off its German offshore wind arm, Senvion (formerly REpower), for €1bn and issuing fresh equity worth INR18bn to Dilip Shanghvi & Associates (DSA) – a promoter for Sun Pharma (SUNP IN).
After the financial restructuring and Senvion sell-off, SUEL is now an India pure play set to refocus on new order wins and execution, and well placed to win back 50% market share in the domestic wind equipment market.
Re-introduction of wind power incentives and supportive policy aimed at meeting the government’s ambitious wind energy target of 60GW by 2022 should help to drive demand for wind equipment, in our view.
Strong operating/financial leverage from under-utilised manufacturing facilities and debt reduction is likely to drive normalisation of margins and strong earnings growth for SUEL in the years ahead, as per our estimates.
Catalysts: Improving financials and PAT breakeven by early FY17F
Valuation: Trading at 11.5x FY17F EV/EBITDA SUEL is trading at 11.5x FY17F EV/EBITDA, which we believe does not reflect the company’s strong growth prospects over FY15-20F. On our estimates, not only is SUEL likely to recover 50% market share by FY17F thus aiding its PAT breakeven by then, but it also has the potential to grow its EBITDA by ~50% over FY17-20F thus justifying a premium valuation over its regional peers (Fig 33). Accordingly, we value SUEL at 15x FY17F EV/EBITDA to arrive at our TP of INR38/share, which implies c.44% upside.
Year-end 31 Mar FY14 FY15F FY16F FY17F
Currency (INR) Actual Old New Old New Old New
Revenue (mn) 204,029 N/A 201,538 N/A 95,036 N/A 124,670
Reported net profit (mn) -34,679 N/A -84,415 N/A -804 N/A 9,372
Normalised net profit (mn) -29,806 N/A -22,004 N/A -804 N/A 9,372
FD normalised EPS -8.02 N/A -4.86 N/A -0.14 N/A 1.57
FD norm. EPS growth (%) N/A N/A N/A N/A N/A N/A N/A
FD normalised P/E (x) N/A N/A N/A N/A N/A N/A 16.9
EV/EBITDA (x) N/A N/A 27.4 N/A 23.8 N/A 11.2
Price/book (x) N/A N/A N/A N/A N/A N/A N/A
Dividend yield (%) N/A N/A N/A N/A N/A N/A N/A
ROE (%) N/A N/A N/A N/A N/A N/A N/A
Net debt/equity (%) N/A N/A N/A N/A N/A N/A N/A
Source: Company data, Nomura estimates
Global Markets Research 6 April 2015
See Appendix A-1 for analyst certification, important disclosures and the status of non-US analysts.
Nomura | Suzlon Energy 6 April 2015
2
Key data on Suzlon Energy Relative performance chart
Source: Thomson Reuters, Nomura research
Notes:
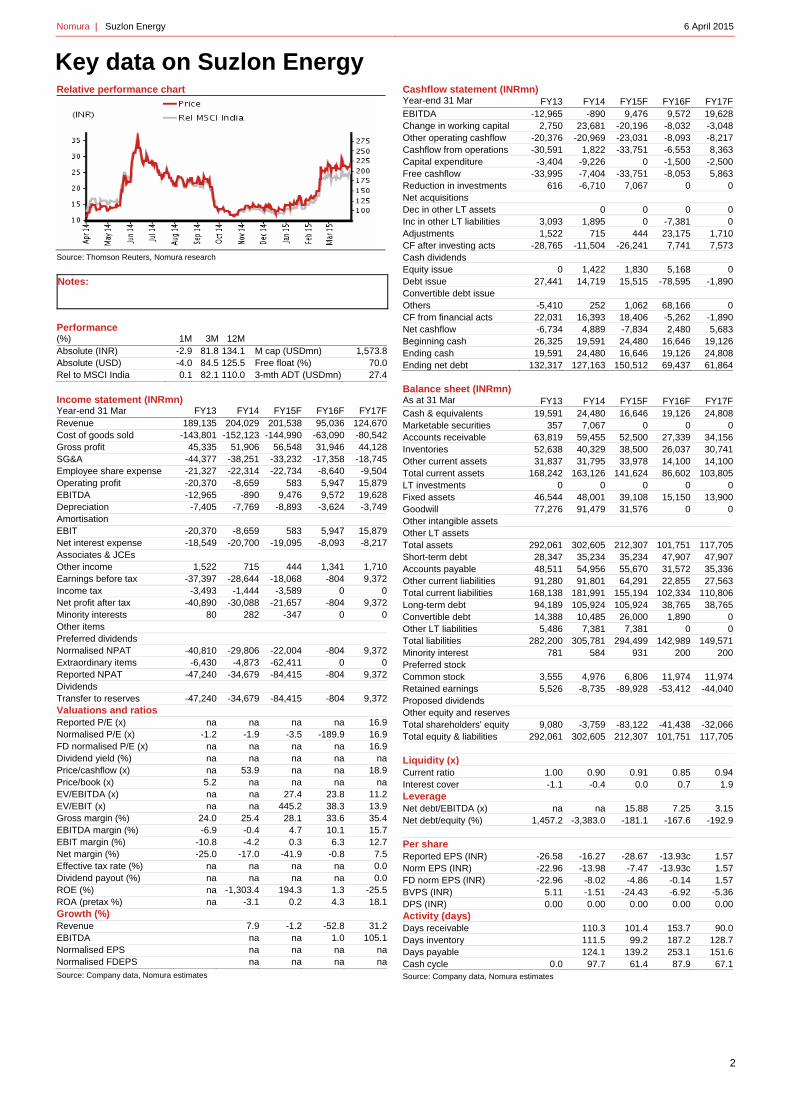
Performance (%) 1M 3M 12MAbsolute (INR) -2.9 81.8 134.1 M cap (USDmn) 1,573.8Absolute (USD) -4.0 84.5 125.5 Free float (%) 70.0Rel to MSCI India 0.1 82.1 110.0 3-mth ADT (USDmn) 27.4 Income statement (INRmn) Year-end 31 Mar FY13 FY14 FY15F FY16F FY17FRevenue 189,135 204,029 201,538 95,036 124,670Cost of goods sold -143,801 -152,123 -144,990 -63,090 -80,542Gross profit 45,335 51,906 56,548 31,946 44,128SG&A -44,377 -38,251 -33,232 -17,358 -18,745Employee share expense -21,327 -22,314 -22,734 -8,640 -9,504Operating profit -20,370 -8,659 583 5,947 15,879EBITDA -12,965 -890 9,476 9,572 19,628Depreciation -7,405 -7,769 -8,893 -3,624 -3,749Amortisation
EBIT -20,370 -8,659 583 5,947 15,879Net interest expense -18,549 -20,700 -19,095 -8,093 -8,217Associates & JCEs
Other income 1,522 715 444 1,341 1,710Earnings before tax -37,397 -28,644 -18,068 -804 9,372Income tax -3,493 -1,444 -3,589 0 0Net profit after tax -40,890 -30,088 -21,657 -804 9,372Minority interests 80 282 -347 0 0Other items
Preferred dividends
Normalised NPAT -40,810 -29,806 -22,004 -804 9,372Extraordinary items -6,430 -4,873 -62,411 0 0Reported NPAT -47,240 -34,679 -84,415 -804 9,372Dividends
Transfer to reserves -47,240 -34,679 -84,415 -804 9,372Valuations and ratios
Reported P/E (x) na na na na 16.9Normalised P/E (x) -1.2 -1.9 -3.5 -189.9 16.9FD normalised P/E (x) na na na na 16.9Dividend yield (%) na na na na naPrice/cashflow (x) na 53.9 na na 18.9Price/book (x) 5.2 na na na naEV/EBITDA (x) na na 27.4 23.8 11.2EV/EBIT (x) na na 445.2 38.3 13.9Gross margin (%) 24.0 25.4 28.1 33.6 35.4EBITDA margin (%) -6.9 -0.4 4.7 10.1 15.7EBIT margin (%) -10.8 -4.2 0.3 6.3 12.7Net margin (%) -25.0 -17.0 -41.9 -0.8 7.5Effective tax rate (%) na na na na 0.0Dividend payout (%) na na na na 0.0ROE (%) na -1,303.4 194.3 1.3 -25.5ROA (pretax %) na -3.1 0.2 4.3 18.1Growth (%)
Revenue 7.9 -1.2 -52.8 31.2EBITDA na na 1.0 105.1Normalised EPS na na na naNormalised FDEPS na na na naSource: Company data, Nomura estimates
Cashflow statement (INRmn) Year-end 31 Mar FY13 FY14 FY15F FY16F FY17FEBITDA -12,965 -890 9,476 9,572 19,628Change in working capital 2,750 23,681 -20,196 -8,032 -3,048Other operating cashflow -20,376 -20,969 -23,031 -8,093 -8,217Cashflow from operations -30,591 1,822 -33,751 -6,553 8,363Capital expenditure -3,404 -9,226 0 -1,500 -2,500Free cashflow -33,995 -7,404 -33,751 -8,053 5,863Reduction in investments 616 -6,710 7,067 0 0Net acquisitions Dec in other LT assets 0 0 0 0Inc in other LT liabilities 3,093 1,895 0 -7,381 0Adjustments 1,522 715 444 23,175 1,710CF after investing acts -28,765 -11,504 -26,241 7,741 7,573Cash dividends Equity issue 0 1,422 1,830 5,168 0Debt issue 27,441 14,719 15,515 -78,595 -1,890Convertible debt issue Others -5,410 252 1,062 68,166 0CF from financial acts 22,031 16,393 18,406 -5,262 -1,890Net cashflow -6,734 4,889 -7,834 2,480 5,683Beginning cash 26,325 19,591 24,480 16,646 19,126Ending cash 19,591 24,480 16,646 19,126 24,808Ending net debt 132,317 127,163 150,512 69,437 61,864 Balance sheet (INRmn) As at 31 Mar FY13 FY14 FY15F FY16F FY17FCash & equivalents 19,591 24,480 16,646 19,126 24,808Marketable securities 357 7,067 0 0 0Accounts receivable 63,819 59,455 52,500 27,339 34,156Inventories 52,638 40,329 38,500 26,037 30,741Other current assets 31,837 31,795 33,978 14,100 14,100Total current assets 168,242 163,126 141,624 86,602 103,805LT investments 0 0 0 0 0Fixed assets 46,544 48,001 39,108 15,150 13,900Goodwill 77,276 91,479 31,576 0 0Other intangible assets Other LT assets Total assets 292,061 302,605 212,307 101,751 117,705Short-term debt 28,347 35,234 35,234 47,907 47,907Accounts payable 48,511 54,956 55,670 31,572 35,336Other current liabilities 91,280 91,801 64,291 22,855 27,563Total current liabilities 168,138 181,991 155,194 102,334 110,806Long-term debt 94,189 105,924 105,924 38,765 38,765Convertible debt 14,388 10,485 26,000 1,890 0Other LT liabilities 5,486 7,381 7,381 0 0Total liabilities 282,200 305,781 294,499 142,989 149,571Minority interest 781 584 931 200 200Preferred stock Common stock 3,555 4,976 6,806 11,974 11,974Retained earnings 5,526 -8,735 -89,928 -53,412 -44,040Proposed dividends Other equity and reserves Total shareholders' equity 9,080 -3,759 -83,122 -41,438 -32,066Total equity & liabilities 292,061 302,605 212,307 101,751 117,705
Liquidity (x)Current ratio 1.00 0.90 0.91 0.85 0.94Interest cover -1.1 -0.4 0.0 0.7 1.9LeverageNet debt/EBITDA (x) na na 15.88 7.25 3.15Net debt/equity (%) 1,457.2 -3,383.0 -181.1 -167.6 -192.9
Per shareReported EPS (INR) -26.58 -16.27 -28.67 -13.93c 1.57Norm EPS (INR) -22.96 -13.98 -7.47 -13.93c 1.57FD norm EPS (INR) -22.96 -8.02 -4.86 -0.14 1.57BVPS (INR) 5.11 -1.51 -24.43 -6.92 -5.36DPS (INR) 0.00 0.00 0.00 0.00 0.00Activity (days)Days receivable 110.3 101.4 153.7 90.0Days inventory 111.5 99.2 187.2 128.7Days payable 124.1 139.2 253.1 151.6Cash cycle 0.0 97.7 61.4 87.9 67.1Source: Company data, Nomura estimates
Nomura | Suzlon Energy 6 April 2015
3
Wind with chance of sun
Recapitalisation of the company to refuel growth story
Suzlon Energy is a well-known name in the wind equipment market in India and has been a market leader in its segment for over a decade in India. However, following product quality issues and subsequent financial crisis, the company suffered a liquidity squeeze and defaulted on repayments (as we discuss later in this report on pages 4 and 5). This had a negative impact on the company’s execution, given that the banks froze its working capital limit and customers turned cautious about placing orders with Suzlon.
During this period, Suzlon suffered from a massive debt overhang, which it had to clear.
After much deliberation, the company has finally addressed this by making two major strategic decisions:
1) It has agreed to a recapitalisation of the balance sheet by way of issuing new shares to Dilip Shanghvi & Assocoiates, which has brought in fresh equity of INR18bn apart from new working capital lines (over and above its existing banking facilities).
2) It has also sealed a deal in January 2015, to sell its 100% stake in German wind equipment maker Senvion that it had bought in 2008. This move will bring in €1bn for the company. As per the announcement, the deal is likely to have been closed by 31 March 2015.
Both moves are likely to yield ~INR90bn to the company, which will go towards repayment of its INR170bn debt and thus provide a much needed boost to repair its balance sheet.
As highlighted earlier, with these initiatives, the company is back on track to execute and source orders as it has in the past.
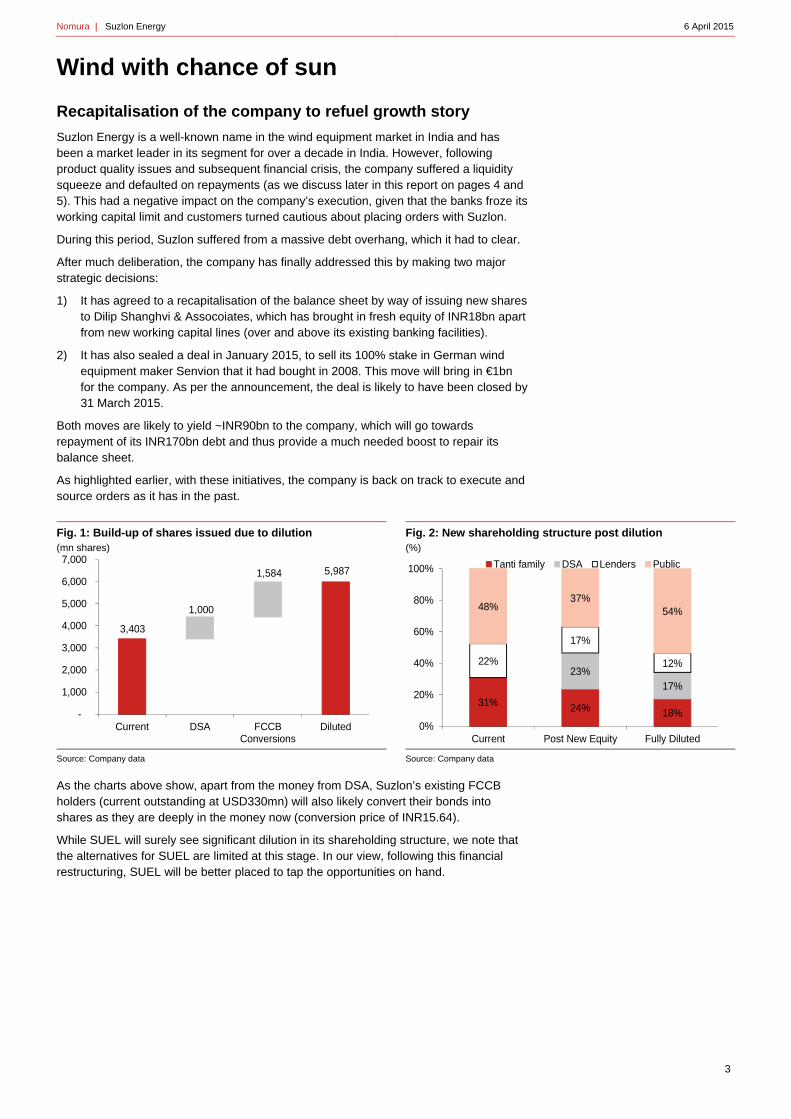
Fig. 1: Build-up of shares issued due to dilution (mn shares)
Source: Company data
Fig. 2: New shareholding structure post dilution (%)
Source: Company data
As the charts above show, apart from the money from DSA, Suzlon’s existing FCCB holders (current outstanding at USD330mn) will also likely convert their bonds into shares as they are deeply in the money now (conversion price of INR15.64).
While SUEL will surely see significant dilution in its shareholding structure, we note that the alternatives for SUEL are limited at this stage. In our view, following this financial restructuring, SUEL will be better placed to tap the opportunities on hand.
3,403
5,987
1,000
1,584
-
1,000
2,000
3,000
4,000
5,000
6,000
7,000
Current DSA FCCBConversions
Diluted
31% 24% 18%
23%17%
22%
17%
12%
48%37%
54%
0%
20%
40%
60%
80%
100%
Current Post New Equity Fully Diluted
Tanti family DSA Lenders Public
Nomura | Suzlon Energy 6 April 2015
4
Senvion sale to reduce leverage
Suzlon’s acquisition of Senvion (formerly REpower) in 2008 helped it to optimise its product offerings as well as geographic presence. Senvion has been amongst the leaders in offshore wind technology and thus with the acquisition, Suzlon transformed itself into one of the world’s top-5 wind equipment makers. Soon after the acquisition, Senvion became the most profitable asset for Suzlon and even today accounts for the bulk of Suzlon’s consolidated orders and revenue.
In FY14, Senvion contributed ~73% of consolidated revenues for SUEL and more than 100% of its EBITDA as the domestic entity, Suzlon Wind, was making losses at the EBITDA level. In FY15F, we estimate a similar trend with Senvion contributing ~74% of consolidated revenues (INR149bn) and more than 100% of EBITDA (INR11.3bn from Senvion out of consolidated EBITDA of INR9.5bn).
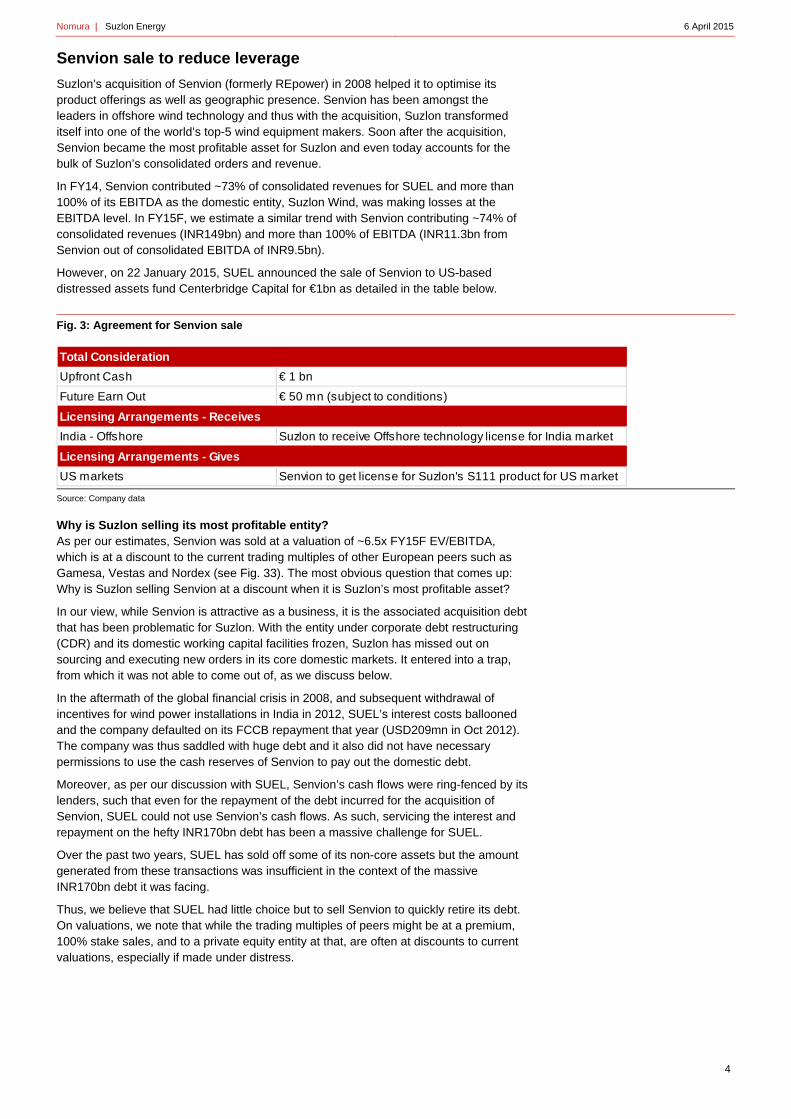
However, on 22 January 2015, SUEL announced the sale of Senvion to US-based distressed assets fund Centerbridge Capital for €1bn as detailed in the table below.
Fig. 3: Agreement for Senvion sale
Source: Company data
Why is Suzlon selling its most profitable entity? As per our estimates, Senvion was sold at a valuation of ~6.5x FY15F EV/EBITDA, which is at a discount to the current trading multiples of other European peers such as Gamesa, Vestas and Nordex (see Fig. 33). The most obvious question that comes up: Why is Suzlon selling Senvion at a discount when it is Suzlon’s most profitable asset?
In our view, while Senvion is attractive as a business, it is the associated acquisition debt that has been problematic for Suzlon. With the entity under corporate debt restructuring (CDR) and its domestic working capital facilities frozen, Suzlon has missed out on sourcing and executing new orders in its core domestic markets. It entered into a trap, from which it was not able to come out of, as we discuss below.
In the aftermath of the global financial crisis in 2008, and subsequent withdrawal of incentives for wind power installations in India in 2012, SUEL’s interest costs ballooned and the company defaulted on its FCCB repayment that year (USD209mn in Oct 2012). The company was thus saddled with huge debt and it also did not have necessary permissions to use the cash reserves of Senvion to pay out the domestic debt.
Moreover, as per our discussion with SUEL, Senvion’s cash flows were ring-fenced by its lenders, such that even for the repayment of the debt incurred for the acquisition of Senvion, SUEL could not use Senvion’s cash flows. As such, servicing the interest and repayment on the hefty INR170bn debt has been a massive challenge for SUEL.
Over the past two years, SUEL has sold off some of its non-core assets but the amount generated from these transactions was insufficient in the context of the massive INR170bn debt it was facing.
Thus, we believe that SUEL had little choice but to sell Senvion to quickly retire its debt. On valuations, we note that while the trading multiples of peers might be at a premium, 100% stake sales, and to a private equity entity at that, are often at discounts to current valuations, especially if made under distress.
Total Consideration
Upfront Cash € 1 bn
Future Earn Out € 50 mn (subject to conditions)
Licensing Arrangements - Receives
India - Offshore Suzlon to receive Offshore technology license for India market
Licensing Arrangements - Gives
US markets Senvion to get license for Suzlon's S111 product for US market
Nomura | Suzlon Energy 6 April 2015
5
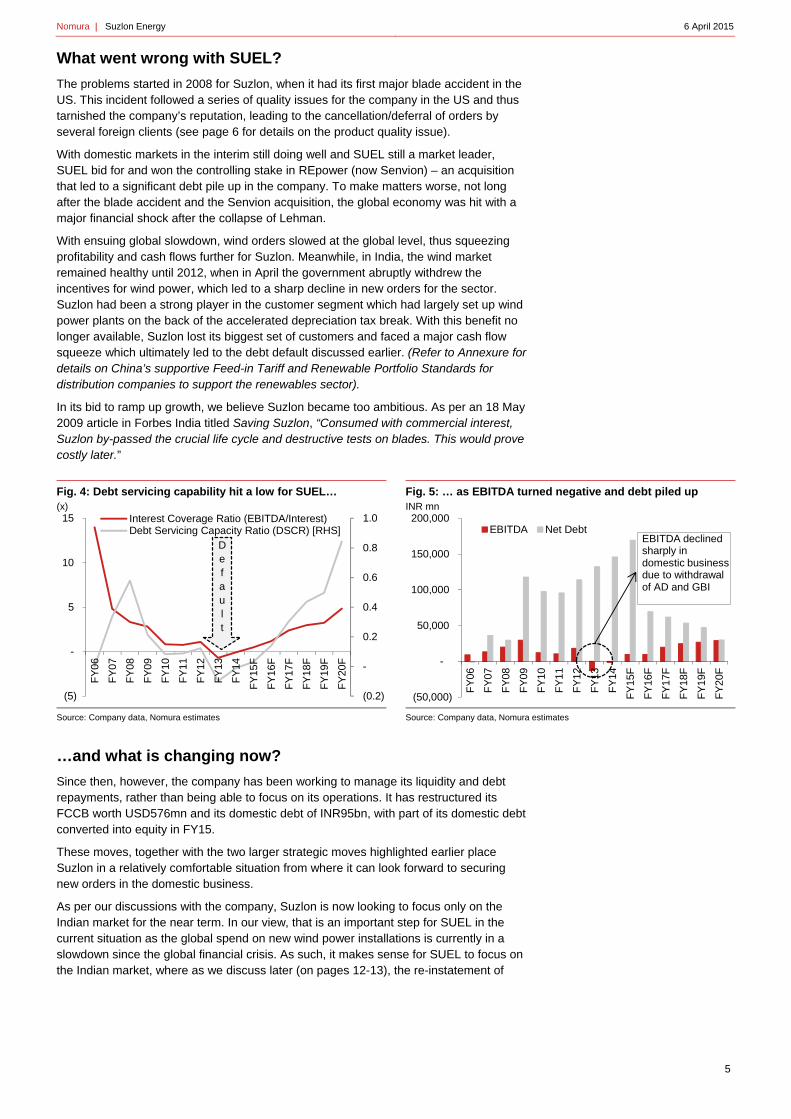
What went wrong with SUEL?
The problems started in 2008 for Suzlon, when it had its first major blade accident in the US. This incident followed a series of quality issues for the company in the US and thus tarnished the company’s reputation, leading to the cancellation/deferral of orders by several foreign clients (see page 6 for details on the product quality issue).
With domestic markets in the interim still doing well and SUEL still a market leader, SUEL bid for and won the controlling stake in REpower (now Senvion) – an acquisition that led to a significant debt pile up in the company. To make matters worse, not long after the blade accident and the Senvion acquisition, the global economy was hit with a major financial shock after the collapse of Lehman.
With ensuing global slowdown, wind orders slowed at the global level, thus squeezing profitability and cash flows further for Suzlon. Meanwhile, in India, the wind market remained healthy until 2012, when in April the government abruptly withdrew the incentives for wind power, which led to a sharp decline in new orders for the sector. Suzlon had been a strong player in the customer segment which had largely set up wind power plants on the back of the accelerated depreciation tax break. With this benefit no longer available, Suzlon lost its biggest set of customers and faced a major cash flow squeeze which ultimately led to the debt default discussed earlier. (Refer to Annexure for details on China’s supportive Feed-in Tariff and Renewable Portfolio Standards for distribution companies to support the renewables sector).
In its bid to ramp up growth, we believe Suzlon became too ambitious. As per an 18 May 2009 article in Forbes India titled Saving Suzlon, “Consumed with commercial interest, Suzlon by-passed the crucial life cycle and destructive tests on blades. This would prove costly later.”
Fig. 4: Debt servicing capability hit a low for SUEL… (x)
Source: Company data, Nomura estimates
Fig. 5: … as EBITDA turned negative and debt piled up INR mn
Source: Company data, Nomura estimates
…and what is changing now?
Since then, however, the company has been working to manage its liquidity and debt repayments, rather than being able to focus on its operations. It has restructured its FCCB worth USD576mn and its domestic debt of INR95bn, with part of its domestic debt converted into equity in FY15.
These moves, together with the two larger strategic moves highlighted earlier place Suzlon in a relatively comfortable situation from where it can look forward to securing new orders in the domestic business.
As per our discussions with the company, Suzlon is now looking to focus only on the Indian market for the near term. In our view, that is an important step for SUEL in the current situation as the global spend on new wind power installations is currently in a slowdown since the global financial crisis. As such, it makes sense for SUEL to focus on the Indian market, where as we discuss later (on pages 12-13), the re-instatement of
(0.2)
-
0.2
0.4
0.6
0.8
1.0
(5)
-
5
10
15
FY
06
FY
07
FY
08
FY
09
FY
10
FY
11
FY
12
FY
13
FY
14
FY
15F
FY
16F
FY
17F
FY
18F
FY
19F
FY
20F
Interest Coverage Ratio (EBITDA/Interest)Debt Servicing Capacity Ratio (DSCR) [RHS]
Default
(50,000)
-
50,000
100,000
150,000
200,000
FY
06
FY
07
FY
08
FY
09
FY
10
FY
11
FY
12
FY
13
FY
14
FY
15F
FY
16F
FY
17F
FY
18F
FY
19F
FY
20F
EBITDA Net DebtEBITDA declined sharply in domestic business due to withdrawal of AD and GBI
Nomura | Suzlon Energy 6 April 2015
6
incentives for the sector and supportive government policies are likely to drive a resurgence of demand for wind equipment.
Moreover, Suzlon has historically been a very strong player in the Indian market with over 50% market share. It still operates and manages (on behalf of its customers) ~38% of the total installed wind capacity in India. Thus, it has a rich experience of working with the local authorities, securing land, working with the often difficult state electricity boards or distribution companies (discoms), and managing difficult logistics/transportation requirements in India. As per our feedback from the industry not only for the wind power equipment market but even for other capital goods components, foreign companies have often found the conditions in India difficult when related to managing local authorities, land issues, transmission or logistical issues, etc. As such, we think SUEL is best placed to win back its 50% market share within a short span of time.
Its order backlog of ~1.15GW (bulk of this in India) already implies ~40% market share of potential installations in India in FY16F.
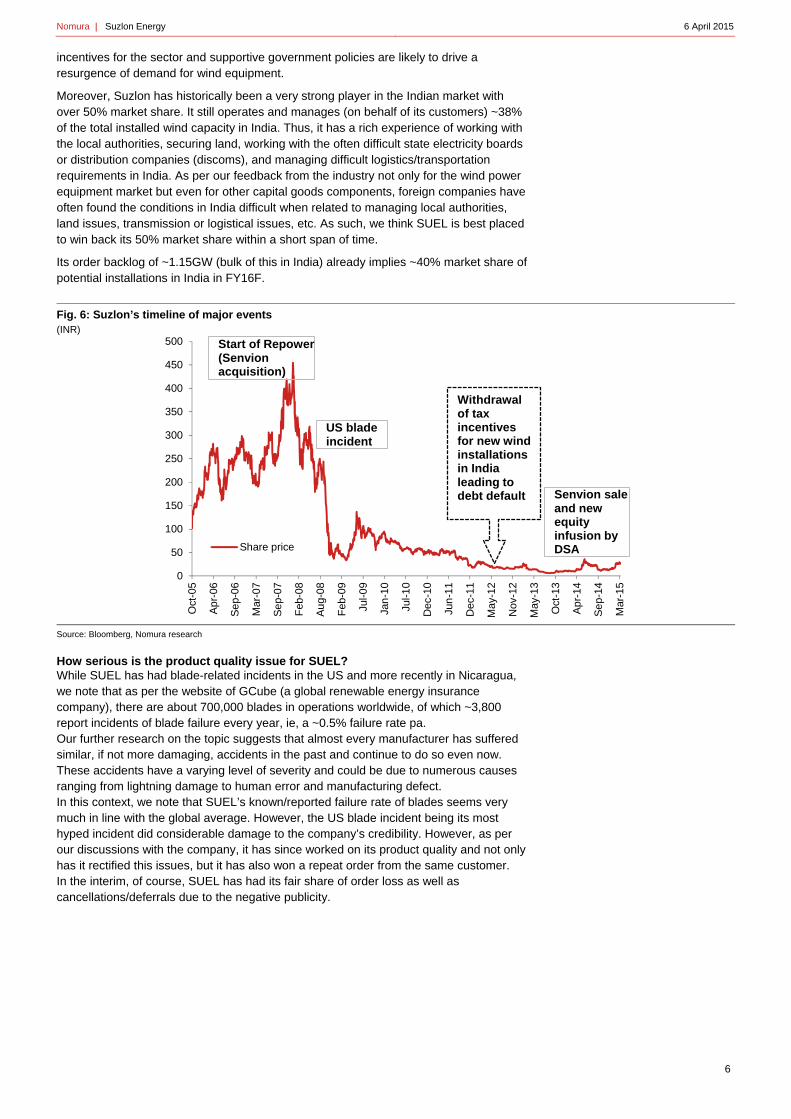
Fig. 6: Suzlon’s timeline of major events (INR)
Source: Bloomberg, Nomura research
How serious is the product quality issue for SUEL? While SUEL has had blade-related incidents in the US and more recently in Nicaragua, we note that as per the website of GCube (a global renewable energy insurance company), there are about 700,000 blades in operations worldwide, of which ~3,800 report incidents of blade failure every year, ie, a ~0.5% failure rate pa. Our further research on the topic suggests that almost every manufacturer has suffered similar, if not more damaging, accidents in the past and continue to do so even now. These accidents have a varying level of severity and could be due to numerous causes ranging from lightning damage to human error and manufacturing defect. In this context, we note that SUEL’s known/reported failure rate of blades seems very much in line with the global average. However, the US blade incident being its most hyped incident did considerable damage to the company’s credibility. However, as per our discussions with the company, it has since worked on its product quality and not only has it rectified this issues, but it has also won a repeat order from the same customer. In the interim, of course, SUEL has had its fair share of order loss as well as cancellations/deferrals due to the negative publicity.
0
50
100
150
200
250
300
350
400
450
500
Oct
-05
Ap
r-06
Se
p-06
Mar
-07
Se
p-07
Feb
-08
Au
g-08
Feb
-09
Jul-0
9
Jan
-10
Jul-1
0
Dec
-10
Jun
-11
Dec
-11
May
-12
Nov
-12
May
-13
Oct
-13
Ap
r-14
Se
p-14
Mar
-15
Share price
Start of Repower (Senvion acquisition)
US blade incident
Senvion sale and new equity infusion by DSA
Withdrawal of tax incentives for new wind installations in India leading to debt default
Nomura | Suzlon Energy 6 April 2015
7
Key investment thesis
Bright medium-term prospects for India’s wind industry
India’s new government has announced an ambitious target to set up 60GW of cumulative wind power capacity by 2022, following up on this by restoring the erstwhile accelerated depreciation (AD) tax break for financial investors in wind power. Similarly, the outgoing central government had restored the other incentives for wind power for IPPs, ie, generation-based incentives (GBI), but this was not officially announced until Sep 2014.
Our discussions with the Ministry of Natural and Renewable Energy (MNRE) confirm that the central government is committed to renewable energy programmes as outlined by the government. While there are potential near-term challenges on land acquisition, transmission evacuation and financial health of the SEBs, we note that these challenges are omnipresent across the entire power sector. In our view, as these bottlenecks are gradually resolved, they will lend impetus to growth for the sector overall including for renewable energy such as wind power.
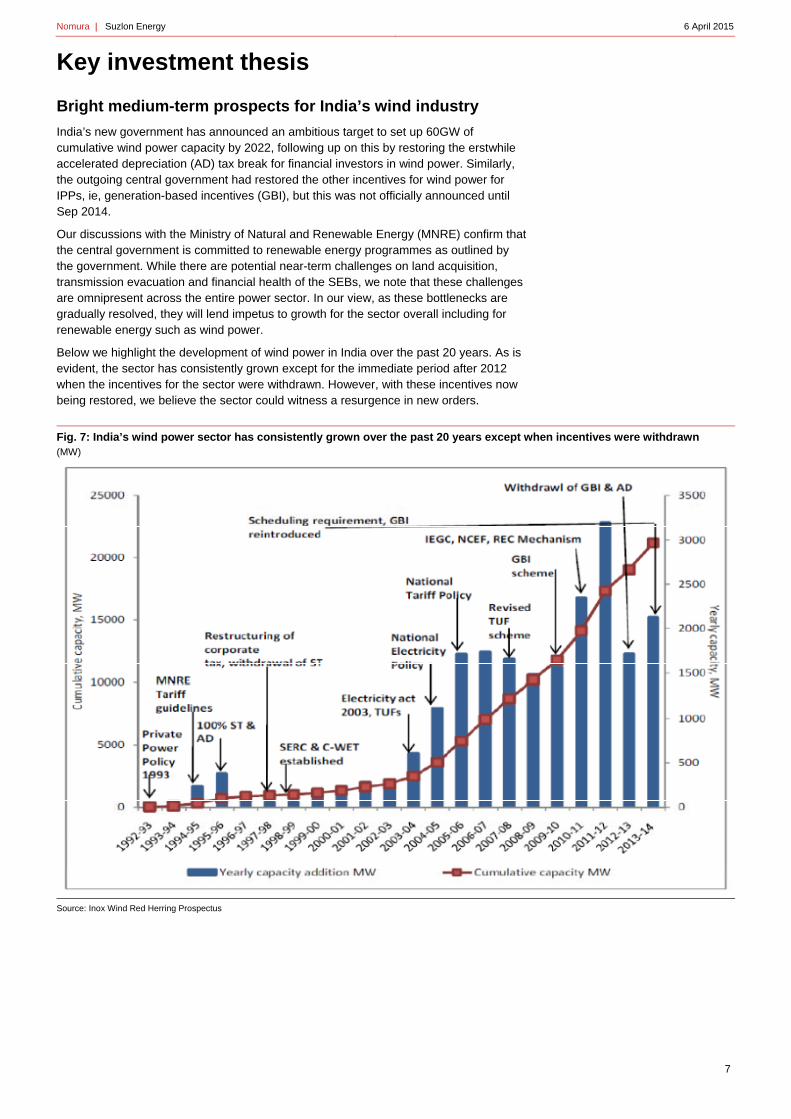
Below we highlight the development of wind power in India over the past 20 years. As is evident, the sector has consistently grown except for the immediate period after 2012 when the incentives for the sector were withdrawn. However, with these incentives now being restored, we believe the sector could witness a resurgence in new orders.
Fig. 7: India’s wind power sector has consistently grown over the past 20 years except when incentives were withdrawn (MW)
Source: Inox Wind Red Herring Prospectus
Nomura | Suzlon Energy 6 April 2015
8
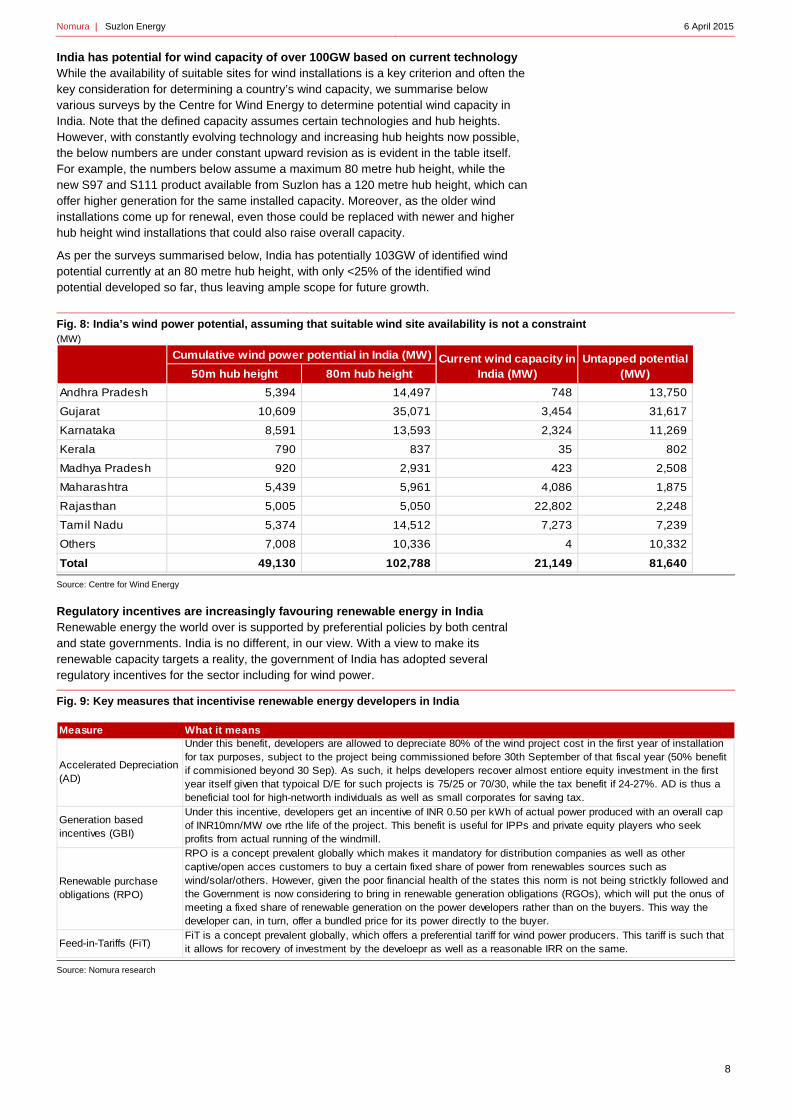
India has potential for wind capacity of over 100GW based on current technology While the availability of suitable sites for wind installations is a key criterion and often the key consideration for determining a country’s wind capacity, we summarise below various surveys by the Centre for Wind Energy to determine potential wind capacity in India. Note that the defined capacity assumes certain technologies and hub heights. However, with constantly evolving technology and increasing hub heights now possible, the below numbers are under constant upward revision as is evident in the table itself. For example, the numbers below assume a maximum 80 metre hub height, while the new S97 and S111 product available from Suzlon has a 120 metre hub height, which can offer higher generation for the same installed capacity. Moreover, as the older wind installations come up for renewal, even those could be replaced with newer and higher hub height wind installations that could also raise overall capacity.
As per the surveys summarised below, India has potentially 103GW of identified wind potential currently at an 80 metre hub height, with only <25% of the identified wind potential developed so far, thus leaving ample scope for future growth.
Fig. 8: India’s wind power potential, assuming that suitable wind site availability is not a constraint (MW)
Source: Centre for Wind Energy
Regulatory incentives are increasingly favouring renewable energy in India Renewable energy the world over is supported by preferential policies by both central and state governments. India is no different, in our view. With a view to make its renewable capacity targets a reality, the government of India has adopted several regulatory incentives for the sector including for wind power. Fig. 9: Key measures that incentivise renewable energy developers in India
Source: Nomura research
50m hub height 80m hub height
Andhra Pradesh 5,394 14,497 748 13,750
Gujarat 10,609 35,071 3,454 31,617
Karnataka 8,591 13,593 2,324 11,269
Kerala 790 837 35 802
Madhya Pradesh 920 2,931 423 2,508
Maharashtra 5,439 5,961 4,086 1,875
Rajasthan 5,005 5,050 22,802 2,248
Tamil Nadu 5,374 14,512 7,273 7,239
Others 7,008 10,336 4 10,332
Total 49,130 102,788 21,149 81,640
Cumulative wind power potential in India (MW) Current wind capacity in India (MW)
Untapped potential (MW)
Measure What it means
Accelerated Depreciation (AD)
Under this benefit, developers are allowed to depreciate 80% of the wind project cost in the first year of installation for tax purposes, subject to the project being commissioned before 30th September of that fiscal year (50% benefit if commisioned beyond 30 Sep). As such, it helps developers recover almost entiore equity investment in the first year itself given that typoical D/E for such projects is 75/25 or 70/30, while the tax benefit if 24-27%. AD is thus a beneficial tool for high-networth individuals as well as small corporates for saving tax.
Generation based incentives (GBI)
Under this incentive, developers get an incentive of INR 0.50 per kWh of actual power produced with an overall cap of INR10mn/MW ove rthe life of the project. This benefit is useful for IPPs and private equity players who seek profits from actual running of the windmill.
Renewable purchase obligations (RPO)
RPO is a concept prevalent globally which makes it mandatory for distribution companies as well as other captive/open acces customers to buy a certain fixed share of power from renewables sources such as wind/solar/others. However, given the poor financial health of the states this norm is not being strictkly followed and the Government is now considering to bring in renewable generation obligations (RGOs), which will put the onus of meeting a fixed share of renewable generation on the power developers rather than on the buyers. This way the developer can, in turn, offer a bundled price for its power directly to the buyer.
Feed-in-Tariffs (FiT)FiT is a concept prevalent globally, which offers a preferential tariff for wind power producers. This tariff is such that it allows for recovery of investment by the develoepr as well as a reasonable IRR on the same.
Nomura | Suzlon Energy 6 April 2015
9
Our discussions with the MNRE suggest that the government is working for further changes in this domain such as complementing the renewable purchase obligations with renewable generation obligations for the power developers.
• Re-introduction of accelerated depreciation (AD) benefit for developers – under this incentive, developers are allowed to depreciate 80% of the project cost in the first full year of operation for tax purposes. This incentive is thus very useful for high-net-worth individuals and captive corporate customers from a tax saving perspective. As we have highlighted before, AD clientele used to be a mainstay for Suzlon until FY12, when this incentive was withdrawn.
• Re-introduction of generation-based incentives (GBI) – through the GBI, the government offers a INR0.50 per unit cash subsidy to developers for promoting actual generation of power rather merely setting up wind projects. This incentive is particularly useful for IPPs and private equity developers who have been using it for sustainable cash flow from the project and to boost their IRRs. The cap on this incentive is 10 years or INR10mn/MW, whichever comes earlier.
• Preferential feed-in tariffs in 12 states for wind power ranging from INR3.51 per kWh (Tamil Nadu) to INR5.92 per kWh for Madhya Pradesh.
• Favourable provisions for wheeling, banking and third-party sale in many states. Wheeling is the facility to transmit power from one place to another using the utility grid, while banking is the facility to bank energy generation for a certain period with a utility so as to utilise the same “on” requirement. The utility charges a fee for providing both these facilities to users.
• National-level dynamic renewable portfolio standard of 5% (2009/10) increasing 1% every year to 15% by 2020 mandated under the National Action Plan on Climate Change (NAPCC).
• Renewable purchase obligation or renewable purchase specification (RPS) announced in 28 states and Union Territories as mandated by the Electricity Act, 2003. However, we note that currently the actual monitoring of the RPO norms in various states is not being fulfilled completely due to poor financial health of the state discoms.
• Renewable Energy Certificate mechanism introduced for inter-state trading of renewable power (solar and non-solar power separately).
• Electricity duty exemptions and concessional levy of cross-subsidy surcharge in the case of third-party sales.
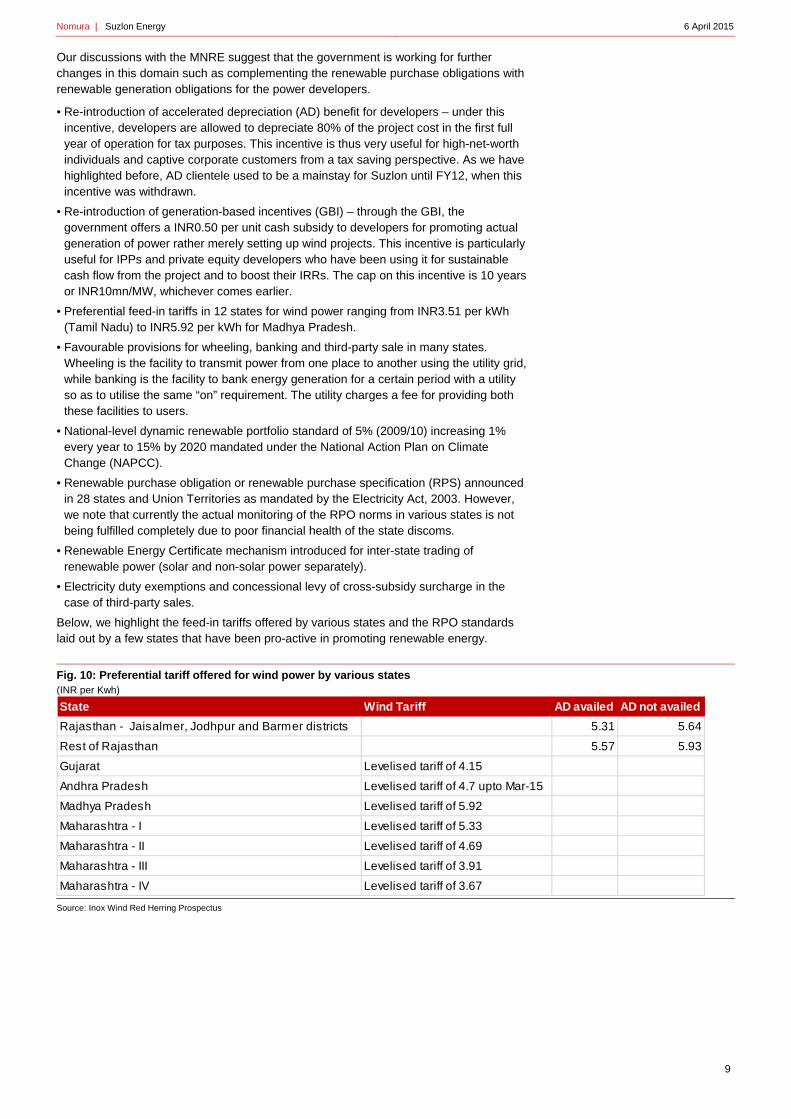
Below, we highlight the feed-in tariffs offered by various states and the RPO standards laid out by a few states that have been pro-active in promoting renewable energy.
Fig. 10: Preferential tariff offered for wind power by various states (INR per Kwh)
Source: Inox Wind Red Herring Prospectus
State Wind Tariff AD availed AD not availed
Rajasthan - Jaisalmer, Jodhpur and Barmer districts 5.31 5.64
Rest of Rajasthan 5.57 5.93
Gujarat Levelised tariff of 4.15
Andhra Pradesh Levelised tariff of 4.7 upto Mar-15
Madhya Pradesh Levelised tariff of 5.92
Maharashtra - I Levelised tariff of 5.33
Maharashtra - II Levelised tariff of 4.69
Maharashtra - III Levelised tariff of 3.91
Maharashtra - IV Levelised tariff of 3.67
Nomura | Suzlon Energy 6 April 2015
10
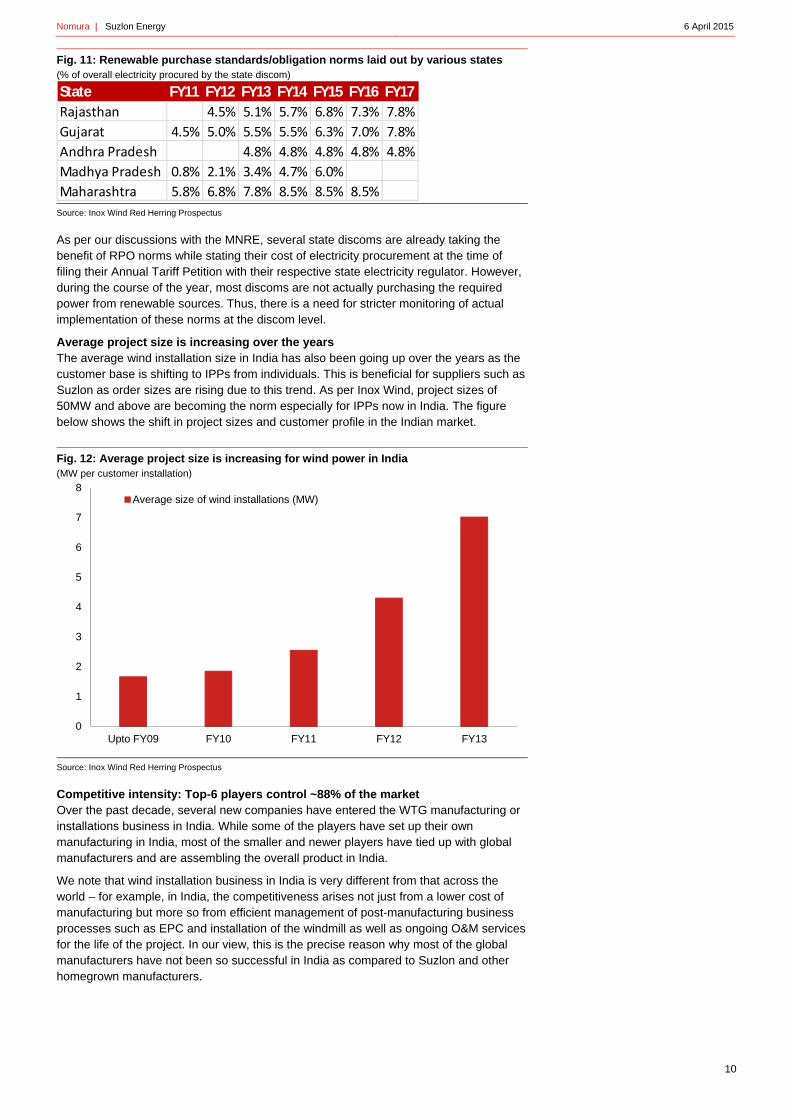
Fig. 11: Renewable purchase standards/obligation norms laid out by various states (% of overall electricity procured by the state discom)
Source: Inox Wind Red Herring Prospectus
As per our discussions with the MNRE, several state discoms are already taking the benefit of RPO norms while stating their cost of electricity procurement at the time of filing their Annual Tariff Petition with their respective state electricity regulator. However, during the course of the year, most discoms are not actually purchasing the required power from renewable sources. Thus, there is a need for stricter monitoring of actual implementation of these norms at the discom level.
Average project size is increasing over the years The average wind installation size in India has also been going up over the years as the customer base is shifting to IPPs from individuals. This is beneficial for suppliers such as Suzlon as order sizes are rising due to this trend. As per Inox Wind, project sizes of 50MW and above are becoming the norm especially for IPPs now in India. The figure below shows the shift in project sizes and customer profile in the Indian market.
Fig. 12: Average project size is increasing for wind power in India (MW per customer installation)
Source: Inox Wind Red Herring Prospectus
Competitive intensity: Top-6 players control ~88% of the market Over the past decade, several new companies have entered the WTG manufacturing or installations business in India. While some of the players have set up their own manufacturing in India, most of the smaller and newer players have tied up with global manufacturers and are assembling the overall product in India.
We note that wind installation business in India is very different from that across the world – for example, in India, the competitiveness arises not just from a lower cost of manufacturing but more so from efficient management of post-manufacturing business processes such as EPC and installation of the windmill as well as ongoing O&M services for the life of the project. In our view, this is the precise reason why most of the global manufacturers have not been so successful in India as compared to Suzlon and other homegrown manufacturers.
State FY11 FY12 FY13 FY14 FY15 FY16 FY17
Rajasthan 4.5% 5.1% 5.7% 6.8% 7.3% 7.8%
Gujarat 4.5% 5.0% 5.5% 5.5% 6.3% 7.0% 7.8%
Andhra Pradesh 4.8% 4.8% 4.8% 4.8% 4.8%
Madhya Pradesh 0.8% 2.1% 3.4% 4.7% 6.0%
Maharashtra 5.8% 6.8% 7.8% 8.5% 8.5% 8.5%
0
1
2
3
4
5
6
7
8
Upto FY09 FY10 FY11 FY12 FY13
Average size of wind installations (MW)
Nomura | Suzlon Energy 6 April 2015
11
Therefore, even though the overall manufacturing capacity in India has grown to ~10.5GW pa, we note that ~88% of total annual capacity installations were attributable to just the top-6 manufacturers in FY14, according to the WISE Report. Among the newer entrants, Gamesa India, Inox and ReGen have gradually established themselves as market-share gainers, while overall Gamesa and Suzlon were the leaders with 19% market share each in FY14. For FY13, Wind World India was the leader with 26% market share.
As we have highlighted in the next figure, Suzlon consistently maintained strong market share in wind power installation in India until FY12, (ie, before its company-specific problems emerged and before the AD incentive was withdrawn).
With these incentives now being restored and Suzlon itself undergoing a major financial restructuring and recapitalisation, we think the company is well placed to recapture 50% market share in the years ahead.
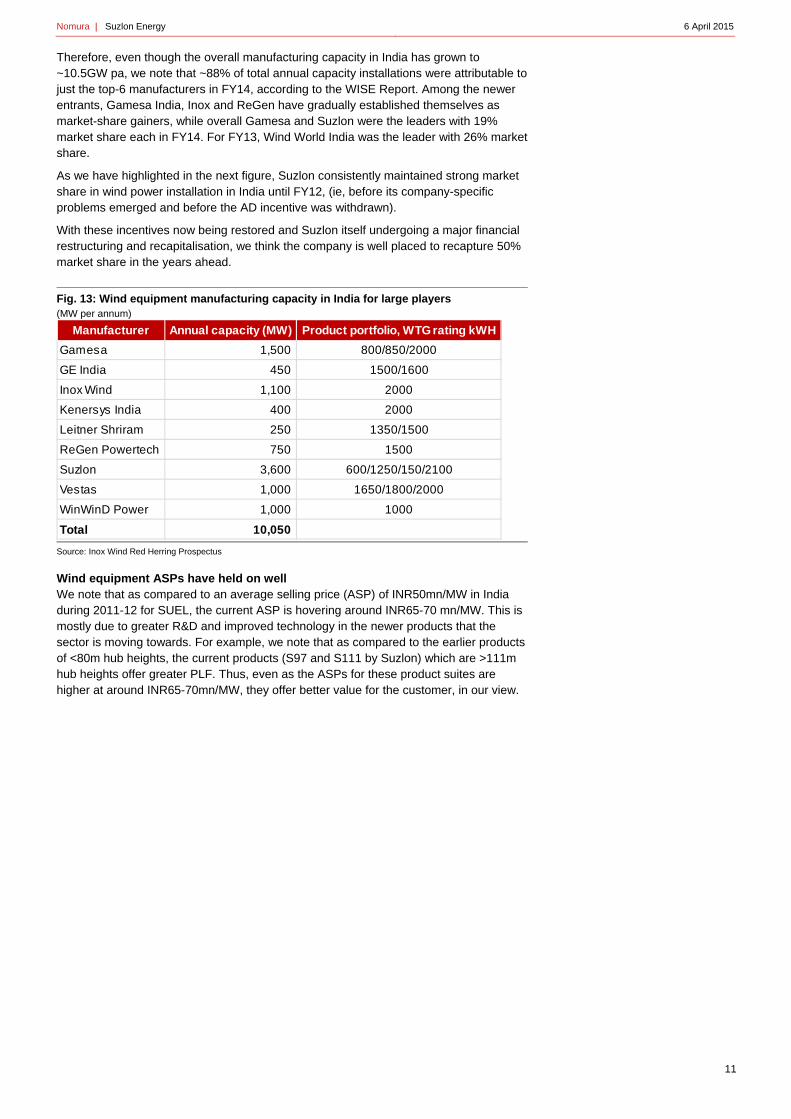
Fig. 13: Wind equipment manufacturing capacity in India for large players (MW per annum)
Source: Inox Wind Red Herring Prospectus
Wind equipment ASPs have held on well We note that as compared to an average selling price (ASP) of INR50mn/MW in India during 2011-12 for SUEL, the current ASP is hovering around INR65-70 mn/MW. This is mostly due to greater R&D and improved technology in the newer products that the sector is moving towards. For example, we note that as compared to the earlier products of <80m hub heights, the current products (S97 and S111 by Suzlon) which are >111m hub heights offer greater PLF. Thus, even as the ASPs for these product suites are higher at around INR65-70mn/MW, they offer better value for the customer, in our view.
Manufacturer Annual capacity (MW) Product portfolio, WTG rating kWH
Gamesa 1,500 800/850/2000
GE India 450 1500/1600
Inox Wind 1,100 2000
Kenersys India 400 2000
Leitner Shriram 250 1350/1500
ReGen Powertech 750 1500
Suzlon 3,600 600/1250/150/2100
Vestas 1,000 1650/1800/2000
WinWinD Power 1,000 1000
Total 10,050
Nomura | Suzlon Energy 6 April 2015
12
Improving wind sector fundamentals and a re-energised balance sheet to drive Suzlon’s market-share gains
On the government’s growing focus on the renewables sector, we expect wind power capacity additions to grow in India. In addition, after its restructuring, Suzlon looks well placed to re-capture lost market share from competitors.
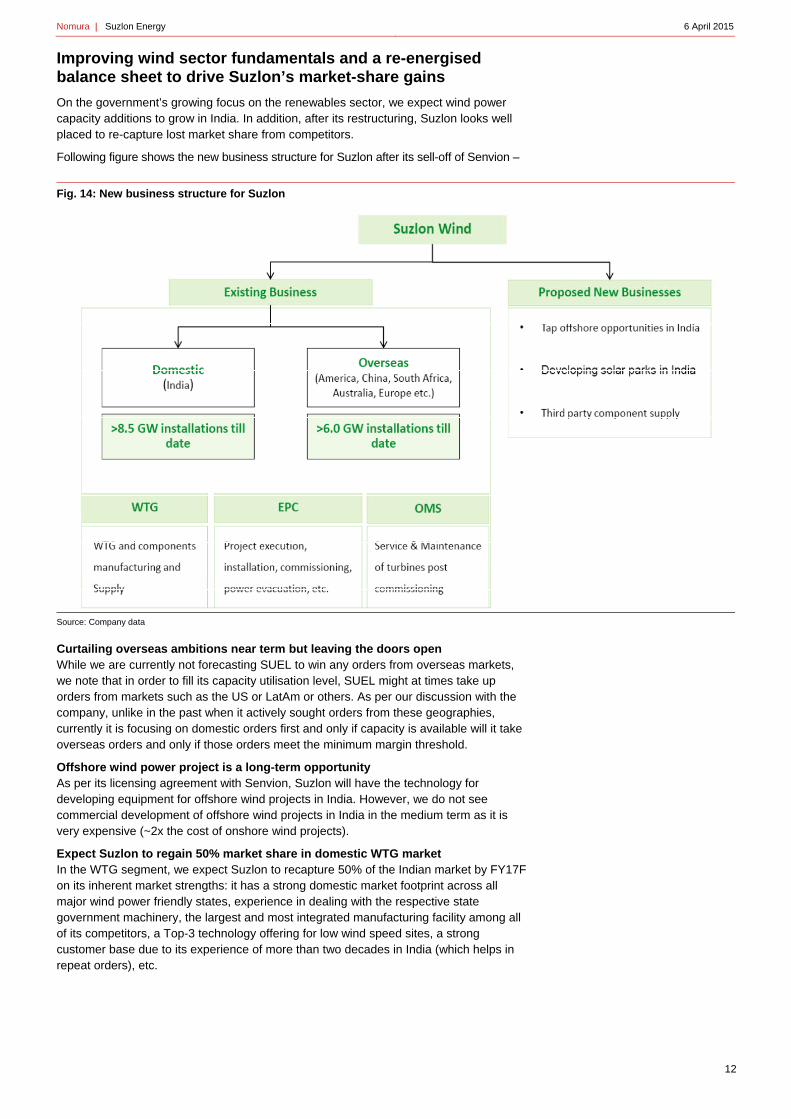
Following figure shows the new business structure for Suzlon after its sell-off of Senvion –
Fig. 14: New business structure for Suzlon
Source: Company data
Curtailing overseas ambitions near term but leaving the doors open While we are currently not forecasting SUEL to win any orders from overseas markets, we note that in order to fill its capacity utilisation level, SUEL might at times take up orders from markets such as the US or LatAm or others. As per our discussion with the company, unlike in the past when it actively sought orders from these geographies, currently it is focusing on domestic orders first and only if capacity is available will it take overseas orders and only if those orders meet the minimum margin threshold.
Offshore wind power project is a long-term opportunity As per its licensing agreement with Senvion, Suzlon will have the technology for developing equipment for offshore wind projects in India. However, we do not see commercial development of offshore wind projects in India in the medium term as it is very expensive (~2x the cost of onshore wind projects).
Expect Suzlon to regain 50% market share in domestic WTG market In the WTG segment, we expect Suzlon to recapture 50% of the Indian market by FY17F on its inherent market strengths: it has a strong domestic market footprint across all major wind power friendly states, experience in dealing with the respective state government machinery, the largest and most integrated manufacturing facility among all of its competitors, a Top-3 technology offering for low wind speed sites, a strong customer base due to its experience of more than two decades in India (which helps in repeat orders), etc.
Nomura | Suzlon Energy 6 April 2015
13
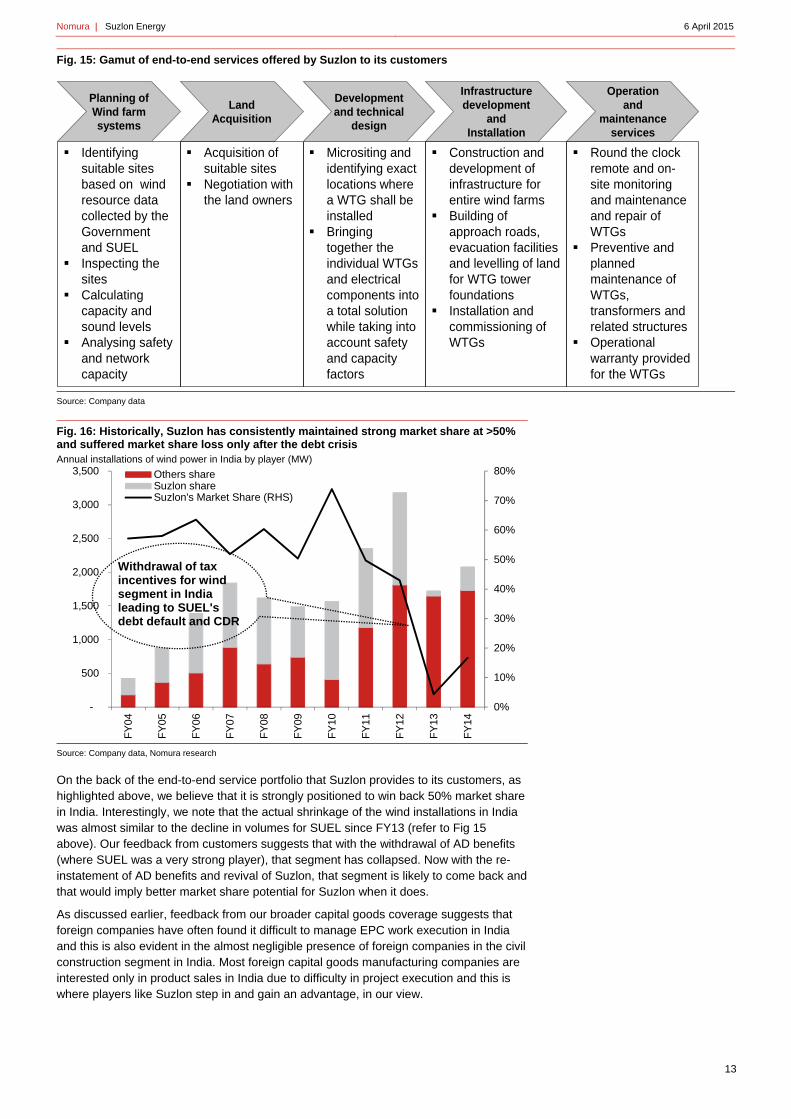
Fig. 15: Gamut of end-to-end services offered by Suzlon to its customers
Source: Company data
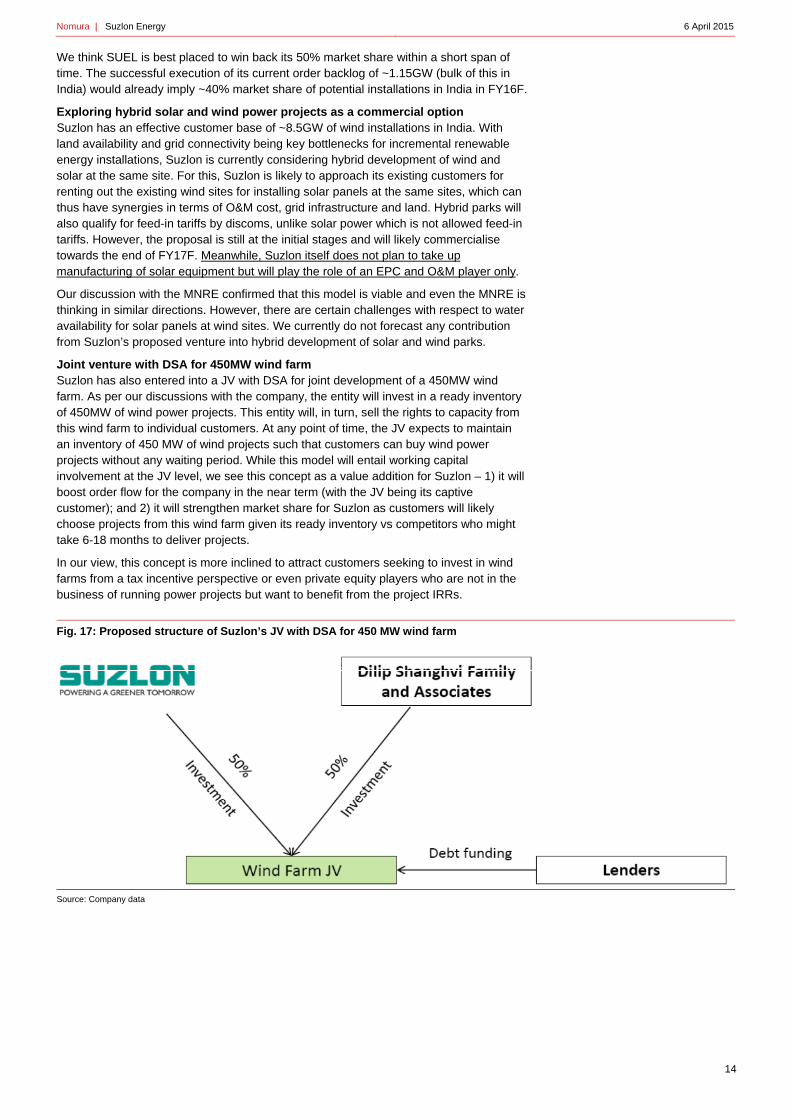
Fig. 16: Historically, Suzlon has consistently maintained strong market share at >50% and suffered market share loss only after the debt crisis Annual installations of wind power in India by player (MW)
Source: Company data, Nomura research
On the back of the end-to-end service portfolio that Suzlon provides to its customers, as highlighted above, we believe that it is strongly positioned to win back 50% market share in India. Interestingly, we note that the actual shrinkage of the wind installations in India was almost similar to the decline in volumes for SUEL since FY13 (refer to Fig 15 above). Our feedback from customers suggests that with the withdrawal of AD benefits (where SUEL was a very strong player), that segment has collapsed. Now with the re-instatement of AD benefits and revival of Suzlon, that segment is likely to come back and that would imply better market share potential for Suzlon when it does.
As discussed earlier, feedback from our broader capital goods coverage suggests that foreign companies have often found it difficult to manage EPC work execution in India and this is also evident in the almost negligible presence of foreign companies in the civil construction segment in India. Most foreign capital goods manufacturing companies are interested only in product sales in India due to difficulty in project execution and this is where players like Suzlon step in and gain an advantage, in our view.
Identifying suitable sites based on wind resource data collected by the Government and SUEL
Inspecting the sites
Calculating capacity and sound levels
Analysing safety and network capacity
Land Acquisition
Acquisition of suitable sites
Negotiation with the land owners
Planning of Wind farm systems
Micrositing and identifying exact locations where a WTG shall be installed
Bringing together the individual WTGs and electrical components into a total solution while taking into account safety and capacity factors
Infrastructure development
and Installation
Construction and development of infrastructure for entire wind farms
Building of approach roads, evacuation facilities and levelling of land for WTG tower foundations
Installation and commissioning of WTGs
Development and technical
design
Operation and
maintenance services
Round the clock remote and on-site monitoring and maintenance and repair of WTGs
Preventive and planned maintenance of WTGs, transformers and related structures
Operational warranty provided for the WTGs
0%
10%
20%
30%
40%
50%
60%
70%
80%
-
500
1,000
1,500
2,000
2,500
3,000
3,500
FY
04
FY
05
FY
06
FY
07
FY
08
FY
09
FY
10
FY
11
FY
12
FY
13
FY
14Others shareSuzlon shareSuzlon's Market Share (RHS)
Withdrawal of tax incentives for wind segment in India leading to SUEL's debt default and CDR
Nomura | Suzlon Energy 6 April 2015
14
We think SUEL is best placed to win back its 50% market share within a short span of time. The successful execution of its current order backlog of ~1.15GW (bulk of this in India) would already imply ~40% market share of potential installations in India in FY16F.
Exploring hybrid solar and wind power projects as a commercial option Suzlon has an effective customer base of ~8.5GW of wind installations in India. With land availability and grid connectivity being key bottlenecks for incremental renewable energy installations, Suzlon is currently considering hybrid development of wind and solar at the same site. For this, Suzlon is likely to approach its existing customers for renting out the existing wind sites for installing solar panels at the same sites, which can thus have synergies in terms of O&M cost, grid infrastructure and land. Hybrid parks will also qualify for feed-in tariffs by discoms, unlike solar power which is not allowed feed-in tariffs. However, the proposal is still at the initial stages and will likely commercialise towards the end of FY17F. Meanwhile, Suzlon itself does not plan to take up manufacturing of solar equipment but will play the role of an EPC and O&M player only.
Our discussion with the MNRE confirmed that this model is viable and even the MNRE is thinking in similar directions. However, there are certain challenges with respect to water availability for solar panels at wind sites. We currently do not forecast any contribution from Suzlon’s proposed venture into hybrid development of solar and wind parks.
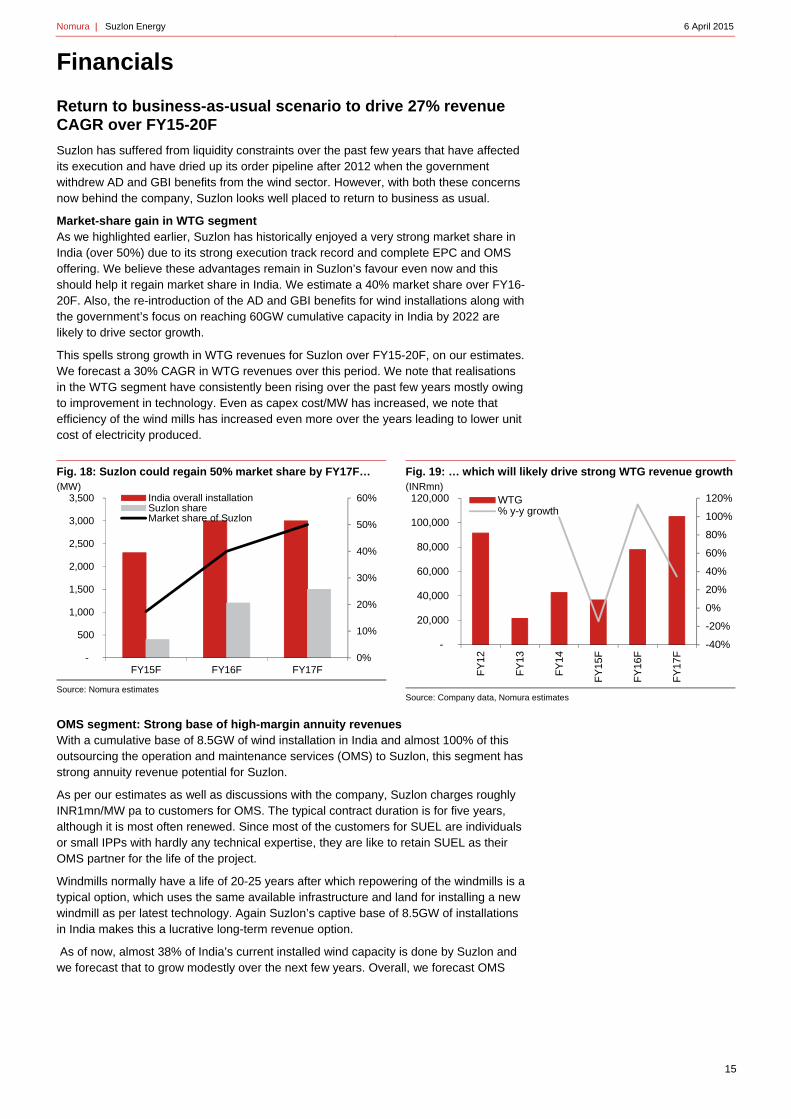
Joint venture with DSA for 450MW wind farm Suzlon has also entered into a JV with DSA for joint development of a 450MW wind farm. As per our discussions with the company, the entity will invest in a ready inventory of 450MW of wind power projects. This entity will, in turn, sell the rights to capacity from this wind farm to individual customers. At any point of time, the JV expects to maintain an inventory of 450 MW of wind projects such that customers can buy wind power projects without any waiting period. While this model will entail working capital involvement at the JV level, we see this concept as a value addition for Suzlon – 1) it will boost order flow for the company in the near term (with the JV being its captive customer); and 2) it will strengthen market share for Suzlon as customers will likely choose projects from this wind farm given its ready inventory vs competitors who might take 6-18 months to deliver projects.
In our view, this concept is more inclined to attract customers seeking to invest in wind farms from a tax incentive perspective or even private equity players who are not in the business of running power projects but want to benefit from the project IRRs.
Fig. 17: Proposed structure of Suzlon’s JV with DSA for 450 MW wind farm
Source: Company data
Nomura | Suzlon Energy 6 April 2015
15
Financials
Return to business-as-usual scenario to drive 27% revenue CAGR over FY15-20F
Suzlon has suffered from liquidity constraints over the past few years that have affected its execution and have dried up its order pipeline after 2012 when the government withdrew AD and GBI benefits from the wind sector. However, with both these concerns now behind the company, Suzlon looks well placed to return to business as usual.
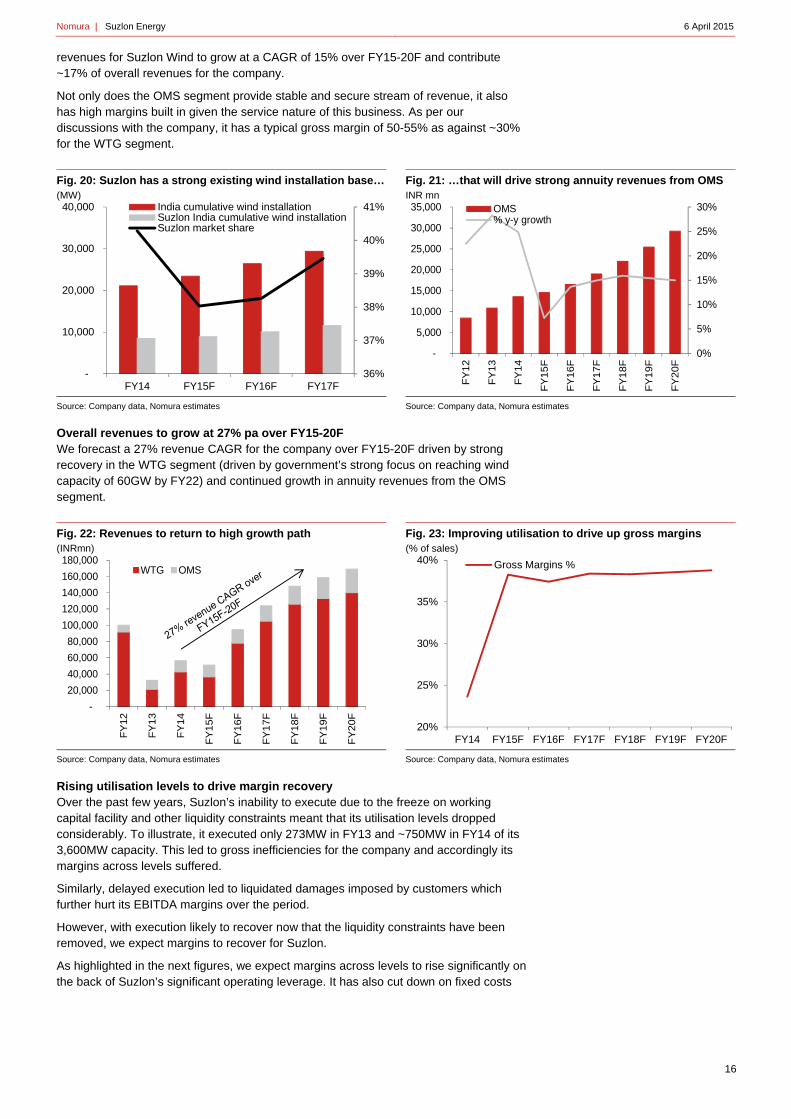
Market-share gain in WTG segment As we highlighted earlier, Suzlon has historically enjoyed a very strong market share in India (over 50%) due to its strong execution track record and complete EPC and OMS offering. We believe these advantages remain in Suzlon’s favour even now and this should help it regain market share in India. We estimate a 40% market share over FY16-20F. Also, the re-introduction of the AD and GBI benefits for wind installations along with the government’s focus on reaching 60GW cumulative capacity in India by 2022 are likely to drive sector growth.
This spells strong growth in WTG revenues for Suzlon over FY15-20F, on our estimates. We forecast a 30% CAGR in WTG revenues over this period. We note that realisations in the WTG segment have consistently been rising over the past few years mostly owing to improvement in technology. Even as capex cost/MW has increased, we note that efficiency of the wind mills has increased even more over the years leading to lower unit cost of electricity produced.
Fig. 18: Suzlon could regain 50% market share by FY17F… (MW)
Source: Nomura estimates
Fig. 19: … which will likely drive strong WTG revenue growth(INRmn)
Source: Company data, Nomura estimates
OMS segment: Strong base of high-margin annuity revenues With a cumulative base of 8.5GW of wind installation in India and almost 100% of this outsourcing the operation and maintenance services (OMS) to Suzlon, this segment has strong annuity revenue potential for Suzlon.
As per our estimates as well as discussions with the company, Suzlon charges roughly INR1mn/MW pa to customers for OMS. The typical contract duration is for five years, although it is most often renewed. Since most of the customers for SUEL are individuals or small IPPs with hardly any technical expertise, they are like to retain SUEL as their OMS partner for the life of the project.
Windmills normally have a life of 20-25 years after which repowering of the windmills is a typical option, which uses the same available infrastructure and land for installing a new windmill as per latest technology. Again Suzlon’s captive base of 8.5GW of installations in India makes this a lucrative long-term revenue option.
As of now, almost 38% of India’s current installed wind capacity is done by Suzlon and we forecast that to grow modestly over the next few years. Overall, we forecast OMS
0%
10%
20%
30%
40%
50%
60%
-
500
1,000
1,500
2,000
2,500
3,000
3,500
FY15F FY16F FY17F
India overall installationSuzlon shareMarket share of Suzlon
-40%
-20%
0%
20%
40%
60%
80%
100%
120%
-
20,000
40,000
60,000
80,000
100,000
120,000
FY
12
FY
13
FY
14
FY
15F
FY
16F
FY
17F
WTG% y-y growth
Nomura | Suzlon Energy 6 April 2015
16
revenues for Suzlon Wind to grow at a CAGR of 15% over FY15-20F and contribute ~17% of overall revenues for the company.
Not only does the OMS segment provide stable and secure stream of revenue, it also has high margins built in given the service nature of this business. As per our discussions with the company, it has a typical gross margin of 50-55% as against ~30% for the WTG segment.
Fig. 20: Suzlon has a strong existing wind installation base…(MW)
Source: Company data, Nomura estimates
Fig. 21: …that will drive strong annuity revenues from OMS INR mn
Source: Company data, Nomura estimates
Overall revenues to grow at 27% pa over FY15-20F We forecast a 27% revenue CAGR for the company over FY15-20F driven by strong recovery in the WTG segment (driven by government’s strong focus on reaching wind capacity of 60GW by FY22) and continued growth in annuity revenues from the OMS segment.
Fig. 22: Revenues to return to high growth path (INRmn)
Source: Company data, Nomura estimates
Fig. 23: Improving utilisation to drive up gross margins (% of sales)
Source: Company data, Nomura estimates
Rising utilisation levels to drive margin recovery Over the past few years, Suzlon’s inability to execute due to the freeze on working capital facility and other liquidity constraints meant that its utilisation levels dropped considerably. To illustrate, it executed only 273MW in FY13 and ~750MW in FY14 of its 3,600MW capacity. This led to gross inefficiencies for the company and accordingly its margins across levels suffered.
Similarly, delayed execution led to liquidated damages imposed by customers which further hurt its EBITDA margins over the period.
However, with execution likely to recover now that the liquidity constraints have been removed, we expect margins to recover for Suzlon.
As highlighted in the next figures, we expect margins across levels to rise significantly on the back of Suzlon’s significant operating leverage. It has also cut down on fixed costs
36%
37%
38%
39%
40%
41%
-
10,000
20,000
30,000
40,000
FY14 FY15F FY16F FY17F
India cumulative wind installationSuzlon India cumulative wind installationSuzlon market share
0%
5%
10%
15%
20%
25%
30%
-
5,000
10,000
15,000
20,000
25,000
30,000
35,000
FY
12
FY
13
FY
14
FY
15F
FY
16F
FY
17F
FY
18F
FY
19F
FY
20F
OMS% y-y growth
-
20,000
40,000
60,000
80,000
100,000
120,000
140,000
160,000
180,000
FY
12
FY
13
FY
14
FY
15F
FY
16F
FY
17F
FY
18F
FY
19F
FY
20F
WTG OMS
20%
25%
30%
35%
40%
FY14 FY15F FY16F FY17F FY18F FY19F FY20F
Gross Margins %
Nomura | Suzlon Energy 6 April 2015
17
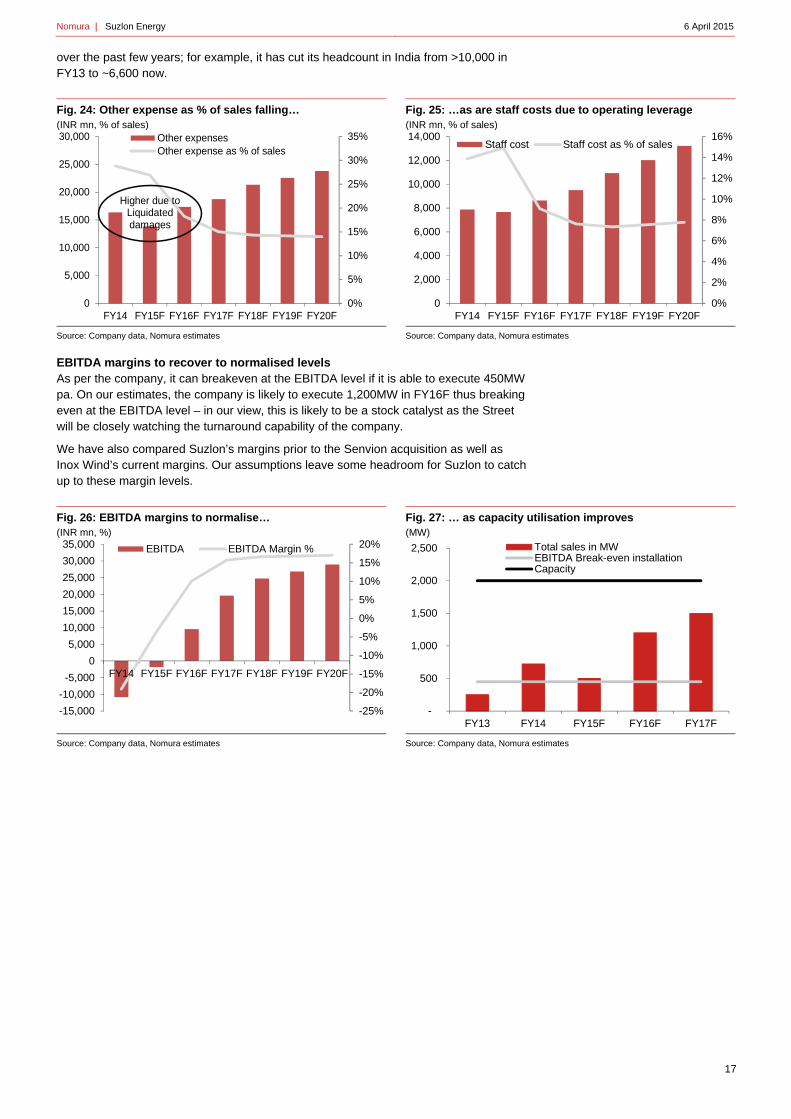
over the past few years; for example, it has cut its headcount in India from >10,000 in FY13 to ~6,600 now.
Fig. 24: Other expense as % of sales falling… (INR mn, % of sales)
Source: Company data, Nomura estimates
Fig. 25: …as are staff costs due to operating leverage (INR mn, % of sales)
Source: Company data, Nomura estimates
EBITDA margins to recover to normalised levels As per the company, it can breakeven at the EBITDA level if it is able to execute 450MW pa. On our estimates, the company is likely to execute 1,200MW in FY16F thus breaking even at the EBITDA level – in our view, this is likely to be a stock catalyst as the Street will be closely watching the turnaround capability of the company.
We have also compared Suzlon’s margins prior to the Senvion acquisition as well as Inox Wind’s current margins. Our assumptions leave some headroom for Suzlon to catch up to these margin levels.
Fig. 26: EBITDA margins to normalise… (INR mn, %)
Source: Company data, Nomura estimates
Fig. 27: … as capacity utilisation improves (MW)
Source: Company data, Nomura estimates
0%
5%
10%
15%
20%
25%
30%
35%
0
5,000
10,000
15,000
20,000
25,000
30,000
FY14 FY15F FY16F FY17F FY18F FY19F FY20F
Other expensesOther expense as % of sales
Higher due to Liquidated damages
0%
2%
4%
6%
8%
10%
12%
14%
16%
0
2,000
4,000
6,000
8,000
10,000
12,000
14,000
FY14 FY15F FY16F FY17F FY18F FY19F FY20F
Staff cost Staff cost as % of sales
-25%
-20%
-15%
-10%
-5%
0%
5%
10%
15%
20%
-15,000
-10,000
-5,000
0
5,000
10,000
15,000
20,000
25,000
30,000
35,000
FY14 FY15F FY16F FY17F FY18F FY19F FY20F
EBITDA EBITDA Margin %
-
500
1,000
1,500
2,000
2,500
FY13 FY14 FY15F FY16F FY17F
Total sales in MWEBITDA Break-even installationCapacity
Nomura | Suzlon Energy 6 April 2015
18
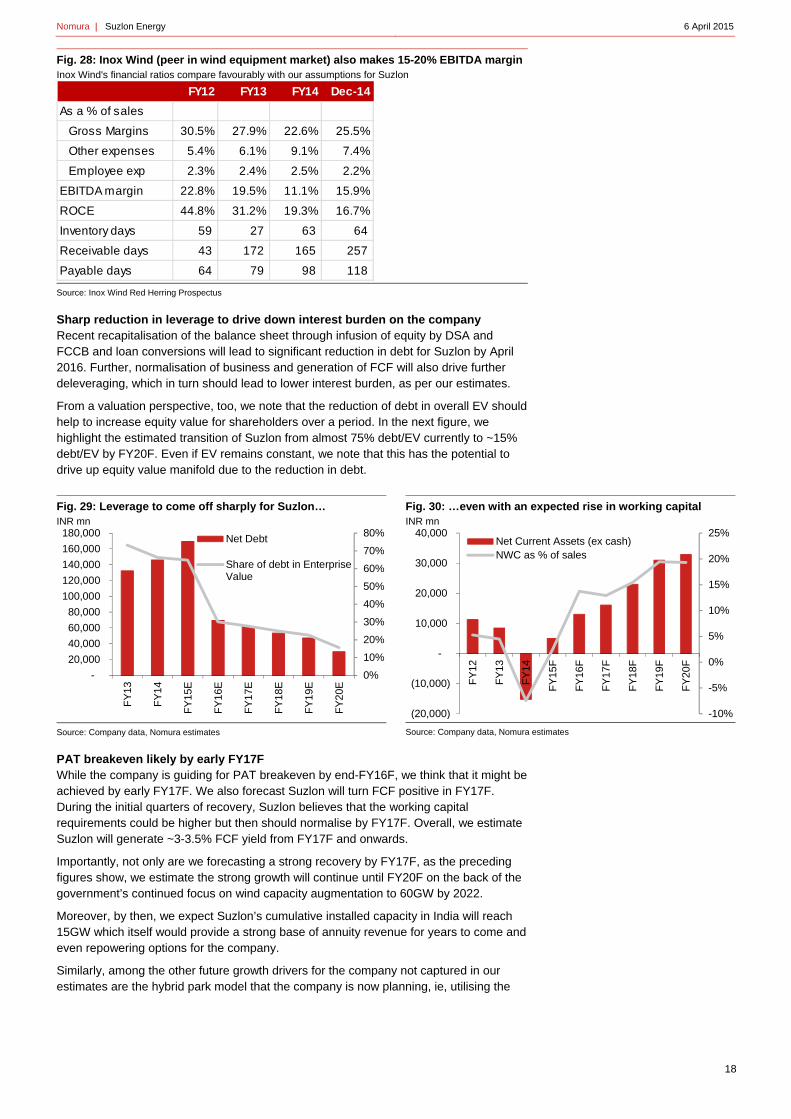
Fig. 28: Inox Wind (peer in wind equipment market) also makes 15-20% EBITDA margin Inox Wind's financial ratios compare favourably with our assumptions for Suzlon
Source: Inox Wind Red Herring Prospectus
Sharp reduction in leverage to drive down interest burden on the company Recent recapitalisation of the balance sheet through infusion of equity by DSA and FCCB and loan conversions will lead to significant reduction in debt for Suzlon by April 2016. Further, normalisation of business and generation of FCF will also drive further deleveraging, which in turn should lead to lower interest burden, as per our estimates.
From a valuation perspective, too, we note that the reduction of debt in overall EV should help to increase equity value for shareholders over a period. In the next figure, we highlight the estimated transition of Suzlon from almost 75% debt/EV currently to ~15% debt/EV by FY20F. Even if EV remains constant, we note that this has the potential to drive up equity value manifold due to the reduction in debt.
Fig. 29: Leverage to come off sharply for Suzlon… INR mn
Source: Company data, Nomura estimates
Fig. 30: …even with an expected rise in working capital INR mn
Source: Company data, Nomura estimates
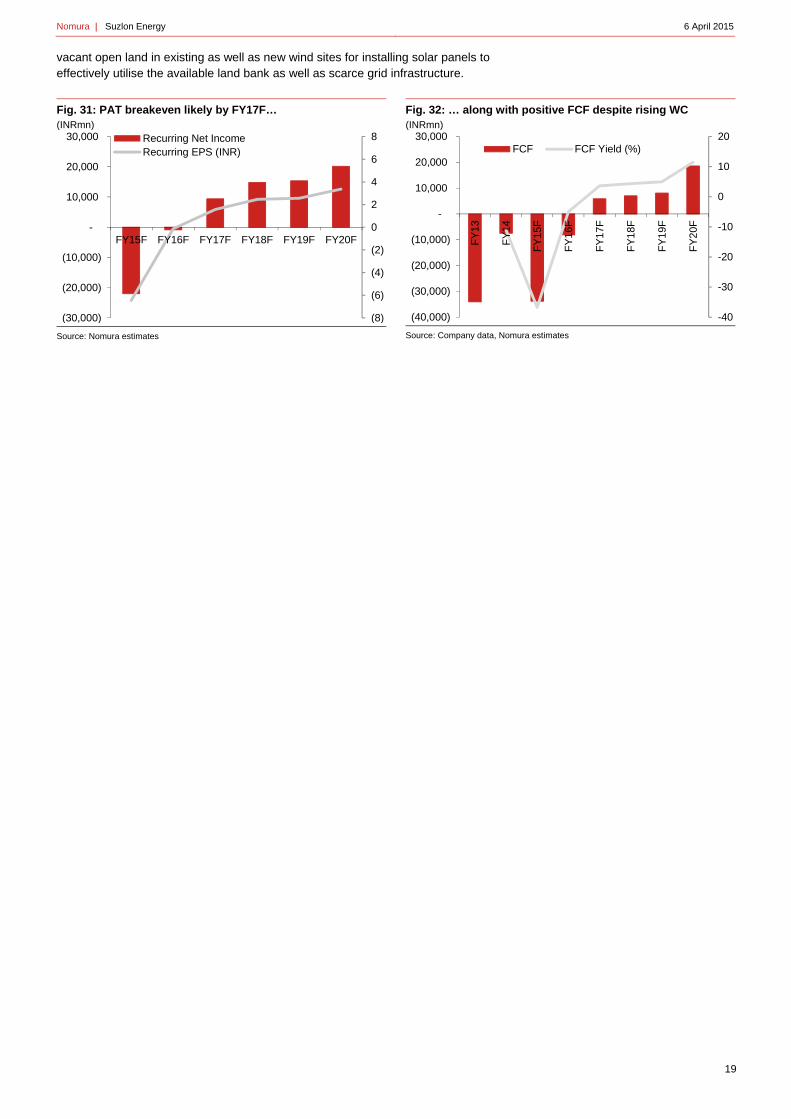
PAT breakeven likely by early FY17F While the company is guiding for PAT breakeven by end-FY16F, we think that it might be achieved by early FY17F. We also forecast Suzlon will turn FCF positive in FY17F. During the initial quarters of recovery, Suzlon believes that the working capital requirements could be higher but then should normalise by FY17F. Overall, we estimate Suzlon will generate ~3-3.5% FCF yield from FY17F and onwards.
Importantly, not only are we forecasting a strong recovery by FY17F, as the preceding figures show, we estimate the strong growth will continue until FY20F on the back of the government’s continued focus on wind capacity augmentation to 60GW by 2022.
Moreover, by then, we expect Suzlon’s cumulative installed capacity in India will reach 15GW which itself would provide a strong base of annuity revenue for years to come and even repowering options for the company.
Similarly, among the other future growth drivers for the company not captured in our estimates are the hybrid park model that the company is now planning, ie, utilising the
FY12 FY13 FY14 Dec-14
As a % of sales
Gross Margins 30.5% 27.9% 22.6% 25.5%
Other expenses 5.4% 6.1% 9.1% 7.4%
Employee exp 2.3% 2.4% 2.5% 2.2%
EBITDA margin 22.8% 19.5% 11.1% 15.9%
ROCE 44.8% 31.2% 19.3% 16.7%
Inventory days 59 27 63 64
Receivable days 43 172 165 257
Payable days 64 79 98 118
0%
10%
20%
30%
40%
50%
60%
70%
80%
-
20,000
40,000
60,000
80,000
100,000
120,000
140,000
160,000
180,000
FY
13
FY
14
FY
15E
FY
16E
FY
17E
FY
18E
FY
19E
FY
20E
Net Debt
Share of debt in EnterpriseValue
-10%
-5%
0%
5%
10%
15%
20%
25%
(20,000)
(10,000)
-
10,000
20,000
30,000
40,000
FY
12
FY
13
FY
14
FY
15F
FY
16F
FY
17F
FY
18F
FY
19F
FY
20F
Net Current Assets (ex cash)NWC as % of sales
Nomura | Suzlon Energy 6 April 2015
19
vacant open land in existing as well as new wind sites for installing solar panels to effectively utilise the available land bank as well as scarce grid infrastructure.
Fig. 31: PAT breakeven likely by FY17F… (INRmn)
Source: Nomura estimates
Fig. 32: … along with positive FCF despite rising WC (INRmn)
Source: Company data, Nomura estimates
(8)
(6)
(4)
(2)
0
2
4
6
8
(30,000)
(20,000)
(10,000)
-
10,000
20,000
30,000
FY15F FY16F FY17F FY18F FY19F FY20F
Recurring Net IncomeRecurring EPS (INR)
-40
-30
-20
-10
0
10
20
(40,000)
(30,000)
(20,000)
(10,000)
-
10,000
20,000
30,000
FY
13
FY
14
FY
15F
FY
16F
FY
17F
FY
18F
FY
19F
FY
20F
FCF FCF Yield (%)
Nomura | Suzlon Energy 6 April 2015
20
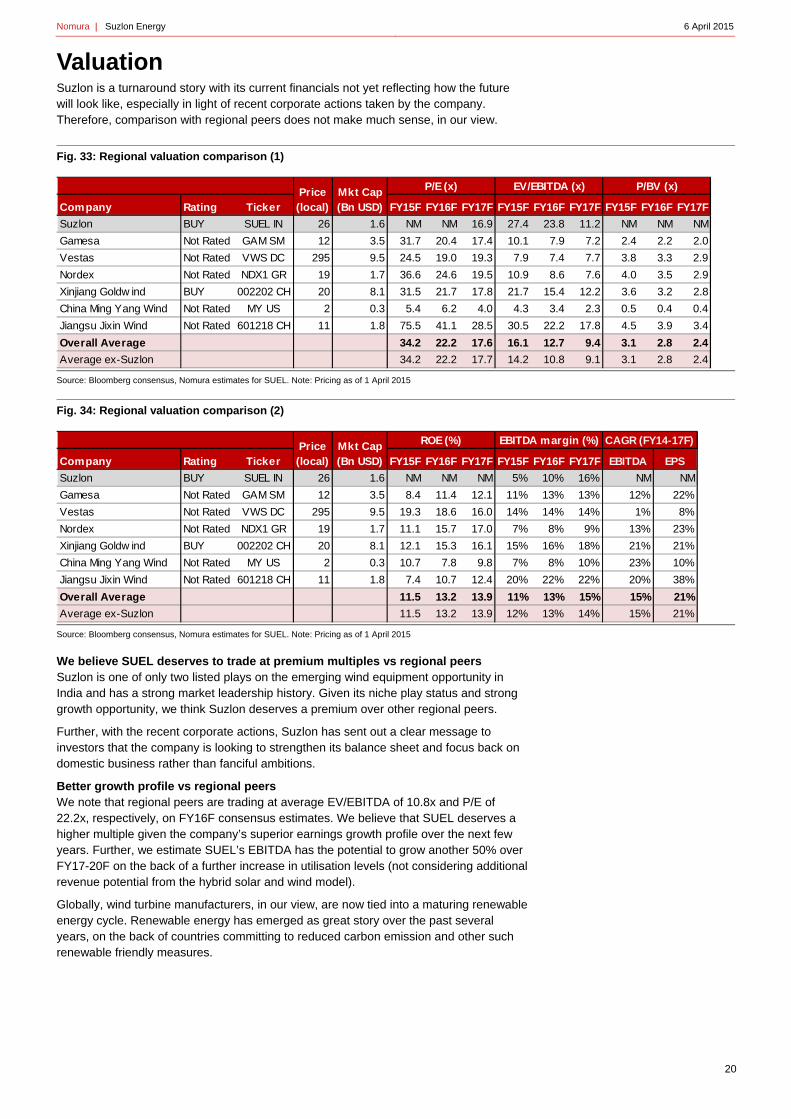
Valuation Suzlon is a turnaround story with its current financials not yet reflecting how the future will look like, especially in light of recent corporate actions taken by the company. Therefore, comparison with regional peers does not make much sense, in our view.
Fig. 33: Regional valuation comparison (1)
Source: Bloomberg consensus, Nomura estimates for SUEL. Note: Pricing as of 1 April 2015
Fig. 34: Regional valuation comparison (2)
Source: Bloomberg consensus, Nomura estimates for SUEL. Note: Pricing as of 1 April 2015
We believe SUEL deserves to trade at premium multiples vs regional peers Suzlon is one of only two listed plays on the emerging wind equipment opportunity in India and has a strong market leadership history. Given its niche play status and strong growth opportunity, we think Suzlon deserves a premium over other regional peers.
Further, with the recent corporate actions, Suzlon has sent out a clear message to investors that the company is looking to strengthen its balance sheet and focus back on domestic business rather than fanciful ambitions.
Better growth profile vs regional peers We note that regional peers are trading at average EV/EBITDA of 10.8x and P/E of 22.2x, respectively, on FY16F consensus estimates. We believe that SUEL deserves a higher multiple given the company’s superior earnings growth profile over the next few years. Further, we estimate SUEL’s EBITDA has the potential to grow another 50% over FY17-20F on the back of a further increase in utilisation levels (not considering additional revenue potential from the hybrid solar and wind model).
Globally, wind turbine manufacturers, in our view, are now tied into a maturing renewable energy cycle. Renewable energy has emerged as great story over the past several years, on the back of countries committing to reduced carbon emission and other such renewable friendly measures.
Company Rating Ticker FY15F FY16F FY17F FY15F FY16F FY17F FY15F FY16F FY17F
Suzlon BUY SUEL IN 26 1.6 NM NM 16.9 27.4 23.8 11.2 NM NM NM
Gamesa Not Rated GAM SM 12 3.5 31.7 20.4 17.4 10.1 7.9 7.2 2.4 2.2 2.0
Vestas Not Rated VWS DC 295 9.5 24.5 19.0 19.3 7.9 7.4 7.7 3.8 3.3 2.9
Nordex Not Rated NDX1 GR 19 1.7 36.6 24.6 19.5 10.9 8.6 7.6 4.0 3.5 2.9
Xinjiang Goldw ind BUY 002202 CH 20 8.1 31.5 21.7 17.8 21.7 15.4 12.2 3.6 3.2 2.8
China Ming Yang Wind Not Rated MY US 2 0.3 5.4 6.2 4.0 4.3 3.4 2.3 0.5 0.4 0.4
Jiangsu Jixin Wind Not Rated 601218 CH 11 1.8 75.5 41.1 28.5 30.5 22.2 17.8 4.5 3.9 3.4
Overall Average 34.2 22.2 17.6 16.1 12.7 9.4 3.1 2.8 2.4
Average ex-Suzlon 34.2 22.2 17.7 14.2 10.8 9.1 3.1 2.8 2.4
Mkt Cap (Bn USD)
P/E (x) EV/EBITDA (x) P/BV (x)Price(local)
Company Rating Ticker FY15F FY16F FY17F FY15F FY16F FY17F EBITDA EPS
Suzlon BUY SUEL IN 26 1.6 NM NM NM 5% 10% 16% NM NM
Gamesa Not Rated GAM SM 12 3.5 8.4 11.4 12.1 11% 13% 13% 12% 22%
Vestas Not Rated VWS DC 295 9.5 19.3 18.6 16.0 14% 14% 14% 1% 8%
Nordex Not Rated NDX1 GR 19 1.7 11.1 15.7 17.0 7% 8% 9% 13% 23%
Xinjiang Goldw ind BUY 002202 CH 20 8.1 12.1 15.3 16.1 15% 16% 18% 21% 21%
China Ming Yang Wind Not Rated MY US 2 0.3 10.7 7.8 9.8 7% 8% 10% 23% 10%
Jiangsu Jixin Wind Not Rated 601218 CH 11 1.8 7.4 10.7 12.4 20% 22% 22% 20% 38%
Overall Average 11.5 13.2 13.9 11% 13% 15% 15% 21%
Average ex-Suzlon 11.5 13.2 13.9 12% 13% 14% 15% 21%
Mkt Cap (Bn USD)
ROE (%) EBITDA margin (%)Price(local)
CAGR (FY14-17F)
Nomura | Suzlon Energy 6 April 2015
21
However, all of this came to an abrupt halt with the global financial crisis, when the governments started ignoring the high-cost renewable commitments. In fact, capex, overall, went downhill and remains soft.
In the meantime, emerging markets have continued to grow on the back of their rising demand for energy and shortage of fossil fuels. We believe India therefore fits in perfectly well in this story as the next driver of renewable energy, though supported by government incentives. As such, we think India offers a much better growth profile for companies as compared to global economies particularly Europe, which in our view, has already matured in terms of renewable sources of energy.
Therefore, we think SUEL deserves to trade at a higher premium compared to global players where the growth outlook is weaker as compared to a pure play India story in SUEL.
O&M revenues provide solid financial support As we highlighted earlier in this report, Suzlon’s O&M revenues are set to grow and provide strong financial support to the company. Notably, even during the past few years, Suzlon continued to benefit from its strong installed base of ~8.5GW across India and the associated O&M revenues from the same. Not only is this segment a good annuity revenue source for the company, but it will also keep growing as the installed wind base for SUEL ramps up further. O&M is also a higher-profit business and one that provides greater visibility and stability in revenue/profits.
Suzlon: TP of INR38 based on 15x FY17F EV/EBITDA
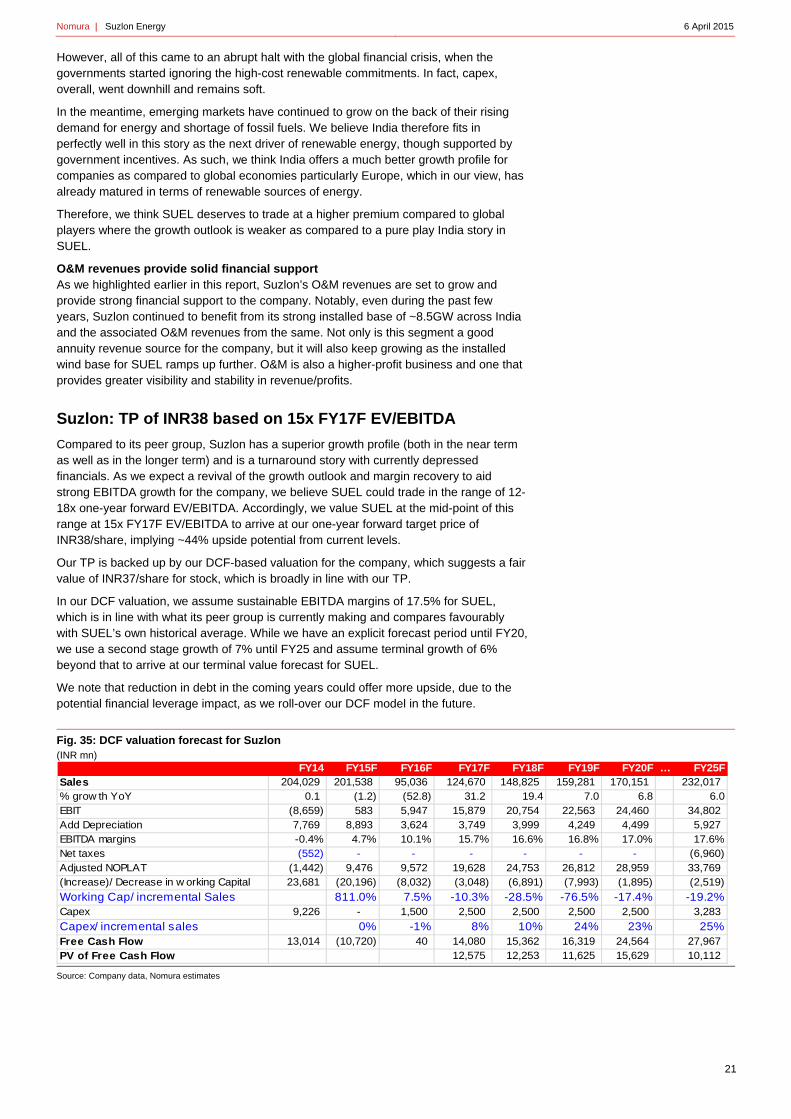
Compared to its peer group, Suzlon has a superior growth profile (both in the near term as well as in the longer term) and is a turnaround story with currently depressed financials. As we expect a revival of the growth outlook and margin recovery to aid strong EBITDA growth for the company, we believe SUEL could trade in the range of 12-18x one-year forward EV/EBITDA. Accordingly, we value SUEL at the mid-point of this range at 15x FY17F EV/EBITDA to arrive at our one-year forward target price of INR38/share, implying ~44% upside potential from current levels.
Our TP is backed up by our DCF-based valuation for the company, which suggests a fair value of INR37/share for stock, which is broadly in line with our TP.
In our DCF valuation, we assume sustainable EBITDA margins of 17.5% for SUEL, which is in line with what its peer group is currently making and compares favourably with SUEL’s own historical average. While we have an explicit forecast period until FY20, we use a second stage growth of 7% until FY25 and assume terminal growth of 6% beyond that to arrive at our terminal value forecast for SUEL.
We note that reduction in debt in the coming years could offer more upside, due to the potential financial leverage impact, as we roll-over our DCF model in the future.
Fig. 35: DCF valuation forecast for Suzlon (INR mn)
Source: Company data, Nomura estimates
FY14 FY15F FY16F FY17F FY18F FY19F FY20F … FY25FSales 204,029 201,538 95,036 124,670 148,825 159,281 170,151 232,017 % grow th YoY 0.1 (1.2) (52.8) 31.2 19.4 7.0 6.8 6.0EBIT (8,659) 583 5,947 15,879 20,754 22,563 24,460 34,802 Add Depreciation 7,769 8,893 3,624 3,749 3,999 4,249 4,499 5,927 EBITDA margins -0.4% 4.7% 10.1% 15.7% 16.6% 16.8% 17.0% 17.6%Net taxes (552) - - - - - - (6,960) Adjusted NOPLAT (1,442) 9,476 9,572 19,628 24,753 26,812 28,959 33,769 (Increase)/ Decrease in w orking Capital 23,681 (20,196) (8,032) (3,048) (6,891) (7,993) (1,895) (2,519)
Working Cap/ incremental Sales 811.0% 7.5% -10.3% -28.5% -76.5% -17.4% -19.2%Capex 9,226 - 1,500 2,500 2,500 2,500 2,500 3,283
Capex/ incremental sales 0% -1% 8% 10% 24% 23% 25%Free Cash Flow 13,014 (10,720) 40 14,080 15,362 16,319 24,564 27,967 PV of Free Cash Flow 12,575 12,253 11,625 15,629 10,112
Nomura | Suzlon Energy 6 April 2015
22
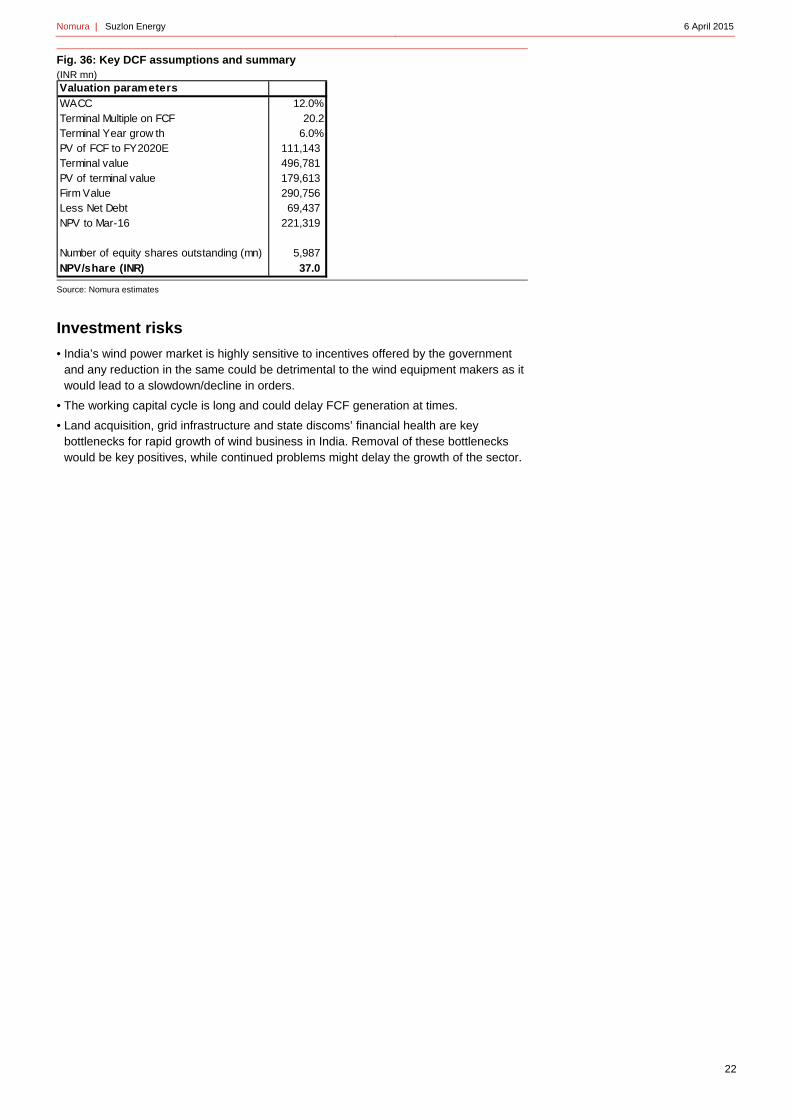
Fig. 36: Key DCF assumptions and summary (INR mn)
Source: Nomura estimates
Investment risks
• India’s wind power market is highly sensitive to incentives offered by the government and any reduction in the same could be detrimental to the wind equipment makers as it would lead to a slowdown/decline in orders.
• The working capital cycle is long and could delay FCF generation at times.
• Land acquisition, grid infrastructure and state discoms’ financial health are key bottlenecks for rapid growth of wind business in India. Removal of these bottlenecks would be key positives, while continued problems might delay the growth of the sector.
Valuation parameters
WACC 12.0%Terminal Multiple on FCF 20.2Terminal Year grow th 6.0%PV of FCF to FY2020E 111,143 Terminal value 496,781 PV of terminal value 179,613 Firm Value 290,756 Less Net Debt 69,437 NPV to Mar-16 221,319
Number of equity shares outstanding (mn) 5,987 NPV/share (INR) 37.0
Nomura | Suzlon Energy 6 April 2015
23
Annexure
Comparison with China wind equipment sector
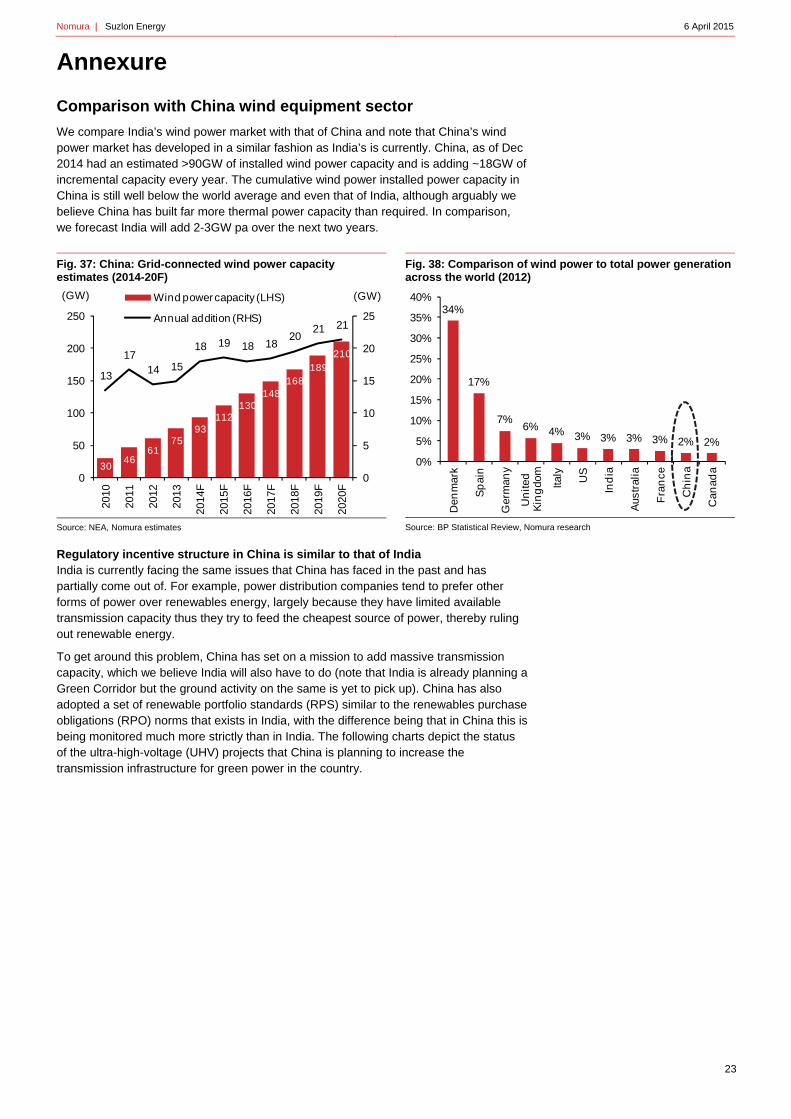
We compare India’s wind power market with that of China and note that China’s wind power market has developed in a similar fashion as India’s is currently. China, as of Dec 2014 had an estimated >90GW of installed wind power capacity and is adding ~18GW of incremental capacity every year. The cumulative wind power installed power capacity in China is still well below the world average and even that of India, although arguably we believe China has built far more thermal power capacity than required. In comparison, we forecast India will add 2-3GW pa over the next two years.
Fig. 37: China: Grid-connected wind power capacity estimates (2014-20F)
Source: NEA, Nomura estimates
Fig. 38: Comparison of wind power to total power generation across the world (2012)
Source: BP Statistical Review, Nomura research
Regulatory incentive structure in China is similar to that of India India is currently facing the same issues that China has faced in the past and has partially come out of. For example, power distribution companies tend to prefer other forms of power over renewables energy, largely because they have limited available transmission capacity thus they try to feed the cheapest source of power, thereby ruling out renewable energy.
To get around this problem, China has set on a mission to add massive transmission capacity, which we believe India will also have to do (note that India is already planning a Green Corridor but the ground activity on the same is yet to pick up). China has also adopted a set of renewable portfolio standards (RPS) similar to the renewables purchase obligations (RPO) norms that exists in India, with the difference being that in China this is being monitored much more strictly than in India. The following charts depict the status of the ultra-high-voltage (UHV) projects that China is planning to increase the transmission infrastructure for green power in the country.
30 46
61 75
93 112
130 148
168 189
210
13
17 14 15
18 19 18 18 20
21 21
0
5
10
15
20
25
0
50
100
150
200
250
2010
2011
2012
2013
2014
F
2015
F
2016
F
2017
F
2018
F
2019
F
2020
F
(GW)(GW) Wind power capacity (LHS)
Annual addition (RHS)34%
17%
7%6% 4% 3% 3% 3% 3% 2% 2%
0%
5%
10%
15%
20%
25%
30%
35%
40%
Den
mar
k
Sp
ain
Ger
man
y
Un
ited
K
ing
dom
Italy
US
Ind
ia
Aus
tral
ia
Fra
nce
Ch
ina
Can
ada
Nomura | Suzlon Energy 6 April 2015
24
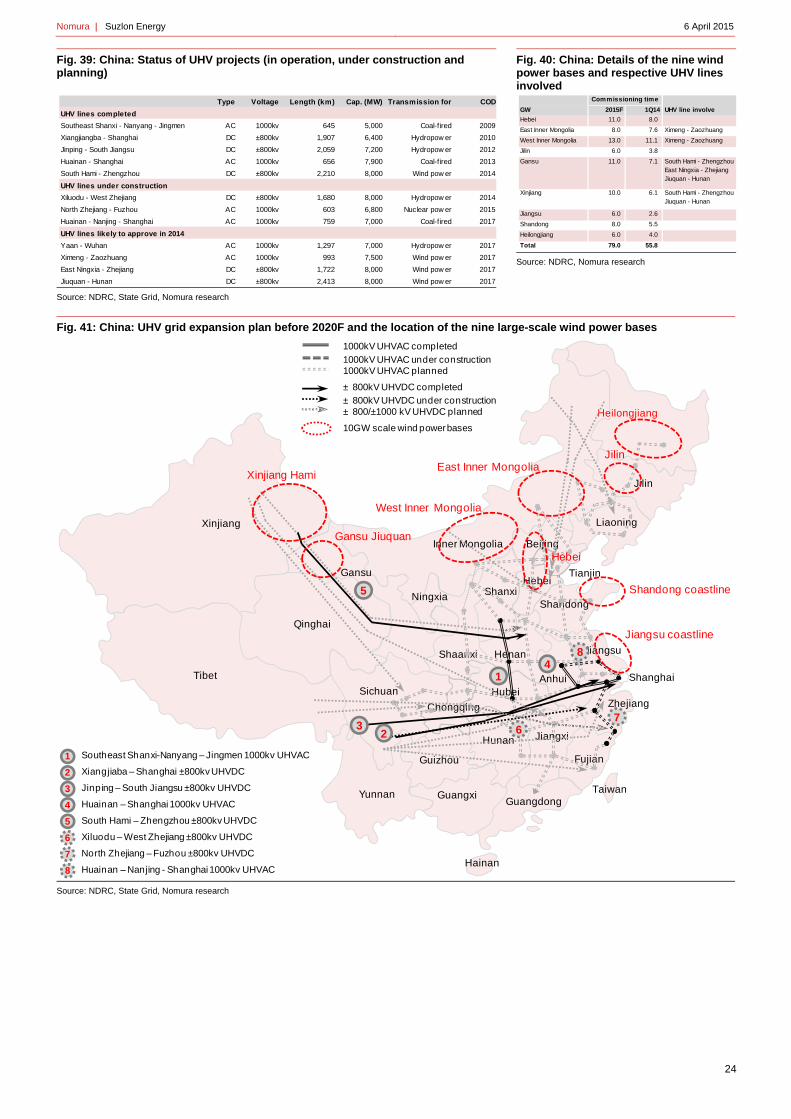
Fig. 39: China: Status of UHV projects (in operation, under construction and planning)
Source: NDRC, State Grid, Nomura research
Fig. 40: China: Details of the nine wind power bases and respective UHV lines involved
Source: NDRC, Nomura research
Fig. 41: China: UHV grid expansion plan before 2020F and the location of the nine large-scale wind power bases
Source: NDRC, State Grid, Nomura research
Type Voltage Length (km) Cap. (MW) Transmission for COD
UHV lines completed
Southeast Shanxi - Nanyang - Jingmen AC 1000kv 645 5,000 Coal-f ired 2009
Xiangjiangba - Shanghai DC ±800kv 1,907 6,400 Hydropow er 2010
Jinping - South Jiangsu DC ±800kv 2,059 7,200 Hydropow er 2012
Huainan - Shanghai AC 1000kv 656 7,900 Coal-f ired 2013
South Hami - Zhengzhou DC ±800kv 2,210 8,000 Wind pow er 2014
UHV lines under construction
Xiluodu - West Zhejiang DC ±800kv 1,680 8,000 Hydropow er 2014
North Zhejiang - Fuzhou AC 1000kv 603 6,800 Nuclear pow er 2015
Huainan - Nanjing - Shanghai AC 1000kv 759 7,000 Coal-f ired 2017
UHV lines likely to approve in 2014
Yaan - Wuhan AC 1000kv 1,297 7,000 Hydropow er 2017
Ximeng - Zaozhuang AC 1000kv 993 7,500 Wind pow er 2017
East Ningxia - Zhejiang DC ±800kv 1,722 8,000 Wind pow er 2017
Jiuquan - Hunan DC ±800kv 2,413 8,000 Wind pow er 2017
GW 2015F 1Q14 UHV line involve
Hebei 11.0 8.0
East Inner Mongolia 8.0 7.6 Ximeng - Zaozhuang
West Inner Mongolia 13.0 11.1 Ximeng - Zaozhuang
Jilin 6.0 3.8
Gansu 11.0 7.1 South Hami - ZhengzhouEast Ningxia - ZhejiangJiuquan - Hunan
Xinjiang 10.0 6.1 South Hami - ZhengzhouJiuquan - Hunan
Jiangsu 6.0 2.6
Shandong 8.0 5.5
Heilongjiang 6.0 4.0
Total 79.0 55.8
Commissioning time
Hainan
Inner Mongolia
Jilin
Beijing
HebeiTianjin
Jiangsu
Anhui Shanghai
Zhejiang
Henan
Hubei
Shaanxi
Ningxia
Qinghai
Xinjiang
Tibet
Sichuan
Yunnan Guangxi
Guizhou Fujian
Hunan Jiangxi
ShanxiShandong
Taiwan
Heilongjiang
Liaoning
Guangdong
Chongqing
Gansu
1000kV UHVAC planned
± 800/±1000 kV UHVDC planned
± 800kV UHVDC completed
1000kV UHVAC completed
± 800kV UHVDC under construction
1000kV UHVAC under construction
10GW scale wind power bases
23
1
5
4
7
6
1
2
3
4
5
7
Southeast Shanxi-Nanyang – Jingmen 1000kv UHVAC
Xiangjiaba – Shanghai ±800kv UHVDC
Jinping – South Jiangsu ±800kv UHVDC
South Hami – Zhengzhou ±800kv UHVDC
Huainan – Shanghai 1000kv UHVAC
6
Xiluodu – West Zhejiang ±800kv UHVDC
North Zhejiang – Fuzhou ±800kv UHVDC
Xinjiang Hami
Gansu Jiuquan
West Inner Mongolia
East Inner MongoliaJilin
Hebei
Shandong coastline
Jiangsu coastline
Huainan – Nanjing - Shanghai 1000kv UHVAC8
8
Nomura | Suzlon Energy 6 April 2015
25
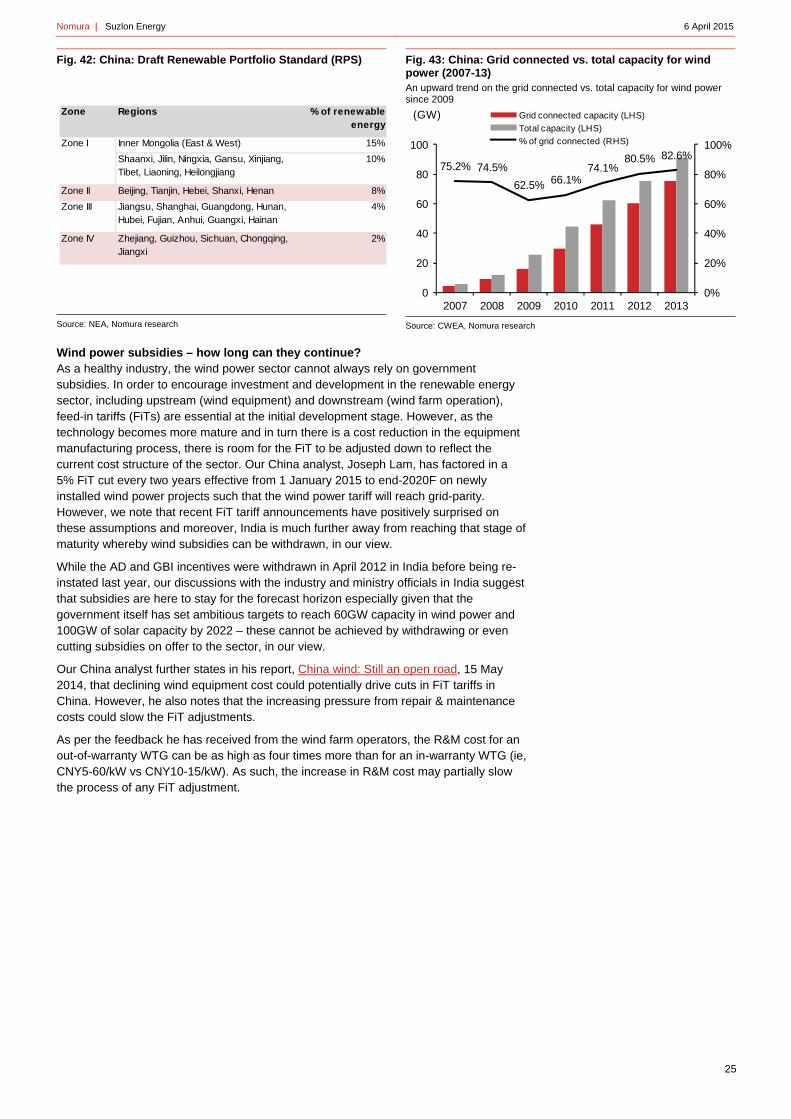
Fig. 42: China: Draft Renewable Portfolio Standard (RPS)
Source: NEA, Nomura research
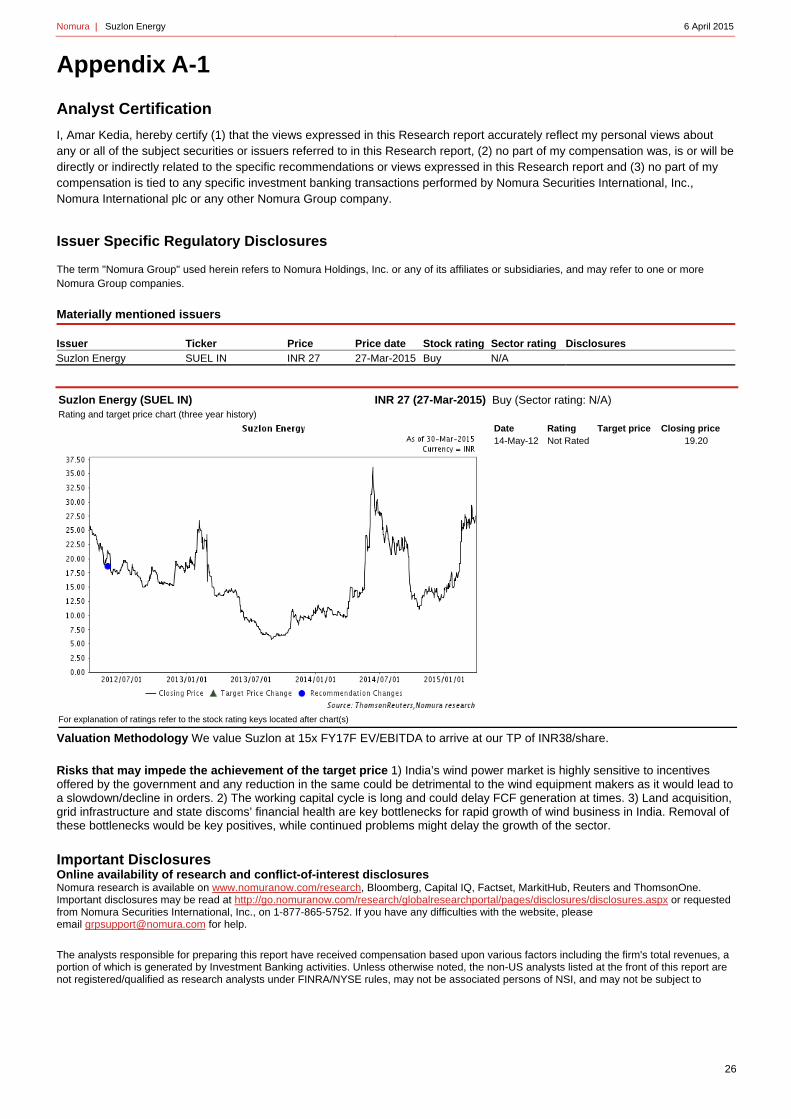
Fig. 43: China: Grid connected vs. total capacity for wind power (2007-13) An upward trend on the grid connected vs. total capacity for wind power since 2009
Source: CWEA, Nomura research
Wind power subsidies – how long can they continue? As a healthy industry, the wind power sector cannot always rely on government subsidies. In order to encourage investment and development in the renewable energy sector, including upstream (wind equipment) and downstream (wind farm operation), feed-in tariffs (FiTs) are essential at the initial development stage. However, as the technology becomes more mature and in turn there is a cost reduction in the equipment manufacturing process, there is room for the FiT to be adjusted down to reflect the current cost structure of the sector. Our China analyst, Joseph Lam, has factored in a 5% FiT cut every two years effective from 1 January 2015 to end-2020F on newly installed wind power projects such that the wind power tariff will reach grid-parity. However, we note that recent FiT tariff announcements have positively surprised on these assumptions and moreover, India is much further away from reaching that stage of maturity whereby wind subsidies can be withdrawn, in our view.
While the AD and GBI incentives were withdrawn in April 2012 in India before being re-instated last year, our discussions with the industry and ministry officials in India suggest that subsidies are here to stay for the forecast horizon especially given that the government itself has set ambitious targets to reach 60GW capacity in wind power and 100GW of solar capacity by 2022 – these cannot be achieved by withdrawing or even cutting subsidies on offer to the sector, in our view.
Our China analyst further states in his report, China wind: Still an open road, 15 May 2014, that declining wind equipment cost could potentially drive cuts in FiT tariffs in China. However, he also notes that the increasing pressure from repair & maintenance costs could slow the FiT adjustments.
As per the feedback he has received from the wind farm operators, the R&M cost for an out-of-warranty WTG can be as high as four times more than for an in-warranty WTG (ie, CNY5-60/kW vs CNY10-15/kW). As such, the increase in R&M cost may partially slow the process of any FiT adjustment.
Zone Regions % of renewable energy
Zone I Inner Mongolia (East & West) 15%
Shaanxi, Jilin, Ningxia, Gansu, Xinjiang, Tibet, Liaoning, Heilongjiang
10%
Zone II Beijing, Tianjin, Hebei, Shanxi, Henan 8%
Zone III Jiangsu, Shanghai, Guangdong, Hunan, Hubei, Fujian, Anhui, Guangxi, Hainan
4%
Zone IV Zhejiang, Guizhou, Sichuan, Chongqing, Jiangxi
2%
75.2% 74.5%
62.5% 66.1%74.1%
80.5% 82.6%
0%
20%
40%
60%
80%
100%
0
20
40
60
80
100
2007 2008 2009 2010 2011 2012 2013
(GW) Grid connected capacity (LHS)
Total capacity (LHS)
% of grid connected (RHS)
Nomura | Suzlon Energy 6 April 2015
26
Appendix A-1
Analyst Certification
I, Amar Kedia, hereby certify (1) that the views expressed in this Research report accurately reflect my personal views about any or all of the subject securities or issuers referred to in this Research report, (2) no part of my compensation was, is or will be directly or indirectly related to the specific recommendations or views expressed in this Research report and (3) no part of my compensation is tied to any specific investment banking transactions performed by Nomura Securities International, Inc., Nomura International plc or any other Nomura Group company.
Issuer Specific Regulatory Disclosures The term "Nomura Group" used herein refers to Nomura Holdings, Inc. or any of its affiliates or subsidiaries, and may refer to one or more Nomura Group companies.
Materially mentioned issuers Issuer Ticker Price Price date Stock rating Sector rating Disclosures Suzlon Energy SUEL IN INR 27 27-Mar-2015 Buy N/A
Suzlon Energy (SUEL IN) INR 27 (27-Mar-2015) Rating and target price chart (three year history)
Buy (Sector rating: N/A)
Date Rating Target price Closing price 14-May-12 Not Rated 19.20
For explanation of ratings refer to the stock rating keys located after chart(s)
Valuation Methodology We value Suzlon at 15x FY17F EV/EBITDA to arrive at our TP of INR38/share. Risks that may impede the achievement of the target price 1) India’s wind power market is highly sensitive to incentives offered by the government and any reduction in the same could be detrimental to the wind equipment makers as it would lead to a slowdown/decline in orders. 2) The working capital cycle is long and could delay FCF generation at times. 3) Land acquisition, grid infrastructure and state discoms’ financial health are key bottlenecks for rapid growth of wind business in India. Removal of these bottlenecks would be key positives, while continued problems might delay the growth of the sector.
Important Disclosures Online availability of research and conflict-of-interest disclosures Nomura research is available on www.nomuranow.com/research, Bloomberg, Capital IQ, Factset, MarkitHub, Reuters and ThomsonOne. Important disclosures may be read at http://go.nomuranow.com/research/globalresearchportal/pages/disclosures/disclosures.aspx or requested from Nomura Securities International, Inc., on 1-877-865-5752. If you have any difficulties with the website, please email [email protected] for help. The analysts responsible for preparing this report have received compensation based upon various factors including the firm's total revenues, a portion of which is generated by Investment Banking activities. Unless otherwise noted, the non-US analysts listed at the front of this report are not registered/qualified as research analysts under FINRA/NYSE rules, may not be associated persons of NSI, and may not be subject to
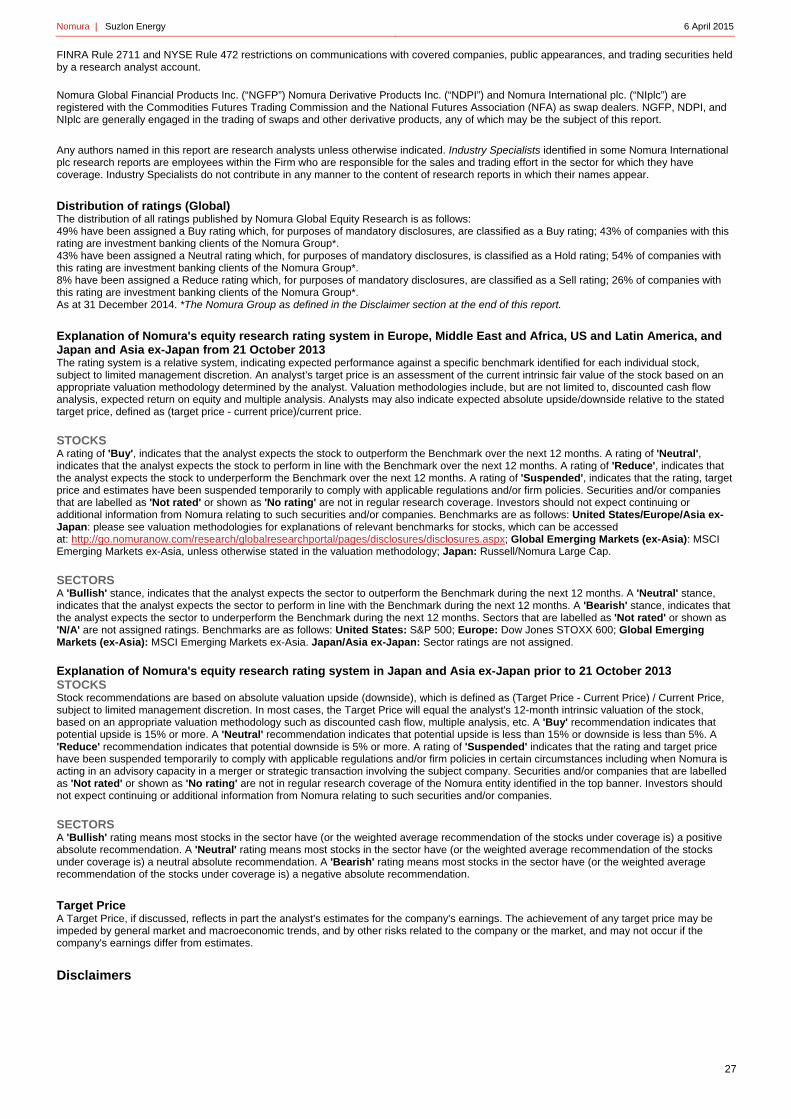
Nomura | Suzlon Energy 6 April 2015
27
FINRA Rule 2711 and NYSE Rule 472 restrictions on communications with covered companies, public appearances, and trading securities held by a research analyst account. Nomura Global Financial Products Inc. (“NGFP”) Nomura Derivative Products Inc. (“NDPI”) and Nomura International plc. (“NIplc”) are registered with the Commodities Futures Trading Commission and the National Futures Association (NFA) as swap dealers. NGFP, NDPI, and NIplc are generally engaged in the trading of swaps and other derivative products, any of which may be the subject of this report. Any authors named in this report are research analysts unless otherwise indicated. Industry Specialists identified in some Nomura International plc research reports are employees within the Firm who are responsible for the sales and trading effort in the sector for which they have coverage. Industry Specialists do not contribute in any manner to the content of research reports in which their names appear. Distribution of ratings (Global) The distribution of all ratings published by Nomura Global Equity Research is as follows: 49% have been assigned a Buy rating which, for purposes of mandatory disclosures, are classified as a Buy rating; 43% of companies with this rating are investment banking clients of the Nomura Group*. 43% have been assigned a Neutral rating which, for purposes of mandatory disclosures, is classified as a Hold rating; 54% of companies with this rating are investment banking clients of the Nomura Group*. 8% have been assigned a Reduce rating which, for purposes of mandatory disclosures, are classified as a Sell rating; 26% of companies with this rating are investment banking clients of the Nomura Group*. As at 31 December 2014. *The Nomura Group as defined in the Disclaimer section at the end of this report. Explanation of Nomura's equity research rating system in Europe, Middle East and Africa, US and Latin America, and Japan and Asia ex-Japan from 21 October 2013 The rating system is a relative system, indicating expected performance against a specific benchmark identified for each individual stock, subject to limited management discretion. An analyst’s target price is an assessment of the current intrinsic fair value of the stock based on an appropriate valuation methodology determined by the analyst. Valuation methodologies include, but are not limited to, discounted cash flow analysis, expected return on equity and multiple analysis. Analysts may also indicate expected absolute upside/downside relative to the stated target price, defined as (target price - current price)/current price. STOCKS A rating of 'Buy', indicates that the analyst expects the stock to outperform the Benchmark over the next 12 months. A rating of 'Neutral', indicates that the analyst expects the stock to perform in line with the Benchmark over the next 12 months. A rating of 'Reduce', indicates that the analyst expects the stock to underperform the Benchmark over the next 12 months. A rating of 'Suspended', indicates that the rating, target price and estimates have been suspended temporarily to comply with applicable regulations and/or firm policies. Securities and/or companies that are labelled as 'Not rated' or shown as 'No rating' are not in regular research coverage. Investors should not expect continuing or additional information from Nomura relating to such securities and/or companies. Benchmarks are as follows: United States/Europe/Asia ex-Japan: please see valuation methodologies for explanations of relevant benchmarks for stocks, which can be accessed at: http://go.nomuranow.com/research/globalresearchportal/pages/disclosures/disclosures.aspx; Global Emerging Markets (ex-Asia): MSCI Emerging Markets ex-Asia, unless otherwise stated in the valuation methodology; Japan: Russell/Nomura Large Cap. SECTORS A 'Bullish' stance, indicates that the analyst expects the sector to outperform the Benchmark during the next 12 months. A 'Neutral' stance, indicates that the analyst expects the sector to perform in line with the Benchmark during the next 12 months. A 'Bearish' stance, indicates that the analyst expects the sector to underperform the Benchmark during the next 12 months. Sectors that are labelled as 'Not rated' or shown as 'N/A' are not assigned ratings. Benchmarks are as follows: United States: S&P 500; Europe: Dow Jones STOXX 600; Global Emerging Markets (ex-Asia): MSCI Emerging Markets ex-Asia. Japan/Asia ex-Japan: Sector ratings are not assigned. Explanation of Nomura's equity research rating system in Japan and Asia ex-Japan prior to 21 October 2013 STOCKS Stock recommendations are based on absolute valuation upside (downside), which is defined as (Target Price - Current Price) / Current Price, subject to limited management discretion. In most cases, the Target Price will equal the analyst's 12-month intrinsic valuation of the stock, based on an appropriate valuation methodology such as discounted cash flow, multiple analysis, etc. A 'Buy' recommendation indicates that potential upside is 15% or more. A 'Neutral' recommendation indicates that potential upside is less than 15% or downside is less than 5%. A 'Reduce' recommendation indicates that potential downside is 5% or more. A rating of 'Suspended' indicates that the rating and target price have been suspended temporarily to comply with applicable regulations and/or firm policies in certain circumstances including when Nomura is acting in an advisory capacity in a merger or strategic transaction involving the subject company. Securities and/or companies that are labelled as 'Not rated' or shown as 'No rating' are not in regular research coverage of the Nomura entity identified in the top banner. Investors should not expect continuing or additional information from Nomura relating to such securities and/or companies. SECTORS A 'Bullish' rating means most stocks in the sector have (or the weighted average recommendation of the stocks under coverage is) a positive absolute recommendation. A 'Neutral' rating means most stocks in the sector have (or the weighted average recommendation of the stocks under coverage is) a neutral absolute recommendation. A 'Bearish' rating means most stocks in the sector have (or the weighted average recommendation of the stocks under coverage is) a negative absolute recommendation. Target Price A Target Price, if discussed, reflects in part the analyst's estimates for the company's earnings. The achievement of any target price may be impeded by general market and macroeconomic trends, and by other risks related to the company or the market, and may not occur if the company's earnings differ from estimates. Disclaimers
Nomura | Suzlon Energy 6 April 2015
28
This document contains material that has been prepared by the Nomura entity identified on page 1 and/or with the sole or joint contributions of one or more Nomura entities whose employees and their respective affiliations are also specified on page 1 or identified elsewhere in the document. The term "Nomura Group" used herein refers to Nomura Holdings, Inc. or any of its affiliates or subsidiaries and may refer to one or more Nomura Group companies including: Nomura Securities Co., Ltd. ('NSC') Tokyo, Japan; Nomura International plc ('NIplc'), UK; Nomura Securities International, Inc. ('NSI'), New York, US; Nomura International (Hong Kong) Ltd. (‘NIHK’), Hong Kong; Nomura Financial Investment (Korea) Co., Ltd. (‘NFIK’), Korea (Information on Nomura analysts registered with the Korea Financial Investment Association ('KOFIA') can be found on the KOFIA Intranet at http://dis.kofia.or.kr); Nomura Singapore Ltd. (‘NSL’), Singapore (Registration number 197201440E, regulated by the Monetary Authority of Singapore); Nomura Australia Ltd. (‘NAL’), Australia (ABN 48 003 032 513), regulated by the Australian Securities and Investment Commission ('ASIC') and holder of an Australian financial services licence number 246412; P.T. Nomura Indonesia (‘PTNI’), Indonesia; Nomura Securities Malaysia Sdn. Bhd. (‘NSM’), Malaysia; NIHK, Taipei Branch (‘NITB’), Taiwan; Nomura Financial Advisory and Securities (India) Private Limited (‘NFASL’), Mumbai, India (Registered Address: Ceejay House, Level 11, Plot F, Shivsagar Estate, Dr. Annie Besant Road, Worli, Mumbai- 400 018, India; Tel: +91 22 4037 4037, Fax: +91 22 4037 4111; CIN No : U74140MH2007PTC169116, SEBI Registration No: BSE INB011299030, NSE INB231299034, INF231299034, INE 231299034, MCX: INE261299034) and NIplc, Madrid Branch (‘NIplc, Madrid’). ‘CNS Thailand’ next to an analyst’s name on the front page of a research report indicates that the analyst is employed by Capital Nomura Securities Public Company Limited (‘CNS’) to provide research assistance services to NSL under a Research Assistance Agreement. ‘NSFSPL’ next to an employee’s name on the front page of a research report indicates that the individual is employed by Nomura Structured Finance Services Private Limited to provide assistance to certain Nomura entities under inter-company agreements. THIS MATERIAL IS: (I) FOR YOUR PRIVATE INFORMATION, AND WE ARE NOT SOLICITING ANY ACTION BASED UPON IT; (II) NOT TO BE CONSTRUED AS AN OFFER TO SELL OR A SOLICITATION OF AN OFFER TO BUY ANY SECURITY IN ANY JURISDICTION WHERE SUCH OFFER OR SOLICITATION WOULD BE ILLEGAL; AND (III) BASED UPON INFORMATION FROM SOURCES THAT WE CONSIDER RELIABLE, BUT HAS NOT BEEN INDEPENDENTLY VERIFIED BY NOMURA GROUP. Nomura Group does not warrant or represent that the document is accurate, complete, reliable, fit for any particular purpose or merchantable and does not accept liability for any act (or decision not to act) resulting from use of this document and related data. To the maximum extent permissible all warranties and other assurances by Nomura group are hereby excluded and Nomura Group shall have no liability for the use, misuse, or distribution of this information. Opinions or estimates expressed are current opinions as of the original publication date appearing on this material and the information, including the opinions and estimates contained herein, are subject to change without notice. Nomura Group is under no duty to update this document. Any comments or statements made herein are those of the author(s) and may differ from views held by other parties within Nomura Group. Clients should consider whether any advice or recommendation in this report is suitable for their particular circumstances and, if appropriate, seek professional advice, including tax advice. Nomura Group does not provide tax advice. Nomura Group, and/or its officers, directors and employees, may, to the extent permitted by applicable law and/or regulation, deal as principal, agent, or otherwise, or have long or short positions in, or buy or sell, the securities, commodities or instruments, or options or other derivative instruments based thereon, of issuers or securities mentioned herein. Nomura Group companies may also act as market maker or liquidity provider (within the meaning of applicable regulations in the UK) in the financial instruments of the issuer. Where the activity of market maker is carried out in accordance with the definition given to it by specific laws and regulations of the US or other jurisdictions, this will be separately disclosed within the specific issuer disclosures. This document may contain information obtained from third parties, including ratings from credit ratings agencies such as Standard & Poor’s. Reproduction and distribution of third-party content in any form is prohibited except with the prior written permission of the related third-party. Third-party content providers do not guarantee the accuracy, completeness, timeliness or availability of any information, including ratings, and are not responsible for any errors or omissions (negligent or otherwise), regardless of the cause, or for the results obtained from the use of such content. Third-party content providers give no express or implied warranties, including, but not limited to, any warranties of merchantability or fitness for a particular purpose or use. Third-party content providers shall not be liable for any direct, indirect, incidental, exemplary, compensatory, punitive, special or consequential damages, costs, expenses, legal fees, or losses (including lost income or profits and opportunity costs) in connection with any use of their content, including ratings. Credit ratings are statements of opinions and are not statements of fact or recommendations to purchase hold or sell securities. They do not address the suitability of securities or the suitability of securities for investment purposes, and should not be relied on as investment advice. Any MSCI sourced information in this document is the exclusive property of MSCI Inc. (‘MSCI’). Without prior written permission of MSCI, this information and any other MSCI intellectual property may not be reproduced, re-disseminated or used to create any financial products, including any indices. This information is provided on an "as is" basis. The user assumes the entire risk of any use made of this information. MSCI, its affiliates and any third party involved in, or related to, computing or compiling the information hereby expressly disclaim all warranties of originality, accuracy, completeness, merchantability or fitness for a particular purpose with respect to any of this information. Without limiting any of the foregoing, in no event shall MSCI, any of its affiliates or any third party involved in, or related to, computing or compiling the information have any liability for any damages of any kind. MSCI and the MSCI indexes are services marks of MSCI and its affiliates. Russell/Nomura Japan Equity Indexes are protected by certain intellectual property rights of Nomura Securities Co., Ltd. and Russell Investments. Nomura Securities Co., Ltd. and Russell Investments do not guarantee the accuracy, completeness, reliability, or usefulness thereof and do not account for business activities and services that any index user and its affiliates undertake with the use of the Indexes. Investors should consider this document as only a single factor in making their investment decision and, as such, the report should not be viewed as identifying or suggesting all risks, direct or indirect, that may be associated with any investment decision. Nomura Group produces a number of different types of research product including, among others, fundamental analysis and quantitative analysis; recommendations contained in one type of research product may differ from recommendations contained in other types of research product, whether as a result of differing time horizons, methodologies or otherwise. Nomura Group publishes research product in a number of different ways including the posting of product on Nomura Group portals and/or distribution directly to clients. Different groups of clients may receive different products and services from the research department depending on their individual requirements. Figures presented herein may refer to past performance or simulations based on past performance which are not reliable indicators of future performance. Where the information contains an indication of future performance, such forecasts may not be a reliable indicator of future performance. Moreover, simulations are based on models and simplifying assumptions which may oversimplify and not reflect the future distribution of returns. Certain securities are subject to fluctuations in exchange rates that could have an adverse effect on the value or price of, or income derived from, the investment. The securities described herein may not have been registered under the US Securities Act of 1933 (the ‘1933 Act’), and, in such case, may not be offered or sold in the US or to US persons unless they have been registered under the 1933 Act, or except in compliance with an exemption from the registration requirements of the 1933 Act. Unless governing law permits otherwise, any transaction should be executed via a Nomura entity in your home jurisdiction. This document has been approved for distribution in the UK and European Economic Area as investment research by NIplc. NIplc is authorised by the Prudential Regulation Authority and regulated by the Financial Conduct Authority and the Prudential Regulation Authority. NIplc is a member of the London Stock Exchange. This document does not constitute a personal recommendation within the meaning of applicable regulations in the UK, or take into account the particular investment objectives, financial situations, or needs of individual investors. This
Nomura | Suzlon Energy 6 April 2015
29
document is intended only for investors who are 'eligible counterparties' or 'professional clients' for the purposes of applicable regulations in the UK, and may not, therefore, be redistributed to persons who are 'retail clients' for such purposes. This document has been approved by NIHK, which is regulated by the Hong Kong Securities and Futures Commission, for distribution in Hong Kong by NIHK. This document has been approved for distribution in Australia by NAL, which is authorized and regulated in Australia by the ASIC. This document has also been approved for distribution in Malaysia by NSM. In Singapore, this document has been distributed by NSL. NSL accepts legal responsibility for the content of this document, where it concerns securities, futures and foreign exchange, issued by their foreign affiliates in respect of recipients who are not accredited, expert or institutional investors as defined by the Securities and Futures Act (Chapter 289). Recipients of this document in Singapore should contact NSL in respect of matters arising from, or in connection with, this document. Unless prohibited by the provisions of Regulation S of the 1933 Act, this material is distributed in the US, by NSI, a US-registered broker-dealer, which accepts responsibility for its contents in accordance with the provisions of Rule 15a-6, under the US Securities Exchange Act of 1934. The entity that prepared this document permits its separately operated affiliates within the Nomura Group to make copies of such documents available to their clients. This document has not been approved for distribution to persons other than ‘Authorised Persons’, ‘Exempt Persons’ or ‘Institutions’ (as defined by the Capital Markets Authority) in the Kingdom of Saudi Arabia (‘Saudi Arabia’) or 'professional clients' (as defined by the Dubai Financial Services Authority) in the United Arab Emirates (‘UAE’) or a ‘Market Counterparty’ or ‘Business Customers’ (as defined by the Qatar Financial Centre Regulatory Authority) in the State of Qatar (‘Qatar’) by Nomura Saudi Arabia, NIplc or any other member of Nomura Group, as the case may be. Neither this document nor any copy thereof may be taken or transmitted or distributed, directly or indirectly, by any person other than those authorised to do so into Saudi Arabia or in the UAE or in Qatar or to any person other than ‘Authorised Persons’, ‘Exempt Persons’ or ‘Institutions’ located in Saudi Arabia or 'professional clients' in the UAE or a ‘Market Counterparty’ or ‘Business Customers’ in Qatar . By accepting to receive this document, you represent that you are not located in Saudi Arabia or that you are an ‘Authorised Person’, an ‘Exempt Person’ or an ‘Institution’ in Saudi Arabia or that you are a 'professional client' in the UAE or a ‘Market Counterparty’ or ‘Business Customers’ in Qatar and agree to comply with these restrictions. Any failure to comply with these restrictions may constitute a violation of the laws of the UAE or Saudi Arabia or Qatar. NO PART OF THIS MATERIAL MAY BE (I) COPIED, PHOTOCOPIED, OR DUPLICATED IN ANY FORM, BY ANY MEANS; OR (II) REDISTRIBUTED WITHOUT THE PRIOR WRITTEN CONSENT OF A MEMBER OF NOMURA GROUP. If this document has been distributed by electronic transmission, such as e-mail, then such transmission cannot be guaranteed to be secure or error-free as information could be intercepted, corrupted, lost, destroyed, arrive late or incomplete, or contain viruses. The sender therefore does not accept liability for any errors or omissions in the contents of this document, which may arise as a result of electronic transmission. If verification is required, please request a hard-copy version. Nomura Group manages conflicts with respect to the production of research through its compliance policies and procedures (including, but not limited to, Conflicts of Interest, Chinese Wall and Confidentiality policies) as well as through the maintenance of Chinese walls and employee training. Additional information is available upon request and disclosure information is available at the Nomura Disclosure web page: http://go.nomuranow.com/research/globalresearchportal/pages/disclosures/disclosures.aspx Copyright © 2015 Nomura International (Hong Kong) Ltd. All rights reserved.