bbva results presentation · 35 bps-16 bps 13 bps 5 bps 6 bps mar-19 net earnings dividends &...
TRANSCRIPT

2Q19 ResultsJuly 31st, 2019

22Q19 ResultsJuly 31st 2019
Disclaimer
This document is only provided for information purposes and does not constitute, nor should it be interpreted as, an offer to sell or exchange oracquire, or an invitation for offers to buy securities issued by any of the aforementioned companies. Any decision to buy or invest in securities inrelation to a specific issue must be made solely and exclusively on the basis of the information set out in the pertinent prospectus filed by thecompany in relation to such specific issue. No one who becomes aware of the information contained in this report should regard it as definitive,because it is subject to changes and modifications.
This document contains or may contain forward looking statements (in the usual meaning and within the meaning of the US Private SecuritiesLitigation Reform Act of 1995) regarding intentions, expectations or projections of BBVA or of its management on the date thereof, that refer to orincorporate various assumptions and projections, including projections about the future earnings of the business. The statements contained hereinare based on our current projections, but the actual results may be substantially modified in the future by various risks and other factors that maycause the results or final decisions to differ from such intentions, projections or estimates. These factors include, without limitation, (1) the marketsituation, macroeconomic factors, regulatory, political or government guidelines, (2) domestic and international stock market movements, exchangerates and interest rates, (3) competitive pressures, (4) technological changes, (5) alterations in the financial situation, creditworthiness or solvencyof our customers, debtors or counterparts. These factors could cause or result in actual events differing from the information and intentions stated,projected or forecast in this document or in other past or future documents. BBVA does not undertake to publicly revise the contents of this or anyother document, either if the events are not as described herein, or if such events lead to changes in the information contained in this document.
This document may contain summarised information or information that has not been audited, and its recipients are invited to consult thedocumentation and public information filed by BBVA with stock market supervisory bodies, in particular, the prospectuses and periodicalinformation filed with the Spanish Securities Exchange Commission (CNMV) and the Annual Report on Form 20-F and information on Form 6-K thatare filed with the US Securities and Exchange Commission.
Distribution of this document in other jurisdictions may be prohibited, and recipients into whose possession this document comes shall be solelyresponsible for informing themselves about, and observing any such restrictions. By accepting this document you agree to be bound by theforegoing restrictions.
32Q19 ResultsJuly 31st 2019
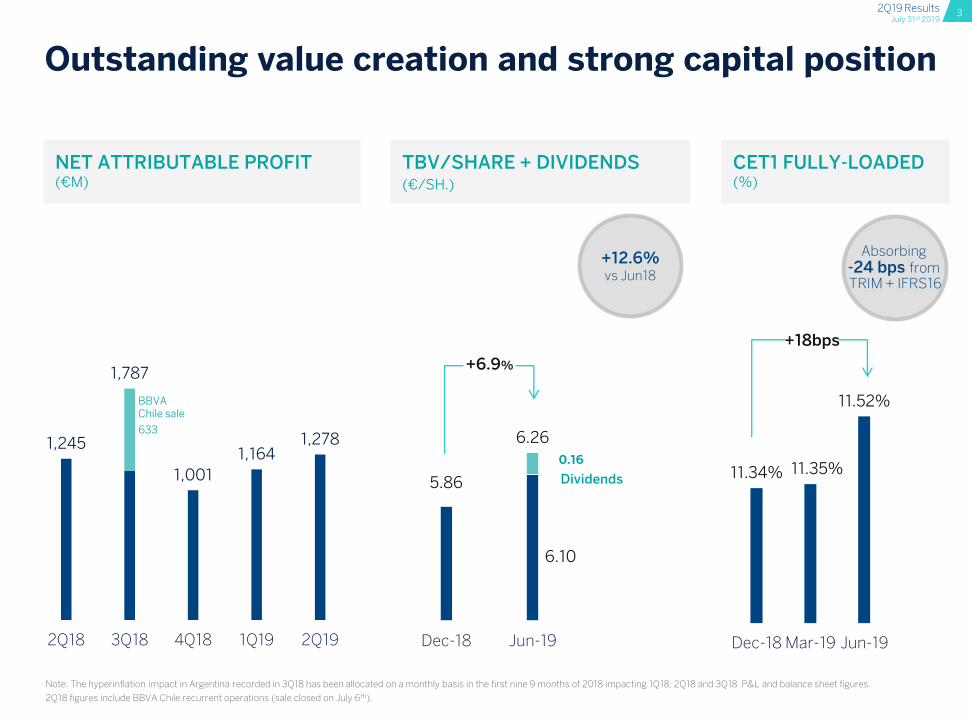
11.34% 11.35%
11.52%
Dec-18 Mar-19 Jun-19
CET1 FULLY-LOADED(%)
Outstanding value creation and strong capital position
NET ATTRIBUTABLE PROFIT(€M)
Note: The hyperinflation impact in Argentina recorded in 3Q18 has been allocated on a monthly basis in the first nine 9 months of 2018 impacting 1Q18, 2Q18 and 3Q18 P&L and balance sheet figures.
2Q18 figures include BBVA Chile recurrent operations (sale closed on July 6th).
5.86
6.10
0.16
6.26
Dec-18 Jun-19
TBV/SHARE + DIVIDENDS(€/SH.)
+6.9%
633
1,245
1,787
1,001
1,1641,278
2Q18 3Q18 4Q18 1Q19 2Q19
+12.6%vs Jun18
BBVA Chile sale
Dividends
+18bps
Absorbing -24 bps from TRIM + IFRS16

42Q19 ResultsJuly 31st 2019
2Q19 Highlights
01 Robust core revenue growth NII + FEES (€ constant)
+8.7% vs. 2Q18
02 Further improvement in best-in-class efficiency
COST TO INCOME
49.0% -41 bps vs. 12M18 (€ constant)
MOBILE CUSTOMERS
26.1 m +25%Jun-19 vs. Jun-18
DIGITAL CUSTOMERS
29.7 m +17%Jun-19 vs. Jun-18
06 Ahead of the curve in digital transformation
DIGITAL SALES (units)
58.1%Jun-19
03 Sound risk indicators
04 Strong capital position
05 Outstanding delivery on shareholder value creation
NPL RATIO
3.84%
CET 1 FL
11.52%
COVERAGE RATIO
75%+330 bps vs. 2Q18
ROTE
12.4% Jun-19
-57 bps vs. 2Q18
TBV/SHARE + DIVIDENDS
+12.6% vs. Jun-18 6.26 €/sh.
+17 bps vs. Mar-19
CoR
0.91%+9 bps vs. 1H18
Note: For a better understanding of the financial performance of BBVA Group, in the whole 2Q19 results presentation: 1) BBVA Chile recurrent operations have been excluded in 1Q18 and 2Q18 (sale closed on July 6th); 2) The hyperinflation impact in Argentina recorded in 3Q18 has been allocated on a monthly basis in the first nine 9 months of 2018.
ALREADY WITHIN THE TARGET RANGE

52Q19 ResultsJuly 31st 2019
2Q19 Profit & Loss
BBVA Group (€m) 2Q19 % % constant
Net Interest Income 4,566 9.0 10.4
Net Fees and Commissions 1,256 2.5 3.0
Net Trading Income 116 -56.5 -58.2
Other Income & Expenses -18 n.s. n.s.
Gross Income 5,920 4.2 5.1
Operating Expenses -2,952 3.9 4.1
Operating Income 2,968 4.5 6.1
Impairment on Financial Assets -753 -2.1 0.0
Provisions and Other Gains and Losses -120 n.s. n.s.
Income Before Tax 2,095 2.1 3.4
Income Tax -577 -3.1 -2.2
Non-controlling Interest -241 -2.9 13.1
Net Attributable Profit 1,278 5.7 4.4
Change
2Q19/2Q18

62Q19 ResultsJuly 31st 2019
1H19 Profit & Loss
BBVA Group (€m) 1H19 % % constant
Net Interest Income 8,987 7.4 9.9
Net Fees and Commissions 2,470 1.0 2.8
Net Trading Income 542 -17.7 -16.6
Other Income & Expenses -10 n.s. n.s.
Gross Income 11,989 3.7 6.0
Operating Expenses -5,874 2.3 3.9
Operating Income 6,115 5.2 8.2
Impairment on Financial Assets -1,777 13.4 15.7
Provisions and Other Gains and Losses -286 n.s. n.s.
Income Before Tax 4,052 -2.8 0.3
Income Tax -1,136 -5.4 -3.0
Non-controlling Interest -475 -4.7 17.2
Net Attributable Profit 2,442 -1.2 -0.8
1H19/1H18
Change

72Q19 ResultsJuly 31st 2019
274 226314
428
115
2Q18 3Q18 4Q18 1Q19 2Q19
Impacted by Prisma sale
5,650 5,960 6,167 6,051 5,938
2Q18 3Q18 4Q18 1Q19 2Q19
Very strong growth in most of geographies
Robust core revenue growth
NET INTEREST INCOME(€M CONSTANT)
NET FEES AND COMMISSIONS(€M CONSTANT)
NET TRADING INCOME(€M CONSTANT)
GROSS INCOME(€M CONSTANT)
+10.4% +3.0%
+5.1%
Robust fee generation in the quarter
2Q19 impacted by muted Global Markets activity and lower portfolio sales
Annual Single Resolution Fund (SRF) contribution in the quarter (144€m)
-58.2%
4,1514,470 4,704
4,406 4,581
2Q18 3Q18 4Q18 1Q19 2Q19
CPI Linkers
1,224 1,215 1,231 1,209 1,261
2Q18 3Q18 4Q18 1Q19 2Q19
+4.0%+4.2%
-1.9%

82Q19 ResultsJuly 31st 2019
5,652
6,115
1H18 1H19
+8.2%
3.9%
8.3%
CoreRevenues
Operatingexpenses
Further improvement in best-in-class efficiency
50.2%
49.4%49.0%
64.7%
12M17 12M18 6M19 EuropeanPeer Group
Average
European Peer Group: BARC, BNPP, CASA, CS, CMZ, DB, HSBC, ISP, LBG, RBS, SAN, SG, UBS, UCG. European Peer Group figures as of Mar-19. BBVA figures as of Jun-19.
GROUP OPERATING INCOME(YOY (%); (€M CONSTANT))
EFFICIENCY RATIO(%; € CONSTANT)
GROUP OPERATING JAWS(1H YOY (%); (€ CONSTANT))
INFLATION
6.3%Average 12m
-41 bps

92Q19 ResultsJuly 31st 2019
7591,022
1,3331,018
758
2Q18 3Q18 4Q18 1Q19 2Q19
0.83%
0.91%1.02% 1.06%
0.91%
0.80%
1.06%
1.36%
1.06%
0.77%
2Q18 3Q18 4Q18 1Q19 2Q19
Sound risk indicators
- 2.6
71% 73% 73% 74% 75%
4.4%4.1% 3.9% 3.9% 3.8%
Jun-18 Sep-18 Dec-18 Mar-19 Jun-19
19.317.7 17.1 17.3 16.7
Jun-18 Sep-18 Dec-18 Mar-19 Jun-19
Flat
FINANCIAL ASSETS IMPAIRMENTS(€M CONSTANT)
NPLs(€BN)
COST OF RISK(%)
NPL & COVERAGE RATIOS(%)
YTD
QTD
COVERAGE
NPL
Better than expectations
-25.6 %-0.6

102Q19 ResultsJuly 31st 2019
11.35% 11.52%35 bps
-16 bps -13 bps
5 bps 6 bps
Mar-19 NetEarnings
Dividends & AT1coupons
TRIMs Reg.EquivalenceArgentina
Others* Jun-19
Strong capital position
+17 bps
European Peer Group: BARC, BNPP, CASA, CS, CMZ, DB, HSBC, ISP, LBG, RBS, SAN, SG, UBS, UCG. European Peer Group figures as of Mar-19. BBVA figures as of Jun-19.
(*) Others includes RWAs evolution and market related impacts such as FX impact, mark to market of the Held To Collect and Sell portfolios, among others items.
6.6%
4.9%
BBVA EuropeanPeer Group
Average
1.81%2.08%
1.5%
2.0%
AT1 Tier 2
REQUIREMENTS
HIGH QUALITY CAPITAL LEVERAGE RATIO FULLY-LOADED (%)
CET1 FULLY-LOADED - BBVA GROUPQUARTERLY EVOLUTION (%, BPS)
AT1 AND TIER 2 BUCKETS ALREADY COVEREDJUN-19, FULLY-LOADED (%)
#1
CET1 FL already within the target range earlier than expected

112Q19 ResultsJuly 31st 2019
10.2%
6.8%
BBVA EuropeanPeer Group Average
12.4%
8.0%
BBVA EuropeanPeer Group Average
Outstanding delivery on shareholder value creation
ROE
ROTE
European Peer Group: BARC, BNPP, CASA, CS, CMZ, DB, HSBC, ISP, LBG, RBS, SAN, SG, UBS, UCG. European Peer Group figures as of Mar-19. BBVA figures as of Jun-19.
5.705.86
5.946.10
0.100.10
0.260.26
5.65 5.80 5.966.20 6.36
Jun-18 Sep-18 Dec-18 Mar-19 Jun-19
DIVIDENDS
2018 Figures include BBVA Chile recurrent operations (sale closed on July 6th).
+12.6%
TBV PER SHARE & DIVIDENDS(€ PER SHARE)
LEADING PROFITABILITY METRICS(%)
+2.7%

122Q19 ResultsJuly 31st 2019
30.5
49.8
58.1
18.7
33.0
43.8
Jun-17 Jun-18 Jun-19
Growing in digital and mobile customers, leading to an outstanding trend in digital sales
DIGITAL CUSTOMERSMILLION, % YOY GROWTH
MOBILE CUSTOMERSMILLION, % YOY GROWTH
DIGITAL SALES(% OF TOTAL SALES YTD,# OF TRANSACTIONS AND PRV1)
19.9
25.4
29.7
Jun-17 Jun-18 Jun-19
+17%+28%
CUSTOMER PENETRATION RATE, %
40% 48% 54%
14.4
20.8
26.1
Jun-17 Jun-18 Jun-19
+25%+45%
29% 40% 48%
Note: figures have been restated in order to include credit card related financing solutions and FX.(1) Product Relative Value as a proxy of a better economic representation of units sold.
Units
PRV

132Q19 ResultsJuly 31st 2019
Digital transformation: a competitive advantage for BBVA
CUSTOMER GROWTH
Self-configurationof rules help clients manage their finances
• Paycheck savings
• Minimum and maximum balance
• Rounding off in purchases
• Budget savings
• End of month savings
OPEN BANKING: PARTNERSHIP WITH UBER
Uber’s first financial product outside USA
First BBVA product created through our Open Banking
capabilities in a partnership with a Bigtech company
Co-branded account and debit card for 500k Uber
drivers in Mexico
CUSTOMER ENGAGEMENT AND ADVICE
SELF-DRIVEN ACCOUNT

142Q19 ResultsJuly 31st 2019
ENGAGEMENT
Resulting in higher client satisfaction and retention
Leading since 2017NPS (2)
-18% Attrition rate
The impact of transformation: SpainTwo years change (Jun’17 vs Jun’19)
GROWTH
Acquiring more engaged and profitable clients
+11%Net fees & commissions (1)
EFFICIENCY
Lowering cost to sell and serve our clients
-8%Operating Expenses
-14%Branches
+79%Remote serviced clients
Notes: (1) Fees excluding CIB business. (2) NPS: Net promoter score. Peer Group: four largest Spanish Banks (3) The Forrester Banking WaveTM: European Mobile Apps, Q2 2019
BBVA Spain has grown its customer base. It has also increased client satisfaction
and retention by using a more efficient relationship model, which has lowered
operating expenses
+33%Digitally acquired clients
App European Leader in Mobile Banking2017 | 2018 | 2019 (3)

Business
Areas

162Q19 ResultsJuly 31st 2019
2.012.04 2.06
1.94 1.96 1.99
0.07 0.07 0.06
2Q18 1Q19 2Q19
64.4
32.4
148.0
€Bn
244.8
Demand Deposits
Off-BSFunds
Time Deposits
YoY
Cust. Funds
9.7
18.8
22.7
16.5
13.6
12.8
73.4
€Bn167.5
Mortgages
Public sector
Corporates + CIB
Consumer + Credit Cards
Other Commercial
Others
YoY
Very small businesses
Lending1
Spain
Loans: continued growth in most profitable retail segments and commercial portfolios
Customer spread continued improvement due to higher loan yields
NII: significant recovery QoQ (+5%) thanks togood commercial activity, higher contribution from ALCO and lower cost of excess liquidity
Costs continue to go down
Asset quality positively impacted by mortgage portfolio sales. Excluding this, CoR < 20 bps
Activity (Jun-19)
Key Ratios
Asset Quality ratios (%)Customer Spread (%)
Customer spread
Cost of deposits
Coverage
CoR(YtD)
Yield on loans
YtDYtD
+0.8%
+0.7% -0.3%
+2.2%
-19.4%
Profit & Loss Δ (%) Δ (%)
(€m) 2Q19 vs 2Q18 1H19 vs 1H18
Net Interest Income 927 0.1 1,808 -2.4
Net Fees and Commissions 432 -1.5 846 -0.6
Net Trading Income -16 n.s. 92 -67.4
Other Income & Expenses -22 -51.6 72 91.7
Gross Income 1,321 -8.0 2,818 -6.8
Operating Expenses -814 -3.5 -1,628 -3.5
Operating Income 507 -14.4 1,190 -10.9
Impairment on Financial Assets 102 n.s. 25 n.s.
Provisions & other gains (losses) -65 160.2 -188 181.9
Income Before Tax 545 13.7 1,027 -2.8
Income Tax -155 13.8 -292 -5.5
Net Attributable Profit 389 13.7 734 -1.7
NPLratio
+18.2%
Note: Activity excludes repos. (1) Performing loans under management.
58.2 57.8 58.0
6.32
4.95 4.60
0.25 0.18-0.03
2Q18 1Q19 2Q19
-3.3%
+4.3%
+7.5%
+4.7%
-3.8%
-1.7%
+9.2%
+0.8%

172Q19 ResultsJuly 31st 2019
4.51
5.045.04
3.97 4.19 4.08
0.540.84 0.96
2Q18 1Q19 2Q19
USA
Key Ratios
Asset Quality ratios (%)Customer Spread (%)
Customer spreadCost of deposits
Coverage
NPLratio
CoR(YtD)
Yield on loans
Loan growth rate decelerating to c. 4% YoY, explained by consumer and commercial loans, but with consumer still growing at double digit
NII growth at mid single-digit YoY in 1H19, supported by loan growth and higher customer spread
Positive jaws, with flat operating expenses
Asset quality indicators improving QoQ. 82 bps in 2Q19 CoR vs. 106 bps in 1Q19
Profit & Loss Δ Constant Δ Constant Δ Current
(€m constant) 2Q19 vs 2Q18 (%) 1H19 vs 1H18 (%) vs 1H18 (%)
Net Interest Income 599 2.0 1,217 5.2 12.6
Net Fees and Commissions 168 3.7 320 -1.0 5.8
Net Trading Income 38 50.8 79 52.5 61.8
Other Income & Expenses 1 -17.8 -1 n.s. n.s.
Gross Income 807 3.9 1,615 5.1 12.4
Operating Expenses -484 0.3 -959 0.4 7.5
Operating Income 323 9.9 655 12.7 20.5
Impairment on Financial Assets -124 174.1 -286 325.6 355.8
Provisions & other gains (losses) 4 4.4 -6 n.s. n.s.
Income Before Tax 203 -19.6 363 -31.0 -26.3
Income Tax -34 -37.0 -67 -42.3 -38.4
Net Attributable Profit 169 -14.9 297 -27.8 -22.9
Note: Activity excludes repos. (1) Performing loans under management.
93.3
84.991.2
1.20
1.401.31
Note: Activity excludes repos. (1) Performing loans under management.
1.35.4
9.0
24.4
6.0
14.0
€Bn
60.2
Mortgages
OthersPublic Sector
Consumer + Credit Cards
C&IB
YoY
Other Commercial
Lending1
16.0
47.2
€Bn63.1
Demand Deposits
Time Deposits
YoY
Cust. Funds
YtDYtDActivity (Jun-19)(constant €)
-1.8%
+0.4%
+4.0%
+1.3%
+0.9%
+11.2%
+3.7%
+1.2%
-0.2%+51.4%
+3.7%
-1.6%
Note: Activity excludes repos. (1) Performing loans under management.
0.23
1.06
0.94
2Q18 1Q19 2Q19

182Q19 ResultsJuly 31st 2019
Mexico
Key Ratios
Asset Quality ratios (%)Customer Spread (%)
Customer spread
Cost of deposits
Coverage
CoR(YtD)
Yield on loans
Profit & Loss ΔConstant Δ Constant Δ Current
(€m constant) 2Q19 vs 2Q18 (%) 1H19 vs 1H18 (%) vs 1H18 (%)
Net Interest Income 1,532 7.8 3,042 7.8 14.9
Net Fees and Commissions 319 -3.0 621 -1.0 5.5
Net Trading Income 72 -11.4 135 -11.8 -6.0
Other Income & Expenses 62 48.2 102 14.0 21.6
Gross Income 1,985 5.9 3,901 5.6 12.6
Operating Expenses -651 4.5 -1,290 4.7 11.6
Operating Income 1,333 6.6 2,611 6.1 13.1
Impairment on Financial Assets -420 18.8 -818 8.4 15.5
Provisions & other gains (losses) -13 n.s. -10 n.s. n.s.
Income Before Tax 900 -3.4 1,783 1.1 7.8
Income Tax -245 -4.6 -496 2.5 9.2
Net Attributable Profit 655 -3.0 1,287 0.6 7.2
NII as the main P&L driver
Loan growth supported by retail (+8% YoY), gaining share in consumer (+130 bps YoY).
Positive Jaws: Core revenues (+6.2%) above Opexgrowth (+3.7% excl. increased contribution to BBVA Foundation)
Strong asset quality metrics. CoR at 298 bps, in line with expectations
NPLratio
YtDYtD
3.6
23.6
3.64.8
8.3
10.1
€Bn54.1
Mortgages
Public sector
Other Commercial
Consumer
SMEs
YoY
Credit Cards
Lending1
23.5
11.5
40.4
€Bn
75.4
Demand Deposits
Off-BSFunds
Time Deposits
YoY
Cust. Funds1
+6.2%+2.6%
(1) Performing loans and Cust. Funds under management, excluding repos, according to local GAAP .
Activity (Jun-19)(constant €)
+13.6%
+9.8%
+12.4%
+2.9%+1.1%
+1.5%
+4.7%
+4.9%
+5.8%
+2.9%
+7.3%
12.6613.04 13.08
10.73 10.74 10.70
1.932.31 2.38
2Q18 1Q19 2Q19
154.6 158.7147.7
1.96 2.042.19
2.93 2.93 2.98
2Q18 1Q19 2Q19

192Q19 ResultsJuly 31st 2019
12.3
9.4
12.3
YoY1
FC
Commercial
Retail
TL
4.44
4.95 5.175.18
2.50 2.72
2Q18 1Q19 2Q19
3.5
11.8
6.1
13.3
FC
Time
Demand
TL
Time
Demand
YoY1
Turkey
Activity (Jun-19)(constant €; Bank only)
Key Ratios
Asset Quality ratios (%)Customer Spread (%)
Coverage
CoR(YtD)
Resilience in a more challenging environment vs. 1H18
Loans: TL loans (-3.5% YoY) impacted by slowdown in commercial and negative growth in retail. FC loans continue decreasing
Customer spread: Continued recovery on TL and FC spreads QoQ thanks to successful price management
Strong fee growth
Asset quality: CoR at 157 bps, so far better than expectations (<300 bps)
NPLratio
YtD
FC
TL
YtD
2.8%
-3.5%
-20.5%
2.0%
-8.4%
-8.6%
13.4%
5.1%
0.7%
-2.6%
4.0%
6.4%
-1.8%
-7.9%
(1) FC evolution excluding FX impact. (2) Performing loans and Cust. Funds under management, excluding repos, according to local GAAP.
Profit & Loss Δ Constant Δ Constant Δ Current
(€m constant) 2Q19 vs 2Q18 (%) 1H19 vs 1H18 (%) vs 1H18 (%)
Net Interest Income 686 10.3 1,353 15.0 -10.4
Net Fees and Commissions 174 23.1 360 24.5 -2.9
Net Trading Income -55 381.3 -65 n.s. n.s.
Other Income & Expenses 24 78.5 30 -2.6 -24.1
Gross Income 828 8.3 1,677 11.9 -12.8
Operating Expenses -293 9.8 -594 12.2 -12.5
Operating Income 535 7.5 1,084 11.7 -13.0
Impairment on Financial Assets -143 6.2 -337 37.1 6.8
Provisions & other gains (losses) -20 n.s. -21 n.s. n.s.
Income Before Tax 372 0.9 726 -3.5 -24.7
Income Tax -76 -4.4 -153 -6.6 -27.2
Non-controlling Interest -150 2.4 -291 -2.4 -23.9
Net Attributable Profit 146 2.4 282 -2.8 -24.2
Lending2 Cust. Funds2
75.6 77.6 75.5
4.475.75 6.33
1.23
1.821.57
2Q18 1Q19 2Q19
YtD
6.4%
YtD
-1.8%

202Q19 ResultsJuly 31st 2019
1.142.13
3.00
2Q18 1Q19 2Q19
South America
Key Ratios
Cost of Risk YTD (%)Customer Spread (%)
Colombia. Double digit bottom line growth driven by revenues (+5%) and flat expenses and provisions
Peru. NII growing at double digits and positive jaws
Argentina. Bottom line improvement driven by higher contribution from the securities portfolio and the sale of Prisma stake in 1Q19
Note: Activity excludes repos. (1) Performing loans under management. (2) Excluding BBVA Chile.
Net Attributable Profit Δ Constant1
Δ Constant1
Δ Current
(€m constant) 2Q19 vs 2Q18 (%) 1H19 vs 1H18 (%) vs 1H18 (%)
Colombia 73 33.2 130 13.1 8.2
Peru 55 10.7 98 12.6 17.9
Argentina 50 n.s. 110 n.s. n.s.
Other2 34 -2.5 66 5.5 1.1
South America 211 60.6 404 72.4 51.8
6.79
6.76
6.79
6.756.62
6.45
13.29
15.98 16.25
2Q18 1Q19 2Q19
1.96 2.301.87
1.291.60 1.64
YtDYtD
5.0
3.9
14.3
12.3
€Bn35.4
Colombia
Other
Argentina
YoY
Peru
Lending1
13.0
6.9
15.5
14.2
€Bn49.5
Colombia
Other
Argentina
YoY
Peru
Cust. Funds
+2.0%
+6.3%
+20.1%
+8.2%
+2.3%
+2.9%
+10.4%
+45.1%
+4.2%
+11.5%+6.3%
+9.5%
Activity (Jun-19)(constant €)
(1) Venezuela in current €m
(2) Other includes BBVA Forum, Venezuela, Paraguay, Uruguay and Bolivia
South America comparison at constant perimeter (excl. BBVA Chile)
Note: Activity excludes repos. Excluding BBVA Chile. (1) Performing loans under management.

Final Remarks

22
Excellent 2Q Resultsdriven by our unique and diversified footprint and business model
Robust core revenues with double-digit growth
in Net Interest Income
Best-in-class efficiency with continuous improvement in our
operating jaws
Sound risk indicators with very positive evolution
in the year
Strong capital position with CET1 FL already within the target
range, earlier than expected
Outstanding delivery on shareholder value creation with
double-digit profitability, leading our European peer group
Ahead of the curve in digital transformation, positively
impacting growth, customer engagement and efficiency

Customer spread by
country01
04
0702
03
06
05
08
09
10
Annex
Gross Income breakdown
Net Attributable Profit evolution
P&L Accounts by business unit
Argentina: hyperinflation adjustment
ALCO Portfolio, NII Sensitivity and LCRs & NSFRs
Garanti: wholesale funding
Capital and APRs by business area
Book Value of the main subsidiaries
Digital sales breakdown

Customer spread
by country
01

252Q19 ResultsJuly 31st 2019
Customer spreads: Quarterly evolution
(1) Foreign currency
Note: USA ex NY Business Activity.
2Q18 3Q18 4Q18 1Q19 2Q19
Spain 1.94% 1.93% 1.95% 1.96% 1.99%
Yield on Loans 2.01% 2.01% 2.03% 2.04% 2.06%
Cost of Deposits -0.07% -0.08% -0.08% -0.07% -0.06%
USA 3.97% 3.99% 4.09% 4.19% 4.08%
Yield on Loans 4.51% 4.65% 4.83% 5.04% 5.04%
Cost of Deposits -0.54% -0.66% -0.74% -0.84% -0.96%
Mexico MXN 11.89% 11.80% 11.76% 11.81% 11.81%
Yield on Loans 14.20% 14.29% 14.38% 14.50% 14.56%
Cost of Deposits -2.30% -2.49% -2.62% -2.69% -2.75%
Mexico FC1 4.06% 4.10% 4.27% 4.42% 4.31%
Yield on Loans 4.20% 4.26% 4.46% 4.66% 4.61%
Cost of Deposits -0.14% -0.15% -0.19% -0.24% -0.31%
2Q18 3Q18 4Q18 1Q19 2Q19
Turkey TL 5.18% 4.02% 1.12% 2.50% 2.72%
Yield on Loans 15.14% 17.19% 18.98% 19.02% 19.09%
Cost of Deposits -9.96% -13.17% -17.86% -16.52% -16.37%
Turkey FC1 4.44% 4.47% 4.35% 4.95% 5.17%
Yield on Loans 6.79% 7.09% 7.48% 7.47% 7.30%
Cost of Deposits -2.35% -2.62% -3.13% -2.52% -2.13%
Argentina 13.29% 14.15% 14.72% 15.98% 16.25%
Yield on Loans 20.72% 24.00% 29.09% 28.50% 29.27%
Cost of Deposits -7.43% -9.85% -14.37% -12.53% -13.02%
Colombia 6.79% 6.78% 6.91% 6.76% 6.79%
Yield on Loans 11.22% 10.99% 11.07% 10.90% 10.88%
Cost of Deposits -4.43% -4.21% -4.16% -4.13% -4.09%
Peru 6.75% 6.70% 6.69% 6.62% 6.45%
Yield on Loans 7.84% 7.84% 7.89% 7.89% 7.85%
Cost of Deposits -1.09% -1.14% -1.20% -1.27% -1.40%
AVERAGE

262Q19 ResultsJuly 31st 2019
Customer spreads: YTD evolution
YTD AVERAGE
(1) Foreign currency
Note: USA ex NY Business Activity.
1H18 1H19
Spain 1.94% 1.98%
Yield on Loans 2.01% 2.05%
Cost of Deposits -0.07% -0.07%
USA 3.92% 4.13%
Yield on Loans 4.41% 5.04%
Cost of Deposits -0.49% -0.90%
Mexico MXN 11.97% 11.81%
Yield on Loans 14.20% 14.53%
Cost of Deposits -2.22% -2.72%
Mexico FC1 4.00% 4.36%
Yield on Loans 4.11% 4.64%
Cost of Deposits -0.11% -0.27%
1H18 1H19
Turkey TL 5.06% 2.61%
Yield on Loans 14.86% 19.05%
Cost of Deposits -9.80% -16.44%
Turkey FC1 4.31% 5.07%
Yield on Loans 6.63% 7.38%
Cost of Deposits -2.32% -2.31%
Argentina 13.01% 16.11%
Yield on Loans 20.04% 28.89%
Cost of Deposits -7.03% -12.79%
Colombia 6.75% 6.77%
Yield on Loans 11.26% 10.89%
Cost of Deposits -4.51% -4.11%
Peru 6.77% 6.53%
Yield on Loans 7.90% 7.87%
Cost of Deposits -1.13% -1.34%

Gross Income
breakdown
02

282Q19 ResultsJuly 31st 2019
Gross Income breakdown
23%
13%
14%
32%
16%
2%
Spain2,818 €m
USA1,615 €m
Turkey1,677 €m
Mexico3,901 €m
South America1,994 €m
Rest of Eurasia220 €m
Note: Figures exclude Corporate Center.
1H19(CONSTANT €)

Net Attributable
Profit evolution
03

302Q19 ResultsJuly 31st 2019
Group – Net Attributable Profit
(€M)
2,536
-65 -8 -12-114
8
-8 -5
170
-58
2,442
1H18 BBVA Chile FXEffect
Spain USA Mexico Turkey Rest ofEurasia
SouthAmerica
(w/o BBVA Chile)
Corp. Center 1H19
YoY (%)(constant €)
-1.7 -27.8 0.6 -2.8 -8.1 72.4
BUSINESSES +38 €m

P&L accounts by
business unit
04
Rest of Eurasia
Corporate Center
Colombia
Peru

322Q19 ResultsJuly 31st 2019
Rest of Eurasia - Profit & Loss
Profit & Loss Δ (%) Δ (%)
(€m) 2Q19 vs 2Q18 1H19 vs 1H18
Net Interest Income 45 13.2 84 2.2
Net Fees and Commissions 33 -17.7 69 -12.7
Net Trading Income 34 201.7 60 10.2
Other Income & Expenses 4 n.s. 6 n.s.
Gross Income 116 28.0 220 1.4
Operating Expenses -72 5.3 -142 1.3
Operating Income 44 97.3 78 1.5
Impairment on Financial Assets 0 -85.9 -11 n.s
Provisions & other gains (losses) 2 -31.9 1 -41.4
Income Before Tax 46 106.2 69 -26.1
Income Tax -7 -38.3 -13 -59.3
Net Attributable Profit 39 237.5 55 -8.0

332Q19 ResultsJuly 31st 2019
Corporate Center- Profit & Loss
Profit & Loss Δ (%) Δ (%)
(€m) 2Q19 vs 2Q18 1H19 vs 1H18
Net Interest Income -61 -12.8 -132 -4.1
Net Fees and Commissions -29 16.3 -44 36.6
Net Trading Income -67 96.2 -74 27.8
Other Income & Expenses 28 -35.0 13 -65.7
Gross Income -129 49.3 -236 25.4
Operating Expenses -243 10.0 -482 11.3
Operating Income -372 21.1 -718 15.6
Impairment on Financial Assets 0 1,233.2 0 355.2
Provisions & other gains (losses) -21 36.3 -44 -43.3
Income Before Tax -392 21.7 -762 9.1
Income Tax 72 29.5 156 3.9
Net Attributable Profit -330 19.5 -616 10.4

342Q19 ResultsJuly 31st 2019
Colombia - Profit & Loss
Profit & Loss Δ (%) Δ (%)
(constant €m) 2Q19 vs 2Q18 1H19 vs 1H18
Net Interest Income 209 5.1 418 3.8
Net Fees and Commissions 24 2.0 46 -0.9
Net Trading Income 18 29.2 38 37.3
Other Income & Expenses 2 -55.8 10 -3.3
Gross Income 252 5.2 512 5.2
Operating Expenses -88 0.4 -181 0.5
Operating Income 164 8.0 331 7.9
Impairment on Financial Assets -47 -27.4 -119 0.3
Provisions & other gains (losses) -6 -34.2 -8 -38.3
Income Before Tax 110 43.2 204 16.2
Income Tax -35 70.1 -69 22.8
Non-controlling interest -3 41.9 -5 15.4
Net Attributable Profit 73 33.2 130 13.1

352Q19 ResultsJuly 31st 2019
Peru - Profit & Loss
Profit & Loss Δ (%) Δ (%)
(constant €m) 2Q19 vs 2Q18 1H19 vs 1H18
Net Interest Income 228 12.5 448 13.7
Net Fees and Commissions 59 2.2 114 3.9
Net Trading Income 43 16.4 83 11.4
Other Income & Expenses -5 -12.3 -11 31.2
Gross Income 326 11.4 633 11.3
Operating Expenses -111 6.6 -224 7.3
Operating Income 215 14.1 409 13.6
Impairment on Financial Assets -62 83.2 -119 34.4
Provisions & other gains (losses) 12 n.s 8 n.s
Income Before Tax 164 8.2 298 10.8
Income Tax -47 7.5 -86 9.9
Non-controlling interest -63 6.7 -114 9.9
Net Attributable Profit 55 10.7 98 12.6

Argentina:
hyperinflation
adjustment
05
372Q19 ResultsJuly 31st 2019
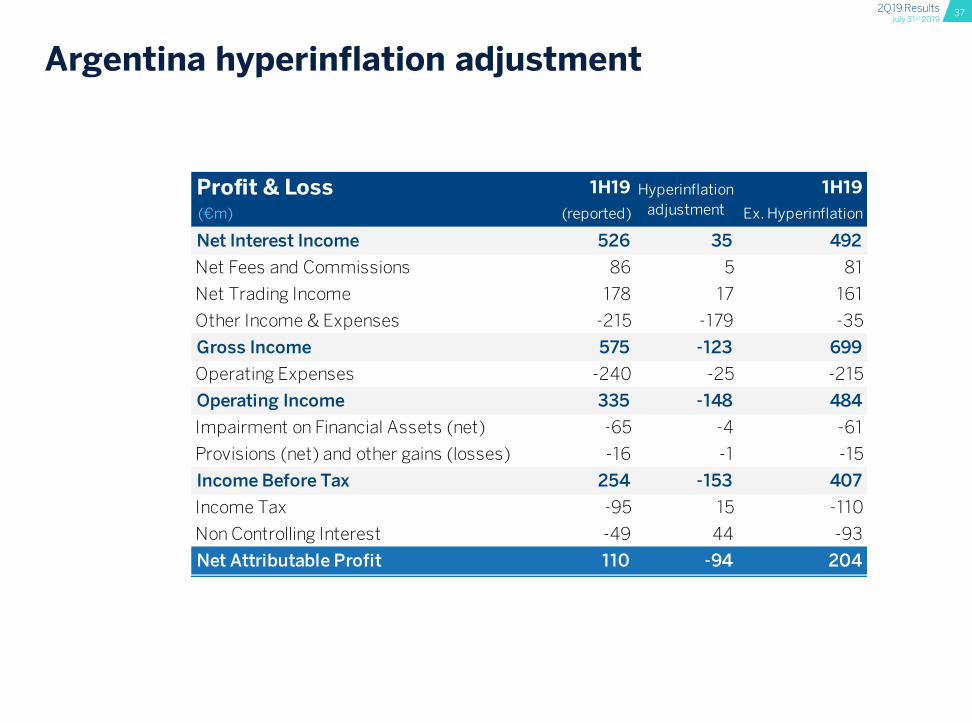
Argentina hyperinflation adjustment
Profit & Loss 1H19 1H19
(€m) (reported) Ex. Hyperinflation
Net Interest Income 526 35 492
Net Fees and Commissions 86 5 81
Net Trading Income 178 17 161
Other Income & Expenses -215 -179 -35
Gross Income 575 -123 699
Operating Expenses -240 -25 -215
Operating Income 335 -148 484
Impairment on Financial Assets (net) -65 -4 -61
Provisions (net) and other gains (losses) -16 -1 -15
Income Before Tax 254 -153 407
Income Tax -95 15 -110
Non Controlling Interest -49 44 -93
Net Attributable Profit 110 -94 204
Hyperinflation
adjustment

ALCO portfolio,
NII Sensitivity,
LCRs & NSFRs
06

392Q19 ResultsJuly 31st 2019
ALCO portfolio
USA
Turkey
Mexico
South America
Euro1
(1) Figures excludes SAREB senior bonds (€4.8bn as of Jun-18 and €4.6bn as of Mar-19 and Jun-19) and High Quality Liquid Assets portfolios (€2.4bn as of Jun-18, €8.7bn as of Mar-19 and €11.2bn as of Jun-19) .
3.40.6 1.7 0.3
17.1
2H2019 2020 2021 2022 >=2023
June 2019Amort Cost(HTC)
Fair Value (HTC&S)
Fair Value duration
(€ bn) (€ bn)
South America
0.1 2.9 1.5 years
Mexico 0.8 4.2 1.6 years
Turkey 4.2 3.9 3.4 years
USA 3.8 7.9 2.4 years
EuroSpainItalyRest
12.69.43.00.3
10.46.01.62.8
3.1 years
1.2%
52.4
23.0
11.7
8.15.03.0
Jun-19
50.8
28.4
11.2
8.65.13.5
Jun-18
56.8
23.0
11.9
8.2
6.42.9
Mar-19
ALCO Portfolio breakdown by region(€ BN)
EURO ALCO Portfolio Maturity Profile(€ BN)
EURO ALCO Yield(JUN-19, %)

402Q19 ResultsJuly 31st 2019
NII sensitivity to interest rate movements
Note: NII sensitivities calculated using our dynamic internal model with balance sheets as of May 2019. Euro NII sensitivity to upward rates includes management levers regardingdeposit cost and movements from demand deposits to time deposits. Euro NII sensitivity to downward rates according to the EBA’s “parallel-down” shock scenario.
0%
5%
10%
15%
Euro USA Mexico
NII sensitivity to +100bps
-15%
-10%
-5%
0%
Euro USA Mexico
NII sensitivity to -100bps
Estimated impact on NII in the next 12 months to parallel interest rate movements(%)

412Q19 ResultsJuly 31st 2019
Liquidity and Funding Ratios
BBVA Group and Subsidiaries LCRs & NSFRsBoth significantly above the 100% requirements at a Group level and in all banking subsidiaries
BBVA Group Euro USA Mexico Turkey S. Amer.
LCR 132% (163%1) 155% 144% 2 147% 187% well >100%
NSFR 121% 116% 111% 131% 151% well >100%
Jun-19
(1) LCR of 132% does not consider the excess liquidity of the subsidiaries outside the Eurozone. If these liquid assets are considered the ratio would reach 163%(2) BBVA USA LCR calculated according to local regulation (Fed Modified LCR).

Garanti wholesale
funding
07

432Q19 ResultsJuly 31st 2019
Turkey – Liquidity & Funding Sources
Ample liquidity buffers and limited wholesale funding maturities in 2019
Solid liquidity position:
• Improved Total LTD ratio to 98%, decreasing by 1.5 p.p. in 2Q19, driven by TRY Currency LTD improvement
by c. 6 p.p. to 142.5%
• Foreign currency loans decreased slightly (-2%) to c. USD 14 Bn in 2Q19
• Liquidity ratios above requirements: Liquidity Coverage Ratio (EBA) of 187% vs ≥100% required in 2019
Limited external wholesale funding needs: USD 11.7 Bn
FC Liquidity Buffers External Wholesale Funding Maturities2
(USD Bn)
Note: All figures are Bank-only, as of June 2019 (2) Includes TRY covered bonds and excludes on balance sheet IRS transactions
Short Term Swaps
Unencumbered FC securities
FC Reserves under ROM1
Money Market Placements
(1) ROM: Reserve Option Mechanism(3) Other includes mainly bilateral loans, secured finance and other ST funding
3Q 19 4Q19 1Q 20 2Q 20 >=3Q20
Covered Bond Subdebt Syndicated loans Securitization Senior Other
6.7
3
1.6 2.0
0.31.1
Total 12M: USD 5.0bn
USD 11.7 Bn total maturitiesc. USD 11.4 Bn liquidity buffer

Capital and RWAs
08
Capital YTD
RWAs by Business Area

452Q19 ResultsJuly 31st 2019
Capital YtD Evolution
CET1 FULLY-LOADED – BBVA GROUPYTD EVOLUTION (%, BPS)
11.34%11.52%
+69 bps
- 32 bps - 24 bps
+ 5 bps
- 1 bps
Dec-18 NetEarnings
Dividend accrual& AT1 Coupons
Regulatoryimpacts*
ArgentinaRegulatory
Equivalence
Others** Jun-19
(*) Regulatory impacts includes IFRS-16 Impact (-11 bps) & TRIMs (-13 bps) (**) Others includes mainly market related impacts (FX impact and mark to market of HTC&S portfolios) and RWAs evolution, among others
+18 bps
462Q19 ResultsJuly 31st 2019
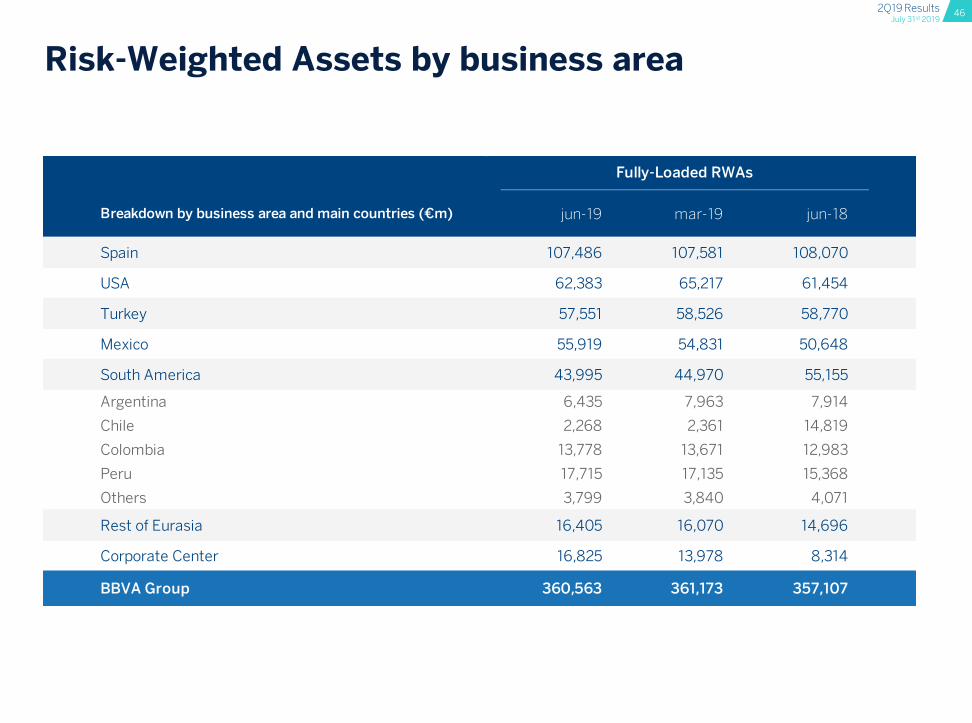
Risk-Weighted Assets by business area
Breakdown by business area and main countries (€m) jun-19 mar-19 jun-18
Spain 107,486 107,581 108,070
USA 62,383 65,217 61,454
Turkey 57,551 58,526 58,770
Mexico 55,919 54,831 50,648
South America 43,995 44,970 55,155
Argentina 6,435 7,963 7,914
Chile 2,268 2,361 14,819
Colombia 13,778 13,671 12,983
Peru 17,715 17,135 15,368
Others 3,799 3,840 4,071
Rest of Eurasia 16,405 16,070 14,696
Corporate Center 16,825 13,978 8,314
BBVA Group 360,563 361,173 357,107
Fully-Loaded RWAs

Book Value of the
main subsidiaries
09

482Q19 ResultsJuly 31st 2019
Book Value of the main subsidiaries1,2
JUN 19 (€ BN)
(1) Includes the initial investment + undistributed results + FX impact + other valuation adjustments. The Goodwill associate to each subsidiary has been deducted from its Book Value. (2) Turkey includes Garanti subsidiaries.
10.4
7.6
4.0
1.3
1.0
0.9
0.3
0.1
Mexico
USA
Turkey
Colombia
Peru
Argentina
Chile
Venezuela

Digital sales
breakdown
10

502Q19 ResultsJuly 31st 2019
Digital sales: outstanding trend across the board
GROUP
(% of total sales YtD, # of transactions and PRV1)
24.9
42.649.4
18.2
33.0
43.8
Jun-17 Jun-18 Jun-19
17.822.9
28.0
13.6
21.325.6
Jun-17 Jun-18 Jun-19
23.4
40.8
54.7
12.7
26.7
43.0
Jun-17 Jun-18 Jun-19
53.0
81.1 84.6
38.3
58.8 65.4
Jun-17 Jun-18 Jun-19
32.8
56.6 61.3
13.221.8 24.9
Jun-17 Jun-18 Jun-19
30.5
49.858.1
18.7
33.043.8
Jun-17 Jun-18 Jun-19
SPAIN USA2
MEXICO TURKEY SOUTH AMERICA
UNITS PRV
UNITS
PRV
Figures have been restated in order to include credit card related financing solutions and FX.
Group and South America figures exclude Venezuela and Chile.
(1) Product Relative Value as a proxy of a better economic representation of units sold.
(2) Excludes ClearSpend Debit cards.
