batch adsorption, kinetics and dft study of cd(ii) ion
TRANSCRIPT

Article
Batch Adsorption, Kinetics and DFT study of Cd(II) Ion From
Aqueous Solution By Low Cost Starch Based Activated Carbon
Saad Melhi 1, Bushra2, Saeed Ullah Jan2*, Adnan Ali Khan2, Khan Badshah2, Saeed Ullah2
1 Department of Chemistry, College of Science, University of Bisha, Bisha, 61922,
2 Department of Chemistry, Chakdara Lower Dir, 18800, University of Malakand, Pakistan
*Correspondence: [email protected]
Abstract: Cadmium(II) contamination in the environment is an emerging problem due to its acute
toxicity and mobility, so it is very urgent to remove this specie from industrial wastewater before it
is discharged into the environment. Thus, a starch-based activated carbon (AC) with a specific sur-
face area of 1600 m2g-1 is used as an adsorbent for the capturing of toxic Cadmium(II) ion from syn-
thetic solution. The sorbent is characterized by BET, SEM, TEM, XRD, FT-IR, TGA, and zeta poten-
tial. The maximum uptake (284 mg g-1) of Cadmium(II) ion is obtained at pH 6. The thermodynamics
parameters like ∆G, ∆H, ΔS are found to be -17.42 kJmol-1, 6.49 kJ mol-1, and 55.66 Jmol-1K-1 respec-
tively, revealing that the adsorption mechanism is endothermic, spontaneous, and feasible. The ex-
perimental data follows the D-R and Langmuir models well. The mass transfer is controlled by
pseudo 2nd order kinetics. Furthermore, the density functional theory simulations demonstrates that
the activated carbon strongly interacted with the Cd(II) ion through its various active sites. The
adsorption energy noted for all interactive sites is highly negative (-0.45 eV to -10.03 eV), shows that
the adsorption process is spontaneous and stable which are in agreement with the experimental
thermodynamics analysis.
Keywords: Adsorption; DFT; Cadmium(II) ion; Activated carbon; Kinetics; Thermodynamics;
1. Introduction
Due to the rapid industrialization and urbanization the heavy metals concentra-
tion has increased enormously in water reservoirs. The rate of depletion of water res-
ervoirs is alarming and is a serious environmental problem[1,2]. The clean water vi-
tality cannot be compromised at any case. The large number of pollutants have been
identified from industrial and domestic sources and are included of antibiotics, dyes
phenols, insecticides and heavy metals constituents [3,4]. Due to the non- degradable
and accumulative nature, heavy metals are extremely harmful for living organisms.
Among heavy metals the non-nutritive cadmium (II) metal is classified as human
teratogen, carcinogen, the most dangerous and priority water pollutant with biolog-
ical half-life about 10-30 years [5].
The main sources of Cd(II) ion contamination are industrial wastewater, com-
bustion of oil and coal and wastes incineration. The Cd(II) is extensively used in
different industrial processes e.g., as a coloring pigment, anticorrosive agent, fab-
rication of batteries, in a nuclear power plants as an absorber of neutrons. It is
been estimated that about 7000 tones /annum has been released on global level
[6]. According to the world health organization (WHO), the permissible level of
Cd(II) is less than 0.003 mg dm-3 for drinking water [6]. The Cd(II) has noxious
Preprints (www.preprints.org) | NOT PEER-REVIEWED | Posted: 20 September 2021 doi:10.20944/preprints202109.0331.v1
© 2021 by the author(s). Distributed under a Creative Commons CC BY license.

effect on lungs, liver and kidney even in a very low concentration [7,8]. The inhal-
ing of Cd(II) contaminated air can cause shortness of breath, damage of mucous
membranes and lung edema. The intake of food contaminated with Cd(II) can
cause diarrhoea and severe vomiting. Similarly, it can cause bone damage, infer-
tility, prostate cancer and tumor [9,10]. So, it is pertinent for human health and
environmental safety to ascertain the concentration of Cd(II) on regular basis and
develop techniques for the capturing of Cd(II) ion, before it is discharged into
water bodies.
Several techniques like reverse osmosis, ion exchange, chemical precipitation, electrolytic
extraction, redox method, and electrodialysis have been designed and applied for the
scavenging of heavy metals. However, these methods have their limitations e.g., long
processing time, high energy consumption, and poor sequestration of heavy metals [11].
Chemical precipitation is one of the most widely used for heavy metal removal from
inorganic effluent in industry due to its simple operation . These conventional chemical
precipitation processes produce insoluble precipitates of heavy metals as hydroxide,
sulfide, carbonate and phosphate [12].
Ion Exchange Ion exchange can attract soluble ions from the liquid phase to the solid phase, which is the most widely used method in water treatment industry. As a cost-effective method, ion exchange process normally involves low-cost materials and con-venient operations, and it has been proved to be very effective for removing heavy metals from aqueous solutions, particular for treating water with low concentration of heavy metals[13].
The adsorption technique is efficient as it is simple in operation, cost-effec-
tive, and environmentally friendly [1]. A variety of adsorbents like silica gel
[14,15], clay [16,17] and bio sorbents [18] have already been reported for the se-
questration of heavy metals from wastewater. The theoretical analysis is a com-
plementary tool to know the mechanism of the absorption process [19-21]. The efficiency of ACs as adsorbents for diverse types of pollutants is well reported [22]. It is well known that activated carbon has been found much efficient for removing organic compounds than metals and other inorganic pollutants. Efforts are ongoing to substan-tially improve the potential of carbon surface by using different chemicals or suitable treatment methods which will enable AC to enhance its potential for the removal of spe-cific contaminants from aqueous phase. The physical and chemical structure of carbon could be changed by various methods, i.e. activation conditions (different agents, tem-perature and time of the process), precursor, additives, etc.
Starch based activated carbon was prepared and characterized to remove
Cd(II) ion from spiked water. For the determination of the adsorption mechanism
the data were subjected to different adsorption models. The sorption obeys 2nd
order kinetics, Freundlich and Langmuir isotherms and was more favorable at pH
6. For the determination of thermodynamic parameters of the adsorption mecha-
nism, the temperature study was carried out, which shows that the adsorption
was spontaneous, feasible, and of endothermic nature. The DFT supported the
experimental findings.
Preprints (www.preprints.org) | NOT PEER-REVIEWED | Posted: 20 September 2021 doi:10.20944/preprints202109.0331.v1

2. Experimental Section
2.1. Materials
All the chemicals like CdCl2, dithizone, NaOH, HCl, KOH, CH3COOH,
CH3COONa, H3BO3, and NaOH of analytical grade were supplied by Sigma Al-
drich Pakistan (Pvt.) Ltd. and were used without any further purification. The solu-
tions of buffer 1-7 with the ionic strength of 10 mmol were prepared by taking the
calculated amount of KCl and HCl for buffer 1-2, CH3COOH, and CH3COONa for
buffer 3-6, and NaOH and H3BO3 for buffer 7. CdCl2 was mixed with dithizone in 2
M NaOH to get orange coloured Cd-dithizone complex (Figure 1) and its absorb-
ance was studied at 549 nm wavelength as compared to the standard [23].
The concentration of Cadmium (II) ions was determined from its complex
with dithizone in the presence of non-ionic surfactant e.g., CTAB. The molar ab-
sorptivity of complex becomes almost double as compare to the standard
method and a very small amount of Cd+2 can be determined spectrometrically at
wavelength of 549 nm. The increase in the molar absorptivity and rate constant
are due to the micelle, which favours the formation of a Cd (II) ion and dithi-
zone complex.
Reaction: Cd2+ + n dithizone ⇋ Complex
k =[ Complex]
[ Cd+2] [Dithizone]n ⇋
[ Complex]
[ Cd]+2= k [Dithizone]n
Figure 1. Cadmium Dithizone Complex.
2.2. Synthesis of Adsorbent
The starch sample was sieved by 300 mesh size and mixed with potassium
hydroxide in a 1:4 weight ratio and activated at 850oC for 90 minutes with argon
at 3oC/minute rise. The obtained product was thoroughly washed again and
again with 5 wt. % HCl followed by washing with double distilled water until
the product was neutralized and dried at 120oC overnight. The product thus ob-
tained was named starch based activated carbon (AC) and characterized by BET,
SEM, TEM, XRD, FT-IR, TGA, and zeta potential [24].
2.3. Adsorption experiment
Glass culture tubes with a given amount of adsorbent and a specific volume
of sorbate with a known concentration were used in the batch mode experi-
ments at room temperature or specified otherwise. The culture tubes were
shaken on a wrist action shaker (Model Burrell 75, Burrell Scientific, USA). After
shaking the concentration of Cd(II) was recorded by using a double beam UV-
Preprints (www.preprints.org) | NOT PEER-REVIEWED | Posted: 20 September 2021 doi:10.20944/preprints202109.0331.v1

Visible spectrophotometer (Labmed. Inc UVD 2960). The adsorbed amount of
Cd(II) and the distribution coefficient (Kd) were determined through the follow-
ing equations.
%𝐴𝑑𝑠𝑜𝑟𝑝𝑡𝑖𝑜𝑛 =Ai − 𝐴𝑓
𝐴𝑖× 𝑣𝑜𝑙 (1)
𝐾𝑑 =𝐴𝑚𝑜𝑢𝑛𝑡 𝑜𝑓 𝐶𝑑 (𝐼𝐼) 𝑖𝑜𝑛 𝑎𝑑𝑠𝑜𝑟𝑏𝑒𝑑 𝑜𝑛𝑡𝑜 𝑠𝑜𝑟𝑏𝑒𝑛𝑡
𝐴𝑚𝑜𝑢𝑛𝑡 𝑜𝑓 𝐶𝑑 (𝐼𝐼) 𝑖𝑜𝑛 𝑟𝑒𝑚𝑎𝑖𝑛𝑖𝑛𝑔 𝑖𝑛 𝑡ℎ𝑒 𝑠𝑜𝑙𝑢𝑡𝑖𝑜𝑛×
𝑉
𝑊 (2)
where Ai is the initial Cd(II) concentration, Af is the equilibrium concentration,
W represents the weight of sorbent and V is the volume of Cd(II) solution.
All the experiments were carried out in triplicate at room temperature or
described otherwise. The linear regression of the data was carried out and was
in the range of 1–0.997 for all analyses.
3. Results and discussion
3.1. Material Characterization
The activated carbon derived from starch was used for the adsorption of
Cd(II) ion from industrial wastewater. The material was characterized through
the following techniques.
Preprints (www.preprints.org) | NOT PEER-REVIEWED | Posted: 20 September 2021 doi:10.20944/preprints202109.0331.v1
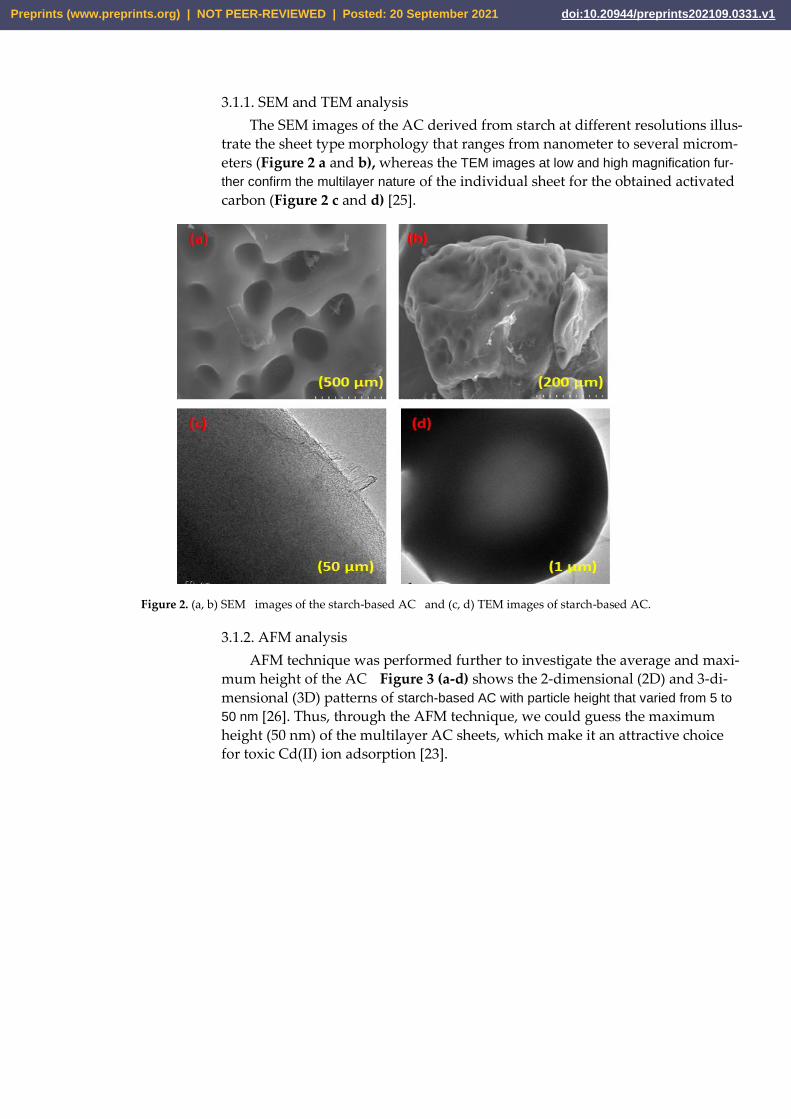
3.1.1. SEM and TEM analysis
The SEM images of the AC derived from starch at different resolutions illus-
trate the sheet type morphology that ranges from nanometer to several microm-
eters (Figure 2 a and b), whereas the TEM images at low and high magnification fur-
ther confirm the multilayer nature of the individual sheet for the obtained activated
carbon (Figure 2 c and d) [25].
Figure 2. (a, b) SEM” images of the starch-based AC “and (c, d) TEM images of starch-based AC.
3.1.2. AFM analysis
AFM technique was performed further to investigate the average and maxi-
mum height of the AC Figure 3 (a-d) shows the 2-dimensional (2D) and 3-di-
mensional (3D) patterns of starch-based AC with particle height that varied from 5 to
50 nm [26]. Thus, through the AFM technique, we could guess the maximum
height (50 nm) of the multilayer AC sheets, which make it an attractive choice
for toxic Cd(II) ion adsorption [23].
Preprints (www.preprints.org) | NOT PEER-REVIEWED | Posted: 20 September 2021 doi:10.20944/preprints202109.0331.v1

Figure 3. AFM (a) 2D and (b) 3D images of the Starch-based AC.
3.1.3. FT-IR analysis
FTIR analysis is used to confirm different groups on the surface of AC (Fig-
ure 4). The broader peak at 3480 cm-1 in corresponds to the hydroxyl group [27].
The absorption peaks at 2920 is due to -CH3 and peak at 1720 cm-1 is due to -C=O
vibration [28]. The peaks on 1550 and 1115 cm-1 representing –NO2 and -SO3H
groups respectively [29]. The spectra indicates that starch-based AC contains
aromatic rings [30].
Figure 4. FTIR spectra of starch-based AC.
Preprints (www.preprints.org) | NOT PEER-REVIEWED | Posted: 20 September 2021 doi:10.20944/preprints202109.0331.v1

3.1.4. XRD analysis
The structure and crystallinity of activated carbon was investigated by us-
ing XRD technique Figure 5 represents the XRD patterns of virgin starch-based
AC. In the XRD patterns, the peaks at 2θ= 25° and 2θ= 43.460° originates from its
graphite-like nature and can be assigned to the (002) and (100) plane of graphitic
carbon, respectively [31,32].
Figure 5. XRD pattern of starch-based AC.
3.1.5. TGA Study
The thermal stability of the starch-based AC was studied at temperature up
to 1000 o C, from TGA analysis it can be concluded that the starch-based AC was
stable at a very high temperature (Figure 6). The starch-based AC converted into
CO and CO2 [33] and some other compounds at various temperatures [34]. At
the end only 11% loss was observed from the total mass of starch-based AC.
Figure 6. TGA plot of the Starch-based AC.
3.1.5. Zeta potential and zeta sizer analysis
The particle size distribution is a useful parameter to elucidate the arrange-
ment of particle size in the adsorbents while its zeta potential determines its sur-
face charge required for dispersion. Figure 7 shows the size distribution and
zeta potential plots of the AC, which reveals that the average particle size was
Preprints (www.preprints.org) | NOT PEER-REVIEWED | Posted: 20 September 2021 doi:10.20944/preprints202109.0331.v1
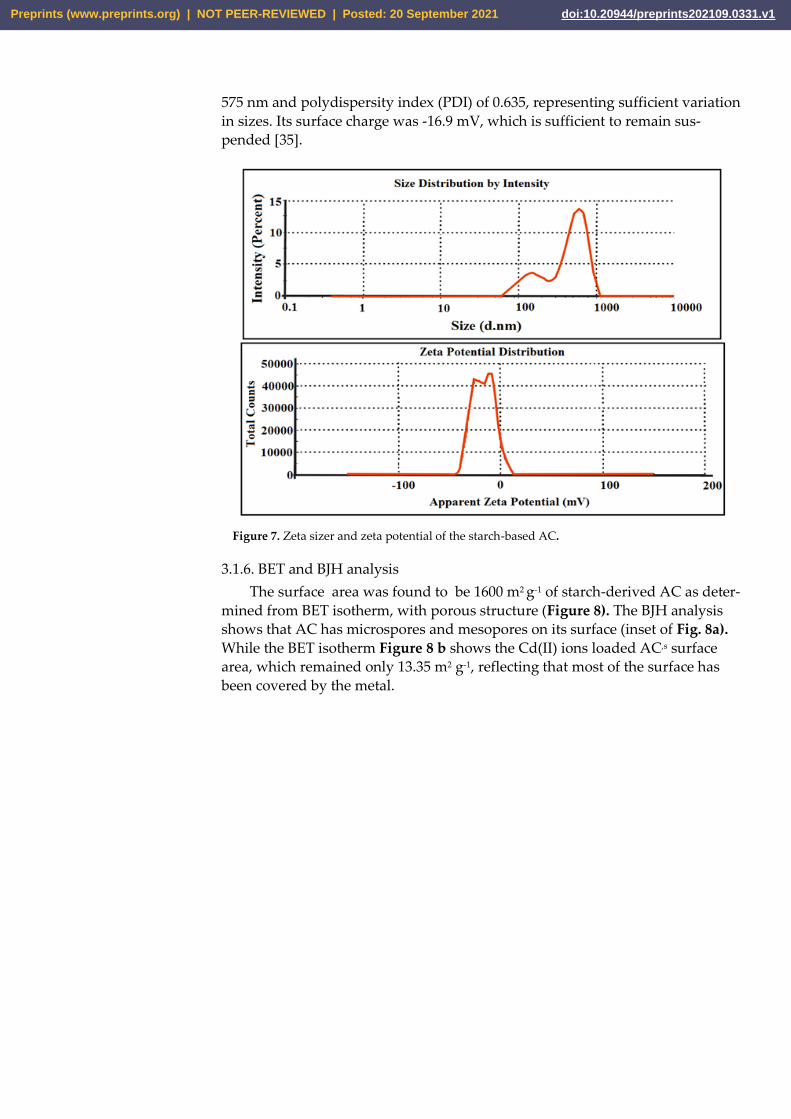
575 nm and polydispersity index (PDI) of 0.635, representing sufficient variation
in sizes. Its surface charge was -16.9 mV, which is sufficient to remain sus-
pended [35].
Figure 7. Zeta sizer and zeta potential of the starch-based AC.
3.1.6. BET and BJH analysis
The surface .area was found to .be 1600 m2 g-1 of starch-derived AC as deter-
mined from BET isotherm, with porous structure (Figure 8). The BJH analysis
shows that AC has microspores and mesopores on its surface (inset of Fig. 8a).
While the BET isotherm Figure 8 b shows the Cd(II) ions loaded AC,s surface
area, which remained only 13.35 m2 g-1, reflecting that most of the surface has
been covered by the metal.
Preprints (www.preprints.org) | NOT PEER-REVIEWED | Posted: 20 September 2021 doi:10.20944/preprints202109.0331.v1

Figure 8. (a) Nitrogen sorption isotherm of Starch-based AC at 77.5 K with inset of BJH pore size
distribution and (b) BET isotherm of the Cd(II) ion loaded AC
3.2. Adsorption experiments
3.2.1. Effect of pH on sorption
The sorption capacity is greatly influenced by the medium [2]. The effect of
pH on the adsorption of Cd(II) was investigated at pH 1.0 -9.0. The
concentration of sorbate of 100 mg L-1, sorbent amount of 30 mg, and shaking
time of 120 minutes were chosen arbitrarily. The equilibrium uptake of Cd(II)
increased notably up to pH 6 and then decreased continuously (Figure 9a).
The maximum uptake (98.58%) was observed at pH 6 and was selected for
further experiments. At acidic pH, the electrostatic repulsion is created
between protonated surface of AC and Cd(II) metal ion. These observations
have also been reported by other researchers [5,36]. Beyond pH 6 the
adsorption capacity has decreased due the formation of Cd(OH)2 (cadmium
hydroxide) [37].
Based on equilibrium constants, a speciation diagram was constructed and is
depicted in Figure 9e. The diagram shows that at pH below 6, the Cd2+ ion
predominates and at pH values just below 7, cadmium begins to precipitate
out as Cd(OH)2. At pH of 6 the species distribution is approximately 90%
Cd2+ and 10% Cd(OH)+. This means that all the species occurring at pH values
of 6 and below carry a positive charge either as Cd2+ or Cd(OH)+. Depending
on the pH of the solution, the Cd2+ in aqueous solution can form various
species or hydro complexes.[38]
Preprints (www.preprints.org) | NOT PEER-REVIEWED | Posted: 20 September 2021 doi:10.20944/preprints202109.0331.v1

3.2.2. Effect of Cd(II) ion solution concentration
The effect of Cd(II) ions solution concentration was studied at 20-220 mg/L (
Figure 3.63b). The rate of removal of adsobate was maximum at 80 mg/L and
then it remained constant [39,40], thus 80 mg/L was taken as standard for fur-
ther experiments.
The Langmuir equation was used in the following form:
𝐶𝑒
𝑞𝑒
=𝐶𝑒
𝑄max.
+1
𝐾𝐿𝑄max.
(3)
where Qmax. is the amount adsorbed, KL , qe and Ce were calculated from slope
and intercept of the graph, (Figure 9d) and their magnitudes are listed in Table
1. The adsorbate affinity (RL) is represented as below:
1
1L
L e
RK C
=+
(4)
The RL (0.0072) indicating favourable adsorption [41]..
The Freundlich equation was used in the following form [42].
1log log loge F eq K C
n= + (5)
where the adsorption capacity (KF mmol.g-1 ) and 1/n represented the sur-
face heterogeneity and can be calculated from the slope and intercept of the
graph (Figure 9c). The Freundlich parameters are tabulated in Table 1 [43,44].
Table 1. Langmuir and Freundlich parameters along with correlation coefficients for the adsorption of Cd (II) ion onto
AC at pH 6.
Langmuir parameters Freundlich parameters
Temperature (K) Qmax. (mg/g) KL RL R2 KF 1/n R2
283 270.0 26.74 0.0072 0.999 1.002 0.0025 0.994
293 281.0 25.57 0.0011 0.997 1.321 0.0991 0.984
303 284.11 25.24 0.0010 0.998 1.3321 0.0031 0.988
Preprints (www.preprints.org) | NOT PEER-REVIEWED | Posted: 20 September 2021 doi:10.20944/preprints202109.0331.v1
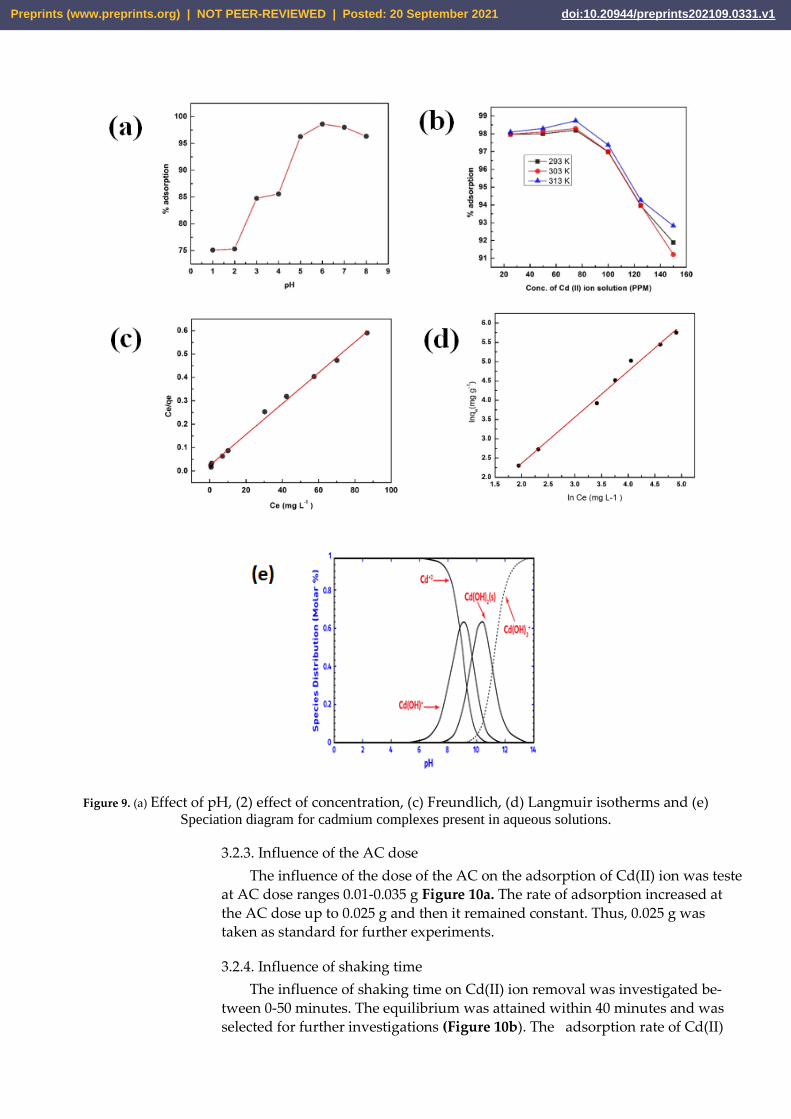
Figure 9. (a) Effect of pH, (2) effect of concentration, (c) Freundlich, (d) Langmuir isotherms and (e) Speciation diagram for cadmium complexes present in aqueous solutions.
3.2.3. Influence of the AC dose
The influence of the dose of the AC on the adsorption of Cd(II) ion was teste
at AC dose ranges 0.01-0.035 g Figure 10a. The rate of adsorption increased at
the AC dose up to 0.025 g and then it remained constant. Thus, 0.025 g was
taken as standard for further experiments.
3.2.4. Influence of shaking time
The influence of shaking time on Cd(II) ion removal was investigated be-
tween 0-50 minutes. The equilibrium was attained within 40 minutes and was
selected for further investigations (Figure 10b). The “adsorption rate of Cd(II)
Preprints (www.preprints.org) | NOT PEER-REVIEWED | Posted: 20 September 2021 doi:10.20944/preprints202109.0331.v1

ion was high initially, as abundant vacant sites were available and after that, the
movement of the ions was intraparticle which was relatively a slow process
The mass transfer during the process in the rate determining step can be de-
termined by using kinetic models [2,45,46]. The pseudo 2nd order equation ap-
plied in the following linear form was the best fitted.
2
2
1 1
t e e
tt
q k q q= +
(6)
where” k2 rate constant and qe can be determined from the slope Fig. 10c and
their magnitudes are calculated and are listed in Table 2. The experimental and
theoretical values of qe are in close agreement with each other, indicating the
applicability of the model.
The Reichenberg equation were used in the following form in order to fur-
ther explore the mechanism [47].
𝐹 = (1 − 6
𝜋2)𝑒−𝐵𝑇 (7)
0.4977ln(1 )TB F= − − (8)
Where F is the ratio of qt and qe and BT is a constant (Fig. 10d), showing that
both film diffusion and intraparticle diffusion are involved in the mechanism.
Table 2. Kinetic parameters of Cd(II) ion adsorption on to starch-based AC.
Parameters
Kinetic models
Rate constant
(K1 and K2)
(g mg-1min-1)
qe,cal “(mg g-1) qe,exp”
(mg g-1) “R2
Pseudo-first order 0.033 1.00 0.27466
0.951
Pseudo-second order 4.49 0.28368 0.999
Preprints (www.preprints.org) | NOT PEER-REVIEWED | Posted: 20 September 2021 doi:10.20944/preprints202109.0331.v1

Figure 10. (a) Effect of amount of AC, (b) effect of shaking time, (c) Pseudo 2nd order kinetic and (d) Reichenberg model.
4. The thermodynamic study
The effect of temperature on sorption was investigated in the temperature
ranges of 283-313K. It was observed that the adsorption increased with the in-
creases in temperature Figure 6e, which reveals that the process may be chemi-
sorption reverse may be true for physiosorption. This increase in the rate of ad-
sorption with temperature may be due to the efficient flow of sorbate molecules
against the concentration gradient or transport of sorbate through the energy
barrier. This may also create some new sites on the surface of the sorbent [48].
The thermodynamic parameters like Gibbs free energy change (ΔG), enthalpy
(ΔH), and entropy (ΔS) were determined by using the relations below [49].
ΔG = −RTlnk (9)
lnK = −ΔH
RT+
ΔS
R (30)
G H T S = − (11)
The calculated value of ΔG was -15.75 kJ/mole, revealing that the adsorption
of the Cd(II) ion on to AC is feasible and spontaneous [50]. The magnitude of
ΔH was 6.49 kJ mol−1, showing that the sorption mechanism is endothermic [51].
The ΔS as determined from the intercept of the graph of lnk against 1/T was
55.66 J/mol. (Figure 11a) reflecting the sorbate/sorbent complex stability[52]. The
thermodynamic results are summarized in Table 3.
Preprints (www.preprints.org) | NOT PEER-REVIEWED | Posted: 20 September 2021 doi:10.20944/preprints202109.0331.v1
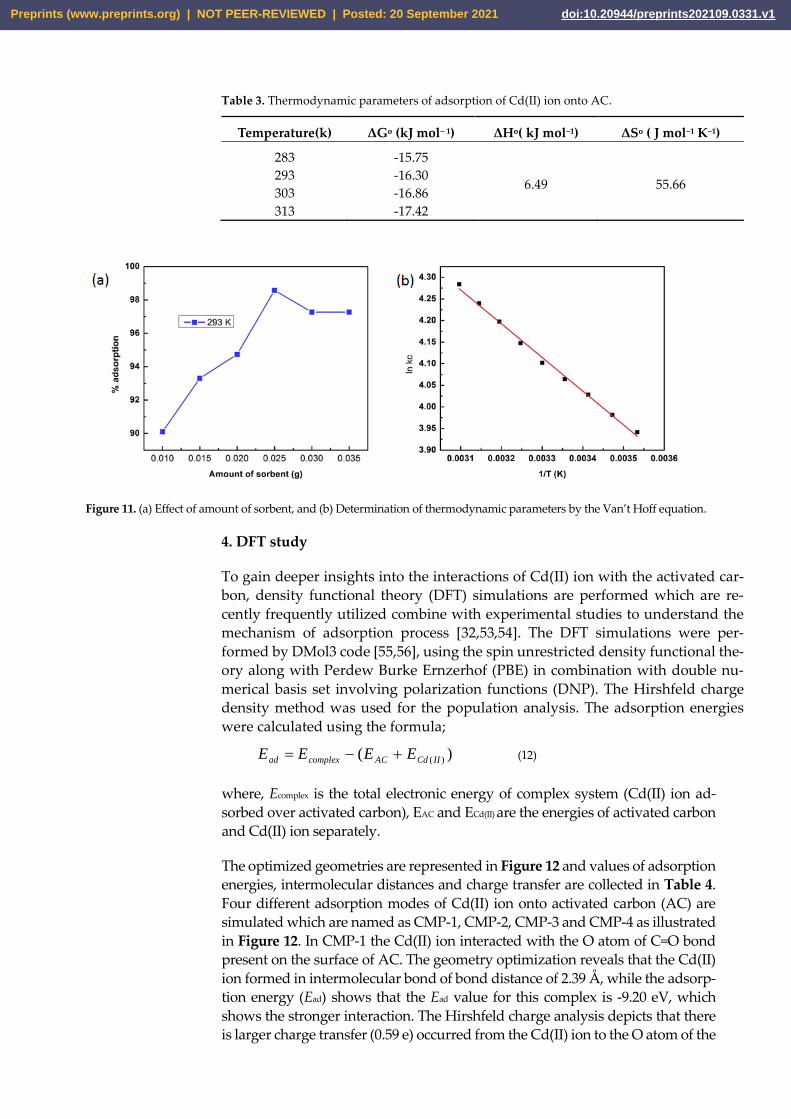
Table 3. Thermodynamic parameters of adsorption of Cd(II) ion onto AC.
Temperature(k) ΔGo (kJ mol− 1) ΔHo( kJ mol−1) ΔSo ( J mol−1 K−1)
283
293
303
313
-15.75
-16.30
-16.86
-17.42
6.49 55.66
Figure 11. (a) Effect of amount of sorbent, and (b) Determination of thermodynamic parameters by the Van’t Hoff equation.
4. DFT study
To gain deeper insights into the interactions of Cd(II) ion with the activated car-
bon, density functional theory (DFT) simulations are performed which are re-
cently frequently utilized combine with experimental studies to understand the
mechanism of adsorption process [32,53,54]. The DFT simulations were per-
formed by DMol3 code [55,56], using the spin unrestricted density functional the-
ory along with Perdew Burke Ernzerhof (PBE) in combination with double nu-
merical basis set involving polarization functions (DNP). The Hirshfeld charge
density method was used for the population analysis. The adsorption energies
were calculated using the formula;
)( )( IICdACcomplexad EEEE +−= (12)
where, Ecomplex is the total electronic energy of complex system (Cd(II) ion ad-
sorbed over activated carbon), EAC and ECd(II) are the energies of activated carbon
and Cd(II) ion separately.
The optimized geometries are represented in Figure 12 and values of adsorption
energies, intermolecular distances and charge transfer are collected in Table 4.
Four different adsorption modes of Cd(II) ion onto activated carbon (AC) are
simulated which are named as CMP-1, CMP-2, CMP-3 and CMP-4 as illustrated
in Figure 12. In CMP-1 the Cd(II) ion interacted with the O atom of C=O bond
present on the surface of AC. The geometry optimization reveals that the Cd(II)
ion formed in intermolecular bond of bond distance of 2.39 Å, while the adsorp-
tion energy (Ead) shows that the Ead value for this complex is -9.20 eV, which
shows the stronger interaction. The Hirshfeld charge analysis depicts that there
is larger charge transfer (0.59 e) occurred from the Cd(II) ion to the O atom of the
Preprints (www.preprints.org) | NOT PEER-REVIEWED | Posted: 20 September 2021 doi:10.20944/preprints202109.0331.v1

surface which resulted stronger intermolecular bond. In CMP-2 the Cd(II) ion
interacted with the O atoms of the NO2 group and O atom of C=O group at the
edge of the AC. The optimization shows that the Cd(II) ion formed intermolec-
ular bonds with one O atom of NO2 group and with O atom of C=O group. The
bond distances noticed for this interaction is 2.25 and 2.41 Å, respectively. The
Ead energy and Hisrhfeld charge transfer value obtained for this complex is -
10.03 eV and 0.70 e. This larger Ead value and higher charger transfer value
demonstrate that the formation of this complex is highly thermodynamically sta-
ble. In CMP-3 the Cd(II) ion interacted with the SO3H group at the edge of AC.
The intermolecular bond distances values calculated for this complex are 2.98
and 2.92 Å, respectively. The Ead and charge transfer values noticed for this com-
plex is -9.54 eV and 0.59 e. While in CMP-4 the Cd(II) ion placed over the top of
hexagonal ring of the AC. The geometry optimization reveals that the Cd(II) ion
form weak intermolecular bonds in this complex having binding distances upto
3.45 Å. Smaller Ead and charge transfer values obtained for this complex which
is -0.45 eV and 0.23 e. In summary, the DFT simulations shows that the AC has
higher affinity for the adsorption of Cd(II) ions due to the presence of higher
negative active sites i.e. N, O and S atom. The Cd formed stronger bonds with
these active sites which resulted stronger adsorption. The larger negative values
depicts that the adsorption process is spontaneous and thermodynamically sta-
ble.
Figure 12. Graphical representation of optimized geometry of AC and Cd(II)@AC complexes. Bond distance are
in Å
Preprints (www.preprints.org) | NOT PEER-REVIEWED | Posted: 20 September 2021 doi:10.20944/preprints202109.0331.v1

Table 4. Computed bond distance (Å), adsorption energy (Ead eV) and Hirshfeld charge transfer (ΔQCT e)
4. Conclusions
The Cd2+ was adsorbed onto activated carbon and the experimental data were adjusted
to the Langmuir isotherm. Temperature and pH of the solutions were shown to
influence significantly the adsorption isotherm. At initial pH of 2 or lower. Cd2+ did
not adsorb to the activated carbon. However at pH greater than 3 Cd2+ began to adsorb
achieving its maximum adsorption capacity at an initial pH of 6.
Based on results obtained it can be (concluded, confirmed, stated) that starch-based
activated carbon can be used as an efficient and economical sorbent for the seques-
tration of Cd(II) from wastewater. The adsorption phenomena were dependent upon
several factors including pH and the optimum pH for maximum sorption was found
to be 6.0. The adsorption results obey Langmuir, Freundlich isotherms well. The ad-
sorption capacity and other parameters have been computed from different isotherm
constants. The pseudo 2nd order adequately describes the kinetic data. The pseudo
2nd order kinetics shows a high kinetics correlation with experimental data. Moreo-
ver, the DFT study shows that the AC has stronger affinity for the adsorption of
Cd(II) ions due to presence of highly active sites. The shorter bond distances in CMP-
1, CMP-2 and CMP-2 evince that the Cd(II) strongly interacted with various active
sites of the AC, which resulted stronger adsorption. Therefore, the Ead values are
highly negative which ranges from -0.45 eV to -10.03 eV, indicates that the adsorp-
tion process is spontaneous and thermodynamically feasible. The larger charge
transfer (0.23 e to 0.70 e) give roots to the presence of stronger intermolecular bond
between the Cd(II) ions and AC.
Author Contributions:
Funding:
Data Availability Statement:
Conflicts of Interest:
Reference
[1] Z. Ali, R. Ahmad, A. Khan, RSC advances 4 (2014) 50056.
[2] S.M. Hasany, R. Ahmad, J. Environ. Manage. 81 (2006) 286.
[3] C. Peña-Guzmán, S. Ulloa-Sánchez, K. Mora, R. Helena-Bustos, E. Lopez-Barrera, J. Alvarez, M. Rodriguez-
Pinzón, J. Environ. Manage. 237 (2019) 408.
[4] C. Teodosiu, A.-F. Gilca, G. Barjoveanu, S. Fiore, Journal of cleaner production 197 (2018) 1210.
[5] X. Wen, P. Wu, K. Xu, J. Wang, X. Hou, Microchem. J. 91 (2009) 193.
[6] J. Godt, F. Scheidig, C. Grosse-Siestrup, V. Esche, P. Brandenburg, A. Reich, D.A. Groneberg, Journal of
occupational medicine and toxicology 1 (2006) 1.
[7] A.C. Davis, P. Wu, X. Zhang, X. Hou, B.T. Jones, Applied Spectroscopy Reviews 41 (2006) 35.
Complex Bond distance Ead ΔQCT
CMP-1 2.39 -9.21 0.59
CMP-2 2.24, 2.41 -10.03 0.70
CMP-3 2.92, 2.98 -9.55 0.59
CMP-4 3.45, 3.41, 3.39 -0.45 0.23
Preprints (www.preprints.org) | NOT PEER-REVIEWED | Posted: 20 September 2021 doi:10.20944/preprints202109.0331.v1
[8] X. Wen, Q. Yang, Z. Yan, Q. Deng, Microchem. J. 97 (2011) 249.
[9] M.P. Waalkes, S. Rehm, C.W. Riggs, R.M. Bare, D.E. Devor, L.A. Poirier, M.L. Wenk, J.R. Henneman, M.S.
Balaschak, Cancer Res. 48 (1988) 4656.
[10] K. Seidal, N. Jörgensen, C.-G. Elinder, B. Sjögren, M. Vahter, Scand. J. Work Environ. Health (1993) 429.
[11] H. Li, P. Gao, J. Cui, F. Zhang, F. Wang, J. Cheng, Environmental Science and Pollution Research 25 (2018)
20743.
[12] S. Gunatilake, Methods 1 (2015) 14.
[13] T.A. Kurniawan, G.Y. Chan, W.-H. Lo, S. Babel, Chem. Eng. J. 118 (2006) 83.
[14] A.B. Fuertes, P. Valle-Vigón, M. Sevilla, Chem. Commun. 48 (2012) 6124.
[15] K.-H. Lo, C.-W. Lu, W.-H. Lin, C.-C. Chien, S.-C. Chen, C.-M. Kao, Chemosphere 238 (2020) 124596.
[16] K.-T. Chung, Mutation Research/Reviews in Genetic Toxicology 114 (1983) 269.
[17] M.K. Uddin, Chem. Eng. J. 308 (2017) 438.
[18] A. Ayangbenro, O. Babalola, Int. J. Env. Res. Public Health 14 (2017) 94.
[19] A.A. Khan, M.D. Esrafili, A. Ahmad, E. Hull, R. Ahmad, S.U. Jan, I. Ahmad, J. Mol. Model. 25 (2019) 189.
[20] N. Allen, C. Dai, Y. Hu, J.D. Kubicki, N. Kabengi, ACS Earth and Space Chemistry 3 (2019) 432.
[21] N. Acelas, E. Flórez, Density functional theory studies of the adsorption of Cr (VI) on Fe-(hydr) oxide: Gibbs
free energies and pH effect, Journal of Physics: Conference Series. IOP Publishing, 2019, p. 012051.
[22] R.T. Yang, Adsorbents: fundamentals and applications, John Wiley & Sons, 2003.
[23] J. Tayone, International Journal of Sciences: Basic and Applied Researchm 19 (2015) 426.
[24] M.T. Shirazani, H. Bakhshi, A. Rashidi, M. Taghizadeh, Journal of Environmental Chemical Engineering 8
(2020) 103910.
[25] K. Yang, T. Pan, Q. Zhao, C. Chen, X. Zhu, P. Wang, B. Chen, Carbon 168 (2020) 254.
[26] A. Tyagi, S. Banerjee, S. Singh, K.K. Kar, International Journal of Hydrogen Energy 45 (2020) 16930.
[27] G. Singh, S. Dwivedi, Environmental Technology & Innovation (2020) 100751.
[28] S.A. Karim, H.Y. Al-Gubury, N.A. Alrazzak, The Synthesis of a Novel Azo Dyes and Study of Photocatalytic
Degradation, Journal of Physics: Conference Series. IOP Publishing, 2019, p. 052054.
[29] M. Banerjee, R.K. Basu, S.K. Das, Environmental Science and Pollution Research 26 (2019) 11542.
[30] B. Maleki, O. Reiser, E. Esmaeilnezhad, H.J. Choi, Polyhedron 162 (2019) 129.
[31] F. Li, A. Ahmad, L. Xie, G. Sun, Q. Kong, F. Su, Y. Ma, Y. Chao, X. Guo, X. Wei, Electrochim. Acta 318 (2019)
151.
[32] S.U. Jan, A. Ahmad, A.A. Khan, S. Melhi, I. Ahmad, G. Sun, C.-M. Chen, R. Ahmad, Environmental Science and
Pollution Research 28 (2021) 10234.
[33] M. Rafatullah, S. Ismail, A. Ahmad, Water 11 (2019) 1304.
[34] M. Naushad, A.A. Alqadami, Z.A. AlOthman, I.H. Alsohaimi, M.S. Algamdi, A.M. Aldawsari, Journal of
Molecular Liquids 293 (2019) 111442.
[35] S. Cheng, L. Zhang, A. Ma, H. Xia, J. Peng, C. Li, J. Shu, Journal of Environmental Sciences 65 (2018) 92.
[36] S. Khandaker, Y. Toyohara, G.C. Saha, M.R. Awual, T. Kuba, Journal of Water Process Engineering 33 (2020)
101055.
[37] G. Sharma, M. Naushad, J. Mol. Liq. (2020) 113025.
[38] B.E. Reed, M.R. Matsumoto, Sep. Sci. Technol. 28 (1993) 2179.
[39] T.S. Kazeem, M. Zubair, M. Daud, N.D. Mu’azu, M.A. Al-Harthi, Korean J. Chem. Eng. 36 (2019) 1057.
[40] D.-W. Kim, J.-H. Wee, C.-M. Yang, K.S. Yang, Chemical Engineering Journal 392 (2020) 123768.
[41] M.B. Desta, Journal of thermodynamics 2013 (2013).
[42] J. Zhang, J. Shao, Q. Jin, Z. Li, X. Zhang, Y. Chen, S. Zhang, H. Chen, Fuel 252 (2019) 101.
Preprints (www.preprints.org) | NOT PEER-REVIEWED | Posted: 20 September 2021 doi:10.20944/preprints202109.0331.v1

[43] F. Fajarwati, M. Anugrahwati, I. Yanti, R. Safitri, E. Yuanita, Adsorption Study of Methylene Blue and
Eriochrome Black T Dyes on Activated Carbon and Magnetic Carbon Composite, IOP Conference Series:
Materials Science and Engineering. IOP Publishing, 2019, p. 012025.
[44] A.M. Alkherraz, A.K. Ali, K.M. Elsherif, Chemistry International 6 (2020) 11.
[45] H. Yuh-Shan, Scientometrics 59 (2004) 171.
[46] Y.-S. Ho, G. McKay, Water research 34 (2000) 735.
[47] S.M. de Oliveira Brito, J.L.C. Cordeiro, L. da Cunha Ramalho, J.F.R. Oliveira, SN Applied Sciences 1 (2019)
1226.
[48] R. Ahmad, M.M. Saeed, A. Ali, J.H. Zaidi, Radiochimica Acta 95 (2007) 451.
[49] Z. Ali, R. Ahmad, A. Khan, B. Adalat, Materials Research Express 5 (2018) 075007.
[50] Y. Chang, J.-Y. Lai, D.-J. Lee, Bioresour. Technol. 222 (2016) 513.
[51] H. Kim, H.J. Cho, S. Narayanan, S. Yang, H. Furukawa, S. Schiffres, X. Li, Y.-B. Zhang, J. Jiang, O.M. Yaghi,
Scientific reports 6 (2016) 19097.
[52] M. Peydayesh, S. Bolisetty, T. Mohammadi, R. Mezzenga, Langmuir 35 (2019) 4161.
[53] Z.A. Ghazi, A.M. Khattak, R. Iqbal, R. Ahmad, A.A. Khan, M. Usman, F. Nawaz, W. Ali, Z. Felegari, S.U. Jan,
New J. Chem. 42 (2018) 10234.
[54] M. Hussain, N. Khaliq, A. Nisar, M. Khan, S. Karim, A.A. Khan, X. Yi, M. Maqbool, G. Ali, Nanotechnology 31
(2020) 505501.
[55] B. Delley, The Journal of chemical physics 92 (1990) 508.
[56] B. Delley, The Journal of chemical physics 113 (2000) 7756.
Preprints (www.preprints.org) | NOT PEER-REVIEWED | Posted: 20 September 2021 doi:10.20944/preprints202109.0331.v1