adsorption kinetics and breakthrough of carbon dioxide for
TRANSCRIPT
sustainability
Article
Adsorption Kinetics and Breakthrough of CarbonDioxide for the Chemical Modified Activated CarbonFilter Used in the Building
Angus Shiue 1,*,†, Shih-Cheng Hu 1,†, Shu-Mei Chang 2, Tzu-Yu Ko 2, Arson Hsieh 3 andAndrew Chan 3
1 Department of Energy and Refrigerating Air-Conditioning Engineering,National Taipei University of Technology, Taipei 10608, Taiwan; [email protected]
2 Department of Molecular Science and Technology, National Taipei University of Technology,Taipei 10608, Taiwan; [email protected] (S.-M.C.); [email protected] (T.-Y.K.)
3 Airrex Co., Ltd., New Taipei City 23148, Taiwan; [email protected] (A.H.);[email protected] (A.C.)
* Correspondence: [email protected]; Tel.: +886-2-27712171 (ext. 3512)† These authors contributed equally to this work.
Received: 6 August 2017; Accepted: 25 August 2017; Published: 29 August 2017
Abstract: We studied different face velocity and carbon dioxide (CO2) initial concentration to examinethe adsorption behavior of calcium oxide (CaO) impregnated activated carbon (AC) filter and also todiscuss pseudo-first-order, pseudo-second-order and intra-particle diffusion three kinetic models.The experimental results show that saturation time and saturation capacity were decreased andincreased with higher inlet concentration at the same face velocity, respectively. Simulation resultsshow that pseudo-second-order correlation coefficient (r2
2 = 0.921) is higher than pseudo-first-order(r1
2 = 0.7815) and intra-particle diffusion (ri2 = 0.905). Therefore, the adsorption process of CO2 onto
CaO impregnated AC filter media is appropriate for the pseudo-second-order kinetic model.
Keywords: activated carbon; adsorption dynamic model; carbon dioxide; air cleaner
1. Introduction
Generally, people spend more than 90% of their time in indoor environments and therefore,there is concern regarding indoor pollutants [1]. Nowadays, buildings are being constructed withsignificantly stricter leak tightness requirements, as demanded by Building Regulations. There isincreasing concern regarding emissions of CO2 and the impact on health and well-being [2–4] andcomfort [5,6] of occupants in air-tight housing. CO2 is the representative pollutant of indoor air qualityand its concentration is associated with human activity of about 650–700 ppm [7,8]. High concentrationsof CO2 are known to have various adverse effects such as headaches, drowsiness, and dizziness forresidents [9–11]. Ventilation is one of the easiest ways to reduce CO2 concentration, and the modernpractice of completely insulating buildings to retain or send back heat also brings on reductions ofIAQ (Indoor Air Quality).
Current and updated research on how to remove CO2 effectively and economically from indoorair has become necessary. A few usual ways are being utilized to clean polluted air, includingcompromising adsorption, absorption, membrane, and cryogenic gas cleaning manners [12–14].Adsorption has been shown to be a technique for conducting low concentrations of CO2 [15–17]because of its simplification, low energy demands, and cost effectiveness [18]. Impregnated activatedcarbon as media for the sorption-type filter adsorption is another functional method for removal of CO2
in a building [19]. Song et al. [16] investigated CaO modified silica adsorbents to have basic locations
Sustainability 2017, 9, 1533; doi:10.3390/su9091533 www.mdpi.com/journal/sustainability
Sustainability 2017, 9, 1533 2 of 13
on their surfaces, and thus, have created a raised affinity for CO2 molecules. Jensen et al. [20] carriedout a comparable quantum chemical study of CO2 adsorption on MgO and CaO, CO2 adsorptiononto CaO as single dentate geometry on both sides and angle sites. Lahuri et al. [21] evaluatedCaO impregnated on iron (III) oxide bimetal adsorbent system as a possible source of base sites forCO2 capture.
This study aims to examine the performance of CaO impregnated coconut shell ACadsorbent-loaded nonwoven fabric filter by adsorption characteristics, as well as the breakthroughcurves and pressure drops under various testing conditions. Adsorption capacity and thesecharacteristics were decided as the functional of CO2 concentration and face velocities. We alsoexamined adsorption kinetics, utilizing the pseudo-first-order, pseudo-second-order and intraparticlemodels and their kinetic constants, thus providing the basic data demanded for design and operationof equipment for air handling units of the building.
2. Experimental Method
Chemically modified activated carbon adsorbents were prepared by impregnation. Impregnationof CaO was performed as follows. Calcium acetate monohydrate (10 g) was mixed with 200 mL ofdeionized water by agitation for 5 h. Through vacuum and filtration processes remove undissolved saltto obtain saturated solution. One (1) g of support material was impregnated with this solutionby agitation at 25 ◦C for 12 h, followed by suction filtration and drying at 80 ◦C for 12 h andthen used vacuum drying at 120 ◦C for ~10 h. The impregnated support materials were finallycalcined at 700 ◦C for 2 h by blowing rate of 1 L/min nitrogen. Table 1 summarizes the impregnationprocedures employed.
Table 1. Procedures for preparation of impregnants.
Reagent and Amount Solution (wt %) DI Water (mL) AC (g)
10 g Ca(CH3CO2)2·H2O 4.80% 200 10
Calcium acetate monohydrate was converted into calcium oxide through the following pathwaysduring calcination.
Ca(CH3CO2)2·H2O→ Ca(CH3CO2)2 → CaCO3 → CaO
Surface area, pore size distribution, and pore width of the completed sample sorbents wereanalyzed with an ASAP2020 (Micromeritics Instrument Corporation, GA, USA).
Figure 1 showed the schematic diagram of the experimental system. The CaO impregnatedgranular activated carbon (GAC)-loaded on nonwoven fabric filter media (supplied byAIRREX Co. Ltd., New Taipei City, Taiwan) was set in a designed 15 cm × 15 cm filter area.Two differential pressure gauges were utilized to monitor pressure drop before and after the filter.The testing rig was kept at 24 ± 1 ◦C temperature by air-conditioning environment control systemin a cleanroom. The main testing airflow is from here which controlled at 22 ± 1 ◦C temperatureand 40 ± 2% relative humidity. The face velocity of filter was measured and controlled from 0.3 m/sto 0.5 m/s (related with 0.7 to 1.0 m/s face velocity of a full-scale chemical filter actually operated)(the TSI 9535-A anemometer is ±3% of full-scale accuracy) with the invertor which connected to thethree-phase air blower and flow damper. The compressed dry air with −40 ◦C dew point temperaturepassing through the impinger which produces the airflow with saturated contaminant (i.e., CO2)then becomes the challenge gas entering the upstream air duct. The impinger, filled with 99.9%grade CO2, is submerged in the brine water bath with adjustable water temperature from −15 ◦C to25 ◦C. The upstream concentration in the testing rig is controlled by the flow rate passing thought theimpinger, which is adjusted via a mass flow controller (LINTEC MC-700). The upstream concentrationswere fixed at 800, 1000, and 1200 ppm with ±5% deviation. TES 1370 NDIR CO2 Meter.

Sustainability 2017, 9, 1533 3 of 13Sustainability 2017, 9, 1533 3 of 13
MFCCDA
Constant temperature water vessel
Gas monitor
Cleanroom air
Atmospher
Pre-filter
Acid chemical filter
Base chemical filter
Activated carbon filter
HEPA
Contaminant release point
Upstream concentration test point
Downstream concentration test pointTesting filter
Activated carbon filter
Gas scrubbing flask
Centrifugal filter
Figure 1. Schematic diagram of the test system [22].
The testing method followed ASHRAE Standard 145.2 [23] and is similar to the researcher works [24,25]. As shown in Figure 2, conditioned air pass through the adsorbent. The upstream concentrations and downstream concentrations are simultaneously measured to decide removal efficiency (η) [26]. Breakthrough time (tb) is defined as the time when the outlet concentration was 2% of the inlet concentration. Equilibrium time (tt) is defined as the time when the outlet concentration was 98% of the inlet concentration.
Figure 2. Schematic of the test principle [25].
Figure 1. Schematic diagram of the test system [22].
The testing method followed ASHRAE Standard 145.2 [23] and is similar to the researcherworks [24,25]. As shown in Figure 2, conditioned air pass through the adsorbent. The upstreamconcentrations and downstream concentrations are simultaneously measured to decide removalefficiency (η) [26]. Breakthrough time (tb) is defined as the time when the outlet concentration was 2%of the inlet concentration. Equilibrium time (tt) is defined as the time when the outlet concentrationwas 98% of the inlet concentration.
Sustainability 2017, 9, 1533 3 of 13
MFCCDA
Constant temperature water vessel
Gas monitor
Cleanroom air
Atmospher
Pre-filter
Acid chemical filter
Base chemical filter
Activated carbon filter
HEPA
Contaminant release point
Upstream concentration test point
Downstream concentration test pointTesting filter
Activated carbon filter
Gas scrubbing flask
Centrifugal filter
Figure 1. Schematic diagram of the test system [22].
The testing method followed ASHRAE Standard 145.2 [23] and is similar to the researcher works [24,25]. As shown in Figure 2, conditioned air pass through the adsorbent. The upstream concentrations and downstream concentrations are simultaneously measured to decide removal efficiency (η) [26]. Breakthrough time (tb) is defined as the time when the outlet concentration was 2% of the inlet concentration. Equilibrium time (tt) is defined as the time when the outlet concentration was 98% of the inlet concentration.
Figure 2. Schematic of the test principle [25]. Figure 2. Schematic of the test principle [25].

Sustainability 2017, 9, 1533 4 of 13
The removal efficiency (η) of CO2 decided and simultaneously monitored the upstreamconcentrations and downstream concentrations of test rig [26]:
Q = C0V∫
η(t)dt× 10.082
× 1(273 + k)
×M× 10−6 (1)
where Q is adsorption capacity; C0 is the inlet concentration; V is the airflow rate; t is testing time; η isremoval efficiency (%); and M is testing gas molecular weight.
3. Results and Discussion
3.1. Adsorption Capacity
Figure 3 presents CO2 various adsorption capacity with various inlet concentrations and variousface velocities. As shown in Figure 3, if the inlet concentration of the adsorbate is increased, resultingin increased diffusion velocity into the pores of the CaO impregnated AC filter, equilibrium adsorptionmay reach faster; the equilibrium time decreased from 237 to 86 min, 175 to 57 min and 168 to 49 minat 0.1, 0.2 and 0.3 m/s face velocities, respectively.
Sustainability 2017, 9, 1533 4 of 13
The removal efficiency (η) of CO2 decided and simultaneously monitored the upstream concentrations and downstream concentrations of test rig [26]:
60 10
)273(1
082.01)( −××
+××= M
kdttVCQ η (1)
where Q is adsorption capacity; C0 is the inlet concentration; V is the airflow rate; t is testing time; η is removal efficiency (%); and M is testing gas molecular weight.
3. Results and Discussion
3.1. Adsorption Capacity
Figure 3 presents CO2 various adsorption capacity with various inlet concentrations and various face velocities. As shown in Figure 3, if the inlet concentration of the adsorbate is increased, resulting in increased diffusion velocity into the pores of the CaO impregnated AC filter, equilibrium adsorption may reach faster; the equilibrium time decreased from 237 to 86 min, 175 to 57 min and 168 to 49 min at 0.1, 0.2 and 0.3 m/s face velocities, respectively.
(c)
Figure 3. Effect of concentration on CO2 adsorption capacity (a) 0.1 m/s; (b) 0.2 m/s; (c) 0.3 m/s. Figure 3. Effect of concentration on CO2 adsorption capacity (a) 0.1 m/s; (b) 0.2 m/s; (c) 0.3 m/s.
Sustainability 2017, 9, 1533 5 of 13
3.2. Breakthrough
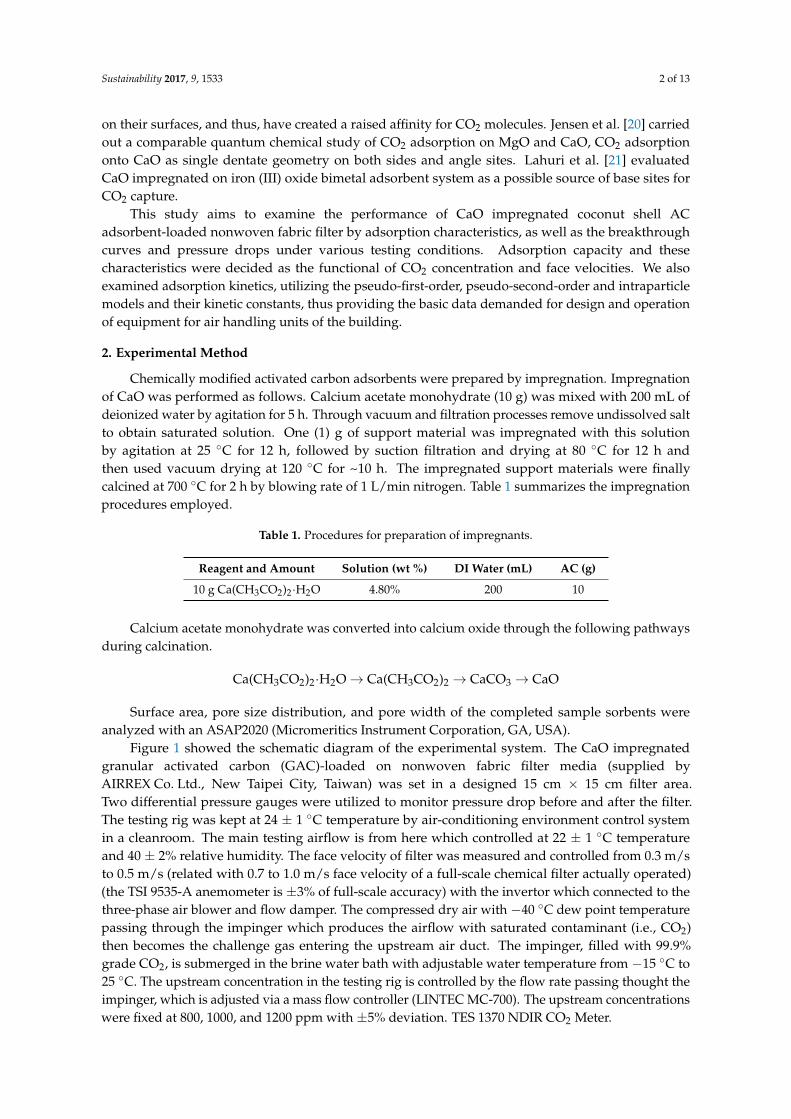
Its determination was performed by various inlet concentration of CO2 from 800 to 1200 ppmv atthe face velocity of 0.1 to 0.3 m/s (Figure 4). As shown in Figure 4, increased the inlet concentrationof the adsorbate, the breakthrough time was reduced. Furthermore, the face velocity was increased,and the breakthrough time also became shorter.
Sustainability 2017, 9, 1533 5 of 13
3.2. Breakthrough
Its determination was performed by various inlet concentration of CO2 from 800 to 1200 ppmv at the face velocity of 0.1 to 0.3 m/s (Figure 4). As shown in Figure 4, increased the inlet concentration of the adsorbate, the breakthrough time was reduced. Furthermore, the face velocity was increased, and the breakthrough time also became shorter.
(a) (b)
(c)
Figure 4. Effect of inlet concentration of CO2 on the breakthrough (a) 0.1 m/s, (b) 0.3 m/s, (c) 0.5 m/s.
Nelson and Harder [27] developed the relationship between two different initial concentrations of denoted VOC (Volatile Organic Compound) in terms of the breakthrough time:
α)(2,0
1,0
2,
1,
CC
tt
b
b = (2)
where α is the average value of slopes of breakthrough time versus different initial CO2 concentration curve plotted on logarithmic scales. We used it to predict the performance of CaO impregnated AC filter under indoor conditions. The relationship curves of different face velocities are shown in Figure 5 and Table 2. From the data of Figure 5 and Table 2, we can conclude that once the slope of one breakthrough time–concentration relationship is known, the slope of the other breakthrough
Figure 4. Effect of inlet concentration of CO2 on the breakthrough (a) 0.1 m/s, (b) 0.3 m/s, (c) 0.5 m/s.
Nelson and Harder [27] developed the relationship between two different initial concentrationsof denoted VOC (Volatile Organic Compound) in terms of the breakthrough time:
tb,1
tb,2= (
C0,1
C0,2)
α
(2)
where α is the average value of slopes of breakthrough time versus different initial CO2 concentrationcurve plotted on logarithmic scales. We used it to predict the performance of CaO impregnated AC filter

Sustainability 2017, 9, 1533 6 of 13
under indoor conditions. The relationship curves of different face velocities are shown in Figure 5 andTable 2. From the data of Figure 5 and Table 2, we can conclude that once the slope of one breakthroughtime–concentration relationship is known, the slope of the other breakthrough percentages can beapproximated. If the breakthrough time at one concentration is known, breakthrough time at otherconcentrations can be calculated accordingly. Nevertheless, best results are obtained if each individualslope for a given set of conditions is determined experimentally.
Sustainability 2017, 9, 1533 6 of 13
percentages can be approximated. If the breakthrough time at one concentration is known, breakthrough time at other concentrations can be calculated accordingly. Nevertheless, best results are obtained if each individual slope for a given set of conditions is determined experimentally.
Figure 5. Effect of initial concentrations on the breakthrough time.
Table 2. Effect of initial concentrations on the breakthrough time.
Face Velocity (m/s) Breakthrough Time vs. Initial Concentration
0.1 0.40090 15,060.037bt C = , R2 = 0.9982
0.2 0.36020 29,584.327bt C = , R2 = 0.9963
0.3 0.33090 60,596.96bt C = , R2 = 0.9909
3.3. Adsorption Kinetics
The kinetics of CO2 adsorption onto CaO impregnated AC filter was investigated by using pseudo-first-order and pseudo-second-order models.
0.33090 60596.96bt C =
3.3.1. Pseudo-First-Order Model
The pseudo-first-order equation is given as [28]:
tkqqq ete 303.2log)log( 1−=− (3)
Figure 6 presents log(qe − qt) against t of the pseudo-first order equation plots at the adsorption of CO2. The sorption capacity, qe,1, the first-order rate parameters, k1, and correlation coefficients, r12 are showed in Table 3. The qe experimental values are also contained in Table 3 for comparison with those predicted. The equilibrium adsorption capacity of the experiment increased from 2.77 to 4.54, 2.28 to 3.21 and 2.1 to 2.77 mg g−1 at face velocity 0.1, 0.2, and 0.3 m/s, respectively during CO2 initial concentration increased from 800 to 1200 ppm, pointing out that CO2 removal is relying on initial concentration. The adsorption capacity of the equilibrium increased from 2.73 to 4.51, 2.24 to 3.16 and 2.1 to 2.75 mg g−1 at the initial concentration of CO2 800, 1000 and 1200 ppm, respectively when face
Figure 5. Effect of initial concentrations on the breakthrough time.
Table 2. Effect of initial concentrations on the breakthrough time.
Face Velocity (m/s) Breakthrough Time vs. Initial Concentration
0.1 tbC0.40090 = 15, 060.037, R2 = 0.9982
0.2 tbC0.36020 = 29, 584.327, R2 = 0.9963
0.3 tbC0.33090 = 60, 596.96, R2 = 0.9909
3.3. Adsorption Kinetics
The kinetics of CO2 adsorption onto CaO impregnated AC filter was investigated by usingpseudo-first-order and pseudo-second-order models.
3.3.1. Pseudo-First-Order Model
The pseudo-first-order equation is given as [28]:
log(qe − qt) = log qe −k1
2.303t (3)
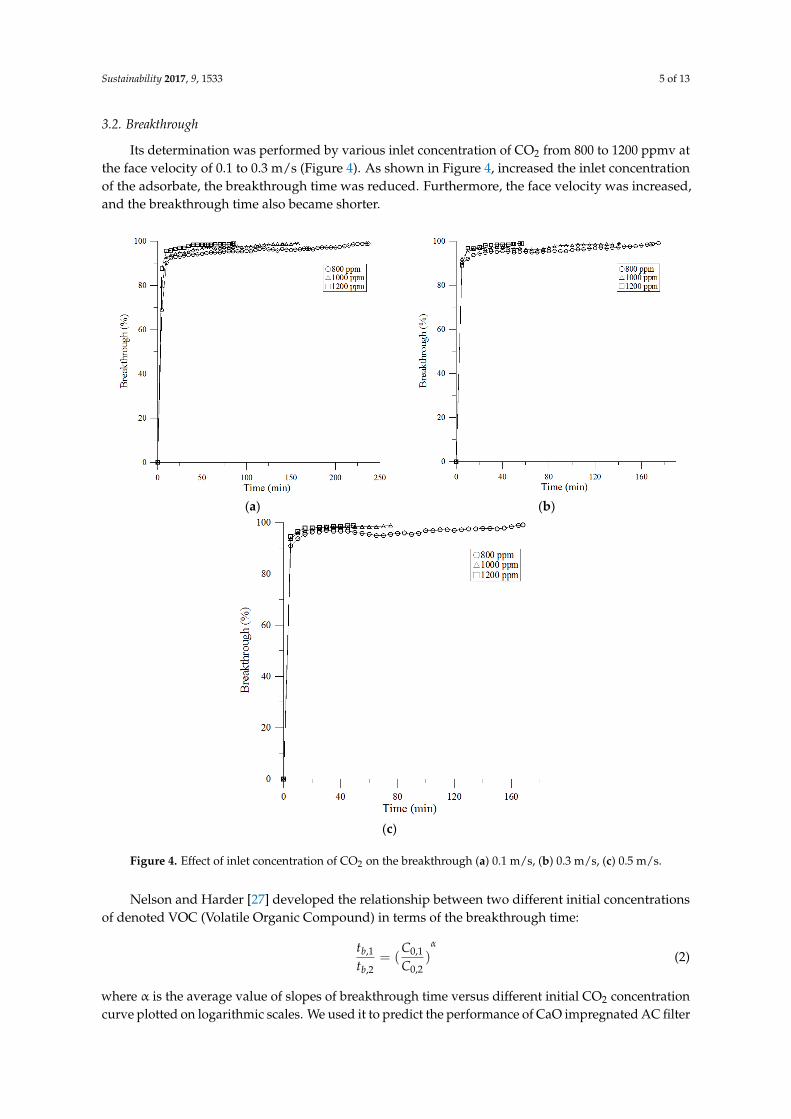
Figure 6 presents log(qe − qt) against t of the pseudo-first order equation plots at the adsorption ofCO2. The sorption capacity, qe,1, the first-order rate parameters, k1, and correlation coefficients, r1
2 areshowed in Table 3. The qe experimental values are also contained in Table 3 for comparison with thosepredicted. The equilibrium adsorption capacity of the experiment increased from 2.77 to 4.54, 2.28to 3.21 and 2.1 to 2.77 mg g−1 at face velocity 0.1, 0.2, and 0.3 m/s, respectively during CO2 initialconcentration increased from 800 to 1200 ppm, pointing out that CO2 removal is relying on initial
Sustainability 2017, 9, 1533 7 of 13
concentration. The adsorption capacity of the equilibrium increased from 2.73 to 4.51, 2.24 to 3.16and 2.1 to 2.75 mg g−1 at the initial concentration of CO2 800, 1000 and 1200 ppm, respectively whenface velocity increased from 0.1 to 0.3 m/s, showing that the CO2 removal is based on face velocitytoo. Also, qe calculated values conform well with the experimental data. After all, k1 rate constantvalues were discovered to increase from 0.0082 to 0.0217, 0.011 to 0.0324 and 0.0108 to 0.0337 min−1 atface velocity 0.1, 0.2 and 0.3 m/s, respectively for an increase in the initial concentration from 800 to1200 ppm. Since the adsorption kinetics follow pseudo-first-order, the rate constant k1 values shouldincrease linearly with increasing initial concentration [29,30].
Sustainability 2017, 9, 1533 7 of 13
velocity increased from 0.1 to 0.3 m/s, showing that the CO2 removal is based on face velocity too. Also, qe calculated values conform well with the experimental data. After all, k1 rate constant values were discovered to increase from 0.0082 to 0.0217, 0.011 to 0.0324 and 0.0108 to 0.0337 min−1 at face velocity 0.1, 0.2 and 0.3 m/s, respectively for an increase in the initial concentration from 800 to 1200 ppm. Since the adsorption kinetics follow pseudo-first-order, the rate constant k1 values should increase linearly with increasing initial concentration [29,30].
(a) (b)
(c)
Figure 6. Pseudo-first order kinetics plot for adsorption of CO2 on CaO impregnated activated carbon (AC) filter (a) 0.1 m/s; (b) 0.2 m/s; (c) 0.3 m/s. Figure 6. Pseudo-first order kinetics plot for adsorption of CO2 on CaO impregnated activated carbon(AC) filter (a) 0.1 m/s; (b) 0.2 m/s; (c) 0.3 m/s.

Sustainability 2017, 9, 1533 8 of 13
Table 3. Comparison of the pseudo-first- and second-order adsorption, and intraparticle diffusion rate constants.
Face Velocity Inlet ConcentrationPseudo-First Order Pseudo-Second Order Intra-Particle Diffusion
qe (exp, g) k1 (min−1) qe,1 (g) r12 k2 (g−1 min−1) qe,2 (g) r2
2 ki (g min−1/2) C ri2
0.1 m/s800 ppm 2.77 0.0082 2.73 0.7815 0.149 4.2 0.9519 0.3076 −0.4487 0.9935
1000 ppm 3.66 0.0119 3.64 0.866 0.2783 2.51 0.9844 0.2153 −0.0979 0.99581200 ppm 4.54 0.0217 4.51 0.7843 0.5714 1.24 0.9888 0.1397 −0.0266 0.9472
0.2 m/s800 ppm 2.28 0.011 2.24 0.8213 0.0777 5.65 0.9504 0.5096 −1.0158 0.9811
1000 ppm 3.01 0.0132 2.99 0.7827 0.1214 3.77 0.921 0.3727 −0.6231 0.97711200 ppm 3.21 0.0324 3.16 0.8884 0.4141 1.58 0.9806 0.2182 −0.0286 0.9975
0.3 m/s800 ppm 2.10 0.0108 2.10 0.7874 0.0496 6.96 0.9565 0.6473 −1.4821 0.9671
1000 ppm 2.42 0.0214 2.41 0.8874 0.253 2.36 0.9857 0.7353 −0.5122 0.9051200 ppm 2.77 0.0337 2.75 0.9074 0.33 1.73 0.9847 0.2657 −0.1127 0.9888

Sustainability 2017, 9, 1533 9 of 13
3.3.2. Pseudo-Second-Order Model
The pseudo-second-order model is showed as: [31]
tqt
=1
k2q2e+
1qe
t (4)
Figure 7 presents plots of t/qt versus t of the pseudo-second order equation of CO2 adsorption.The pseudo-second order rate parameters k2 and the correlation coefficients r2
2 are presented thencompared with r1
2, ri2, k1, and ki values for the pseudo-first order reaction mechanism and intraparticle
model (Table 3). The adsorption capacity qe,2 of the equilibrium increased from 0.309 to 0.498, 0.329 to0.785, and 0.715 to 0.721 mg g−1 at face velocity 0.1, 0.2, and 0.3 m/s, respectively. When CO2 initialconcentration increased from 800 to 1200 ppm, showed the initial concentration effect on CO2 removal.The equilibrium adsorption capacity qe,2 decreased from 4.2 to 1.24, 5.65 to 1.58, and 6.96 to 1.73 mg g−1
at CO2 initial concentration 800, 1000 and 1200 ppm, respectively when face velocity increased from0.1 to 0.3 m/s, pointing out that the CO2 removal is relying on face velocity too. k2 rate constant valueswere discovered to increase from 0.149 to 0.5714, 0.0777 to 0.4141 and 0.0496 to 0.33 g mg−1 min−1
for an increase from the initial concentration 800 to 1200 ppm at face velocity 0.1, 0.2 and 0.3 m/s,respectively. Also, qe calculated values conform well with the experimental data. The rate coefficientk2 of the pseudo-second-order rate model is figured versus CO2 initial concentration and is shown,the relation is not a simple function between k2 and C0 [29,30].
Sustainability 2017, 9, 1533 9 of 13
3.3.2. Pseudo-Second-Order Model
The pseudo-second-order model is showed as: [31]
22
1 1
t e e
t tq k q q
= + (4)
Figure 7 presents plots of t/qt versus t of the pseudo-second order equation of CO2 adsorption. The pseudo-second order rate parameters k2 and the correlation coefficients r22 are presented then compared with r12, ri2, k1, and ki values for the pseudo-first order reaction mechanism and intraparticle model (Table 3). The adsorption capacity qe,2 of the equilibrium increased from 0.309 to 0.498, 0.329 to 0.785, and 0.715 to 0.721 mg g−1 at face velocity 0.1, 0.2, and 0.3 m/s, respectively. When CO2 initial concentration increased from 800 to 1200 ppm, showed the initial concentration effect on CO2 removal. The equilibrium adsorption capacity qe,2 decreased from 4.2 to 1.24, 5.65 to 1.58, and 6.96 to 1.73 mg g−1 at CO2 initial concentration 800, 1000 and 1200 ppm, respectively when face velocity increased from 0.1 to 0.3 m/s, pointing out that the CO2 removal is relying on face velocity too. k2 rate constant values were discovered to increase from 0.149 to 0.5714, 0.0777 to 0.4141 and 0.0496 to 0.33 g mg−1 min−1 for an increase from the initial concentration 800 to 1200 ppm at face velocity 0.1, 0.2 and 0.3 m/s, respectively. Also, qe calculated values conform well with the experimental data. The rate coefficient k2 of the pseudo-second-order rate model is figured versus CO2 initial concentration and is shown, the relation is not a simple function between k2 and C0 [29,30].
(a) (b)
(c)
Figure 7. Pseudo-second order kinetic plot of CO2 adsorption onto CaO impregnated AC filter (a) 0.1 m/s; (b) 0.2 m/s; (c) 0.3 m/s.
Figure 7. Pseudo-second order kinetic plot of CO2 adsorption onto CaO impregnated AC filter(a) 0.1 m/s; (b) 0.2 m/s; (c) 0.3 m/s.

Sustainability 2017, 9, 1533 10 of 13
3.3.3. Intraparticle Diffusion Model
It was also shown that the intraparticle diffusion model [32,33] rate processes are generallypresented in respect to square root of time. The following equation decided ki rate parameters ofintraparticle diffusion at various initial concentrations.
qt = kit1/2 (5)
As presented the intraparticle diffusion model at a face velocity of 0.1 m/s in Figure 8a, the externalsurface adsorption (Stage 1) is out. Before 16 min, Stage 1 is finished and then intraparticle diffusioncontrol of Stage 2 is obtained and it goes on from 25 min to 196, 144 and 64 min at 800, 1000 and1200 ppm inlet concentration, respectively. Lastly, Stage 3 equilibrium adsorption begins after 225,169 and 100 min at the inlet concentration of 800, 1000 and 1200 ppm, respectively [34]. The CO2 isslowly transferred with intraparticle diffusion into the particles and lastly stays in the micropores.Generally, intraparticle diffusion rate constant ki is the slope of the line in Stage 2. Table 3 also listedthe rate parameter ki and its correlation coefficients. There was some control of boundary layer as itcan be seen from the value of C.
Sustainability 2017, 9, 1533 10 of 13
3.3.3. Intraparticle Diffusion Model
It was also shown that the intraparticle diffusion model [32,33] rate processes are generally presented in respect to square root of time. The following equation decided ki rate parameters of intraparticle diffusion at various initial concentrations.
1/2t iq k t= (5)
As presented the intraparticle diffusion model at a face velocity of 0.1 m/s in Figure 8a, the external surface adsorption (Stage 1) is out. Before 16 min, Stage 1 is finished and then intraparticle diffusion control of Stage 2 is obtained and it goes on from 25 min to 196, 144 and 64 min at 800, 1000 and 1200 ppm inlet concentration, respectively. Lastly, Stage 3 equilibrium adsorption begins after 225, 169 and 100 min at the inlet concentration of 800, 1000 and 1200 ppm, respectively [34]. The CO2 is slowly transferred with intraparticle diffusion into the particles and lastly stays in the micropores. Generally, intraparticle diffusion rate constant ki is the slope of the line in Stage 2. Table 3 also listed the rate parameter ki and its correlation coefficients. There was some control of boundary layer as it can be seen from the value of C.
(a) (b)
(c)
Figure 8. Intra-particle mass transfer curve of CO2 adsorption on CaO impregnated AC filter (a) 0.1 m/s; (b) 0.2 m/s; (c) 0.3 m/s.
4. Conclusions
The CaO impregnated AC filter system is suitable for reducing the CO2 indoor air concentration in buildings with air condition system. In CO2 single vapor adsorption measurements, the adsorption time decreased with inlet concentration of CO2 and face velocity increased. The adsorption capacity
Figure 8. Intra-particle mass transfer curve of CO2 adsorption on CaO impregnated AC filter(a) 0.1 m/s; (b) 0.2 m/s; (c) 0.3 m/s.

Sustainability 2017, 9, 1533 11 of 13
4. Conclusions
The CaO impregnated AC filter system is suitable for reducing the CO2 indoor air concentrationin buildings with air condition system. In CO2 single vapor adsorption measurements, the adsorptiontime decreased with inlet concentration of CO2 and face velocity increased. The adsorption capacityincreased with increased initial concentration and decreased face velocity, too. To increase the inletconcentration of the adsorbate, the breakthrough time was reduced. Furthermore the face velocitywas increased, and the breakthrough time also became shorter. Once the slope of one breakthroughtime–concentration relationship is known, the slope of the other breakthrough percentages can beapproximated. The pseudo-first- and second-order kinetics, and intraparticle diffusion model alsoperformed kinetic analysis for the adsorption of CO2 onto CaO impregnated AC filter. The trend ofadsorption of CO2 onto CaO impregnated AC filter for various initial CO2 concentrations over thecomplete range succeed the pseudo-second-order kinetic model of the test data fixed on the highestcorrelation coefficient of determination, R2(0.921) values which signifies a monolayer adsorptionphenomenon exists between CaO impregnated AC filter and CO2. The CO2 is slowly transferred withintraparticle diffusion into the particles and is lastly kept in micropores.
Acknowledgments: The authors would like to acknowledge the supports from Air-rex Co., Ltd. in Taiwan.Thanks also for the editing service by Mike Barber, a retired academic faculty member of the University ofLiverpool, UK.
Author Contributions: Shih-Cheng Hu and Arson Hsieh conceived and designed the experiments; Tzu-Yu Koperformed the experiments; Angus Shiue and Shu-Mei Chang analyzed the data; Andrew Chan contributedreagents/materials/analysis tools; Angus Shiue wrote the paper.
Conflicts of Interest: The authors declare no conflict of interest.
Nomenclature
C intercept of intraparticle diffusion model, mg kg−1
Ce concentration of free formaldehyde in air, mg L−1
C0 the inlet concentration, ppmk1 the pseudo-first-order rate coefficient, min−1
k2 the pseudo-second-order rate coefficient, g mg−1 min−1
ki the intraparticle diffusion rate constant, mg g−1 min−1/2
M testing gas molecular weight, g mole−1
Q adsorption capacity, mg g−1
qe the amount of adsorbed CO2, mg g−1
qt the amount of adsorbate adsorbed at time t, mg g−1
t testing time, minV the airflow rate, L min−1
References
1. Brunsgaard, C.; Heiselberg, P.; Knudstrup, M.A.; Larsen, T.S. Evaluation of the Indoor Environmentof Comfort Houses: Qualitative and Quantitative Approaches. Indoor Built Environ. 2012, 21, 432–451.[CrossRef]
2. Davis, I.; Harvey, V. Zero Carbon: What Does It Mean to Homeowners and House Builders? NHBC FoundationReport, NF9; London IHS BRE Press: London, UK, 2008.
3. Morrell, P. HM Government, Innovation & Growth Team. 2010. Available online: http://www.bis.gov.uk/assets/biscore/business-sectors/docs/l/10-1266-low-carbon-construction-igtfinal-report.pdf (accessed on4 November 2011).
4. Yu, C.W.F.; Kim, J.T. Building Pathology, Investigation of Sick Buildings—VOC Emissions. Indoor Built Environ.2010, 19, 30–39. [CrossRef]
5. Chuck, W.F.; Kim, J.T. Photocatalytic Oxidation for Maintenance of Indoor Environmental Quality.Indoor Built Environ. 2013, 22, 39–51.

Sustainability 2017, 9, 1533 12 of 13
6. Yao, R.; Yu, C.W.F. Towards “Zero-Carbon Homes”—Issues of Thermal Comfort. Indoor Built Environ. 2012,21, 483–485. [CrossRef]
7. Lee, S.C.; Hsieh, C.C.; Chen, C.H.; Chen, Y.S. CO2 Adsorption by Y-Type Zeolite Impregnated with Aminesin Indoor Air. Aerosol Air Q. Res. 2013, 13, 360–366. [CrossRef]
8. American Society of Testing and Materials (ASTM). Standard Guide for Using Indoor Carbon DioxideConcentrations to Evaluate Indoor Air Quality and Ventilation; American Society for Testing and MaterialsInternational: West Conshohocken, PA, USA, 2012.
9. Occupational Safety and Health Administration, Department of Labor. Indoor Air Quality in Commercial andInstitutional Buildings; OSHA: Department of Labor: Washington, DC, USA, 2011.
10. Ventilation for Acceptable Indoor Air Quality; ASHRAE Standard 62.1; American Society of Heating,Refrigerating and Air-Conditioning: Atlanta, GA, USA, 2016.
11. What Is the Allowable Level of Carbon Dioxide in an Occupied Space? ASHRAE TC-04.03-FAQ-35.2015. Available online: https://www.ashrae.org/FileLibrary/docLib/.../TC-04-03-FAQ-35.pd (accessed on24 July 2017).
12. Ogawa, M.; Nakano, Y. Separation of CO2/CH4 mixture through carbonized membrane prepared by gelmodification. J. Membr. Sci. 2000, 173, 123–132. [CrossRef]
13. Liao, C.H.; Li, M.H. Kinetics of absorption of carbon dioxide into aqueous solutions of monoethanolamine +N-methyldiethanolamine. Chem. Eng. Sci. 2002, 57, 4569–4582. [CrossRef]
14. Cornelissen, R.L.; Hirs, G.G. Energy analysis of cryogenic air separation. Energy Convers. Manag. 1998,39, 1821–1826. [CrossRef]
15. Sarkar, S.C.; Bose, A. Role of activated carbon pellets in carbon dioxide removal. Energy Convers. Manag.1997, 38, S105–S110. [CrossRef]
16. Song, H.K.; Won, C.K.; Lee, K.H. Adsorption of carbon dioxide on the chemically modified silica adsorbents.J. Non-Cryst. Solids 1998, 242, 69–80. [CrossRef]
17. Shin, D.H.; Cheigh, H.S.; Lee, D.S. The use of Na2CO3-based CO2 absorbent systems to alleviate pressurebuildup and volume expansion of kimchi packages. J. Food Eng. 2002, 53, 229–235. [CrossRef]
18. Ranjani, V.S.; Shen, M.S.; Edward, P.F. Adsorption of CO2 zeolites at moderate temperatures. Energy Fuel.2005, 19, 1153–1159.
19. Liu, B.T.; Shui, Y.H.; Zhu, G.Y. Adsorption of a Non-Woven Fabric with Activated Carbon for CO2.Adv. Mater. Res. 2012, 518, 683–686.
20. Jensen, M.B.; Pettersson, L.G.M.; Swang, O.; Olsbye, U. CO2 Sorption on MgO and CaO Surfaces:A Comparative Quantum Chemical Cluster Study. J. Phys. Chem. B 2005, 109, 16774–16781. [CrossRef][PubMed]
21. Lahuri, A.H.; Yarmo, M.A.; Marliza, T.S.; Tahariri, M.N.A.; Samad, W.Z.; Yusop, N.D.M.R. Carbon DioxideAdsorption and Desorption Study Using Bimetallic Calcium Oxide Impregnated on Iron (III) Oxide.Mater. Sci. Forum 2017, 888, 479–484.
22. Hu, S.C.; Chang, A.; Angus Shiue, A.; Lin, T.; Song-Dun Liao, S.D. Adsorption characteristics and kineticsof organic airborne contamination for the chemical filters used in the fan-filter unit (FFU) of a cleanroom.J. Taiwan Inst. Chem. Eng. 2017, 75, 87–96. [CrossRef]
23. American Society of Heating, Refrigerating and Air-Conditioning Engineers (ASHRAE). Laboratory TestMethod for Assessing the Performance of Gas-Phase Air-Cleaning Systems: Air-Cleaning Devices; American Societyof Heating, Refrigerating and Air-Conditioning Engineers: Atlanta, GA, USA, 2011.
24. VanOsdell, D.W.; Owen, M.K.; Jaffe, L.B.; Sparks, L.E. VOC removal at low contaminant concentrationsusing granular activated carbon. J. Air Waste Manag. Assoc. 1996, 46, 883–890. [CrossRef] [PubMed]
25. Guo, B.; Zhang, B.; Jianshun, S.; Nair, S.; Chen, W.; Smith, J. VOC removal performance ofpellet/granular-type sorbent media-experimental results. ASHRAE Trans. 2006, 112, 430–440.
26. Shiue, A.; Kang, Y.H.; Hu, S.C.; Jou, G.T.; Lin, C.H.; Hu, M.C.; Lin, S.I. Vapor adsorption characteristicsof toluene in an activated carbon adsorbent-loaded nonwoven fabric media for chemical filters applied tocleanrooms. Build. Environ. 2010, 45, 2123–2131. [CrossRef]
27. Nelson, G.O.; Harder, C.A. Respirator cartridge efficiency studies: VI. Effect of concentration. Am. Ind. Hyg.Assoc. J. 1976, 37, 205–216. [CrossRef] [PubMed]
28. Lagergren, S. Zur Theorie der Sogenannten Adsorption Gelöster Stoffe, Kungliga SvenskaVetenskapsakademiens. Handlingar 1898, 24, 1–39.

Sustainability 2017, 9, 1533 13 of 13
29. Shafeeyan, M.S.; Ashri, W.M.; Daud, W.; Shamiri, A.; Aghamohammadi, N. Modeling of Carbon DioxideAdsorption onto Ammonia-Modified Activated Carbon: Kinetic Analysis and Breakthrough Behavior.Energy Fuels 2015, 29, 6565–6577. [CrossRef]
30. Singh, V.K.; Kumar, E.A. Comparative Studies on CO2 Adsorption Kinetics by Solid Adsorbents.Energy Procedia 2016, 90, 316–325. [CrossRef]
31. Ho, Y.S.; McKay, G. The kinetics of sorption of basic dyes from aqueous solution by sphagnum moss peat.Can. J. Chem. Eng. 1998, 76, 822–827. [CrossRef]
32. Guibal, E. Metal-Anion Sorption by Chitosan Beads: Equilibrium and Kinetic Studies. Ind. Eng. Chem. Res.1998, 37, 1454–1463. [CrossRef]
33. Fungaro, D.A.; Borrely, S.I.; Carvalho, T.E.T. Surfactant Modified Zeolite from Cyclone Ash as Adsorbent forRemoval of Reactive Orange 16 from Aqueous Solution. Am. J. Environ. Prot. 2013, 1, 1–9. [CrossRef]
34. Shiue, A.; Hu, S.C. Adsorption Kinetics for the Chemical Filters Used in the Make-Up Air Unit (MAU) ofa Cleanroom. Sep. Sci. Technol. 2012, 47, 577–583. [CrossRef]
© 2017 by the authors. Licensee MDPI, Basel, Switzerland. This article is an open accessarticle distributed under the terms and conditions of the Creative Commons Attribution(CC BY) license (http://creativecommons.org/licenses/by/4.0/).