bastien dieppois, alain durand, matthieu fournier, nicolas
TRANSCRIPT

HAL Id: hal-02327491https://hal.archives-ouvertes.fr/hal-02327491
Submitted on 21 Sep 2021
HAL is a multi-disciplinary open accessarchive for the deposit and dissemination of sci-entific research documents, whether they are pub-lished or not. The documents may come fromteaching and research institutions in France orabroad, or from public or private research centers.
L’archive ouverte pluridisciplinaire HAL, estdestinée au dépôt et à la diffusion de documentsscientifiques de niveau recherche, publiés ou non,émanant des établissements d’enseignement et derecherche français ou étrangers, des laboratoirespublics ou privés.
Copyright
Links between multidecadal and interdecadal climaticoscillations in the North Atlantic and regional climatevariability of northern France and England since the
17th centuryBastien Dieppois, Alain Durand, Matthieu Fournier, Nicolas Massei
To cite this version:Bastien Dieppois, Alain Durand, Matthieu Fournier, Nicolas Massei. Links between multidecadal andinterdecadal climatic oscillations in the North Atlantic and regional climate variability of northernFrance and England since the 17th century. Journal of Geophysical Research: Atmospheres, AmericanGeophysical Union, 2013, 118, pp.4359-4372. �10.1002/jgrd.50392�. �hal-02327491�

Links between multidecadal and interdecadal climatic oscillationsin the North Atlantic and regional climate variability ofnorthern France and England since the 17th century
Bastien Dieppois,1 Alain Durand,1 Matthieu Fournier,1 and Nicolas Massei1
Received 19 November 2012; revised 5 April 2013; accepted 5 April 2013; published 29 May 2013.
[1] Knowledge of the variability of climate in the past is essential for understandingcurrent climatic changes. Therefore, we investigated two temperature indices and sevenrainfall time series of northwestern Europe since the 17th century. Trends and multidecadalto interdecadal variability are similar in England and northern France for temperature,whereas a strong regional contrast is evident between the two regions for rainfall.Multidecadal and interdecadal variability displays several periods of enhanced amplitudefor both temperature and rainfall that may be related to large-scale climate control. Onthese scales, temperatures in both England and France display phase opposition with theAtlantic Multidecadal Oscillation (AMO) before 1800, while they are in-phase afterward,as determined by wavelet coherence. On the other hand, the relationships betweentemperature and the North Atlantic Oscillation (NAO) are weak across multidecadal andinterdecadal scales for the whole period under study. For rainfall, coherence with the AMOis observed for scales at around 30–60 years, whereas coherence with the NAO is detectedon 50–80 year scales and interdecadal 16–23 year scales. However, relationships betweenrainfall variability and North Atlantic climate indices are highly contrasted depending onthe region considered. Finally, the results of a mixed spectral/empirical orthogonal functionanalysis of mean sea level pressure on these co-oscillation time scales highlight not onlyNAO regimes but also other patterns, explaining a nonnegligible amount of varianceduring certain time periods.
Citation: Dieppois, B., A. Durand, M. Fournier, and N. Massei (2013) Links between multidecadal and interdecadalclimatic oscillations in the North Atlantic and regional climate variability of northern France and England since the17th century, J. Geophys. Res. Atmos., 118, 4359–4372, doi: 10.1002/jgrd.50392.
1. Introduction
[2] In the context of climatic and environmental changes,knowledge on the variability of climate in the past is funda-mental for comprehension of the mechanisms at play. Thesechanges are observed in hydrologically relevant variablesand affect human activities as well as ecosystems. In thissense, studies included in some reports of the Intergovern-mental Panel on Climate Change (IPCC) show an increasein annual rainfall and temperature since the beginning ofthe 20th century in northwestern Europe [Christensen et al.,2007]. Moreover, according to IPCC projections [Christensenet al., 2007] and to the European Action Towards Com-prehensive Climate Impacts and Adaptations Assessment(ACACIA) project [Parry, 2000], this increase is expected
to continue during the 21st century but will be marked bysignificant variations on the regional scale. In general, theclimate changes prior to the Industrial Revolution in the18th century can be explained by natural causes, such aschanges in solar activity, volcanic eruptions, and naturalchanges in greenhouse gas concentrations [Jansen et al.,2007]. The recent and future trends, however, cannot beexplained by natural causes alone [Jansen et al., 2007], butthe anthropogenic effects are obscured by the presence ofdecadal natural climate variability. Thus, based on long-term climatic records back to the preindustrial period, wepropose a statistical study of time evolutions of the multi-decadal to interdecadal influence of North Atlantic climaticoscillations on observed climatic variations of temperatureand rainfall in northwestern Europe (England and northernFrance).[3] The spectral signature of the global natural climate in-
cludes the multidecadal oscillation (65–70 or 50–88 years onthe North Atlantic) [Schelsinger and Ramankutty, 1994] andthe interdecadal oscillation (15–35 years) [Mann et al.,1995]. On the Atlantic basin, the multidecadal variabilityof the sea surface temperatures (SSTs) refers to the AtlanticMultidecadal Oscillation (AMO) [Enfield et al., 2001;Knight et al., 2006]. In addition, the North Atlantic
1Laboratoire Morphodynamique Continentale et Côtière (M2C), UMR6143, CNRS/Université de Rouen, Mont-Saint Agnan, France.
Corresponding author: B. Dieppois, Laboratoire MorphodynamiqueContinentale et Côtière (M2C), UMR 6143, CNRS/Université de Rouen,FED 4116 SCALE, Place Emile Blondel, FR-76821 Mont-Saint Agnan,France. ([email protected])
©2013. American Geophysical Union. All Rights Reserved.2169-897X/13/10.1002/jgrd.50392
4359
JOURNAL OF GEOPHYSICAL RESEARCH: ATMOSPHERES, VOL. 118, 4359–4372, doi:10.1002/jgrd.50392, 2013
Oscillation (NAO) exhibits strong variability withoutpresenting, contrary to the AMO, any characteristic timescales; however, it can be noted that the end of the 20th cen-tury was dominated by decadal fluctuations [Hurrell, 1995;Wanner et al., 2001; Massei et al., 2007]. Nevertheless, al-though the present study does not aim to explore such inter-actions, we will note that the multidecadal variability couldbe internal to the ocean-atmosphere interactions[Schelsinger and Ramankutty, 1994; Higuchi et al., 1999;Enfield et al., 2001].[4] According to earlier studies, the AMO describes the
SST variability of the North Atlantic presenting cold phases(1900s, 1920s, and 1960s–1980s) and warm periods (1930s–1950s and currently) [Enfield et al., 2001] related to the cli-matic variations throughout the globe [Knight et al., 2006].In particular, the AMO appears to be related to the cyclonicactivity of the North Atlantic [Goldenberg et al., 2001] aswell as the summer climate in North America and Europe[Enfield et al., 2001; Sutton and Hodson, 2005]. Moreover,the AMO is related to variability in the oceanic thermohalinecirculation, notably the Atlantic Meridional Overturning Cir-culation [Zhang et al., 2007].[5] The NAO, which is generally stronger during the win-
ter months, refers to a redistribution of atmospheric mass be-tween the Arctic and the subtropical Atlantic and swingsfrom one phase to another, producing large changes in themean wind speed, direction, and the heat and moisture trans-port between the Atlantic and the neighboring continent[Hurrell, 1995]. This oscillation is described as the mainfluctuation of climate conditions over Europe [Hurrell,1995]: in the positive phase, wetter and warmer winter con-ditions are produced in Northern Europe, Scandinavia, andthe East Coast.[6] Most of the multidecadal and interdecadal scale stud-
ies have investigated paleoclimatic reconstructions in orderto separate possible anthropogenic climate change from nat-ural climate variability [e.g., Schelsinger and Ramankutty,1994; Mann et al., 1995; Cook et al., 1998; Luterbacheret al., 1999, 2002, 2004]. Moreover, substantial studies basedon observed measurements focused on the last century, nota-bly the last 50 years, which limits the study of multidecadalrelationships. Out of these few decades, the AMO onlyachieved two complete cycles [Enfield et al., 2001; Knightet al., 2006]. On the other hand, the study of the relationshipsbetween NAO, temperature, and rainfall also presents severalproblems related to the number and the complexity of thephysical mechanisms involved [Kingston et al., 2006,2007], the degree of temporal nonstationarity [Massei et al.,2007, 2010; Gamiz-Fortis et al., 2008], as well as the sea-sonal [Hurrell and Deser, 2009] to interannual [Hilmer andJung, 2000; Jung et al., 2003] fluctuations in the mean posi-tion of NAO poles.[7] In this paper, we analyze the relationships between
North Atlantic climate oscillations and the observed regionalclimate of northern France and England over multidecadaland interdecadal time scales back to the preindustrial period.In this aim, we use the AMO and NAO indices as well astemperature and rainfall time series of selected weather sta-tions. We also investigate the spatiotemporal variations ofcirculation patterns (SLP, sea level pressure) in terms ofmultidecadal to interdecadal variability to ensure a more ac-curate characterization of the links between the North
Atlantic SLP pattern and regional climate time series. Morespecifically, based on spectral analyses of nonstationary pro-cesses, we address the issue of the changing characteristicsof such relationships over an extended time period markedby an upward trend of anthropogenic forcing, i.e., since theLittle Ice Age up to the Industrial Age.
2. Data
2.1. Temperature and Rainfall Data
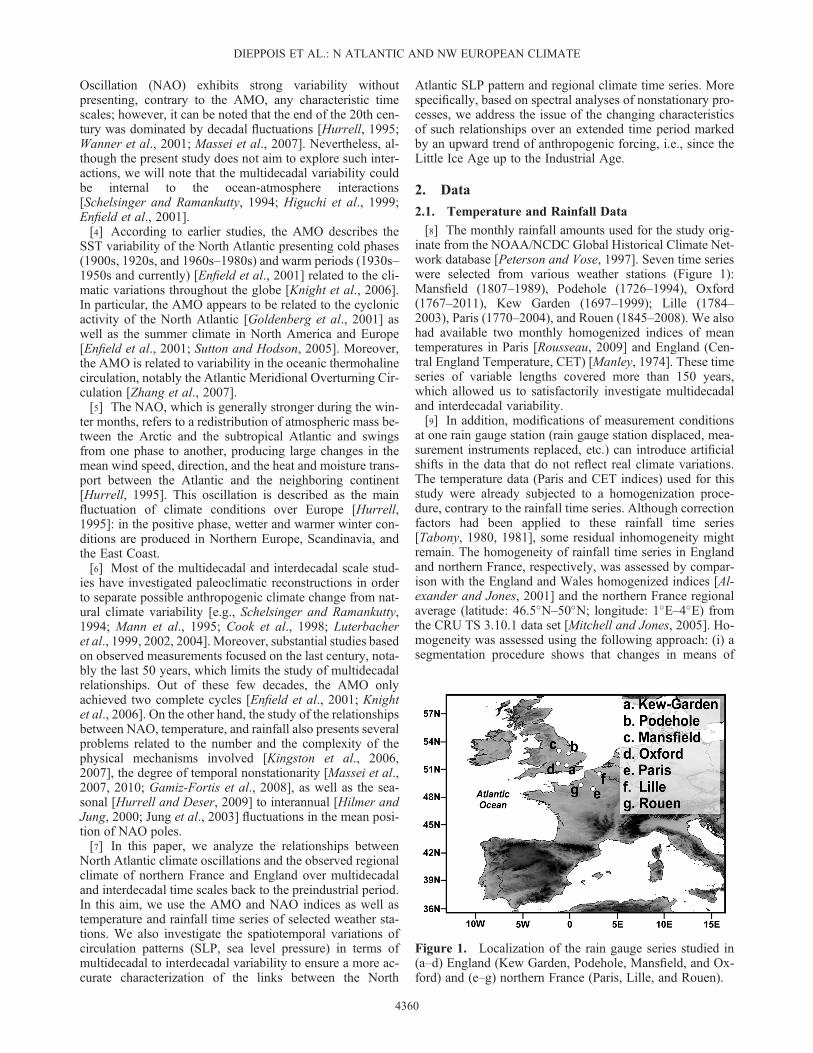
[8] The monthly rainfall amounts used for the study orig-inate from the NOAA/NCDC Global Historical Climate Net-work database [Peterson and Vose, 1997]. Seven time serieswere selected from various weather stations (Figure 1):Mansfield (1807–1989), Podehole (1726–1994), Oxford(1767–2011), Kew Garden (1697–1999); Lille (1784–2003), Paris (1770–2004), and Rouen (1845–2008). We alsohad available two monthly homogenized indices of meantemperatures in Paris [Rousseau, 2009] and England (Cen-tral England Temperature, CET) [Manley, 1974]. These timeseries of variable lengths covered more than 150 years,which allowed us to satisfactorily investigate multidecadaland interdecadal variability.[9] In addition, modifications of measurement conditions
at one rain gauge station (rain gauge station displaced, mea-surement instruments replaced, etc.) can introduce artificialshifts in the data that do not reflect real climate variations.The temperature data (Paris and CET indices) used for thisstudy were already subjected to a homogenization proce-dure, contrary to the rainfall time series. Although correctionfactors had been applied to these rainfall time series[Tabony, 1980, 1981], some residual inhomogeneity mightremain. The homogeneity of rainfall time series in Englandand northern France, respectively, was assessed by compar-ison with the England and Wales homogenized indices [Al-exander and Jones, 2001] and the northern France regionalaverage (latitude: 46.5�N–50�N; longitude: 1�E–4�E) fromthe CRU TS 3.10.1 data set [Mitchell and Jones, 2005]. Ho-mogeneity was assessed using the following approach: (i) asegmentation procedure shows that changes in means of
Figure 1. Localization of the rain gauge series studied in(a–d) England (Kew Garden, Podehole, Mansfield, and Ox-ford) and (e–g) northern France (Paris, Lille, and Rouen).
DIEPPOIS ET AL.: N ATLANTIC AND NW EUROPEAN CLIMATE
4360

homogenized rainfall indices are generally synchronous atthe neighboring gauges; (ii) for the French rain gauge sta-tions, any association between changes in mean and stationdisplacements are rejected from a detailed study of the mete-orological archives (source: Météo-France); (iii) quantile-quantile comparisons reveal small deviations of the normaldistribution between homogenized and raw data; and (iv)linear correlations between homogenized and raw data arealways significant at the 95% confidence limit and rangedfrom 0.74 to 0.87. Thus, as already stated in few earlier stud-ies [e.g., Thompson, 1999; Slonosky, 2002; Thompson andClark, 2008], all these time series can be consideredhomogeneous.
2.2. Climate Indices
[10] To study the relationship between temperature andrainfall with the Atlantic’s climate variability, the AMOand NAO indices were selected. However, the AMO andNAO indices cannot be calculated based on the observeddata before 1870 and 1821, respectively. Therefore, the ro-bustness of the multidecadal and interdecadal relationshipswas addressed using the multisecular reconstructions of theNAO and AMO indices (NAOr and AMOr) of Luterbacheret al. [1999] and Gray et al. [2004]. The corresponding datasets are freely available on the NOAA PaleoclimatologyProgram website (www.ncdc.noaa.gov/paleo/recons.html).The NAOr index uses a combination of observed data, proxydata, and document archives to reconstruct the NAO until1659 A.D. On the basis of comparisons between differentreconstructed NAO indices and the calculated NAO,Schmutz et al. [2000] estimated that the reconstruction ofthe NAO index by Luterbacher et al. [1999] was the mostcoherent. Based on tree ring analyses, the AMOr index isan annual reconstruction since 1567 A.D., statistically veri-fied based on proxy data in North America, western Europe,Scandinavia, and the Middle East [Gray et al., 2004].
2.3. SLP Data
[11] The mean sea level pressure (SLP; 5�latitude� 5longitude) fields are a regional selection (25�N–88�N,90�W–40�E) from the HadSLP2r data set compiled by theMet Office Hadley Centre. This data set was created fromin situ ocean measurements (International ComprehensiveOcean-Atmosphere Data Set) and 2228 continental stationsbetween 1850 and 2004. These land and ocean observationswere combined and then reconstructed using statisticalmethods, making it possible to obtain a stable reconstruction[Allan and Ansell, 2006]. Next, the HadSLP2r database wascreated by extending the HadSLP2 database up to 2005 andby adjusting the climatological means using the NationalCenters for Environmental Prediction/National Center forAtmospheric Research reanalyses.
3. Methodology
3.1. Rainfall Analyses
[12] In section 4.1, serial correlations in the annual timeseries were first assessed by computing autocorrelation func-tions, and subsequently, a monotonic trend was investigatedusing the Mann-Kendall trend test [Mann, 1945; Kendall,1948]. This test is performed on the annual time series of dif-ferent lengths and to a common data period (since 1845).
Thus, the trend intensity and the statistical significanceare given by the Kendall rank correlation coefficient (i.e.,the Kendall’s tau statistics) and the two-sided p value,respectively. Next, all time series were standardized (i.e.,values are then expressed as Z scores) in order to investi-gate the time evolutions of annual rainfall and tempera-ture by adjusting the different degrees of smoothing ofa locally weighted nonparametric polynomial regression(LOESS). This method has already been successfully ap-plied in the study of climatic variations [Cleveland andDevlin, 1988]. Two smoothing windows were used: (i)one equal to the length of the shortest time series studied(164 years) for assessing the general trend of the time series(solid line in Figure 2) and (ii) an ~50 year smoothingwindow for evaluating the multidecadal temperature andrainfall trend in England and northern France (dashed linein Figure 2).[13] So that the identification of the temperature and rain-
fall variability scales are not affected by the length of thetime series observed and by nonstationarity, the continuouswavelet transform (CWT) was applied to the three longesttime series (temperature: CET index; rainfall: Kew Gardenand Paris; section 4.2). Briefly, the convolution of the cli-matic signals by a sum of wavelets of finite length(nonorthogonal) is used to produce a univariate spectrumof sufficient power to identify the spectral components cor-responding to the dominant modes of climate variabilityover time, based on a time/scale reference (Figure 3). Thedetailed explanations of the CWT and its applications to cli-mate signals are now widely documented in the literature[Torrence and Compo, 1998; Labat, 2005; Massei et al.,2007, 2010]. The statistical significance of the spectral com-ponents was assessed using the pointwise test described byTorrence and Compo [1998] and Maraun [2006]. Then,the ranges of variability detected by the CWT werereconstructed using inverse Fourier transform applied to alltime series throughout the year (Figure 4). In this way, thepower of the annual dominant modes of variability can becompared over time on an orthogonal basis.
3.2. Analysis of the Relationship Between the RegionalClimate in Northern France and England and NorthAtlantic Signals
[14] In section 5.1.2, the time/frequency stability of the re-lationship between temperature/rainfall and the climate indi-ces is analyzed using coherence and wavelet phase. Thisapproach has already been successfully applied inhydroclimatology [Torrence and Webster, 1999; Maraun,2006]. Wavelet coherence evaluates the level of linear corre-lation between two time series x(t) and y(t) at a time ti on avariability scale s [Maraun, 2006], with the phase diagramdescribing the delay between two signals for all time/scalelocalizations given. The angular wavelet phase has differentvalues (Figures 5–7): (i) for a phase shift close to p or �p,the signals compared display phase opposition; (ii) for aphase shift close to 0, the signals are in-phase, i.e., morerainfall when the Atlantic SSTs are warm; and (iii) a phaseshift close to p/2 or �p/2 shows a phase quadrature; in thiscase, the signals present a substantial delay, which is physi-cally nearly impossible or difficult to interpret.[15] In section 6, we break down the North Atlantic SLP
field (HadSPL2r: 25�N–88�N, 90�W–40�E) into empirical
DIEPPOIS ET AL.: N ATLANTIC AND NW EUROPEAN CLIMATE
4361

orthogonal functions (EOFs) [Preisendorfer, 1988] of previ-ously filtered data. First, deseasonalized patterns of NorthAtlantic SLPs were computed by subtracting the monthlyinterannual mean from each corresponding month forall the time series from the grid. Second, each of the 486SLP time series from the grid was detrended by removinga LOESS model and subsequently filtered out using Fouriertransform according to the time scales identified as signifi-cant co-oscillations between NAOr and rainfall by waveletcoherence. Then, EOFs of filtered data can be used to iden-tify North Atlantic SLP patterns associated with multi-decadal and interdecadal time scales.
4. Temperature and Rainfall Since the 17thCentury
4.1. Long-Term Trend and Variability
[16] The observations on temperatures are highly similarbetween the CET and Paris indices (Figures 2a and 2b). Bothseries have presented a positive trend (warmer) since the
beginning of the 20th century (in England since 1904 andin Paris since 1918; solid line, Figures 2a and 2b). Asexpected, this positive trend appears significant in theMann-Kendall trend test (tau: 0.15–0.27, p value:2.22E�16 to 3.49E�5; Figures 2a and 2b) with autocorrela-tion coefficients of 0.4 and 0.12 for lag k= 1 in the CET andParis indices, respectively. Nonetheless, LOESS regressionsusing ~50 year smoothing windows show that the warm pe-riods became more frequent from 1820 (period at the end ofthe Little Ice Age; dashed line, Figures 2a and 2b). Since thebeginning of the 20th century, in addition to the intensity ofthis widely discussed warming, the persistence of warmanomalies has been observed (Figures 2a and 2b).[17] For rainfall in England (solid line, Figures 2c–2f), the
autocorrelation coefficients (lower than 0.007 for lag k= 1)were never significant at the 95% confidence limit, and notrend could be detected according to the Mann-Kendall trendtest since the beginning of recorded data (tau: �0.03 to0.048, p value: 0.33–0.98) and for the common period(tau: �0.006 to 0.054, p value: 0.34–0.99). Nonetheless,multidecadal rainfall variability (~50 year smoothing
Figure 2. Time evolution of standardized annual temperature and rainfall amounts in England and north-ern France. (a, b) General trend (bold lines) and ~50 year LOESS regression (dashed lines) of homoge-neous temperature indices of the CET and Paris indices. (c–f) Same for the England rainfall amounts(Mansfield, Podehole, Oxford, and Kew Garden). (g–i) Same for the rainfall amounts in northern France(Lille, Paris, and Rouen). Blue (red) shaded displayed negative (positive) multidecadal trend for temper-ature and conversely for rainfall. The trend intensity (tau) and statistical significance (two-sided p value)are evaluated using the Mann-Kendall trend test since the beginning of recorded data (black) and a com-mon data period (since 1845; grey). The means and standard deviations of the original series before stan-dardization are provided on the figure.
DIEPPOIS ET AL.: N ATLANTIC AND NW EUROPEAN CLIMATE
4362

windows) clearly demonstrates alternating periods of rainfallexcesses and deficits before the 20th century (dashed line,Figures 2c–2f). The lag-1 autocorrelation coefficients arenot statistically significant in France (except for Rouen, witha coefficient lower than 0.39 for lag k = 1). Contrary to En-gland, the results of the Mann-Kendall trend test on Frenchtime series in both time periods (all recorded periods: tau:0.1–0.22; p value: 2.15E�5 to 0.029; common period: tau:0.098–0.22; p value = 2.15E�5 to 0.067) show that the gen-eral rainfall trend is much more pronounced (Figures 2g–2i).It has been increasing since the end of the 19th century;the intensity of the increase is not discussed here since itdepends on the length of the series (solid line, Figures 2g–2i).Moreover, LOESS regressions using ~50 year smoothing
windows demonstrate strong variability in the rainfallmarked by alternating periods of excess and shortage (dashedline, Figures 2g–2i). This variability seems more intense after1850 in Paris and Rouen and since 1930 in Lille (dashed line,Figures 2g–2i).[18] Although the temperature trends are similar in En-
gland and northern France, rainfall presents a strong regionalcontrast on either side of the English Channel. Furthermore,the changes observed in the temperature series could be inagreement with the changes observed in the rainfall in north-ern France, contrary to the rainfall in England. Moreover,with ~50 year smoothing windows, the results highlightthe presence of well-structured low-frequency fluctuationsthat are very localized in time.
Figure 3. CWT applied to mean temperatures and to monthly rainfall amounts of the longest time series:(a) CET index, (b) rainfall at Kew Garden, and (c) rainfall in Paris. Bold line delineates the so-called coneof influence under which power is likely to be underestimated as a consequence of zero padding. Thincontour lines show the 90% confidence limits (Monte Carlo simulation).
Figure 4. Reconstruction using inverse fast Fourier transform of the multidecadal and interdecadal timescales of temperature (�C) and rainfall (mm yr�1) variability in England and northern France. (a–c) Recon-struction of multidecadal (50–120 and 30–45 years) and interdecadal (16–30 years) variability of the CETindex (grey lines) and the Paris index (black lines). (d–f) Same for rainfall in England (black to light greylines: Kew Garden, Podehole, Oxford, and Mansfield) and northern France (black to light grey lines: Paris,Lille, and Rouen). A, B, and C show the periods of high amplitude of a given variability time scale (yel-low: common to all rain gauge stations; green: observed on a few rain gauge stations).
DIEPPOIS ET AL.: N ATLANTIC AND NW EUROPEAN CLIMATE
4363

4.2. Time Scales of Temperature and RainfallVariability
[19] Temperatures in England (CET index) display severaltime scales of variability (Figure 3a): 50–120 yearmultidecadal (or 40–90 year after 1900, only on the CET in-dex) and 30–45 year multidecadal, one 16–30 yearinterdecadal, and also quasidecadal to interannual modes oflesser importance.[20] The application of CWT to these two sectors reveals
different time scales of rainfall variability (Figures 3b and3c). In England (Kew Garden), the wavelet spectrum showsone 30–60 year multidecadal, one 9–16 year quasidecadal,and one 4–8 year interannual (Figure 3b) time scale. InFrance (Paris), the wavelet spectrum reveals one 50–80 yearmultidecadal scale, one 16–23 year interdecadal scale, one9–16 year quasidecadal scale, and one 4–8 year interannualscale (Figure 3c).[21] After reconstruction of the multidecadal and
interdecadal time scales of temperature variability (50–120,30–45, and 16–30 years), the temperature indices in bothParis and central England display similar time evolutions(Figures 4a–4c). Before 1800, both multidecadal (50–120years) and interdecadal (16–30 years) scales show high am-plitudes (phase A, Figures 4a and 4c). In the 19th century(phase A0), a reinforcement of the 30–45 year multidecadalvariability is detected (Figure 4b). Then, in the 20th century,
the 50–120 year (or 40–90 year in the CET index) variabilityis reinforced as well (phase B, Figure 4a).[22] For all rain gauge stations, the fluctuations in ampli-
tude of multidecadal and interdecadal variability (50–80,30–60, and 16–23 years) were compared (Figures 4d–4f).The 50–80 year variability is reinforced at the end of the19th century in northern France (Figure 4d), while it is notsignificant in England (no peak detected on this scale; Fig-ures 4b and 4d). The 30–60 year multidecadal variability,expressed in England on the CWT (Figure 3b), also occursin northern France (Figure 4e). However, its amplitude fluc-tuates over time in different manners in the two regions (Fig-ure 4e): in England, the 30–60 year variability is strongerduring the 1740–1800 and 1850–1950 periods (phases Aand C); in France, this variability is more powerful between1780 and 1870 (phase B). The 16–23 year interdecadal rain-fall variability, which only appears in northern France on theCWT (Figure 3c), is also observed in England with the sametime evolution (Figure 4f). Three phases of interdecadal var-iability reinforcement are detected (Figure 4f): between 1730and 1820 (phase A-A0), between 1850 and 1920 (phase B-B0), and after 1940–1950 (phase C0), only observed atPodehole and Oxford in England (phase C).[23] Thus, three multidecadal and interdecadal modes of
variability are identified in England and northern Francefor temperature (50–120, 30–45, and 16–30 years) and rain-fall (50–80, 30–60, and 16–23 years). As presented in
Figure 5. Wavelet coherence and phase between the temperature indices (�C) of England and northernFrance and North Atlantic climatic oscillations (AMOr and NAOr indices). (a, b) Wavelet coherence andphase between the CET index and the Paris index with the AMOr index. (c, d) Same with the NAOr index.Bold lines delineate the so-called cone of influence under which power is likely to be underestimated as aconsequence of zero padding. Thin contour lines show the pointwise significance test at the 90% level(critical value = 0.904). On the phase diagrams: red indicates an angular phase = p or �p, a phase opposi-tion between the two signals; light blue indicates an angular phase = 0, or a phase relation between the twosignals; green indicates an angular phase =p/2 or a slight negative delay between the two signals, whichremains interpretable; all other colors indicate a phase quadrature presenting a noninterpretable delay.
DIEPPOIS ET AL.: N ATLANTIC AND NW EUROPEAN CLIMATE
4364

section 3.1, these fluctuations in temperature are very similaron both sides of the English Channel. On the other hand,concerning rainfall, a strong regional contrast exists betweenEngland and northern France, which is observed most partic-ularly on multidecadal scales (50–80 and 30–60 years).Moreover, the analysis of multidecadal and interdecadaltime scales of variability has demonstrated a number of pe-riods of high amplitude (whether or not they are shared byall the time series studied). Furthermore, these periods of in-creasing regional variability in temperature and rainfallcould be related to North Atlantic climate variability.
5. Co-Oscillations Between Regional ClimateVariables and North Atlantic Climate Indices
5.1. Temperature Versus AMOr/NAOr
[24] The temperature in central England and Parisexhibited two periods of high amplitude on the 50–120 yearmultidecadal scale (A: before 1800; B: 20th century; Fig-ure 4a). Such increases seem to be linked with the AMOr in-dex as emphasized by the wavelet coherence diagram(Figures 5a and 5b). During period A, the 50–120 year var-iability of the wavelet phase spectrum displays a phase
Figure 6. Wavelet coherence and phase between the monthly rainfall amounts of England and northernFrance with the AMOr index. (a–d) Wavelet coherence and phase between the England rainfall amounts(Kew Garden, Podehole, Oxford, and Mansfield) and the AMOr index. (e–g) Same in northern France(Paris, Lille, and Rouen). Same legends as Figure 5 (critical value = 0.921).
DIEPPOIS ET AL.: N ATLANTIC AND NW EUROPEAN CLIMATE
4365

opposition (i.e., warmer North Atlantic SSTs associated withcooler temperature in England and northern France; Fig-ures 5a and 5b). Conversely, during period B, since 1900,the 50–120 year variability is in-phase with AMOr (i.e.,warmer North Atlantic SSTs associated with warmer tem-perature in England and northern France; Figures 5a and5b). The A0 period (19th century), referring to the transitionperiod, is marked by high amplitude of 30–45 yearmultidecadal variability, coherent and in-phase with theAMOr index (Figures 5a and 5b). The interdecadal variabil-ity of temperature and the AMOr index is occasionally co-herent and presents a phase change (the signals firstdisplay phase opposition and then are in-phase) at the begin-ning of the 20th century (Figures 5a and 5b).
[25] Coherence between temperature and the NAOr indexis observed mainly from interdecadal (16–36 years) tointerannual scales, and the two signals are in-phase most ofthe time (Figures 5c and 5d).[26] The periods of increasing multidecadal (50–120 and
30–45 years) and interdecadal (16–30 years) temperaturevariability in England and France seem to be related to theAMOr index. These co-oscillations display phase changesbetween the 18th and 20th centuries, suggesting changes inthe oceanic circulation and/or in the seasonal characteristicsof associated large-scale teleconnections. According to vander Schrier and Weber [2009], a northward displacementof the Gulf Stream system and a greater heat flux are ob-served during the 1790–1825 A.D. period. Moreover,
Figure 7. Same as Figure 6 but with the NAOr index (critical value = 0.921).
DIEPPOIS ET AL.: N ATLANTIC AND NW EUROPEAN CLIMATE
4366

Knight et al. [2006] showed that the correlations between theCET index and the AMO are only significant and positive inJJA and SON but can be reversed in DJF. Thus, as has beenobserved since 1990 [Sutton and Dong, 2012], it would bepossible that the DJF correlation is stronger on multidecadaland interdecadal scales before 1800.[27] In contrast, the relationship between temperature and
the NAOr index seems weaker and tends to be detectedacross the highest-frequency time scales.
5.2. Rainfall Versus AMOr
[28] The 50–80 year multidecadal rainfall variability innorthern France has exhibited high amplitudes since theend of the 19th century (phase A, Figure 4d). The latter pe-riod appears coherent with the AMOr index but in the quad-rature phase (i.e., rainfall changes before the AMOr index;Figures 6e–6g). The 30–60 year multidecadal variability,presenting three periods of high amplitude (A: 1740–1800in England, B: 1780–1870 in France, C: 1850–1950 in En-gland; Figure 4e), is coherent and displays a phase opposi-tion with the AMOr index (i.e., more rainfall when theNorth Atlantic SSTs are cooler; Figure 4). However, coher-ence levels are not equivalent from one gauge station to an-other and can be nonsignificant, as in Lille during phase B(Figure 6).[29] The 16–23 year interdecadal scale is characterized by
a low coherence level between the AMOr index and rainfallat Kew Garden, Podehole, Oxford, Mansfield, and Paris dur-ing the period B-B0 (i.e., 1850–1920) (Figures 6a–6e).
5.3. Rainfall Versus NAOr
[30] On the multidecadal scale (50–80 years), rainfall var-iability at Kew Garden and Podehole is coherent with theNAOr index (Figures 7a and 7b). This coherent time scaleof variability displays a phase opposition before 1850,whereas the signals are in-phase after 1950 (i.e., negativeNAO was associated with greater rainfall before 1850, andafter 1950, positive NAO is related to greater rainfall) de-spite a decrease in coherence (Figures 7a and 7b). In north-ern France, the multidecadal rainfall variability and theNAOr index are also coherent and in-phase at the end ofthe 19th century for Paris and Rouen (Figures 7e and 7g),and after 1950 for Lille (Figure 7f). The increase of the50–80 year multidecadal rainfall variability at the end ofthe 19th century (period A, Figure 4d) could therefore be re-lated to the NAOr index. Even though this relationshipseems to hold in Podehole and Kew Garden, it would nothave a significant impact on these rainfall series (Figures 3band 4d). However, this 50–80 year multidecadal time scalemay be more clearly expressed at the seasonal scale andfor particular seasons.[31] In the interdecadal rainfall variability scale (16–23
years), three periods of high amplitude were observed (Fig-ure 4f): the 1730–1820 period (period A-A0); the 1850–1920 period (phase B-B0); and the post–1940/1950 period,(period C0), only observed at Podehole and Oxford in En-gland (period C). Although during period A-A0 the relation-ship between rainfall and the NAOr index is not perfectlyclear, the same does not hold true for periods B and C-C0(Figure 7). The NAOr index is coherent and is in phaseopposition with rainfall variability in England in phase B
(Figures 7a–7d), and during the period C-C0 in northernFrance (with a greater delay at Lille), at Podehole andOxford (Figures 7b, 7c, 7e, and 7g).[32] Three interpretations can be made to explain the
phase changes observed in the rainfall/NAOr. First, positivesummer NAO, which is displaced significantly northeast-ward compared to winter [Hurrell and Deser, 2009], impliesdry conditions over NW Europe [Folland et al., 2009].Thus, changes in the seasonal aspect of these multidecadaland interdecadal teleconnections should be pursued. Second,a multidecadal and interdecadal northeastward/southwest-ward shift of the NAO pattern could occur independentlyof the annual cycle over centuries. Third, multidecadal andinterdecadal covariability scales are significantly affectedby small-scale and transient meteorological phenomena suchas other SLP patterns not related to the NAO and, therefore,may contain noise.
6. Multidecadal and Interdecadal Anomalies ofNorth Atlantic SLP Patterns Since 1850
[33] The AMOr index seems representative of the NorthAtlantic SST variability observed, with strong correlationvalues (r= 0.64 with the SSTs; r= 0.81 with the AMO indexaccording to Gray et al. [2004]). The contrary is true for theNAO index, which cannot optimally represent the spatialstructure of the NAO pattern. A disadvantage of station-based indices is that they are fixed in space and thus donot account for the displacement of the action centerson the seasonal scale and the existence of other SLPpatterns [Barnston and Livezey, 1987; Cassou et al., 2004;Hurrell and Deser, 2009]. This actually constitutes onenonnegligible issue since the NAO pattern only accountsfor approximately half of the total interannual variance inwinter [Cassou et al., 2004].[34] Over the 1850–2010 period, two series of filtered
EOFs were constructed according to 50–80 yearmultidecadal and 16–23 year interdecadal variability scalesto observe the multidecadal and interdecadal anomalies ofthe SLP fields and were compared with normal conditions(deseasonalized) (Figure 8). The 30–60 year multidecadalEOFs are not shown here since the NW European climateand the NAOr index were not coherent on this scale.[35] First (Figure 8a), we compared the fractions of vari-
ance accounted for by the first 20 EOFs for the multidecadal(blue: 50–80 years) and interdecadal (green: 16–23 years)variations with the normal conditions (black lines). Themultidecadal anomalies of the SLP field seem to be observedon the first two EOFs (Figure 8a). On the interdecadal scale,the variance fraction distribution of the SLP anomalies iscloser to the normal conditions (Figure 8a). Therefore, thethird EOF always presenting more than 10% of the total var-iance is also retained (Figure 8a).[36] Second, we studied the SLP patterns of multidecadal
and interdecadal anomalies compared to normal conditions(Figures 8b–8i). In normal conditions, according to ourEOF calculation method, the first three EOFs identified wereidentical to those reported by Pauling et al. [2006] for the1500–2002 period. EOF-1 (35% of the total EOF variance)shows NAO patterns, consisting of a north-south dipole ofanomalies with one center located over Greenland and theother center of the opposite sign spanning the central
DIEPPOIS ET AL.: N ATLANTIC AND NW EUROPEAN CLIMATE
4367

latitudes of the North Atlantic between 35�N and 40�N (Fig-ure 8b). EOF-2 (17%; Figure 8c), similar to the structure ofEOF-3 studied by Slonosky et al. [2000] and Luterbacheret al. [2002], shows a contrast between western and easternEurope. Moreover, EOF-2 may be similar to the Scandinavia(SCAND) pattern and, therefore, to a component of meridi-onal flow over Europe [Barnston and Livezey, 1987].Moreover, the positive and negative phases of this patternare associated with positive SLP anomalies, sometimes
reflecting a blocking pattern over the Scandinavia and Atlan-tic ridge patterns, respectively [Cassou et al., 2004; Hurrelland Deser, 2009]. EOF-3 (14.5%) is characterized by anSLP structure centered on the North Sea and simultaneouslySLP with opposite signs over the NW Atlantic and NorthAfrica (Figure 8d). This pattern shows a strong resemblanceto the East Atlantic (EA) pattern [Barnston and Livezey,1987], which is often interpreted as a southeastward shiftedNAO pattern.
Figure 8. Reconstruction using the EOF of multidecadal (50–80 years) and interdecadal (16–23 years)anomalies of the North Atlantic SLP (hPa, HadSLP2r data set: 25�N–88�N, 90�W–40�E) since 1850and the percentage expressed of the total EOF variance. (a) Fraction of the variance expressed by the20th EOFs at the multidecadal scale (blue), the interdecadal scale (green), and according to the normaldeseasonalized conditions (black, standard deviation in grey). (b–d) EOF-1, EOF-2, and EOF-3 of thedeseasonalized North Atlantic mean SLP. (e, f) EOF-1 and EOF-2 of the multidecadal North Atlanticmean SLP anomalies (50–80 years). (g, i) EOF-1, EOF-2, and EOF-3 of the interdecadal North Atlanticmean SLP anomalies (16–23 years). The EOFs presenting less than 10% of the total variance are notrepresented.
DIEPPOIS ET AL.: N ATLANTIC AND NW EUROPEAN CLIMATE
4368
[37] On multidecadal and interdecadal scales, the domi-nant SLP patterns (EOF-1) display NAO patterns(multidecadal and interdecadal: 76.5% and 53.5% of the to-tal EOF variance; Figures 8e and 8g). At first glance, the 50–80 and 16–23 year covariability scales appear to be related toNAO patterns, particularly on the multidecadal scale (76.5%of the total EOF variance), which reduces uncertainty. As forEOF-2, the SLP patterns associated with the multidecadaland interdecadal anomalies present a NE-SW dipole ofanomaly centers spanning the whole region studied (Fig-ures 8f and 8h). Moreover, an eastward shift of the Icelandiclow is clearly detected. This spatial structure of the SLPanomaly could therefore modify zonal and meridional atmo-spheric circulations associated with the NAO and Scandina-via patterns. On the interdecadal scale, EOF-3 ischaracterized by a low-pressure zone extending from Green-land to North Africa and a high-pressure zone over NEAmerica and Russia (Figure 8i). As a result, on themultidecadal and interdecadal scales, respectively, 22.5%and 22 + 11% of the variance accounted for by EOFs coulddisturb the study of the relationship between rainfall andthe NAO Index.[38] We compared the time evolution of the multidecadal
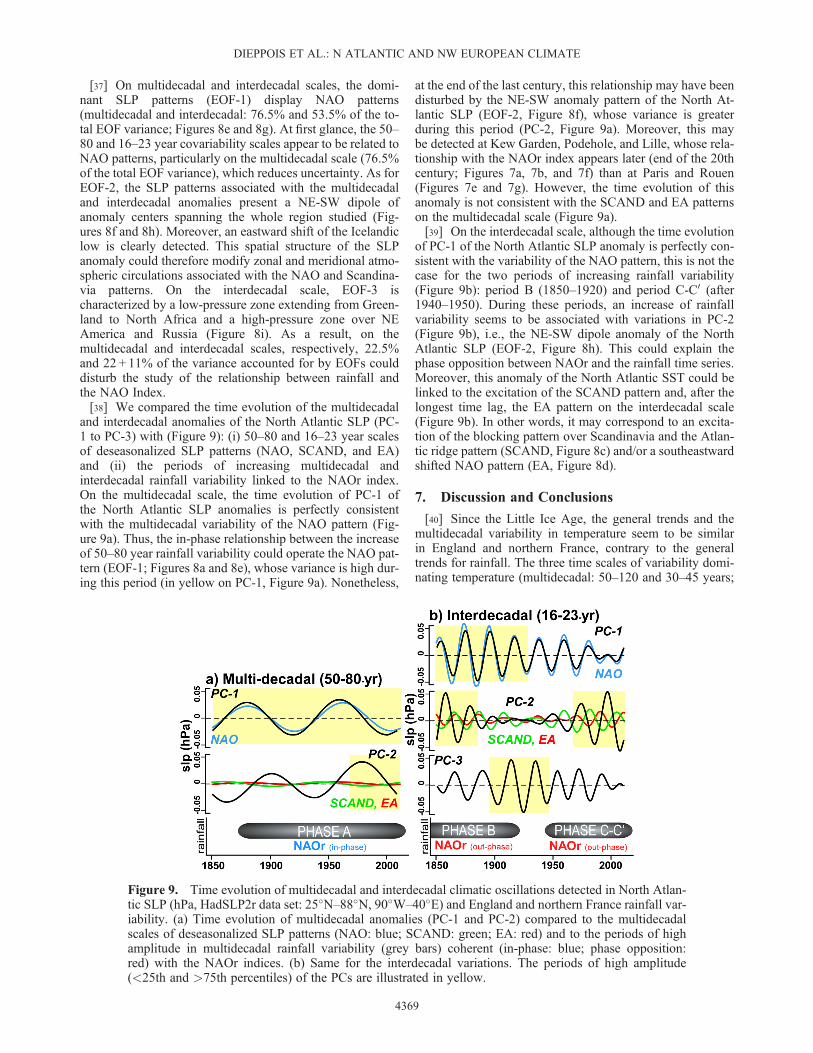
and interdecadal anomalies of the North Atlantic SLP (PC-1 to PC-3) with (Figure 9): (i) 50–80 and 16–23 year scalesof deseasonalized SLP patterns (NAO, SCAND, and EA)and (ii) the periods of increasing multidecadal andinterdecadal rainfall variability linked to the NAOr index.On the multidecadal scale, the time evolution of PC-1 ofthe North Atlantic SLP anomalies is perfectly consistentwith the multidecadal variability of the NAO pattern (Fig-ure 9a). Thus, the in-phase relationship between the increaseof 50–80 year rainfall variability could operate the NAO pat-tern (EOF-1; Figures 8a and 8e), whose variance is high dur-ing this period (in yellow on PC-1, Figure 9a). Nonetheless,
at the end of the last century, this relationship may have beendisturbed by the NE-SW anomaly pattern of the North At-lantic SLP (EOF-2, Figure 8f), whose variance is greaterduring this period (PC-2, Figure 9a). Moreover, this maybe detected at Kew Garden, Podehole, and Lille, whose rela-tionship with the NAOr index appears later (end of the 20thcentury; Figures 7a, 7b, and 7f) than at Paris and Rouen(Figures 7e and 7g). However, the time evolution of thisanomaly is not consistent with the SCAND and EA patternson the multidecadal scale (Figure 9a).[39] On the interdecadal scale, although the time evolution
of PC-1 of the North Atlantic SLP anomaly is perfectly con-sistent with the variability of the NAO pattern, this is not thecase for the two periods of increasing rainfall variability(Figure 9b): period B (1850–1920) and period C-C0 (after1940–1950). During these periods, an increase of rainfallvariability seems to be associated with variations in PC-2(Figure 9b), i.e., the NE-SW dipole anomaly of the NorthAtlantic SLP (EOF-2, Figure 8h). This could explain thephase opposition between NAOr and the rainfall time series.Moreover, this anomaly of the North Atlantic SST could belinked to the excitation of the SCAND pattern and, after thelongest time lag, the EA pattern on the interdecadal scale(Figure 9b). In other words, it may correspond to an excita-tion of the blocking pattern over Scandinavia and the Atlan-tic ridge pattern (SCAND, Figure 8c) and/or a southeastwardshifted NAO pattern (EA, Figure 8d).
7. Discussion and Conclusions
[40] Since the Little Ice Age, the general trends and themultidecadal variability in temperature seem to be similarin England and northern France, contrary to the generaltrends for rainfall. The three time scales of variability domi-nating temperature (multidecadal: 50–120 and 30–45 years;
Figure 9. Time evolution of multidecadal and interdecadal climatic oscillations detected in North Atlan-tic SLP (hPa, HadSLP2r data set: 25�N–88�N, 90�W–40�E) and England and northern France rainfall var-iability. (a) Time evolution of multidecadal anomalies (PC-1 and PC-2) compared to the multidecadalscales of deseasonalized SLP patterns (NAO: blue; SCAND: green; EA: red) and to the periods of highamplitude in multidecadal rainfall variability (grey bars) coherent (in-phase: blue; phase opposition:red) with the NAOr indices. (b) Same for the interdecadal variations. The periods of high amplitude(<25th and >75th percentiles) of the PCs are illustrated in yellow.
DIEPPOIS ET AL.: N ATLANTIC AND NW EUROPEAN CLIMATE
4369

interdecadal: 16–30 years) display obvious co-oscillations inEngland and northern France, which is not the case for thatcharacterizing rainfall variability (multidecadal: 50–80 and30–60 years; interdecadal: 16–23 years). This suggests thatthe large-scale climate oscillations control temperature andrainfall differently.[41] The statistical relationships between temperature and
the North Atlantic SSTs (AMOr index) across themultidecadal and interdecadal time scales reveal changes be-tween the Little Ice Age and the present time. Increasingmultidecadal and interdecadal temperature variability in En-gland and northern France corresponds to phase oppositionwith the AMOr index (i.e., cooler SSTs were associated withwarmer temperatures) before 1800; afterward, the North At-lantic SSTs and temperature variability are in-phase (i.e.,warmer SSTs were associated with warmer temperatures).Such multidecadal co-oscillations in North Atlantic SSTsmatch those of the Atlantic thermohaline circulation[Delworth et al., 1997; Enfield et al., 2001]. Thus, the phasechanges in the observed temperature/AMOr relationshipscould be linked to a northward displacement of the GulfStream system and a greater heat flux during the 1790–1825 A.D. period [van der Schrier and Weber, 2009]. More-over, changes in the seasonal characteristics of multidecadaland interdecadal teleconnections cannot be excluded. Fur-thermore, the in-phase relationship between temperatureand the NAOr index remains weak because it is restrictedto the interdecadal and interannual scales (not highlyexpressed on the CWT of the CET index).[42] Nonstationary behaviors of relationships between
rainfall and AMO/NAO indices are also detected since theend of 17th century. Multidecadal and interdecadal rainfallvariability shows wavelet coherence over 30–60 years withAMOr and 50–80 and 16–23 years with NAOr. However,during the periods of high amplitude of the 30–60 year var-iability (A: 1740–1800 in England; B: 1780–1870 in France;C: 1850–1950 in England), the rainfall and AMOr index arein phase opposition (i.e., colder North SSTs associated withgreater rainfall). On the other hand, the 50–80 year variabil-ity shows the following: (i) in England, a phase oppositionwith the NAOr index before 1850, whereas the signals arein-phase after 1950 (i.e., negative NAO was associated withgreater rainfall before 1850, and after 1950, positive NAO isrelated to greater rainfall); (ii) in northern France, rainfalland NAO are in-phase at the end of the 19th century forParis and Rouen and, after 1950, for Lille. Moreover, theinterdecadal variability presents a phase opposition withthe NAOr index in England during phase B (1850–1920)and during C-C0 (after 1940–1950) in northern France,Podehole, and Oxford. The latter result is consistent withprevious hydrological studies conducted on hydrosystemsover shorter time periods in northern France and England[Slimani et al., 2009; Massei et al., 2010; Holman et al.,2011].[43] The phase changes in the NAO/rainfall relationships
are in agreement with those reported by Mokhov et al.[2000], who found that, using interpretations of two1000 year numerical simulations, decadal variability ofNAO regimes clearly varied over centuries: recent studieshave documented the impacts of minimum and maximumsolar activities [Kodera and Kuroda, 2005; Van Loon etal., 2012] and increasing greenhouse gases emissions
[Osborn, 2004] on long-term NAO variability that mightwell be involved here. Moreover, these multidecadal andinterdecadal teleconnections with NAO may involvelong-term changes of the annual cycle [Folland et al.,2009; Hurrell and Deser, 2009]. For instance, an increaseof winter NAO multidecadal variability has been detectedsince 1850 [Wanner et al., 2001], while Paris’s winter pre-cipitation has increased by 24 mm/century since the 17thcentury [Slonosky, 2002]. In addition, although NAO pat-terns remain dominant, at least since 1850, a nonnegligiblefraction of variance accounted for by the EOFs (up to22%) on the multidecadal and interdecadal scales couldbe explained by different patterns than NAO. Indeed, theSLP patterns of multidecadal and interdecadal anomaliesdisplay a NE-SW dipole of anomaly centers, which couldexcite the SCAND and EA patterns at least for theinterdecadal scale. In other words, it may correspond toan excitation of meridional circulations associated withblocking and Atlantic ridge patterns and/or, after a longertime lag, a southeastward shift of zonal circulations of theNAO pattern.[44] Nonetheless, as proposed by Parker et al. [2007], the
combined influence of the AMO and the NAO can be thesource of regional climatic “surprises.” Such interactions be-tween the Atlantic Ocean and the NAO at the decadal timescale have already been examined in several studies [e.g.,Schelsinger and Ramankutty, 1994; Higuchi et al., 1999;Rodwell et al., 1999; Enfield et al., 2001; Czaja andFrankignoul, 2002; Kushnir et al., 2002] but, in general,remain poorly understood. Hence, future research wouldneed to be conducted on the investigation and identificationof co-oscillations between atmospheric and oceanic variabil-ity, as well as on the characterization of multidecadal andinterdecadal processes involved in the relationships betweenthe North Atlantic and regional climates. Yet sensitivity ex-periments would be also necessary to delineate the respec-tive contributions of natural variability and climate change,which will be essential for meeting the challenges of decadalpredictions.
[45] Acknowledgments. The authors would like to thank the UpperNormandy regional research federation FED 4116 SCALE for financial sup-port. The authors are also grateful to Dr Victoria Slonosky for her helpfulfriendly review of the manuscript.
ReferencesAlexander, L. V., and P. D. Jones (2001), Updated precipitation series forthe U.K. and discussion of recent extremes, Atmos. Sci. Lett., 1, 142–150,doi:10.1006/asle.2001.0025.
Allan, R., and T. Ansell (2006), A new globally complete monthly historicalgridded mean sea level pressure data set (HadSLP2): 1850–2004,J. Clim., 19, 5816–5842, doi:10.1175/JCLI3937.1.
Barnston, A. G., and R. E. Livezey (1987), Classification, seasonality andpersistence of low-frequency atmospheric circulation patterns, Mon.Weather Rev., 115, 1083–1126.
Cassou, C., L. Terray, and C. Deser (2004), North Atlantic winter climateregimes: spatial asymmetry, stationarity with time and oceanic forcing,J. Clim., 17, 1055–1068, doi:10.1175/1520-0442(2004)017.
Christensen, J. H., et al. (2007), Regional climate projections, in ClimateChange 2007: The Physical Sciences Basis. Contribution of WorkingGroup I to the Fourth Assessment Report of the Intergovernmental Panelon Climate Change, edited by S. Solomon, D. Qin, M. Manning, Z. Chen,M. Marquis, K. B. Averyt, M. Tignor, and H. L. Miller, 847–940,Cambridge Univ. Press, Cambridge.
Cleveland, W. S., and S. J. Devlin (1988), Locally weighted regression: anapproach to regression analysis by local fitting, J. Am. Stat. Assoc., 83,596–610.
DIEPPOIS ET AL.: N ATLANTIC AND NW EUROPEAN CLIMATE
4370

Cook, E. R., R. D. D’Arrigo, and K. R. Briffa (1998), The North AtlanticOscillation and its expression in circum-Atlantic tree-ring chronologiesfrom the North America and Europe, Holocene, 8, 9–17.
Czaja, A., and C. Frankignoul (2002), Observed impact of Atlantic SSTanomalies on the North Atlantic Oscillation, J. Clim., 15, 606–623,doi:10.1175/1520-0442(2002)015<0606:OIOASA>2.0.CO;2.
Delworth, T. L., S. Manabe, and R. J. Stouffer (1997), Multidecadal climatevariability in Greenland Sea and surrounding regions: a coupled modelsimulation, Geophys. Res. Lett., 24, 1993–2011.
Enfield, D., A. M. Mesta-Nuñez, and P. Trimble (2001), The Atlantic multi-decadal oscillation and its relation to rainfall and river flows in the conti-nental US, Geophys. Res. Lett., 28, 2077–2080.
Folland, C. K., J. Knight, H. W. Linderholm, D. Fereday, S. Ineson, andJ. W. Hurrell (2009) The summer North Atlantic Oscillation: past, pres-ent, and future, J. Clim., 22, 1082–1103, doi:10.1175/2008JCLI2459.1.
Gamiz-Fortis, S. R., D. Pozo-Vasquez, R. M. Trigo, and Y. Castro-Diez(2008), Quantifying the predictability of winter river flow in Iberia. PartI: Interannual predictability, J. Clim., 21, 2484–2502, doi:10.1175/2007JCLI1774.1.
Goldenberg, S. B., C. W. Landsea, M. Mestas-Nuñez, and W. M. Gray(2001), The recent increase in Atlantic hurricane activity: Causes and im-plications, Science, 293, 474–479.
Gray, S. T., L. J. Graumlich, J. L. Betancourt, and G. T. Pederson (2004),A tree-ring based reconstruction of the Atlantic Multidecadal Oscillationsince 1567, Geophys. Res. Lett., 31, L12205, doi:10.1029/2004GL019932.
Higuchi, K., J. Huang, and A. Shabbar (1999), A wavelet characterization ofthe North Atlantic Ocean variation and its relationship to the North Atlan-tic sea surface temperature, Int. J. Climatol., 19, 1119–1129.
Hilmer, M., and T. Jung (2000), Evidence for a recent change in the link be-tween the North Atlantic Oscillation and Artic sea ice export, Geophys.Res. Lett., 27, 989–992.
Holman, I. P., M. Rivas-Casado, J. P. Bloomfield, and J. J. Gurdak (2011),Identifying non-stationary groundwater level response to North Atlanticocean-atmosphere teleconnection patterns using wavelet coherence,Hydro. J., 19, 1269–1278, doi:10.1111/j.1469-7610.2011.02419.x.
Hurrell, J. W. (1995), Decadal trends in the North Atlantic Oscillation: Re-gional temperatures and precipitation, Science, 269, 676–679.
Hurrell, J. W., and C. Deser (2009), North Atlantic climate variability: therole of the North Atlantic Oscillation, J. Mar. Syst., 78, 28–41,doi:10.1016/j.jmarsys.2008.11.026.
Jansen, E., et al. (2007), Palaeoclimate, in Climate Change 2007: The Phys-ical Sciences Basis. Contribution of Working Group I to the Fourth As-sessment Report of the Intergovernmental Panel on Climate Change,edited by S. Solomon, D. Qin, M. Manning, Z. Chen, M. Marquis,K. B. Averyt, M. Tignor, and H. L. Miller, 433–497, Cambridge Univ.Press, Cambridge.
Jung, T., M. Hilmer, E. Ruprecht, S. Kleppek, S. Gulev, and O. Zolina(2003), Characteristics of the recent eastward shift of interannual NAOvariability, J. Clim., 16, 3371–3382, doi:10.1175/1520-0442(2003)016<3371:COTRES>2.0.CO;2.
Kendall, M. G. (1948), Rank Correlation Methods, 160pp., Charles Griffin,London, U. K..
Kingston, D. G., G. R. Mc Gregor, D. M. Hannah, and D. M. Lawler(2006), River flow teleconnections across the northern NorthAtlantic region, Geophys. Res. Lett., 33, L14705, doi:10.1029/2006GL026574.
Kingston, D. G., G. R. Mc Gregor, D. M. Hannah, and D. M. Lawler(2007), Large-scale climatic controls on New England River Flow,J. Hydrometeorol., 8, 367–379, doi:10.1175/JHM584.1.
Knight, J. R., C. K. Folland, and A. A. Scaife (2006), Climate impacts of theAtlantic Multidecadal Oscillation, Geophys. Res. Lett., 33, L17706,doi:10.1029/2006GL026242.
Kodera, K., and Y. Kuroda (2005), A possible mechanism of solar modula-tion of the spatial structure of the North Atlantic Oscillation, J. Geophys.Res., 101, D02111, doi:10.1029/2004JD005258.
Kushnir, Y., W. A. Robinson, I. Bladé, N. M. Hall, S. Peng, and R. Sutton(2002), Atmospheric GCM response to extratropical SST anomalies: Syn-thesis and evaluation, J. Clim., 15, 2233–2256, doi:10.1175/1520-0442(2002)015<2233:AGRTES>2.0.CO;2.
Labat, D. (2005), Recent advances in wavelet analyses: Part I. Areview of concepts, J. Hydrol., 314, 275–288, doi:10.1016/j.jhydrol.2005.04.003.
Luterbacher, J., C. Schmutz, D. Gyalistras, E. Xoplaki, and H. Wanner,(1999), Reconstruction of monthly NAO and EU indices back to AD1675, Geophys. Res. Lett., 26, 2745–2748.
Luterbacher, J., E. Xoplaki, D. Dietrich, R. Rickly, J. Jacobeit, C. Beck,D. Gyalistras, C. Schmutz, and H. Wanner (2002), Reconstruction ofsea level pressure fields over the eastern north Atlantic and Europe backto 1500, Clim. Dyn., 18, 545–561, doi:10.1007/s00382-001-0196-6.
Luterbacher, J., D. Dietrich, E. Xoplaki, M. Grosjean, and H. Wanner(2004), European seasonal and annual temperature variability, trendsand extremes since 1500, Science, 303, 1499–1503, doi:10.1126/science.1093877.
Manley, G. (1974), Central England temperature: Monthly means 1659 to1973, Q. J. R. Meteorol. Soc., 100, 389–405.
Mann, H. B. (1945), Non-parametric test against trend, Econometrica, 13,245–259.
Mann, M. E., J. Park, and R. S. Bradley (1995), Global interdecadal andcentury-scale climate oscillations during the past five centuries, Nature,378, 266–270.
Maraun, D. (2006), What can we learn from climate data? Methods for fluc-tuation time/scale and phase analysis, PhD thesis, Univ. of Postdam, Pots-dam, Germany.
Massei, N., A. Durand, J. Deloffre, J. P. Dupont, D. Valdes, and B. Laignel(2007), Investigating possible links between the North Atlantic Oscilla-tion and rainfall variability in northwestern France over the past 35 years,J. Geophys. Res., 112, D09121, doi:10.1029/2005JD07000.
Massei, N., B. Laignel, J. Deloffre, J. Mesquita, A. Motelay, R. Lafite, andA. Durand (2010), Long-term hydrological changes of the Seine Riverflow (France) and their relations to the North Atlantic Oscillation overthe period 1950–2008, Int. J. Climatol., 30, 2146–2154, doi:10.1002/joc.2022.
Mitchell, T. D., and P. D. Jones (2005), An improved method ofconstructing database of monthly climate observations and associatedhigh-resolution grids, Int. J. Climatol., 25, 693–712, doi:10.1002/joc.1181.
Mokhov, I. I., A. V. Eliseev, D. Handorf, V. K. Petukhov, K. Dethloff, A.Weisheimer, and D. V. Khvrost’yanov (2000), North Atlantic Oscillation:Diagnosis and simulation of decadal variability and its long-period evolu-tion, Izv., Atmos. Oceanic Phys., 36, 555–565.
Osborn T. J. (2004), Simulating the winter North Atlantic Oscillation: Theroles of internal variability and greenhouse gas forcing, Clim. Dyn., 22,605–623, doi:10.1007/s00382-004-0405-1.
Parker, D., C. K. Folland, A.A. Scaife, J. R. Knight, A. Colman, P. Baines, andD. Dong (2007), Decadal to multidecadal variability and the climate changebackground, J. Geophys. Res., 112, D18115, doi:10.1029/2007JD008411.
Parry, M. L. (2000), Assessment of the Potential Effects and Adaptations forClimate Change in Europe: The Europe ACACIA Project, Jackson Envi-ronment Institute, Univ. of East Anglia, Norwich, U. K.
Pauling, A., J. Luterbacher, C. Casty, and H. Wanner (2006), 500 years ofgridded high resolution precipitations over Europe and the connectionto large-scale circulation, Clim. Dyn., 26, 387–405, doi:10.1007/s00382-005-0090-8.
Peterson, T. C., and R. S. Vose (1997), An overview of the Global Histor-ical Climatology Network temperature database, Bull. Am. Meteorol.Soc., 78, 2837–2849.
Preisendorfer, R. W. (1988), Principal Component Analysis in Meteorologyand Oceanography, Elsevier, Amsterdam.
Rodwell, M. J., D. P. Rowell, and C. K. Folland (1999), Oceanic forcing ofwintertime North Atlantic Oscillation and European climate, Nature, 398,320–323.
Rousseau, D. (2009), Les températures mensuelles en région parisienne de1676 à 2008, Meteorologie, 67, 43–55, doi:10.4267/2042/30038.
Schelsinger, M. E., and N. Ramankutty (1994), An oscillation in the globalclimate system of period 65–75 years, Science, 367, 723–726.
Schmutz, C., J. Luterbacher, D. Gyalistras, E. Xoplaki, and H. Wanner(2000), Can we trust proxy-based NAO index reconstructions?, Geophys.Res. Lett., 27, 1135–1138.
Slimani, S., N. Massei, J. Mesquita, D. Valdès, M. Fournier, B. Laignel, andJ. P. Dupont (2009), Combined climatic and geological forcings on thespatio-temporal variability of piezometric levels in the chalk aquifer ofUpper Normandy (France) at pluridecennal scale, Hydrogeol. J., 17,1823–1832, doi:10.1007/s10040-009-0488-1.
Slonosky, V. C. (2002), Wet winters, dry summers? Three centuries of pre-cipitation data from Paris, Geophys. Res. Lett., 2919, 1895, doi:10.1029/2001GL014302.
Slonosky, V. C., P. D. Jones, and T. D. Davies (2000), Variability of thesurface atmospheric circulation over Europe, 1774–1995, Int. J.Climatol., 20, 1875–1897.
Sutton, R. T., and B. Dong (2012), Atlantic Ocean influence on a shift inEuropean climate in the 1990s, Nat. Geosci., 5, 788–792, doi:10.1038/ngeo1595117.
Sutton, R. T., and D. L. R. Hodson (2005), Atlantic Ocean forcing of NorthAmerican and European summer climate, Science, 309, 115–118,doi:10.1126/science.1109496.
Tabony, R. C. (1980), A set of homogeneous European rainfall series, Met.O.13 Branch Memorandum No. 104, Meteorological Office, Bracknell.
Tabony, R. C. (1981), A principal component and spectral analysis ofEuropean rainfall, J. Climatol., 1, 283–294.
DIEPPOIS ET AL.: N ATLANTIC AND NW EUROPEAN CLIMATE
4371

Thompson R. (1999), A time-series analysis of the changing seasonalityof precipitation in the British Isles and neighbouring areas, J. Hydrol.,224, 169–183.
Thompson, R., and R. M. Clark (2008), Is spring starting earlier?, Holocene,18, 95–104, doi:10.1177/0959683607085599.
Torrence, C., and G. P. Compo (1998), A practical guide to wavelet analy-sis, Bull. Am. Meteorol. Soc., 79, 61–78.
Torrence, C., and P. Webster (1999), Interdecadal changes in the ENSO-Monsoon system, J. Clim., 12, 2679–2690.
van der Schrier, G., and S. L. Weber (2009), The Gulf Stream and Atlanticsea-surface temperatures in AD 1790–1825, Int. J. Climatol., 30,1747–1763, doi:10.1002/joc.2027.
van Loon, H., J. Brown, and R. F. Milliff (2012), Trends in sunspots andNorth Atlantic sea level pressure, J. Geophys. Res., 17, D07106,doi:10.1029/2012JD017502.
Wanner, H., S. Brönnimann, C. Casty, D. Gyalistras, J. Luterbacher,C. Schmutz, D. B. Stephenson, and E. Xoplaki (2001), North AtlanticOscillation—Concepts and studies, Surv. Geophys., 22, 321–382.
Zhang, R., T. L. Delworth, and I. M. Held (2007), Can the Atlantic drive theobserved multidecadal variability in the Northern Hemisphere mean tem-perature? Geophys. Res. Lett., 34, L02709, doi:10.1029/2006GL028683.
DIEPPOIS ET AL.: N ATLANTIC AND NW EUROPEAN CLIMATE
4372