39 fournier
DESCRIPTION
okTRANSCRIPT

Slope Stability 2013 – P.M. Dight (ed) © 2013 Australian Centre for Geomechanics, Perth, ISBN 978-0-9870937-5-2
Slope Stability 2013, Brisbane, Australia 595
M. Fournier Knight Piésold Ltd., Canada
R. Mercer Knight Piésold Ltd., Canada
D. Yang Knight Piésold Ltd., Canada
J. Miller KGHM Inc., USA
The Robinson Mine is a large porphyry copper deposit located approximately 400 km north of Las Vegas in central Nevada. Large scale open pit mining operations started in 1908, but ceased in 1978. The property was re-opened in 2008 and the mine currently consists of five open pits. Since 2012, the mine has been operated by KGHM Inc. with a focus on expanding and deepening the Ruth pit. The pit walls were largely developed with 15 m high benches and an inter-ramp angle of 36°. This wall configuration was largely based on a pit geotechnical study in the early 1990s.
In 2011, excessive slope deformation and wall failures were observed along the 300 m high north wall. The deformations were primarily within the Chainman Shale, which forms the lower half of the wall. Initial deformation control and risk mitigation efforts focused on surficial flattening of the deforming materials and on the installation of a slope monitoring radar system. By December, the mine was forced to discontinue mining in the area, which has had a significant impact on the mine plan. Preliminary back−analyses in early 2012, suggested that a circular-type failure was occurring within the highly altered and weak shale and that this unit appeared to be degrading over time The back-analyses also suggested considerably lower strengths for this unit than what was being utilised in the existing pit slope design. A geotechnical drilling program was undertaken to better understand the rock mass characteristics at these depths and to support updated slope recommendations.
The results of the drilling program suggested high core recoveries in the shale and the rhyolite, even though many sections of the drill core could be crushed by hand. The rock mass was classified using the RMR system, with low ratings assigned to the low quality intervals via adjustments derived from GSI mapping of available surface exposures. Triaxial and direct shear laboratory testing was also taken on the soil-like materials. The results of this work suggested that the strategically employed RMR classification, coupled with a Hoek–Brown model, may not adequately capture the strength condition for a rock mass that varies spatially between regions of intact rock and soil-like materials. In general, the back-analysis models show considerable deviation from what would be considered as the expected condition, given the rock mass characterisation and laboratory testing available. The incorporation of a disturbance zone into the slope stability analyses overcame some of these limitations and resulted in a better match to observed slope performance.
The Robinson Nevada Mining Company (RNMC) is currently operating the Robinson Mine, which is porphyry copper deposit located 400 km northwest of Las Vegas, Nevada (Figure 1). The Ruth pit has been mined during several different time periods by several different companies, and included underground workings. The pit was eventually closed in 1978 with a slope height of approximately 240 m and maximum inter-ramp and overall slope angles of approximately 40 and 33°, respectively. Although limited information is available, historic information suggests that previous operators did not encounter any large scale slope failures within the pit, but stability was impacted by considerable ravelling after closure (Sjöberg, 1996). In

Characterisation and stability modelling in weak rock masses of the Robinson Mine M. Fournier et al.
596 Slope Stability 2013, Brisbane, Australia
2008, RNMC commenced mining operations at the Ruth pit, beginning with the removal of tailings from the pit bottom that had been placed by previous operators. Since 2012, the mine has been operated by KGHM Inc. with a focus on expanding and deepening this pit.
Excessive slope movement and creeping style slope failures were encountered along the north wall of the Ruth pit in late 2011. The failure area is comprised of several major faults and is primarily within the historically problematic Chainman Shale geological unit. The faults are moderately dipping, locally weak and do not form sliding surfaces; however, they may provide side release surfaces for portions of the failures. The displacements along this part of the wall eventually impacted the integrity of the Ramp (Figure 2) and RNMC was forced to put mining operations in this area on hold pending the results of a geotechnical evaluation (initiated in January 2012).
Ramp
Chainman Shale
Rhyolite and Chainman
Shale
Porphyry and Chainman
Shale

Numerical analysis
Slope Stability 2013, Brisbane, Australia 597
The geotechnical assessment of the north wall was completed by Knight Piésold Ltd. (KPL) and included:
A review of existing geological, hydrogeological, and geotechnical information.
Site inspections.
A review of prism and slope radar monitoring data with respect to mining activity.
A geotechnical site investigation and instrumentation program.
Laboratory rock strength and index testing.
A stability back-analyses of the north wall.
This paper discusses the results of the geotechnical assessment and some of the rock mass characterisation and slope stability modelling challenges associated with the weak rock masses encountered along the north wall of the Ruth pit.
The Ruth pit is part of the structurally complex Ruth porphyry copper deposit, which forms a west-trending zone of alteration and mineralisation that is approximately 13 km long and 300 to 450 m wide. A series of thrust events have fragmented this once continuous sulphide system. The alteration and mineralisation in the area is centered on a 25 degree west-dipping quartz monzonite porphyry intrusion that cuts through existing shale, sandstone and limestone deposits.
Several stages of alteration and mineralisation have occurred within the deposit during extensive fracturing by magmatic hydrothermal fluids. Following the main stage of copper mineralisation, meteoric waters resulted in pervasive argillisation. Fragmentation by normal faulting in the mid-tertiary was followed by uplift, oxidation, erosion and enrichment (Westra, 1982).
The failure area along the north wall of the Ruth pit is within the Porphyry, Rhyolite and Chainman Shale units (Figure 3), with multiple alteration types throughout the slope. The slope angle from the haul road (El. 1,990 m) to the crest is approximately 30°. It should be noted that the boundaries of these units are not as clear as the geological model suggests, and considerable geological variation has been observed over short distances within drill holes. In general, these units are poor quality rock masses with low UCS strengths. Prior to the initiation of the recent site investigation program, the available rock mass properties dated from the 1970s and were limited to regions of the slope that are above the failure area. In addition, the source of much of the original data is no longer available. A typical photo of weak zones within the rock mass is included as Figure 4.

Characterisation and stability modelling in weak rock masses of the Robinson Mine M. Fournier et al.
598 Slope Stability 2013, Brisbane, Australia
Recent mining within the north wall of the Ruth pit has been using an inter-ramp angle of 36°. By 2011, the slope height was approaching 300 m and the north wall started to experience a number of failures and elevated displacement rates. A brief chronology of the failures is provided below:
Q1 2011 – Toe heaving, tension cracking and slope displacements were observed along the upper north wall during the removal of the tailings from the bottom of the Ruth pit. A slope failure eventually impacted a portion of the upper north haul road. The connection between mining activities within the pit and this particular failure is not clear. RNMC managed to re-connect the upper ramp, but slope deformation continued in this area. The upper north haul road was eventually mined out.
Q3 2011 – Slope failures below the lower north wall occurred again in August 2011, when active mining was conducted along the lower north haul road and along the bottom of the north wall. Ongoing deformation resulted in another slope failure in the same general area in September, which eventually stopped mining operations at the bottom of the north wall in October.
Q4 2011 – Accelerated slope deformations were detected along the upper north wall in December 2011 during a ramp re-grading program along the lower north haul road. The materials within the Chainman Shale unit degraded considerably during this time due to a combination of slope deformation, exposure and continued mining activity.
Figure 5 shows an overview photo of the north wall of the Ruth pit as of July 2012. The north wall has been generally stable since mining was put on hold in February 2012.
In an effort to better understand and manage the slope displacements along the north wall, RNMC set up a number of monitoring prisms along the critical zones of the Ruth pit. The prism survey data was reviewed by KPL along with the monthly mining plans and topographies from 2011. The instrumentation data suggested the following:
Displacements in the north wall appear to be generally confined to the Chainman Shale and do not appear to extend much west of the Minnesota Fault into the Rhyolite.
The high displacements rates were confined to elevation below the 2,090 m level.

Numerical analysis
Slope Stability 2013, Brisbane, Australia 599
There are two separate movement zones within the slope and the haul road is likely acting as a buttress for the upper failure.
The observed displacement tends to occur directly above active mining and the displacement rates increase soon after the start of mining activities. Displacements generally persist during mining and for some time after mining stops.
For a period of time, the slope was successfully mined despite periods of elevated displacements.
Limited information is available on the hydrogeological conditions in the north wall. The closest monitoring wells, which are no longer active, are located some distance behind the crest of the north wall. The historic monitoring records indicate a ground water level between the elevations of 1920 and 1980 m, which is below the upper failure zone in Figure 3. A draft pore pressure modelling report issued by Schlumberger in May 2011 (Schlumberger, 2011), incorporated information from a multi-level piezometer located 200 m north of the pit wall and suggests that the current water levels are below the current pit bottom. This conclusion is supported by wall observations, which show no signs of groundwater levels being in the range of the earlier assessments.
In early 2012, a preliminary back-analysis was completed using all the geotechnical information that was available at that time. The rock mass strength assumptions and initial slope stability results are discussed in this section.
The existing rock mass data for the Ruth pit is summarised below:
1970s – A series of investigations were completed during this time, which included geology mapping, discontinuity mapping and laboratory testing (Broadbent, 1972). RQD and RMR estimates were also made in a number of drillholes. UCS estimates ranged between 0.8 and 112 MPa. Triaxial tests suggested friction angles between 33 and 53° (with 0.9 to 4.1 MPa of cohesion) for the Rhyolite and between 30 and 45° (with 1.7 to 11 MPa of cohesion) for the
Characterisation and stability modelling in weak rock masses of the Robinson Mine M. Fournier et al.
600 Slope Stability 2013, Brisbane, Australia
Chainman Shale. Broadbent (1972) noted difficulties with samples breaking during handling and preparation. He also noted that there appeared to be only a weak connection between the geology and rock mass quality, with large variations in strength being more closely associated with the alteration type. Montmorillonite clay was found to be prevalent, particularly in the altered rhyolite, where montmorillonite contents average 20% and were estimated to be as high as 60%. Back-analyses of a single 60 m high failure somewhere along the north wall indicated lower strengths than suggested by the results of the laboratory testing. Historical slope failures at this time occurred at inter-ramp angles between 30 and 37°. The pit floor at this time was located at 2,070 m, which is close to the top of the current failure area.
1990s – Additional samples underwent laboratory strength testing (Call and Nicholas, 1991) during this time. Geotechnical drilling was limited to the west and southwest walls, which are stable areas outside the volume of interest and do not contain the Chainman Shale unit. However, these observations and laboratory strengths may have formed the basis for the current pit design. Call and Nicholas (1991) noted that the rock strength and shear strength properties are not consistent with formation or lithology, but rather are most closely associated with the type and intensity of alteration. Reported rock mass properties are as follows (Call and Nicholas, 1991):
○ Porphyry: Average UCS of 30 MPa, with an estimated friction angle of 48° (4 MPa of cohesion).
○ Limestone: Average UCS of 55 MPa, with an estimated friction angle of 48° (8 MPa cohesion).
○ Rhyolite: Average UCS of 7.9 MPa, with an estimated friction angle of 36.5° (0.06 MPa cohesion).
○ Residual fracture strengths with an estimated friction angle of 19 to 30° (0 to 0.09 MPa cohesion).
Due to the heavily fractured, weak rock mass, structurally controlled failure is considered unlikely. KPL (and Call and Nicholas, 1991) did not undertake any structural measurements of benches due to limited access. Broadbent (1971) also concluded that rock jointing is not a significant contributor to the north slope failures and that a redesign based on kinematic analyses of joints would not be appropriate. Observations along the current north wall suggest that the bedding within Chainman Shale is highly irregular and distorted and that it does not tend to form weakness planes with any persistence.
The preliminary back-analyses were completed immediately after the initial site visit in early 2012 to support updated slope recommendations. These analyses were completed prior to the start of the site investigations. In this case, the Chainman Shale was modelled as a cohesionless, Mohr–Coulomb material. This was felt to be a reasonable assumption given the information available, the weak, soil-like material exposed in the slope and the deformation history of the area. The depth of failure was not known, but for the purposes of the completed analyses it was assumed to be at least 30 m behind the wall.
A typical slope section through both failed areas was selected for limit equilibrium slope stability analyses (similar to Figure 3). Different modelling scenarios were run to back calculate the strength parameters for the north wall for limit equilibrium conditions (i.e. at a Factor of Safety (FS) of 1.0). The modelling results
and back-calculated friction angles () for the Chainman Shale unit are summarised in Table 1.
Historic data prior to RNMC’s involvement with the project was also reviewed during this time. A stable 1985 Ruth pit slope configuration was also analysed and resulted in a minimum friction angle in the range of 26 to 31°. This result is generally consistent with the back-analysis results for the 2011 configuration of the north wall.
Numerical analysis
Slope Stability 2013, Brisbane, Australia 601
Failure Area Slope Profile Friction, ɸ’ (°) Cohesion, c’ (kPa) FS
Slope above Lower Haul Road February 2012 – NE1 25.0 0 1.0
February 2012 – NE2 25.0 0 1.0
November 2011 25.0 0 1.0
Slope below Lower Haul Road November 2011 26.5 0 1.0
It was concluded that the friction angle of the Chainman Shale and Rhyolite units were likely between 25 and 30°, and that the strengths may be lower in portions of the slope that have undergone progressive deformation. It should be noted that the back-analysed strengths are lower than those presented by Broadbent (1972) and Call and Nicholas (1991).
Based on the review of the existing data and the results of the preliminary back-analyses, it was determined that additional rock mass data was required to better understand current slope performance and provide the mine with guidance on future mining strategies and achievable slope geometries. As such, a site investigation was carried out along the north wall with the general objective of better characterising the Chainman Shale, Rhyolite and Porphyry.
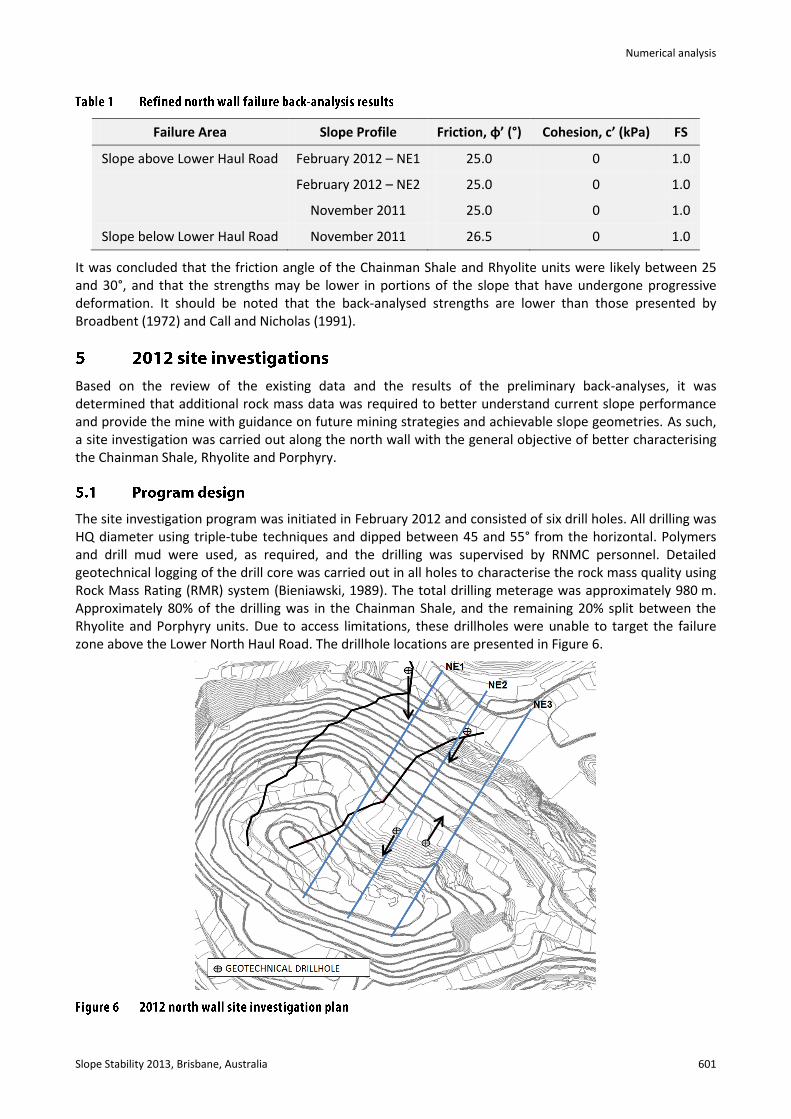
The site investigation program was initiated in February 2012 and consisted of six drill holes. All drilling was HQ diameter using triple-tube techniques and dipped between 45 and 55° from the horizontal. Polymers and drill mud were used, as required, and the drilling was supervised by RNMC personnel. Detailed geotechnical logging of the drill core was carried out in all holes to characterise the rock mass quality using Rock Mass Rating (RMR) system (Bieniawski, 1989). The total drilling meterage was approximately 980 m. Approximately 80% of the drilling was in the Chainman Shale, and the remaining 20% split between the Rhyolite and Porphyry units. Due to access limitations, these drillholes were unable to target the failure zone above the Lower North Haul Road. The drillhole locations are presented in Figure 6.

Characterisation and stability modelling in weak rock masses of the Robinson Mine M. Fournier et al.
602 Slope Stability 2013, Brisbane, Australia
A number of logging issues were encountered when trying to characterise the weak rocks along the north wall. These issues included:
High core recoveries and RQDs for a material that could often be crushed by hand (see photo on Figure 7).
Intact core densely populated with veins and healed fractures (in all units encountered including the shale).
Intact core breaking along the healed fractures into what amounted to clay coated gravels.
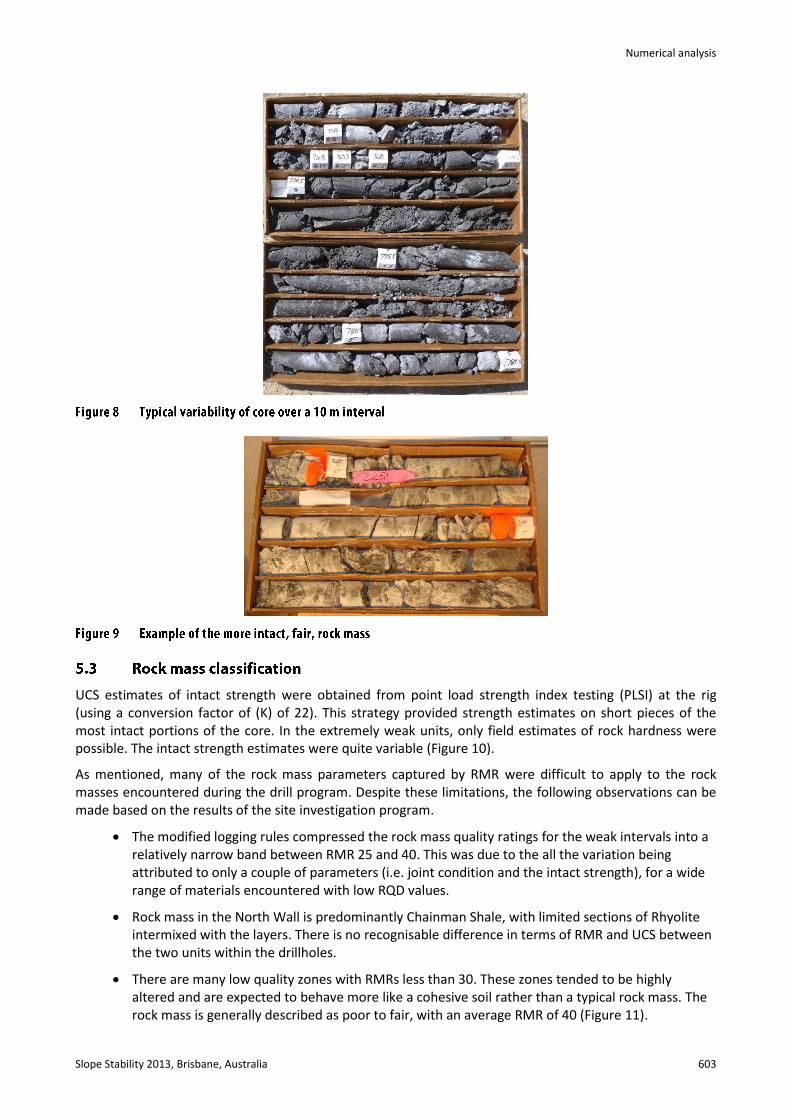
Strong variations in rock mass characteristics. It was not uncommon to see heavily altered clay material, rubble sections and seemingly intact rock all within the same run (Figure 8).
It became apparent early in the program that the RMR system was not easily applied to some of the low quality material being encountered. In order to better account for some of the characteristics of this weak rock mass, the Geological Strength Index (GSI) system (Hoek et al., 2002) was applied to limited bench mapping and the results of this assessment used to adjust some of the RMR values that were being utilised during logging. The bench mapping suggested that a significant proportion of the rock mass was in the very blocky to disturbed/seamy to disintegrated categories with fair to poor surface conditions. The adjustments made to KPLs typical RMR logging strategies included:
Materials that can be broken by hand and/or knife pressure are considered to have zero RQD (not sound core as indicated in Deere (1988)). For these same intervals a nominal joint spacing was applied, even if 100% recovery has occurred, resulting in the minimum applicable spacing rating of 5 in the RMR system.
These zones of weak materials, although not a discontinuity, were treated as a single discontinuity as far as joint condition ratings apply when assigning RMR for any interval.
The selection of weathering/alteration and infill types was dependent upon the characteristics of the material, including materials that are highly clay altered, clay coated gravels, clean gravels, intact rock that breaks under hand pressure, etc.
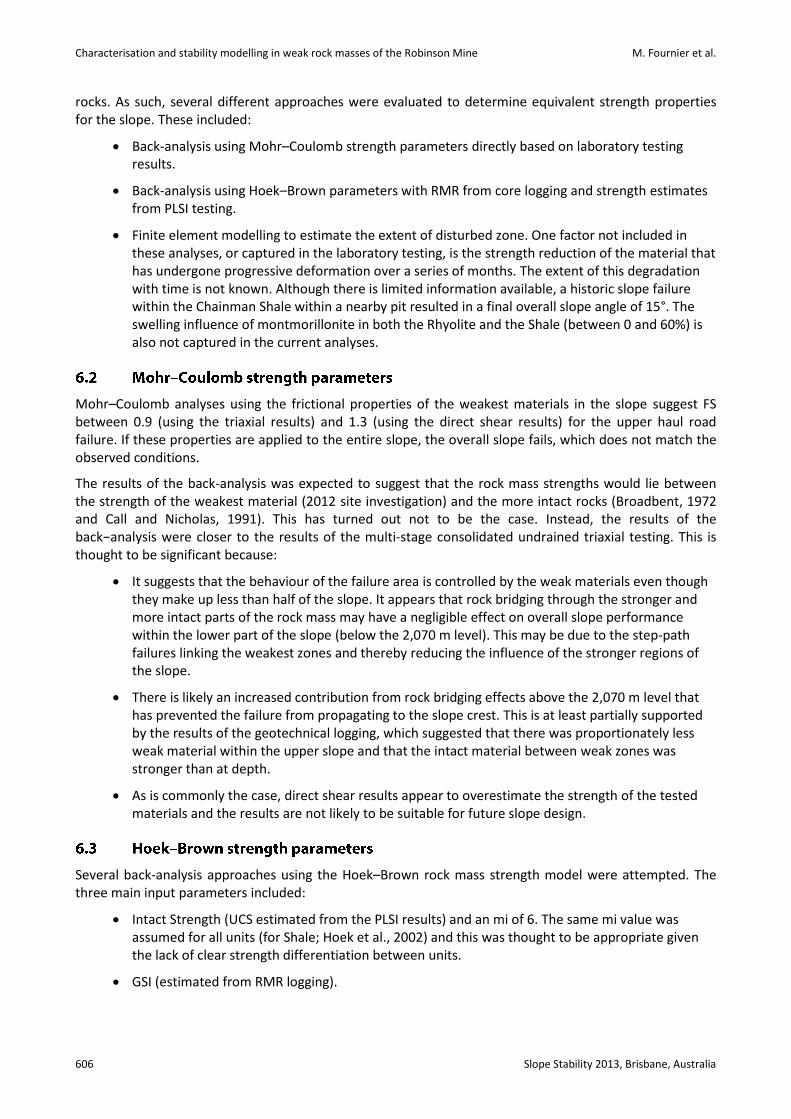
Application of these rules allowed the weakest rock masses to have lower quality estimates than the more heavily fractured, but stronger regions of the rock mass. Examples of these types of variations are seen in the photo included as Figure 9. With these adjustments, the rock mass quality values were in the range expected based on the GSI estimates from slope observations. Even with these adjustments, the loggers still had to exercise considerable judgement when characterising transitional areas between the highly altered clay materials and the heavily fractured intact rock.
Numerical analysis
Slope Stability 2013, Brisbane, Australia 603
UCS estimates of intact strength were obtained from point load strength index testing (PLSI) at the rig (using a conversion factor of (K) of 22). This strategy provided strength estimates on short pieces of the most intact portions of the core. In the extremely weak units, only field estimates of rock hardness were possible. The intact strength estimates were quite variable (Figure 10).
As mentioned, many of the rock mass parameters captured by RMR were difficult to apply to the rock masses encountered during the drill program. Despite these limitations, the following observations can be made based on the results of the site investigation program.
The modified logging rules compressed the rock mass quality ratings for the weak intervals into a relatively narrow band between RMR 25 and 40. This was due to the all the variation being attributed to only a couple of parameters (i.e. joint condition and the intact strength), for a wide range of materials encountered with low RQD values.
Rock mass in the North Wall is predominantly Chainman Shale, with limited sections of Rhyolite intermixed with the layers. There is no recognisable difference in terms of RMR and UCS between the two units within the drillholes.
There are many low quality zones with RMRs less than 30. These zones tended to be highly altered and are expected to behave more like a cohesive soil rather than a typical rock mass. The rock mass is generally described as poor to fair, with an average RMR of 40 (Figure 11).

Characterisation and stability modelling in weak rock masses of the Robinson Mine M. Fournier et al.
604 Slope Stability 2013, Brisbane, Australia
Despite better rock mass performance above 2,070 m, there is not a significant difference between the RMR values above and below the 2,070 m level. The UCS does, however, appear to decrease with depth. The estimated mean UCS values above and below the 2,070 m level are approximately 30 and 15 MPa, respectively. This trend is observed from data within similar geological units (i.e. a complicated combination of the Rhyolite and the Chainman Shale).
The point load estimate of UCS and field estimates of UCS (Figure 12) suggest that a substantial proportion of the rock has a UCS less than 10 MPa. The stronger patches are expected to behave like rock bridges between the weaker zones. The stronger patches above the 2,070 m level appear to be stronger than those below the 2,070 m level.

Numerical analysis
Slope Stability 2013, Brisbane, Australia 605
As mentioned, one disadvantage of the logging approach adopted, was the challenge associated with capturing some of the variations in rock mass quality below an RMR of approximately 35. As such, the average rock mass below the 2,070 m level may be at the lower limit of where the Hoek–Brown applies (intact strength less than 15 MPa and GSI below 30, according to Brown (2008)). Hoek et al. (2005) also notes that the correlation between RMR to GSI may not be appropriate for very weak and heterogeneous rock masses.
Laboratory testing focused on the failure area and all the samples were collected below the 2,070 m level. Obtaining laboratory UCS samples was a challenge, due to variable core strength, difficulties obtaining pieces long enough for testing, and sample breakage during transport to the lab. When tested, many of the intact specimens were heavily veined and had a tendency towards a step-path failure through both the veins and the intact rock bridges.
The heavily altered, low quality, soil-like materials are expected to control the performance of the slope. As such, samples from these areas were sent to the laboratory for soil strength testing. Multi-stage consolidated undrained triaxial testing was undertaken on four of the most competent samples. The results from these tests suggested effective friction angles between 19 to 27° and cohesions between 24 to 65 kPa. Two undisturbed samples were tested as consolidated drained direct shear tests and five of the most disturbed samples were tested as remoulded direct shear tests. The undisturbed and disturbed (remoulded) direct shear test results were similar with peak friction angles ranging between 28 and 35° and with cohesions between 19 and 38 kPa. In all of the direct shear tests, the residual friction angles were very similar to the peak strengths. The higher friction angles obtained from the direct shear tests may be due to the characteristics of the soil. At the time, soil classification tests were not undertaken.
It should be noted that these Mohr–Coulomb properties are in the lower range of those reported by Broadbent (1972) and Call and Nicholas (1991), which focused on higher elevations and on more intact rock. Although the failures are not thought to be dominated by shearing along individual bedding planes due to the distorted nature of the rock mass, Call and Nicholas (1991) suggests that the average shear strength of rock fractures in the Ruth pit is 25° with zero cohesion.
The preliminary stability analyses were updated based on the results of the 2012 site investigation program. The main focus of the analyses was to determine meaningful rock properties on which to base the design of the north slope. Due to the highly variable nature of the rock mass (and the associated limitations of the geological model), it is not possible to delineate and model individual zones of weaker or stronger
Characterisation and stability modelling in weak rock masses of the Robinson Mine M. Fournier et al.
606 Slope Stability 2013, Brisbane, Australia
rocks. As such, several different approaches were evaluated to determine equivalent strength properties for the slope. These included:
Back-analysis using Mohr–Coulomb strength parameters directly based on laboratory testing results.
Back-analysis using Hoek–Brown parameters with RMR from core logging and strength estimates from PLSI testing.
Finite element modelling to estimate the extent of disturbed zone. One factor not included in these analyses, or captured in the laboratory testing, is the strength reduction of the material that has undergone progressive deformation over a series of months. The extent of this degradation with time is not known. Although there is limited information available, a historic slope failure within the Chainman Shale within a nearby pit resulted in a final overall slope angle of 15°. The swelling influence of montmorillonite in both the Rhyolite and the Shale (between 0 and 60%) is also not captured in the current analyses.
Mohr–Coulomb analyses using the frictional properties of the weakest materials in the slope suggest FS between 0.9 (using the triaxial results) and 1.3 (using the direct shear results) for the upper haul road failure. If these properties are applied to the entire slope, the overall slope fails, which does not match the observed conditions.
The results of the back-analysis was expected to suggest that the rock mass strengths would lie between the strength of the weakest material (2012 site investigation) and the more intact rocks (Broadbent, 1972 and Call and Nicholas, 1991). This has turned out not to be the case. Instead, the results of the back−analysis were closer to the results of the multi-stage consolidated undrained triaxial testing. This is thought to be significant because:
It suggests that the behaviour of the failure area is controlled by the weak materials even though they make up less than half of the slope. It appears that rock bridging through the stronger and more intact parts of the rock mass may have a negligible effect on overall slope performance within the lower part of the slope (below the 2,070 m level). This may be due to the step-path failures linking the weakest zones and thereby reducing the influence of the stronger regions of the slope.
There is likely an increased contribution from rock bridging effects above the 2,070 m level that has prevented the failure from propagating to the slope crest. This is at least partially supported by the results of the geotechnical logging, which suggested that there was proportionately less weak material within the upper slope and that the intact material between weak zones was stronger than at depth.
As is commonly the case, direct shear results appear to overestimate the strength of the tested materials and the results are not likely to be suitable for future slope design.
Several back-analysis approaches using the Hoek–Brown rock mass strength model were attempted. The three main input parameters included:
Intact Strength (UCS estimated from the PLSI results) and an mi of 6. The same mi value was assumed for all units (for Shale; Hoek et al., 2002) and this was thought to be appropriate given the lack of clear strength differentiation between units.
GSI (estimated from RMR logging).

Numerical analysis
Slope Stability 2013, Brisbane, Australia 607
Disturbance factor (D), ranges estimated from experience and recommendations by Hoek et al. (2005), Brown (2008), and Hoek and Karzulovic (2000).
Varying these three inputs resulted in several non-unique solutions, depending on the combination utilised.
A two material model was created to account for the strength differences above and below the 2,070 m level. The process followed was first to determine the FS = 1 criteria for the upper slope failure and then apply that same strength assignment strategy to the entire slope. Three approaches were attempted.
Approach 1: The disturbance factor was first analysed, for both materials with a GSI of 30. The UCS for the upper and lower slope was 30 and 15 MPa, respectively. The back-analysed failure required a disturbance factor of 0.9 for FS = 1 conditions. Applying this disturbance factor to the entire slope resulted in the prediction of overall slope failure, which is not consistent with the observed slope behaviour.
Approach 2: A fixed disturbance value of 0.7 was used and the GSI / UCS values varied for the material below the 2,070 m level. In this case, lower rock mass strength values were obtained than what would be considered representative from the geotechnical logging and the GSI assessment. Even with a much stronger rock mass above the 2,070 m, the results were a total slope failure, which is not consistent with the observed slope behaviour.
Approach 3: The strategy employed in approach 2 was also used for disturbance factor of zero, resulting in input parameters for GSI and UCS that were very low compared to the results of the site investigation (15 and 3.6 MPa, respectively). Even with a much stronger rock mass above the 2,070 m level, the results were a total slope failure, which is not consistent with the observed slope behaviour.
The entire slope was also modelled as a homogenous unit with a disturbance factor of zero. There are many non-unique solutions to this scenario for a FS = 1; however, in all cases the required UCS and GSI are lower than what would be considered appropriate parameters suggested from the site investigation.
The previous results suggest that by applying the Hoek–Brown model, the strength of the rock mass is underestimated for the disturbance factors utilised. This is supported by a comparison of the Hoek–Brown parameters and the laboratory testing results. For the D = 0.7 case (with a confining pressure set to the maximum normal stress in the slope), the derived Mohr–Coulomb (M–C) strength approximation for the rock mass in the failure area is nominally φ’ = 16° with 70 kPa of cohesion. These values are less than the weakest of the materials tested in triaxial testing and weaker than the estimated strength of the discontinuities from historical reports. Using undisturbed values also seems inappropriate, given the low GSI and UCS values that would be needed.
The initial analyses applied disturbed zone properties to the entire slope. Limiting the depth of disturbance and allowing it’s thickness to increase with depth, may be one way of utilising more realistic rock mass strength values and obtaining slope stability results that are more consistent with observed slope behaviour.
A finite element model was created for simplified geometry to estimate the depth of disturbance for the north wall. An elastic-perfectly plastic constitutive model was utilised using Hoek–Brown strength parameters, a simplified mining sequence and assumed far-field stress values. The finite element model was run with average material properties and a D = 0.
Figure 13 suggests that the slope below the 2,070 m level is expected to experience more displacement than the material above the 2,070 m level. This result appears to be due to a combination of depth and weaker intact strengths with depth.

Characterisation and stability modelling in weak rock masses of the Robinson Mine M. Fournier et al.
608 Slope Stability 2013, Brisbane, Australia
The sheared (failed) elements were used to estimate the boundary between the disturbed (D = 1) and undisturbed (D = 0) regions of the slope. Applying this boundary and re-running the limit equilibrium models resulted in the following general observations:
The FS of the critical surface is approximately 1.0 using more realistic GSI and UCS values in the range obtained from the site investigation. For example, the equivalent M–C strengths for D = 0 above the 2,070 m level are φ’ = 37° with 28 kPa of cohesion, which is approaching the strength range from triaxial tests reported by Broadbent (1972).
The failure surface is much closer to the observed failure in the lower part of the slope. As such, the entire slope is no longer the critical failure surface, which is consistent with observed slope behaviour.
A case study for a heterogeneous rock mass at the low end of the RMR/GSI scales has been summarised. The challenges associated with classifying the rock mass and back-analysing slope performance have been presented. This particular evaluation was based on historical rock mass data, subsurface investigations, laboratory testing, monitoring records, site observations and limit equilibrium and finite element analyses.
Some of the main findings are summarised below:
Historic laboratory testing and the site investigation results suggest that the rock mass strengths within the north wall are quite variable. The historic laboratory testing indicates higher strength properties than what is now thought to be typical of the north wall and these original assumptions were not verified as mining progressed within the pit. Applying these parameters to the entire slope, led to an aggressive design, progressive slope deformation, large scale slope instabilities and the stopping of mining activities in the area.
Limited bench access and the disturbed nature of the rock mass resulted in a diamond drilling program being undertaken to better define the rock mass properties.
A highly variable rock mass with significant regions at the low end of the quality scale, required adjustments to the interpretation of core logging data from the standard RMR logging approach. The applied logging adjustments allowed rock mass quality results to be obtained that are roughly equivalent to the expected GSI range logged from bench exposures. These adjustments also had some undesirable side effects, such as reducing the variability in the rock mass quality estimates.
The weak nature of much of the rock mass made it difficult to provide typical samples for laboratory testing. The laboratory strength results obtained were not thought to be representative of average in situ conditions. For example, estimates of frictional strength only exist for the weakest and strongest rock. There are also transition materials present (e.g. rubble

Numerical analysis
Slope Stability 2013, Brisbane, Australia 609
zones of clay cemented, gravel sized particles) that are in between these extremes and for which test results are difficult to obtain.
The observed variation in material properties cannot be easily modelled due to limited information on the location and extent of the weaker regions. As such, average material properties were utilised. This averaging process may not properly account for the role of factors such as the way that the failure propagates through the weak zones and the effects of rock bridging. These factors may, ultimately, be important to understanding the current slope performance, as well as to predicting achievable future slope geometries.
Initial attempts to utilise the results of the drill program and the laboratory test results to calibrate the slope stability models, resulted in either overall slope failure or the use of unrealistic UCS and GSI values.
Finite Element modelling was used to provide a quick estimate for the boundary between disturbed and undisturbed regions of the slope. The detrimental effects of progressive deformation and time dependent deterioration of weak rock mass was not incorporated into the analyses. Applying the disturbance zone from the finite element model to the limit equilibrium model, allowed more reasonable material properties to be utilised and resulted in a more realistic critical slip surfaces.
A more complex, displacement calibrated finite element model may provide greater insight into the performance of the current slope and may provide a better estimate of achievable slope geometries in the future. This model could be tied to existing slope stability radar and monitoring movement rates and could be updated as mining activity progresses.
The Ruth pit north wall instability was a collective work completed by Knight Piesold and RNMC’s geotechnical team. The authors thank RNMC for providing background information, historic data, and valuable insights to this study. This paper presents a small portion of the entire case study and further detailed assessment of this project will be carried out during ongoing pit operations. The permission of KGHM to publish the details of the Robinson Mine Ruth pit slope analysis is gratefully acknowledged.
Bieniawski, Z.T. (1989) Engineering rock mass classifications, A Complete Manual for Engineers and Geologists in Mining, Civil, and Petroleum Engineering, Wiley & Sons New York, 272 pages.
Broadbent, C.D. (1972) Ruth pit: Summary of Engineering Data and Analyses, Kennecott Copper Corporation Internal Report, Salt Lake City, Utah, USA.
Brown, E.T. (2008) Estimating the Mechanical Properties of Rock Masses, in Proceedings First Southern Hemisphere International Rock Mechanics Symposium (SHIRMS), Y. Potvin, J. Carter, A. Dyskin and R. Jeffrey (eds), Vol. 1 – Mining and Civil, 16−19 September 2008, Perth, Australia, Australian Centre for Geomechanics, Perth, pp. 3−22.
Call and Nicholas Inc. (1991) Robinson Mining Limited Partnership: Pit Slope Recommendations, Company Report. Deere, D.U. and Deere, D.W. (1988) The Rock Quality Designation (RQD) Index in Practice, Rock Classification Systems for
Engineering Purposes – ASTM STP 984, American Society of Testing and Materials, Philadelphia, pp. 91–101. Hoek, E., Carranza-Torres, C. and Corkum, B. (2002) Hoek–Brown criterion – 2002 edition, in Proceedings 5th American Rock
Mechanics Symposium and the 17th Tunneling Association of Canada Conference, R. Hammah (ed), 7–10 July 2002, Toronto, Canada, pp. 267–273.
Hoek, E. and Karzulovic, A. (2000) Rock Mass properties for surface mines, In Slope Stability in Surface Mining, W.A. Hustrulid, M.K. McCarter and D.J.A. van Zyl (eds), Littleton, USA, Society for Mining, Metallurgical and Exploration (SME), pp. 59–70.
Hoek, E., Marinos, P. and Marinos, V. (2005) The geological strength index: applications and limitations, Bulletin Engineering Geology and Environment, Vol. 64, pp. 55–65.
Schlumberger (2011) Technical Memorandum: Draft – Ruth pit pore pressure modelling results, Reno, Nevada, 10 p. Sjöberg, J. (1996) Large scale slope stability in open pit mining: a review, technical report 1196:10T, Luleå University, Sweden,
229 p. Westra, G. (1982) Alteration and mineralization in the Ruth porphyry copper deposit near Ely, Nevada, Economic Geology, Vol. 77,
pp. 950–970.

Characterisation and stability modelling in weak rock masses of the Robinson Mine M. Fournier et al.
610 Slope Stability 2013, Brisbane, Australia