bass anglers information team 2016 annual report fishing... · winning weight data was added in...
TRANSCRIPT

2016 Annual Report Bass Anglers Information Team
64 North Union Street, Suite 551, Montgomery, Alabama 36130

B.A.I.T. Bass Anglers Information Team
2016
Annual Report
By
Kyle Bolton
Fisheries Biologist
Division of Wildlife and Freshwater Fisheries
Alabama Department of Conservation and Natural Resources
Funded in part by the Federal Aid to Sport Fish Restoration Program
Alabama DJ/WB Project F-38

FISHERIES SECTION OFFICES
MONTGOMERY
Nick Nichols, Chief of Fisheries
Chris Greene, Asst. Chief of Fisheries
Damon Abernethy, Asst. Chief of Fisheries
Kyle Bolton, Biologist
Keith Henderson, Biologist
(334) 242-3471
DISTRICT I
Pickwick, Wilson, Wheeler, Guntersville,
Bear Creek Lakes
Keith Floyd, Supervisor
Phil Ekema, Biologist
21453 Harris Station Rd.
Tanner, AL 35671
(256) 353-2634
DISTRICT II
Weiss, Neely Henry, Logan Martin, Lay,
Mitchell, Jordan, Harris, Martin, Yates,
Thurlow, Jones Bluff
Michael Holley, Supervisor
Nathan Hartline, Biologist
1930 Fish Hatchery Rd.
Eastaboga, AL 36260
(256) 831-6860
DISTRICT III
Aliceville, Gainesville, Smith, Bankhead, Holt,
Oliver, Warrior, Demopolis, Tuscaloosa,
Inland
Jay Haffner, Supervisor
Chris McKee, Biologist
8211 McFarland Blvd.
Northport, AL 35476
(205) 339-5716
DISTRICT IV
West Point, Harding, Eufaula, Gantt, Point A,
Frank Jackson
Ken Weathers, Supervisor
Rob Andress, Biologist
Graves Lovell, Biologist
3520 Plaza Dr.
Enterprise AL 36330
(334) 347-9467
DISTRICT V
Big Creek Lake, Claiborne, Coffeeville,
Miller’s Ferry, Mobile Delta
Dave Armstrong, Supervisor
Tommy Purcell, Biologist
30571 Five Rivers Blvd.
Spanish Fort, AL 36527
(251) 626-5153
Statewide Club Tournament Results » p. 4-5, 14-19 &
26-33
Results from 466 tournaments held in Alabama during 2016
Monthly Tournament Stats » p. 6-7 & 20-24
Catches reported for all major reservoirs with at least 10 reports
Standardized Electrofishing Results » p. 8-13
See the results of ADCNR’s bass population surveys
ADCNR Tournament Website » p. 35
Find tournaments or post upcoming events for all 45 reservoirs in
Alabama
Boating Access » p. 36
Find out what’s going on in your area
Habitat Enhancement & Restoration Team » p. 37
See the list of recently completed projects
CONTENTS 2016 B.A.I.T. REPORT
ON THE INTERNET www.outdooralabama.com
Reservoir Reports… www.outdooralabama.com/fish-management-reports
B.A.I.T. Program… www.outdooralabama.com/bass-fishing-quality-bait-reports
Limits and Regulations… http://www.eregulations.com/alabama/guide/
Freshwater Boating Access… http://boatramps.dcnr.alabama.gov
Tournament Listings… www.outdooralabama.com/tournaments
Interactive map with habitat structure locations & more… http://conservationgis.alabama.gov/dcnr/
Alabama Wildlife & Freshwater Fisheries • Fisheries Section • 64 N. Union St., Montgomery, AL 36130 • (334) 242-3471

2016 B.A.I.T. Summary
Bass fishing in the State of Alabama has remained excellent for the past several years.
During 2016, three of five quality indicators improved over the previous year (Average Bass
Weight: increased 8%, Percent Success: decreased 7%, Bass/Angler-Day: decreased 9%,
Pounds/Angler-Day: increased 0.3%, and Hours to catch a 5lb. Bass increased 13% ). All five
quality indicators (percent success, average weight, number of bass per angler-day, pounds per
angler-day and number of hours to catch a 5 pounder) remained above the 30 year average. The
number of 8 lb. bass caught increased from 15 in 2015, to 25 in 2016. The number of fishing
hours also increased by 16% in 2016. Although the larger Tennessee River impoundments have
always been traditional angler favorites, Wilson has turned the most heads recently, finishing No.
1 overall the past three years in the Quality Indicator Ranking. Smith Lake was again 2nd overall.
Guntersville showed improvements in four of five quality indicators in 2016, after concerns arose
from some members of the public and media in 2015 regarding a decline in the sizes and numbers
of bass caught. The bass fishery has likely “reset”, so numbers and sizes should gradually
improve in the coming years.
Wilson remained on top in the overall quality indicator rankings.
Martin and Weiss both showed considerable improvement in the quality indicator rankings,
moving up 13 and 10 spots, respectively; while Eufaula, Millers Ferry and Neely Henry (down
8) fell in the overall rankings.
Wilson, Smith, Martin, Weiss and Lay were the top five lakes in the overall quality indicator
rankings.
Harris, Pickwick, Wilson, Eufaula,
and Guntersville were the top five big
bass lakes in Alabama.
Winning Weight data was added in 2016.
.
2016 Statewide B.A.I.T. Statistics
13.83 – Average winning weight (5 fish)
3.48 – Number of bass caught per angler-day
7.28 – Pounds of bass caught per angler-day
2.09 – Average weight of bass caught
259 – Hours required to catch a 5 pound bass
11.19 – Weight of the largest bass caught
25 – Number of bass 8 pounds and larger
462 – Number of bass 5 pounds and larger
1

for accuracy and entered into a computer database. Club officers are
contacted when data are suspected to be erroneous. We compile and
analyze the data following receipt of December tournament reports.
Statewide tournament results are sorted by reservoir and by club.
To rank reservoirs, five “fishing quality” indicators were used:
percent of successful anglers (percent of anglers with one or more bass
at weigh-in), average bass weight, number of bass per angler-day,
pounds of bass per angler-day, and hours required to catch a bass five
pounds or larger. Since the length of a fishing day varies between
tournaments, an angler-day is defined as one angler fishing for ten
hours. In this report, an angler-day may simply be referred to as a
“day” of fishing. A minimum of five tournaments for an individual
reservoir is considered necessary for minimum confidence in each
reservoir dataset. Reservoirs with five or more tournament reports are
ranked for each of the quality indicators. Values are assigned to each
rank and an overall rank is determined for each reservoir by summing
the values of the five quality indicators. This ranking system is intended
to be a quick reference for club tournament site selection. It does not
constitute a “best and worst” list of Alabama reservoirs and should not
be interpreted that way.
Tournament results were also broken down by month for each
reservoir with 10 or more reports. This section was intended to aid
clubs in scheduling tournaments since the quality of fishing can vary
considerably from one season to the next on any given reservoir. It
also allows anglers to better understand their chances of achieving a
particular goal (i.e., catching a big bass) on a given lake by studying in
detail how anglers performed during each month of the year. When
studying this section of the report, be aware that some months are
represented by only one tournament, which may not be a good
indicator of the overall quality of fishing during that month.
The printing of the 2016 B.A.I.T. Annual Report marks the 31st
year of the B.A.I.T. Program. The objective of the program since its
inception has been to gather information on bass populations by
combining the efforts of bass club members and state fisheries
biologists. The B.A.I.T. Program summarizes catch data on reservoir
bass populations that are collected and provided to us by participating
clubs. This information is used by state fisheries biologists in
combination with data from other sources as a basis for fisheries
management decisions. Bass anglers use the report to establish future
tournament sites, or to locate a reservoir that provides a particular type
of fishing.
Through 2016, we have summarized 14,778 tournament reports.
Anglers have spent 3,371,226 hours collecting data for this program.
They have contributed data from 891,777 bass that weighed 1,669,693
pounds.
This report also contains information related to the Alabama
Division of Wildlife & Freshwater Fisheries’ Boating Access
Maintenance and Development Program which maintains 112 boating
access areas statewide. Information regarding the Habitat
Enhancement and Restoration Team (HEART) program is also
included. The accomplishments made by these programs during 2016
may be of particular interest to tournament bass anglers and their
organizations.
Every year, we attempt to maintain the support of the previous
year’s clubs and to enlist the support of new clubs through public
meetings, news releases and letters. Participating club officers or
tournament directors are sent the previous year’s annual report and
tournament report postcards to be completed following each
tournament. Clubs are assigned individual numbers to insure
confidentiality. As tournament cards are received, they are checked
Introduction & Methods
2
State: Zip:
Date Month Day Year Team 7.50 hrs. 10
Start: 4 14 2016 Night 5 bass 35
End: 4 14 2016 Team 12 in. 0
12 Total number of bass caught:
12 Total number of bass released:
6 2
99.00 lbs. 2 oz. 10.00 lbs. 4 oz.
NOTE: Format should be: TEAM, DRAW, or SOLO 15.00 lbs. 6 oz.
Weigh-in should be: TEAM or INDIVIDUAL
Winning weight:
No. of anglers/teams with limits: No. over 5 lbs: ; over 8 lbs: 0
Total weight of bass: Big bass weight:
No. of anglers/teams with 1 or more bass: 43
Format: Fishing time: Largemouth:
Day or Night: Creel limit: Spotted:
Weigh-in: Size Limit: Smallmouth:
Total number of anglers and/or teams: 45
AL 36104 Launch site: Bonners Point
TOURNAMENT DATE TOURNAMENT TYPE TOURNAMENT RULES NUMBER CAUGHT
Street: 64 N. Union St. Phone: 555-555-5555
City: Montgomery Reservoir: Jordan
B.A.I.T. TOURNAMENT
REPORTClub name: Backlash Bass Club Club rep.: Damon Abernethy
Example B.A.I.T. Report Card

3

Average catch rates in 2016 for number of fish caught per angler/day
(3.5) was down slightly from 2015, while pounds per angler/day were nearly
identical from 2015. Compared to 2015, nine lakes improved in overall
fishing success in 2016. Most notably, Martin, Weiss and Lay all moved
from the bottom third into the top 5 in the overall rankings (Table 2). Martin
ranked 3rd overall, while in 2015 was 3rd from last. The average size bass
of Wildlife, Fisheries, and Parks. Without their support, several Alabama
reservoirs would not have been well represented in the quality indicator
rankings (Table 2). Once again, we must stress that reports from more
locations increase the capability of the summaries to reflect actual fish
population conditions and not just a good or poor day's fishing by one or
two clubs.
waters were received
from Fisheries Biologist
Clint Peacock of
Georgia DNR, who
summarizes tournament
data from the Georgia
Bass Federation; and
another 39 reports were
received from Fisheries
Biologist Stan Crider,
with the Mississippi
Department
Bass clubs submitted 466 tournament reports during 2016, up from
410 in 2015 (Tables 1 and 3). Club representatives did a fine job filling
out the cards and no reports were rejected due to incomplete or
erroneous information. We want to thank the participants of the B.A.I.T.
Program and urge them to keep up the good work! Forty-nine clubs
provided data in 2016. One hundred and two reports from Alabama
one bass five pounds or larger for every 259 hours of fishing. Tournament
anglers weighed in 25 bass eight pounds and larger in 2016. The largest
bass caught in 2016 came from Lake Guntersville, and weighed 11.19
pounds. With 97 bass weighing five pounds or larger, Guntersville led this
category. Eufaula was next in line with 89 big bass over five pounds.
Of the 49 organizations that submitted data during 2016, 67%
submitted five or more tournament reports, and 35% submitted 10 or more
reports. Eleven contributors submitted only one report. A list of contributing
clubs for the 2016 B.A.I.T. Report is presented in Table 4.
In 2016,
tournament reports
were received from 29
bodies of water that
were fished 134,194
hours. B.A.I.T. anglers
caught 46,687 bass that
weighed 97,734 lbs.
(Table 1). A total of 462
bass five pounds and
larger were reported for
an overall catch rate of
caught from the
Mobile Delta steadily
increased from 1.40 to
1.79 pounds over the
last 5 years. Success
rates (anglers who
caught at least one
bass per tournament)
for Logan Martin
(95%), Martin (93%)
and Wheeler (93%) all
reached record highs.
Most 2016 reports were received from Eufaula (52), Pickwick (50),
Mobile Delta (46) and Guntersville (38), accounting for 40% of reports.
Logan Martin had 27, while Jones Bluff, Jordan, Lay, Martin, Millers Ferry,
Mitchell, Neely Henry and West Point each had 15 or more reports (Table
1). The other 16 reservoirs contributed only 21% of the total for 2016. A
good distribution of reports provides more robust statistics from which
accurate summaries
can be prepared. All
club representatives
should understand
that every report is
important to the
continued success of
the B.A.I.T Program.
Of the 29
reservoirs from
which reports were
received, 21 had five
or more tournament reports (Table 1). The following comments deal with
these reservoirs, which are ranked by quality indicators in Table 2. The
percent of successful anglers (those with one or more fish) ranged from 55%
at Demopolis to 95% at Logan Martin. The average weight of bass caught
ranged from 1.53 pounds at Bartlett's Ferry to 2.83 pounds at Guntersville
(Table 1). Catch rates expressed as bass per angler-day ranged from 2.52
at Guntersville and Eufaula to 5.17 at Martin. Catch rates as pounds per
angler-day ranged from 5.19 at Bartlett’s Ferry to 9.45 at Smith. The
statewide average weight for bass caught on all 29 reservoirs was 2.09
pounds.
CLUB LAKE DATE WEIGHT
Alabama Bass Trail Eufaula Oct. 8 33.10 lbs.
Pickwick Winter Bass Trail Pickwick Dec. 31 32.44 lbs.
Dannelly Air National Guard Guntersville Apr. 11 29.35 lbs.
BFL Choo Choo Div. Guntersville Apr. 30 29.13 lbs.
BFL Choo Choo Div. Guntersville Mar. 5 27.81 lbs.
South Lanier Bassmasters Guntersville Mar. 5 27.39 lbs.
Alabama Children’s Classic Eufaula Jun. 11 27.05 lbs.
Alabama Bass Trail Guntersville Mar. 19 26.87 lbs.
Pickwick Winter Bass Trail Pickwick Dec. 17 26.69 lbs.
Lost Mountain Bassmasters Guntersville Feb. 27 26.06 lbs.
Alabama’s Top 10 Tournaments
For Single-Day Winning Weight in 2016
CLUB LAKE DATE No. ≥5lbs.
Boyd’s Marine Tournament Trail Eufaula Mar. 5 11
Alabama Children’s Classic Eufaula Jun. 11 9
Alabama Bass Trail Guntersville Mar. 19 9
Collinsville Bass Club Gainesville Apr. 30 8
Alabama Bass Nation High School Wheeler Jun. 9-10 8
AL-TN Bass Club Wilson Mar. 12 7
Alabama Bass Trail Lay Mar. 12 7
Alabama Bass Nation High School Lay May 14 7
BFL Choo Choo Div. Guntersville Feb. 13 6
Alabama Bass Trail Weiss Jun. 18 6
Alabama’s Top 10 Tournaments
For Big Bass in 2016
Statewide Tournament Results
4

Overall, Wilson accumulated more quality indicator points (86) than
any other reservoir in Alabama, keeping the top spot for the third
consecutive year. Smith (77), Martin (69), Weiss (68), and Lay (67) rounded
out the top five (Table 2).
Readers should note that the primary intent of Table 2 is not to
determine the overall “best” reservoir, but to characterize the fishery of
each reservoir. Anglers should first review the quality indicator that is most
important to them. The overall rating would be used to narrow choices. For
example, if an angler wanted to have the best chance to catch a bass
greater than 5 pounds, then Harris, Pickwick or Wilson would be good
choices. Clubs interested in having all its members catch good quality
stringers would look at the pounds per angler-day rankings to find that
Smith, Wilson, and Martin offered the best opportunity. If catching lots of
bass is important, then Martin, Logan Martin, or Smith might be the best
destination based upon their bass per angler-day rankings.
Bass data, as expressed in the B.A.I.T. report from reservoirs with
harvest restrictions or length limits, will be biased since the data is a function
of the restrictions. Length limits are imposed to increase the number of fish
below a minimum length or within a specified length range (slot limit) which
should eventually result in a greater supply of bass above the limit. Because
all minimum lengths and length ranges will be above the 12-inch limit self-
imposed by most tournaments, the restrictions will reduce the total harvest in
numbers and possibly pounds. However, those fish weighed in will be larger
(longer) by virtue of the minimum length (MLL) or slot limit. In the B.A.I.T.
Report, length limit lakes should rank high for average weight and near the
bottom for percent success and bass per angler-day.
Length limits remained in effect during 2016 on West Point (14-inch
MLL on largemouth), Eufaula (14-inch MLL on largemouth), Demopolis (14-
inch MLL on all black bass), Little Bear Creek (13- to 16-inch slot on
largemouth), Smith (13- to 15-inch slot on all black bass), Harris (13- to 16-
inch slot on largemouth), Pickwick (15-in. MLL on largemouth or smallmouth
bass), Wilson (15-in. MLL on smallmouth bass), Wheeler (15-in. MLL on
smallmouth bass), and Guntersville 15-in. MLL on smallmouth and
largemouth bass). No more than five of the daily creel limit of 10 black bass
may be smallmouth bass.
Bass fishing in Alabama has been excellent in recent years, with 62%
of reservoirs with five or more reports received being above the 30 year
average in all quality indicators. We’re seeing improvements in waterbodies
where the bass fishing has historically been subpar. Prime examples are
Smith, Martin, and the Mobile Delta fisheries.
Although there have been no recent outbreaks of Largemouth Bass
Virus (LMBV), there are indications that this disease may impact our bass
fisheries by elevating natural mortality rates in some reservoirs; so, please
report any unusual bass die-offs to your district fisheries office, and never
move fish from one lake to another.
The graphs throughout this report provide a historical record of how
your favorite waters have performed in the B.A.I.T. Program. A few words of
caution - these graphs are not restricted to bodies of water with five or more
tournaments. Data points for some years may be represented by only a few
tournaments. However, those situations are restricted to water bodies that
have not been included in the quality indicator rankings in Table 2. These
graphs can be used to predict future fishing quality by looking for trends.
Good luck fishing, and don’t forget to take a child with you and
introduce him or her to your sport. They are our future anglers and stewards
of Alabama’s resources.
Statewide Tournament Results
5
Bass Over Eight Pounds from 2016 B.A.I.T.
Reports
Date Organization Lake Big Fish
Feb. 13 BFL Choo Choo Div. Guntersville 11.19*
Dec. 3 Pickwick Winter Bass Trail*** Pickwick 10.36
Jun. 4 Alabama BASS Nation Pickwick 10.22
Aug. 27 Pickwick Winter Bass Trail*** Pickwick 9.54
May 20-21 Carroll Bassmasters** Guntersville 9.51
Mar. 5 BFL Choo Choo Div. Guntersville 9.44
Mar. 5 Boyd's Marine Tournament Trail Eufaula 9.29*
Mar. 19 Carroll Bassmasters** Harris 9.24*
Mar. 19 BFL Bama Div. Martin 9.13
Apr. 30 BFL Choo Choo Div. Guntersville 9.06
Mar. 12 Pickwick Winter Bass Trail*** Pickwick 8.91*
Apr. 23 Alabama Bass Trail Pickwick 8.47
Mar. 5-6 South Lanier Bassmasters** Guntersville 8.25
Mar. 14 Belmont Bass Anglers Guntersville 8.18
Mar. 19 Alabama Bass Trail Guntersville 8.11
Mar. 12 Alabama Bass Trail Lay 8.08*
Feb. 27 Lost Mountain Bassmasters** Guntersville 8.06
Dec. 31 Pickwick Winter Bass Trail*** Pickwick 8.02
* Indicates two bass over eight pounds weighed in
**Submitted by GADNR
***Submitted by MDWFP
Lake Records Set in 2016 (31 Year History of B.A.I.T. Reporting)
Waterbody Record
2016
Value
Lake
Average
Harris Pounds Per Angler-day 7.1 3.81
Harris Hours to Catch a 5 pounder 88 390
Logan Martin Percent Success 95% 84%
Martin Percent Success 93% 84%
Martin Bass Per Angler-day 5.2 3.4
Martin Pounds Per Angler-day 8.4 4.7
Mobile Delta Average Weight 1.79 1.59
Weiss Pounds Per Angler-day 7.9 4.8
Wheeler Percent Success 93% 79%
Monthly Tournament Stats In this section, reservoirs with at least 20 reports are discussed in
detail and the monthly tournament results listed in Table 6 are frequently
referenced. This table provides monthly catch information for all
reservoirs with at least 10 reports.
Eufaula
Fifty-two (52) tournaments were reported during 2016. All months
except January and December were represented by at least one report
with the majority occurring in April (12). One thousand six hundred and
forty (1,640) anglers fished for 13,676 hours to catch 3,445 bass that
weighed 8,674 pounds, with an average size of 2.52 pounds.
Largemouth bass made up 76% of the total catch, while spotted bass
accounted for 24%.
The quality of fishing on Eufaula has shown a pattern of
inconsistency throughout the 31 year history of BAIT reporting, and that
trend has continued into the 2010’s. However, the past six years have
offered quality fishing compared to other reservoirs in the state.
Percent success hit a record high of 85.1% in 2015, up from 83%
in 2014, then dropped significantly in 2016 to 68%. The average sized
bass (2.52 lbs.) caught by tournament anglers was above the post-LMBV
average. Catch-rates of bass larger than five pounds (152 hours) were
similar to that of the pre-LMBV era when anglers caught them at a rate of
one every 14 days of fishing. In 2014, that value was only 67 hours, an
all time low since 1986.
March and April were the most popular fishing months, with 21 out
of 52 tournaments for the year. Months with the lowest percent success
were July and August.
Guntersville
Thirty-eight (38) tournaments were reported during 2016, with most
tournaments occurring in April (11). No tournaments were reported for
January, August, November and December. One thousand nine
hundred and forty-two (1,942) anglers fished for 16,561 hours to catch
4,172 bass that weighed 11,787 pounds, with an average size of 2.83
pounds. Largemouth bass accounted for 90% of the total catch.
Anglers may notice that the quality indicator values are down from
the previous few years, however, this fact cannot be explained based
solely on BAIT data. Standardized sampling revealed very strong year
classes during the drought of 2007-08. This resulted in a six to eight
year “boom” period which led to exceptional fishing opportunities at
Guntersville. The fish from that period have begun to die off naturally,
and the population is settling back into something more akin to the long-
term average. This is reflected in the BAIT data as well. When the BAIT
data alone is analyzed, four out of the five quality indicators (Ave. weight,
bass per angler-day, pounds per angler-day, and hours to catch a bass
over 5 lbs.), all reached record highs in 2014. The quality indicators have
declined from 2014, but when looking at the past 8 years, it is evident
that all values are still well above the 30 year average. Fluctuating data
values are typical for most fisheries. Fish populations are subject to
fluctuations that are mostly due to normal life cycles.
From 1992 – 1999, nearly 385,000 Florida largemouth bass were
stocked into the North Sauty Creek area of the lake. Subsequent genetic
assessments revealed that this effort successfully introduced Florida
genes into Guntersville’s bass population. However, although
Guntersville’s bass contain roughly 30% Florida genes, preliminary
results from genetic work with angler-caught bass over 7 pounds seems
to indicate that the native Northern strain is attaining the larger sizes.
Jones Bluff
2016 is the first year that Jones Bluff has been included in the
monthly tournament stats section. We’re happy to see the Jones Bluff
fishery gain in popularity, and appreciate the dedicated club members
who consistently submit reports.
Twenty-two (22) tournaments were reported during 2016. Most
were in May-June. No reports were received during February, March,
November or December. Two hundred and four (204) anglers fished for
1,736 hours to catch 667 bass that weighed 1,116 pounds, with an
average weight of 1.67 pounds. Spotted bass comprised 60% of the
catch. For 2016, all five quality indicator values were above post-LMBV
averages.
Logan Martin
Twenty-seven (27) tournaments were reported in 2016, with most
occurring in June (7). No tournaments were reported in January, March
or July. Four hundred and thirty-two (432) anglers fished for 4,002 hours
to catch 1,834 bass that weighed 2,952 pounds, with an average size of
1.61pounds. Spotted bass made up 70% of the total catch, while
largemouth bass accounted for 30%.
Percent success (95.4%) in 2016 was the highest ever recorded in
the BAIT program’s history, and was ranked 1st in the quality indicators.
The month where anglers had the least success (76%) was August.
Every angler which fished October-December, as well as April, all caught
fish. Of the anglers who fished Logan Martin in 2016, 57% had at least 5
fish in their bag, and on average, it took 11.58 pounds to win a
tournament.
.
6
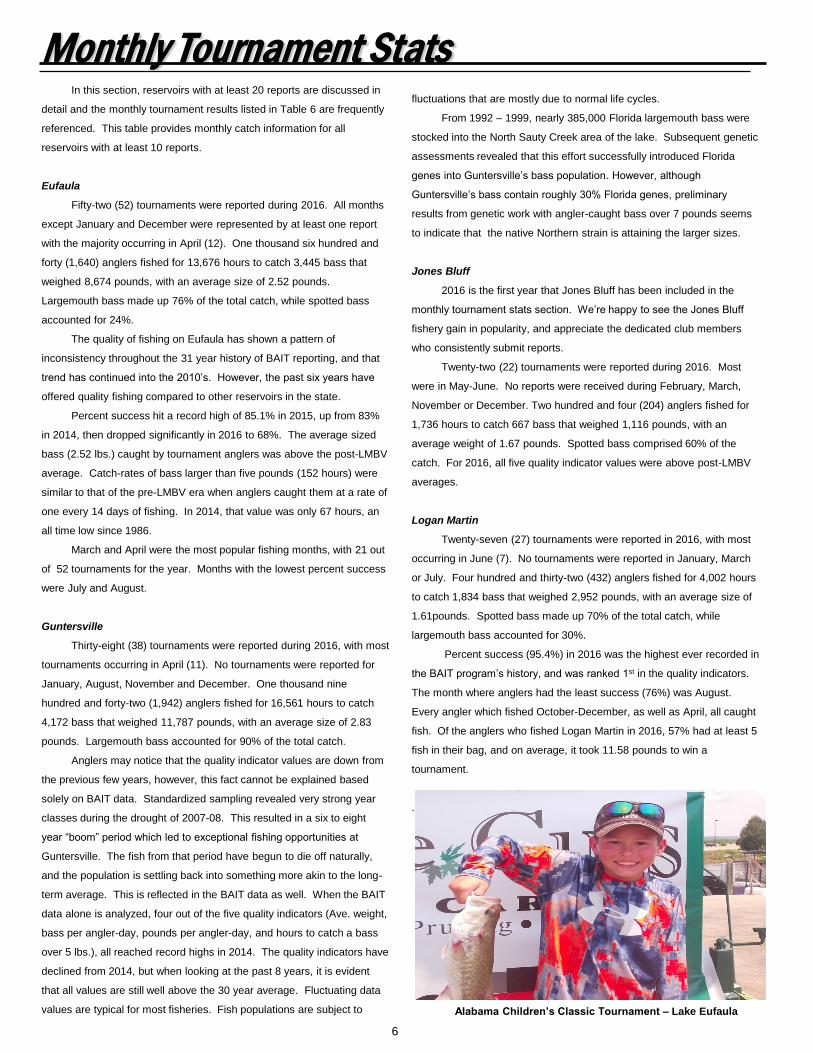
Alabama Children’s Classic Tournament – Lake Eufaula
Monthly Tournament Stats Mobile Delta
Forty-six (46) tournaments were reported during 2016 (down 35
from a year ago), with a fairly even distribution among seasons. One
thousand four hundred and twenty-eight (1,428) anglers fished for 13,082
hours to catch 4,986 bass that weighed 8,945 pounds, with an average
size of 1.79 pounds (up 2% from 2015). Largemouth bass comprised
90% of the reported total catch.
The number of reports received the past four years (81, 50, 81 and
46) has been encouraging. Participation has been up significantly for
Delta tournaments. As a result, we can achieve a higher confidence
level in the catch statistics.
Catch-rates have been trending upward since 2007. This year’s
reporting set a consecutive all time record for average weight in the Delta
(1.79 lbs.). All five quality indicators for the Mobile Delta were well above
the long-term averages.
Hopefully, this trend will continue, and the number of tournament
reports received from this body of water will remain high so better
information can be obtained to characterize this very important fishery.
For many bass anglers in the Mobile area, this is the only large water
body that is conveniently located for tournament fishing
Mitchell
In 2016, twenty-three (23) reports were received, which is the
most for Mitchell in the 31 year history of BAIT reporting. We’re happy to
see increased reports for this popular Coosa River reservoir.
Most reports were received from April (4). Tournaments were
reported in every month except July. Four hundred and seventy-two
(472) anglers fished for 4,093 hours to catch 1,659 bass that weighed
3,179 pounds, with an average size of 1.92 pounds. Spotted bass
comprised 67% of the catch, with largemouth bass accounting for 33%.
Percent success (92%) was the 2nd highest value ever reported.
Only 3% lower than 2014’s value. All quality indicator values were well
above the 31 year averages. The average 5-fish limit weighed 12.44
pounds, however, it took an average of 16.4 pounds to win a spring
tournament.
Neely Henry
Twenty (20) tournaments were reported in 2016, with most
occurring in October (8). No tournaments were reported in March,
November or December. Seven hundred and fifty-nine (759) anglers
fished for 6,878 hours to catch 2,641 bass that weighed 5,009 pounds,
with an average size of 1.9 pounds. The largemouth to spotted bass
catch ratio was 1:1.
Neely Henry dropped 8 positions in the quality indicator rankings
from 2015, but all values are still above the 31 year average.
Pickwick
Fifty (50) tournaments were reported during 2016 (up 16 from a
year ago), with the majority being held in May (9). Otherwise,
tournaments were generally dispersed evenly throughout the year. Two
thousand one hundred and sixty-seven (2,167) anglers fished for 18,340
hours to catch 5,246 bass that weighed 13,594 pounds (the most for
2016), averaging 2.59 pounds apiece. Largemouth bass comprised 76%
of the total catch, smallmouth bass accounted for 15% and spotted bass
comprised 9%.
The percent of anglers who caught at least 1 fish was 75% in the
spring months, on average, while summer months showed 82%. The
average big bass weighed 6.2 pounds Anglers reported 58 bass over 5
pounds, seven were over 8 pounds. Pickwick earned the heaviest
average winning weight (18.2 lbs.) of all 29 reservoirs reporting
tournaments.
Quality indicators were slightly lower than 2015 values, with the
exception of average weight (up 6%). Fishing at Pickwick peaked during
2009-2010, so quality indicators are trending more toward the 30 year
average, but the bass fishery is still one of the best in the state.
West Point
Twenty-two (22) tournaments were reported during 2016, with the
majority occurring in March (8). This number was down by 13 from last
year. Three hundred and thirty-seven (337) anglers fished for a total of
3,102 hours to catch 1,124 bass that weighed 1,792 pounds. The
average weight of bass was 1.59 pounds (0.16 pounds below average
for West Point). Spotted bass comprised 73% of the total catch, while
largemouth bass accounted for 27%. Only four (4) bass weighing more
than 5 pounds were caught.
Percent success (86.4%), number of bass per angler-day (3.62)
and pounds of bass per angler-day (5.8) are all well above the 30 year
average for the reservoir.
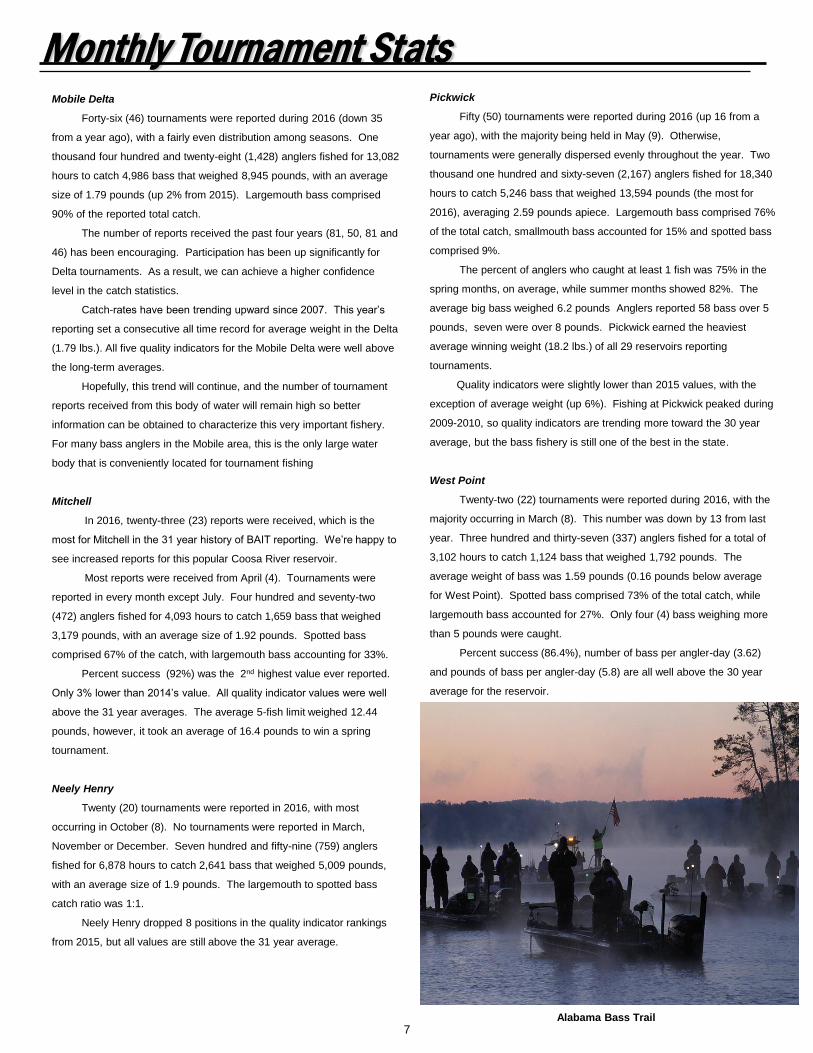
7 Alabama Bass Trail

The Alabama Division of Wildlife & Freshwater Fisheries manages
45 public reservoirs through five District Offices. Inside the front cover of
this publication, each District Office is listed along with the reservoirs within
their area of responsibility. Each reservoir is sampled on a routine basis to
monitor the population structure of its sport fish species. These samples
are conducted in a standardized manner according to the guidelines of the
Alabama Reservoir Management Manual so that changes in population
characteristics can be monitored over time. Most reservoirs are sampled
on a three year cycle and management recommendations, such as length
and creel limits, are determined from this research. There are three key
components of the fish population that biologists must characterize in order
to make these decisions; they are growth, mortality, and recruitment.
Another important non-biological element is bass harvest rates, which is
determined through the use of angler creel surveys.
These four variables ultimately determine the quality of each fishery,
but all of them are limited by the nutrient levels in each reservoir. Even
with good management, reservoirs with low fertility or poor water quality
do not have the potential to produce outstanding fisheries. Depending on
the results of these investigations, some management objectives may
include the reduction of small bass through the use of slot limits, or
increasing the number of larger fish using minimum length limits, which can
also reduce the effects of variable recruitment.
A careful review of the information in this section reveals certain
fishery trends that are reflected in the tournament reporting data. For
example, reservoirs that consistently produce good numbers of trophy
bass are usually those with populations that exhibit low annual mortality
and rapid growth. Conversely, lakes that rarely produce trophy bass are
often characterized by slow growth and high annual mortality.
Standardized Electrofishing Results
Complex statistical models are developed from these variables that
are used to predict how fish populations might respond to changes in the
length or bag limits imposed on each reservoir. Over time, these model’s
predictive ability can be validated by comparing the predicted effects to the
actual fishery responses to the changes in harvest restrictions. In general,
harvest restrictions have miniscule impacts unless the rate of fishing
mortality approaches or exceeds that of natural mortality because there is
little biological justification for protecting fish that are dying primarily of
natural causes. Since bass harvest in Alabama is generally very low, few
reservoirs have restrictive length limits at this time. However, routine
monitoring of bass populations will allow changes in harvest restrictions to
be made whenever necessary.
Alabama Wildlife & Freshwater Fisheries biologists conduct a standardized
electrofishing sample on 3-Mile Creek, a Mobile River tributary.
Cross-section of an otolith from a 16 year old largemouth bass. Dark
bands are formed in winter when cold temperatures reduce growth.
Bass are measured and weighed so that biologists can determine the
size structure of the population, growth rates, and relative condition.
8

Growth
One of the three most important objectives of
fisheries biologists’ assessments of a fish population is to
determine the growth-rates for the fish being studied.
There are many factors that can affect the rate at which fish
grow. The most important are prey abundance, size, and
nutritional value; and of course, the number of other fish
competing with them for those food resources. Other
factors include the age and health of the fish, water
temperature, and water quality. Obviously, these variables
do not remain constant over time, so the assessment
represents a snapshot in time and can vary depending
upon when the samples were obtained.
Biologists determine fish growth-rates by measuring
their lengths at each age represented in the sample. This is
done by examining the fish’s otoliths, which are free-
floating bones in the inner ear that form growth-rings similar
to those that are visible on the top of a tree stump. These
rings are formed because calcium is deposited at a
constant rate no matter how fast the fish is growing. During
winter, when the fish is not actively growing, the calcium is
deposited in a more concentrated area, and leaves behind
a ring once the fish’s growth-rate increases as water
temperatures become warmer. Using this technique,
biologist’s can easily determine the amount of annual
growth since birth, or between two given years.
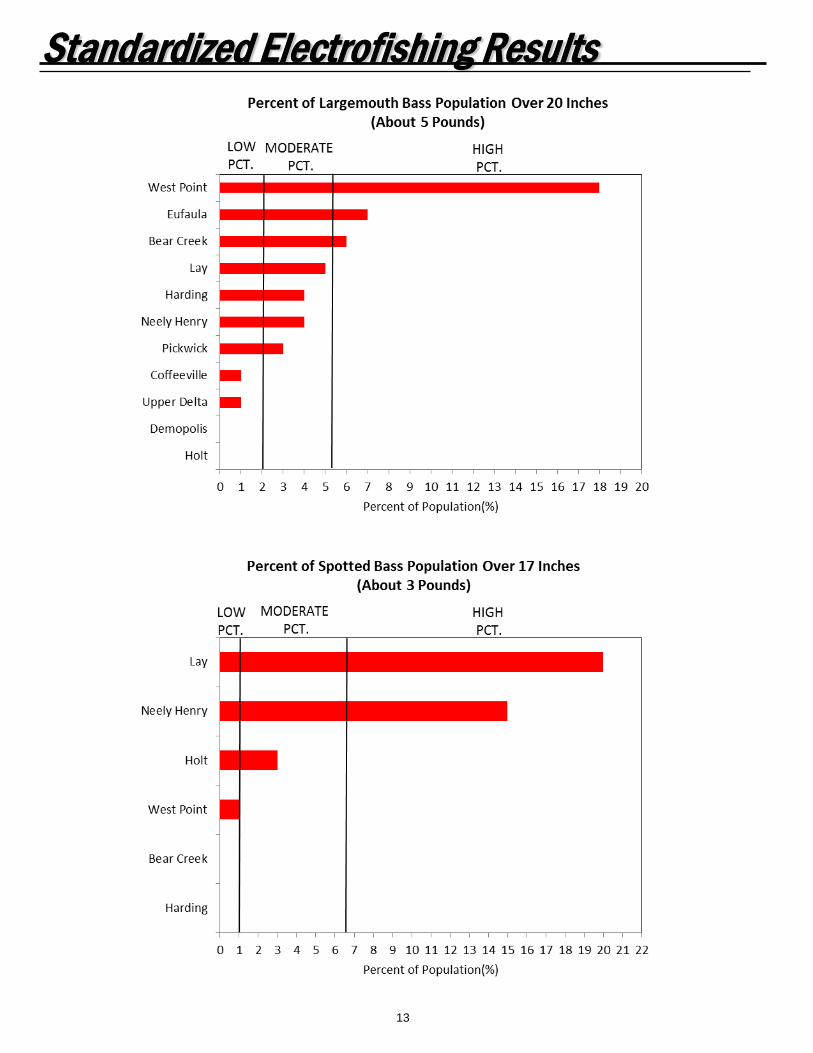
In Alabama, largemouth bass rarely exceed 10
years of age, and relatively few of the fish in these samples
include fish greater than 5 years old. In warmer climates,
bass grow faster but do not live as long as fish in colder
climates. Additionally, a biologist’s ability to impact the size
structure of a fish population through the use of length
limits is most easily measured by examining the population
characteristics of fish that are about to enter the fishery (i.e.
those fish becoming available for harvest). Given all of
these factors, a good benchmark for the growth-rates of
most Southeastern bass populations is the average length
of bass at three years of age, which is usually 12 -14
inches. The adjacent bar charts illustrates the results of
these studies on the reservoirs that were sampled by
Wildlife & Freshwater Fisheries biologists during Spring
2016.
In order to make good management decisions,
growth-rates of bass populations are classified as slow,
moderate, or fast. However, it should be noted that growth-
rates are only one piece of the fish production puzzle and
must be complimented by other desirable population
characteristics in order to produce high quality fisheries.
Standardized Electrofishing Results
9

Mortality
The second of the three most important objectives in
fishery assessments is to determine the mortality rate for
the population. Mortality is the death of fish, which can be
caused by a wide range of things that include both natural
causes, and fishing-related causes. In this section, it is
total annual mortality that will be discussed; however,
separating natural mortality from fishing mortality is an
important step in good fisheries management. Determining
the fishing-related component of mortality is the most
important, and most difficult, task that a fisheries biologist
faces. Documenting the number and size of fish being
harvested by anglers is relatively easy to do using angler
interviews, but understanding how many fish die following
tournaments or catch-and-release is a much more difficult
task.
The most common way that biologists determine the
mortality rate of a fish population is to measure the rate of
decline in the number of fish represented in each age group
in the collection. For example, from a collection of fish with
a mortality rate of 50%, you might expect to see a decline
similar to this: Age-1 (100 fish), Age-2 (50 fish), Age-3 (25
fish), Age-4 (13 fish), Age-5 (6 fish), Age-6 (3 fish), Age-7 (2
fish), Age-8 (1 fish).
In Alabama, typical annual mortality-rates for
largemouth bass range from 35% to 45%, but can vary
considerably from one year to the next. Only a small
percentage of bass in Alabama populations live to exceed
10 years of age. Typically, less than 1% of bass collected
in a standardized reservoir sample will exceed 10 years of
age. Even in populations with very low mortality-rates, this
figure is usually less than 3%.
Minimum length limits are a management tool often
considered by biologists if mortality-rates are high; however,
they are only effective if a large portion of the total annual
mortality can be attributed to fishing-related causes.
Limiting angler harvest cannot reduce bass mortality from
natural causes.
The adjacent chart reflects the total annual mortality
rates of largemouth bass populations sampled during
Spring 2016. Biologists use this information to help guide
them to make management decisions in an effort to improve
the quality of fishing. A reduction in mortality-rates following
the enforcement of a length limit is an indication that this
management action has had a positive influence on the
population. Obviously, if fishing-related mortality is low,
then length limits will do little to improve the quality of a
fishery.
Standardized Electrofishing Results
10

Recruitment
The final critical objective in fishery assessments is to
determine recruitment of the population into the fishery.
This is generally defined in two ways: 1) the number of fish
surviving to reach one year of age, or 2) the number of fish
surviving to reach harvestable size. The first is important
because fish that do not reach 3 to 3 ½ inches before their
first winter are less likely to survive to the following spring.
The second is important because it is a measure of the
percentage of fish that reach sizes large enough to be
caught or harvested by anglers. Recruitment can be
impacted by density-dependent and/or density-independent
factors.
Density-dependent factors include population size,
fish size and growth characteristics, reproductive fertility,
cannibalism, disease, predation, and competition for food.
Density-independent factors are non-biological in nature
and may include floods, droughts, temperature extremes,
excessive wind, and pollution.
Obviously, all of these factors can influence one
another and may vary considerably over time. Although it is
the biological and environmental interactions that have the
greatest impact, exploitation (fish removed from the
population by angling) can also influence the recruitment
potential of a population.
Standardized Electrofishing Results
11

Abundance
Another important population variable is the
abundance of catchable sized fish in the population. Actual
abundance is determined by a wide range of things, which
may include survival during critical phases of life, habitat
suitability, water quality, fertility, water productivity,
competition with other fish, predation, or disease.
However, it is also important to remember that a biologist’s
assessment of overall abundance is determined from
electrofishing samples that are a snapshot in time and may
be influenced by temporary environmental conditions
during the sample period. Muddy water can prevent a
biologist from seeing fish beneath the surface while
electrofishing, cold fronts may cause fish to move away
from the shoreline, aquatic weeds can hinder their ability to
see or capture fish that would ordinarily be collected, fish
may be deeper than the reach of the electrical field in
extremely clear water, etc. All of these things have the
potential to bias estimates of abundance.
The number of 8 – 12 inch largemouth bass, and 7 –
11 inch spotted bass, collected per hour of electrofishing is
a general indicator of overall population abundance. In
Alabama, the majority of samples, statewide, fall within the
11 – 26 fish per hour range for largemouth bass, and 6 –
16 fish per hour for spotted bass. The adjacent chart
illustrates these values for samples conducted on public
reservoirs during Spring 2016.
Standardized Electrofishing Results
12
Standardized Electrofishing Results
13

14
Table
1. S
tate
wid
e s
um
mary
of
tourn
am
ents
for
bass c
lubs p
art
icip
atin
g in
the 2
016 B
.A.I.
T. Pro
gra
m.
Lake
No. of
tournaments
No. of anglers
% of anglers w/
at least 1 fish
% of anglers w/
a limit of fish
Total hrs. fished
Total bass
caught
% largemouth
% spotted bass
% smallmouth
Percent of bass
released alive
Total lbs. of bass
Avg. bass
weight
Bass over 5lb.
Bass over 8lb.
Avg. big bass
weight
Avg. winning
weight
% success
(anglers w/ at
least 1 fish)
Bass per daya
Pounds per daya
Hrs. to catch a
bass over 5 lb.
Daysa to catch a
bass over 5 lb.
Bankh
ead
356
94.6
94.6
448
209
76.2
23.8
0.0
98
353
1.6
93
05.3
915.0
694.6
44.6
77.8
9149
15
Big
Cre
ek
116
43.8
0.0
136
12
100.0
0.0
0.0
100
21
1.7
30
03.0
8.
43.7
50.8
81.5
3.
.
Bart
letts F
err
y8
129
79.8
31.0
1032
350
44.0
56.0
0.0
99
535
1.5
33
04.9
110.2
479.8
53.3
95.1
9344
34
Cedar
231
87.1
51.6
226
74
71.6
28.4
0.0
97
78
1.0
60
02.9
54.3
187.1
03.2
73.4
6.
.
Cla
iborn
e3
40
80.0
30.0
327
105
64.8
35.2
0.0
96
144
1.3
70
03.6
010.5
980.0
03.2
24.4
0.
.
Dem
opolis
7446
54.5
37.4
4036
1057
82.1
17.9
0.0
96
2344
2.2
27
05.1
814.1
354.4
82.6
25.8
1281
28
Eufa
ula
52
1640
67.6
20.9
13676
3445
75.6
24.4
0.0
97
8674
2.5
289
25.4
514.1
367.6
22.5
26.3
4152
15
Gain
esville
5173
80.9
46.2
1572
553
92.8
7.2
0.0
98
993
1.8
08
04.6
812.9
180.9
33.5
26.3
2196
20
Gunte
rsville
38
1942
72.5
18.2
16561
4172
89.5
10.0
0.4
98
11787
2.8
397
12
6.4
017.8
672.5
02.5
27.1
2166
17
Harr
is13
235
85.5
52.3
1965
800
25.0
75.0
0.0
94
1395
1.7
419
15.7
812.4
385.5
34.0
77.1
088
9
Holt
375
73.3
60.0
593
240
44.8
55.2
0.0
99
468
1.9
52
05.4
816.1
273.3
34.0
57.9
0296
30
Jones B
luff
22
204
79.9
37.7
1736
667
39.9
60.1
0.0
96
1116
1.6
72
03.8
311.1
279.9
03.8
46.4
3868
87
Jord
an
15
319
78.7
49.8
2620
1029
38.5
61.5
0.0
97
2149
2.0
90
03.8
513.0
578.6
83.9
38.2
0.
.
Lay
15
717
80.5
43.7
5906
2157
51.2
48.8
0.0
98
4768
2.2
132
25.1
314.6
280.4
73.6
58.0
7185
18
Logan M
art
in27
432
95.4
56.7
4002
1834
29.9
70.1
0.0
90
2952
1.6
13
04.0
511.5
895.3
74.5
87.3
81227
123
Mart
in19
876
93.2
76.8
7154
3699
39.0
61.0
0.0
99
5970
1.6
114
15.0
312.7
993.1
55.1
78.3
5511
51
Mobile
Delta
46
1428
81.7
52.7
13082
4986
90.3
9.7
0.0
99
8945
1.7
915
03.7
611.8
781.6
53.8
16.8
4872
87
Millers
Ferr
y17
765
80.0
54.0
6494
2446
71.5
28.5
0.0
98
4707
1.9
221
05.1
215.4
480.0
03.7
77.2
5309
31
Mitc
hell
23
472
91.9
47.9
4093
1659
32.7
67.3
0.0
98
3179
1.9
26
04.3
212.7
891.9
54.0
57.7
7629
63
Neely
Henry
20
759
84.6
46.6
6878
2641
49.6
50.4
0.0
98
5009
1.9
016
04.5
912.4
484.5
93.8
47.2
8430
43
Pic
kwic
k50
2167
75.2
30.5
18340
5246
75.9
9.0
15.1
97
13594
2.5
958
76.2
118.1
875.2
22.8
67.4
1141
14
Sm
ith13
986
93.2
71.8
7886
3459
44.5
55.5
0.0
99
7449
2.1
56
04.9
513.4
893.2
14.3
99.4
51314
131
Tuscalo
osa
121
81.0
28.6
168
36
47.2
52.8
0.0
100
46
1.2
70
03.3
8.
80.9
52.1
42.7
2.
.
Upper
Bear
243
81.4
37.2
344
81
27.2
72.8
0.0
98
130
1.6
02
04.2
4.
81.4
02.3
53.7
6172
17
Weis
s14
416
86.5
38.0
3546
1333
49.2
50.8
0.0
97
2791
2.0
915
05.3
115.2
286.5
43.7
67.8
7236
24
Wheele
r11
425
93.2
60.2
5125
1943
66.6
14.9
18.5
98
3637
1.8
719
05.5
515.2
993.1
83.7
97.1
0228
23
Wils
on
12
348
90.5
62.9
3000
1288
92.8
0.3
6.9
97
2617
2.0
321
05.2
214.8
090.5
24.2
98.7
2143
14
West Poin
t22
337
86.4
32.9
3102
1124
27.4
72.6
0.0
91
1792
1.5
94
04.1
39.8
386.3
53.6
25.7
8719
72
Yate
s2
15
100.0
33.3
150
42
52.4
47.6
0.0
100
90
2.1
40
04.3
511.1
2100.0
02.8
06.0
0.
.
Gra
nd
To
tal
466
15513
80.1
42.5
134194
46687
61.3
36.8
1.9
97
97734
2.0
9462
25
4.9
213.8
380.1
23.4
87.2
8259
26
aa d
ay is
defined a
s o
ne a
ngle
r fishin
g f
or
10 h
ours

15
Table
2.
Rankin
g b
y q
ualit
y indic
ato
rs for
all
reserv
oirs w
ith fiv
e o
r m
ore
tourn
am
ent
report
s in t
he 2
016 B
.A.I.T
. P
rogra
m.
Perc
ent
Ave
rage B
ass
Bass p
er
Pounds p
er
Hours
per
Rank
Success
Weig
ht
Angle
r-D
ay
Angle
r-D
ay
Bass >
5 lbs.
Ove
rall
Valu
e
1Logan M
art
inG
unte
rsvi
lleM
art
inS
mith
Harr
isW
ilson
86
2S
mith
Pic
kw
ick
Logan M
art
inW
ilson
Pic
kw
ick
Sm
ith
77
3W
heele
rE
ufa
ula
Sm
ith
Mart
inW
ilson
Mart
in69
4M
art
inD
em
opolis
Wils
on
Jord
an
Eufa
ula
Weis
s68
5M
itchell
Lay
Harr
isLay
Gunte
rsvi
lleLay
67
6W
ilson
Sm
ith
Mitchell
Weis
sLay
Mitchell
66
7W
eis
sW
eis
sJo
rdan
Mitchell
Gain
esvi
lleH
arr
is66
8W
est
Poin
tJo
rdan
Jones B
luff
Pic
kw
ick
Wheele
rP
ickw
ick
62
9H
arr
isW
ilson
Neely
Henry
Logan M
art
inW
eis
sW
heele
r60
10
Neely
Henry
Mill
ers
Ferr
yM
obile
Delta
Neely
Henry
Dem
opolis
Logan M
art
in56
11
Mobile
Delta
Mitchell
Wheele
rM
illers
Ferr
yM
illers
Ferr
yN
eely
Henry
56
12
Gain
esvi
lleN
eely
Henry
Mill
ers
Ferr
yG
unte
rsvi
lleB
art
lett
s F
err
yJo
rdan
53
13
Lay
Wheele
rW
eis
sH
arr
isN
eely
Henry
Gunte
rsvi
lle53
14
Mill
ers
Ferr
yG
ain
esvi
lleLay
Wheele
rM
art
inM
illers
Ferr
y52
15
Jones B
luff
Mobile
Delta
West
Poin
tM
obile
Delta
Mitchell
Eufa
ula
45
16
Bart
lett
s F
err
yH
arr
isG
ain
esvi
lleJo
nes B
luff
West
Poin
tG
ain
esvi
lle43
17
Jord
an
Jones B
luff
Bart
lett
s F
err
yE
ufa
ula
Jones B
luff
Mobile
Delta
41
18
Pic
kw
ick
Mart
inP
ickw
ick
Gain
esvi
lleM
obile
Delta
Jones B
luff
37
19
Gunte
rsvi
lleLogan M
art
inD
em
opolis
Dem
opolis
Logan M
art
inD
em
opolis
37
20
Eufa
ula
West
Poin
tG
unte
rsvi
lleW
est
Poin
tS
mith
West
Poin
t31
21
Dem
opolis
Bart
lett
s F
err
yE
ufa
ula
Bart
lett
s F
err
yJo
rdan
Bart
lett
s F
err
y23

16
Table
3. T
ourn
am
ent sum
mary
for
bass c
lubs p
art
icip
atin
g in
the 2
016 B
.A.I.
T. Pro
gra
m.
Clu
b N
o.
No. of
tournaments
No. of anglers
% of anglers w/
at least 1 fish
% of anglers w/
a limit of fish
Total hrs. fished
Total bass
caught
% largemouth
% spotted bass
% smallmouth
Percent of bass
released alive
Total lbs. of
bass
Avg. bass
weight
Bass over 5lb.
Bass over 8lb.
Avg. big bass
weight
Avg. winning
weight
% success
(anglers w/ at
least 1 fish)
Bass per daya
Pounds per daya
Hrs. to catch a
bass over 5 lb.
Daysa to catch a
bass over 5 lb.
19
119
78.2
21.0
1030
258
70.6
29.4
0.0
100
390
1.5
10
02.9
77.8
278.1
52.5
03.7
9.
.
211
314
76.1
31.8
2457
814
24.8
75.2
0.0
98
1306
1.6
06
04.7
610.7
276.1
13.3
15.3
1409
41
313
143
86.0
37.1
1264
433
83.8
13.9
2.3
99
701
1.6
22
03.0
88.2
986.0
13.4
35.5
5632
63
412
193
90.7
48.2
1651
684
71.3
28.7
0.0
99
1241
1.8
11
03.8
010.8
890.6
74.1
47.5
21651
165
52
21
76.2
23.8
159
47
0.0
100.0
0.0
100
97
2.0
60
03.7
810.0
176.1
92.9
66.0
9.
.
63
92
80.4
75.0
736
363
27.5
72.5
0.0
99
672
1.8
52
05.3
216.0
880.4
34.9
39.1
4368
37
711
129
81.4
45.7
1133
419
23.2
76.9
0.0
98
699
1.6
71
04.1
410.3
381.4
03.7
06.1
71133
113
89
87
89.7
49.4
776
375
..
.99
737
1.9
65
04.5
116.9
489.6
64.8
39.4
9155
16
97
122
80.3
27.9
976
322
9.8
90.2
0.0
100
610
1.8
91
04.2
711.8
380.3
33.3
06.2
5976
98
10
8148
66.9
18.9
1162
309
68.0
32.0
0.0
96
573
1.8
611
05.2
613.9
066.8
92.6
64.9
3106
11
11
8571
77.2
55.5
5139
1921
88.9
11.1
0.0
97
3632
1.8
912
05.3
116.0
577.2
33.7
47.0
7428
43
12
8271
85.6
63.5
2439
1026
86.9
13.1
0.0
99
1868
1.8
25
04.7
414.6
885.6
14.2
17.6
6488
49
13
158
87.9
62.1
1044
384
..
.100
729
1.9
01
05.0
625.1
087.9
33.6
86.9
81044
104
14
8105
70.5
14.3
992
218
85.6
8.1
6.2
95
424
1.9
56
14.7
711.2
370.4
82.2
04.2
8165
17
15
13
627
91.7
43.4
5704
2517
..
.98
4947
1.9
723
05.8
115.7
991.7
14.4
18.6
7248
25
16
9272
86.8
58.5
2360
887
91.7
0.3
8.0
98
1928
2.1
721
05.7
816.7
486.7
63.7
68.1
7112
11
17
1230
33.5
26.1
2070
356
..
.99
835
2.3
5.
06.2
0.
33.4
81.7
24.0
3.
.
18
4716
95.4
82.8
5728
2608
..
.99
5614
2.1
53
06.6
915.5
495.3
94.5
59.8
01909
191
19
10
881
82.5
37.7
7048
2538
..
.99
4764
1.8
810
16.4
417.2
682.5
23.6
06.7
6705
70
20
680
87.5
55.0
626
283
72.0
28.0
0.0
95
486
1.7
21
04.5
613.8
887.5
04.5
27.7
7626
63
21
154
57.4
42.6
432
142
..
.100
413
2.9
111
29.2
924.9
657.4
13.2
99.5
639
4
22
138
50.0
31.6
380
74
100.0
0.0
0.0
93
222
3.0
06
06.6
9.
50.0
01.9
55.8
563
6
23
10
1159
68.0
14.3
9272
2087
..
.99
6061
2.9
038
78.6
822.8
067.9
92.2
56.5
4244
24
24
753
73.6
52.8
339
174
..
.98
281
1.6
20
03.0
78.5
473.5
85.1
38.3
0.
.
25
168
51.5
47.1
578
172
70.9
29.1
0.0
98
404
2.3
55
05.5
5.
51.4
72.9
86.9
8116
12
26
7273
88.3
54.2
2553
978
91.4
8.6
0.0
95
1932
1.9
814
05.2
515.0
488.2
83.8
37.5
7182
18
27
11
624
88.6
56.7
5356
1937
58.1
41.4
0.5
99
3571
1.8
418
05.3
114.4
388.6
23.6
26.6
7298
30
28
10
96
74.0
15.6
779
190
61.6
38.4
0.0
99
367
1.9
35
04.2
69.8
273.9
62.4
44.7
1156
16
29
124
54.2
45.8
192
61
19.7
80.3
0.0
95
94
1.5
50
04.5
3.
54.1
73.1
84.9
1.
.
30
7217
87.6
72.8
1953
897
99.6
0.4
0.0
100
1716
1.9
11
03.9
612.8
387.5
64.5
98.7
91953
195
31
637
64.9
24.3
328
81
59.3
39.5
1.2
100
201
2.4
83
04.7
714.3
964.8
62.4
76.1
3109
11
32
162
88.7
50.0
496
212
..
.97
794
3.7
49
07.6
127.0
588.7
14.2
716.0
055
6
33
12
1718
84.9
61.4
13744
6336
54.3
43.6
2.1
99
14623
2.3
150
46.8
221.6
184.9
24.6
110.6
4275
27
34
11
225
92.4
76.0
2217
948
..
.98
2006
2.1
211
05.1
115.7
092.4
44.2
89.0
5202
20
35
165
49.2
23.1
520
128
53.1
46.9
0.0
100
394
3.0
82
06.1
922.8
049.2
32.4
67.5
8260
26
aa d
ay is
defined a
s o
ne a
ngle
r fishin
g f
or
10 h
ours

17
Table
3. C
ont'd
.
Clu
b N
o.
No. of
tournaments
No. of anglers
% of anglers w/
at least 1 fish
% of anglers w/
a limit of fish
Total hrs. fished
Total bass
caught
% largemouth
% spotted bass
% smallmouth
Percent of bass
released alive
Total lbs. of
bass
Avg. bass
weight
Bass over 5lb.
Bass over 8lb.
Avg. big bass
weight
Avg. winning
weight
% success
(anglers w/ at
least 1 fish)
Bass per daya
Pounds per daya
Hrs. to catch a
bass over 5 lb.
Daysa to catch a
bass over 5 lb.
36
124
62.5
29.2
144
44
79.5
20.5
0.0
100
95
2.1
50
04.6
214.8
662.5
03.0
66.5
8.
.
37
110
50.0
40.0
80
21
90.5
9.5
0.0
90
37
1.7
50
03.5
010.5
050.0
02.6
34.5
9.
.
38
9298
83.9
57.0
2384
1086
37.5
62.5
0.0
85
1981
1.8
28
05.1
613.7
383.8
94.5
68.3
1298
30
39
4130
97.7
80.0
1040
586
..
..
1153
1.9
74
06.0
717.1
697.6
95.6
311.0
960
6
40
81134
71.2
28.0
10576
2878
59.8
29.7
10.5
99
5914
2.0
533
16.9
018.2
871.1
62.7
25.5
9320
32
41
12
235
80.9
46.4
1880
455
60.0
38.2
1.8
98
807
1.7
77
04.6
215.1
680.8
52.4
24.2
9269
27
42
129
86.2
37.9
232
98
..
.100
209
2.1
30
04.5
014.2
086.2
14.2
28.9
9.
.
43
8209
78.9
56.0
1672
602
..
..
1126
1.8
77
05.2
413.9
178.9
53.6
06.7
3239
24
44
341
65.9
36.6
321
108
..
.95
168
1.5
60
03.4
99.9
965.8
53.3
75.2
4.
.
45
13
99
89.9
36.4
1150
334
51.2
48.5
0.3
95
580
1.7
43
04.3
311.6
089.9
02.9
05.0
5383
38
46
11
160
86.9
50.6
1310
560
..
.97
1158
2.0
77
04.8
414.0
086.8
84.2
78.8
4187
19
47
39
1710
73.0
24.0
14535
3855
..
..
10373
2.6
936
56.1
918.6
773.0
42.6
57.1
4122
12
48
14
127
78.0
33.1
1016
333
..
.100
622
1.8
72
03.7
511.2
377.9
53.2
86.1
2508
51
49
102
1415
86.1
30.1
14223
4548
50.0
49.9
0.1
93
8179
1.8
071
44.7
111.6
986.0
83.2
05.7
5176
18
Gra
nd
To
tal
466
15513
80.1
42.5
134194
46687
61.3
36.8
1.9
97
97734
2.0
9462
25
4.9
213.8
380.1
23.4
87.2
8259
26
aa d
ay is
defined a
s o
ne a
ngle
r fishin
g f
or
10 h
ours
18
Club Name City State Representative Phone
4:19 Bass Club Clanton AL Mike Graham 205-294-1882
Alabama Association of General Contractors (AGC) Irondale AL Josh West 205-451-1400
Alabama B.A.S.S. Nation Auburn AL Darryl High 334-707-7355
Alabama Bass Federation Prattville AL Jim Sparrow 334-201-4135
Alabama Bass Trail Decatur AL Clay Baldis 256-309-9852
Alabama Children's Classic Bass Tournament Eufaula AL Sam Williams 334-355-5057
ALA-TENN Bass Club Law renceburg TN Jonathan Edw ards 931-762-5531
Auburn Anglers Auburn AL Logan Parks 334-332-6211
BASS Open Birmingham AL Gene Gilliland 405-317-9488
Bass Whackers Cusseta AL Don Hollingsw orth 334-745-5238
Bay Area Bassmasters Robertsdale AL Joe Barnett 251-931-3025
Belmont Bass Anglers Dennis MS Ben Davis 662-424-2405
Benning Bass Club Fort Mitchell AL Cris Cox 706-570-0886
BFL Bama Division Benton KY Leroy Hensley 270-252-1589
BFL Choo Choo Division Benton KY Alan Gray 270-703-5441
Bluff City Bassmasters Eufaula AL Jim How ard 334-616-1918
Boyd's Marine Tournament Trail Dothan AL Todd Schell 334-794-2598
Carbon Hill Bass Club Eldridge AL Mark Edmonds 205-389-2505
Christian Bassmen of Montgomery Pike Road AL Brian Selix 334-328-8163
Collinsville Bass Club Collinsville MS George Little 601-513-0429
Cullman Bassmasters Cullman AL Heath Laney 256-339-1901
Dannelly Air National Guard (DANG Bass Club) Prattville AL Jim Sparrow 334-201-4135
Delta Rendezvous Stapleton AL John Hall 251-379-6390
Dixie Bass Trail Saraland AL Earnest Rachel 251-599-3727
Fayette Bass Club Bankston AL Todd Tucker
Fishers of Men - Alabama South Brew ton AL Allen Couch 251-867-9852
FLW Tour Benton KY Bill Taylor 270-703-2564
Georgia Dept. of Natural Resources Social Circle GA Clint Peacock 478-988-7191
Goldsmith Sunday River Tournament Low ndesboro AL Robert Brow n 334-850-0338
Kow aliga Tallassee AL Hank Golden 334-354-3387
Lake Guntersville Bass Masters Grant AL Pete Pinkerton 530-604-2215
Last Chance Bass Club Montgomery AL Allen Coker 334-399-6734
Mediabass AL Foley AL Lloyd Bullock 251-550-5948
Miss. Div. Wildlife, Fisheries & Parks Jackson MS Stan Crider 601-432-2400
Mobile Bassmasters Mobile AL Bob Steele 251-661-9600
Mobile Boat Show Bass Tournament Mobile AL Robin Clark 251-605-3073
National Bass Trail (GA/AL) Cataula GA Blaine Souerw ine 706-577-6874
Neely Henry Bassmasters Anniston AL Earl Andrew s 256-820-1944
Nucor / Holt High School Alumni Cottondale AL Araina C. Champion 205-556-2065
OGS Tournament Trails Opelika AL Mike Oglesbee 386-546-3614
Panther Fishing Club Vance AL Tim Bentley 205-504-0675
Pine Level Bassmasters Prattville AL Jim Sparrow 334-201-4135
Pride of the South Vancleave MS Jeremy Bass 228-327-5941
Relay for Life Midland GA Timothy Watford 706-587-5996
Rumbling Waters B.A.S.S. Club Eclectic AL Tomy Gamble
S.P.A.N. of Tuscaloosa County Tuscaloosa AL Lindsey Holemon 205-554-0565
Southern Academy Booster Club Greensboro AL Mike Hall 334-624-7799
Southern Masters Mobile AL Robin Clark 251-605-3073
West Alabama Bass Fishermans Association Northport AL Stephen Wood 205-242-1236
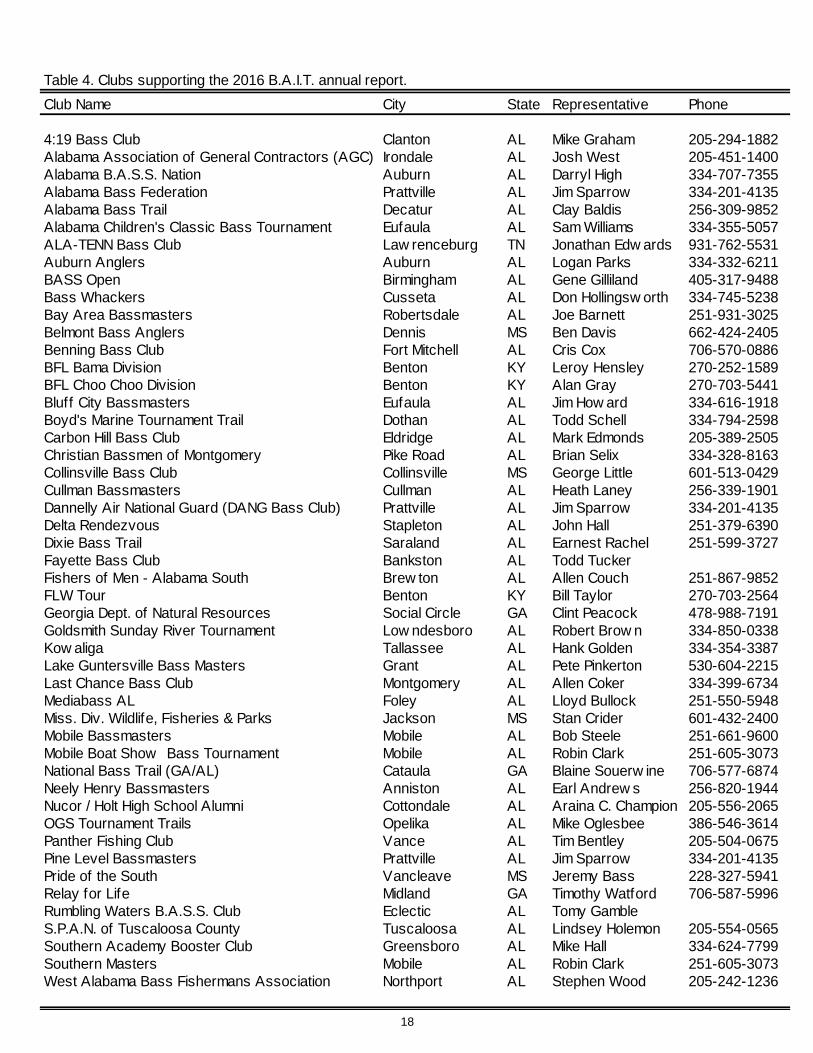
Table 4. Clubs supporting the 2016 B.A.I.T. annual report.

19
Table
5. S
tate
wid
e s
um
mary
of
bass tourn
am
ents
by m
onth
for
bass c
lubs p
art
icip
atin
g in
the 2
016 B
.A.I.
T. Pro
gra
m.
Month
No. of
tournaments
No. of anglers
% of anglers w/
at least 1 fish
% of anglers w/
a limit of fish
Total hrs. fished
Total bass
caught
% largemouth
% spotted bass
% smallmouth
Percent of bass
released alive
Total lbs. of
bass
Avg. bass
weight
Bass over 5lb.
Bass over 8lb.
Avg. big bass
weight
Avg. winning
weight
% success
(anglers w/ at
least 1 fish)
Bass per daya
Pounds per daya
Hrs. to catch a
bass over 5 lb.
Daysa to catch a
bass over 5 lb.
JAN
20
284
77.1
38.0
2317
774
22.2
77.8
0.0
100
1424
1.8
410
04.7
313.4
377.1
13.3
46.1
4232
23
FEB
41
1640
75.9
34.9
14002
4453
51.5
48.1
0.4
99
9568
2.1
558
45.5
415.5
575.9
13.1
86.8
3241
24
MA
R54
1876
80.5
45.8
15839
5878
62.5
37.0
0.5
99
12680
2.1
693
14
5.4
215.5
780.4
93.7
18.0
1169
17
APR
66
3796
78.0
43.8
31653
10831
63.2
33.7
3.1
98
23686
2.1
9103
25.5
415.2
878.0
33.4
27.4
8258
26
MA
Y51
2117
84.3
47.0
18478
6933
69.0
30.7
0.3
97
15057
2.1
758
15.0
515.0
784.2
73.7
58.1
5212
21
JUN
40
1252
85.6
56.9
12233
4669
60.6
32.7
6.7
96
9718
2.0
846
14.9
913.6
485.6
23.8
27.9
4257
26
JUL
32
600
79.3
35.2
5258
1573
81.3
18.5
0.2
94
3235
2.0
618
04.6
611.9
479.3
32.9
96.1
5292
29
AU
G30
794
74.1
34.1
6553
2012
82.9
16.4
0.7
94
3825
1.9
010
14.6
512.2
174.0
63.0
75.8
4575
58
SEP
45
1077
81.2
32.9
9249
2903
70.6
29.0
0.4
92
5617
1.9
325
04.1
611.7
181.1
53.1
46.0
7357
36
OC
T46
1460
80.4
37.5
13123
4501
52.5
46.7
0.7
98
8758
1.9
520
04.1
512.2
080.4
13.4
36.6
7579
58
NO
V26
399
83.2
46.6
3650
1380
45.6
54.4
0.0
99
2443
1.7
710
04.3
112.3
983.2
13.7
86.6
9344
34
DEC
15
218
88.5
49.5
1841
780
51.0
49.0
0.0
100
1725
2.2
111
25.0
616.1
688.5
34.2
49.3
7167
17
Gra
nd
To
tal
466
15513
80.1
42.5
134194
46687
61.3
36.8
1.9
97
97734
2.0
9462
25
4.9
213.8
380.1
23.4
87.2
8259
26
aa d
ay is
defined a
s o
ne a
ngle
r fishin
g f
or
10 h
ours

20
Table 6. Summary of bass tournaments by lake and month for bass clubs participating in the 2016 B.A.I.T. Program.
Lake Month
No. of
tourn
am
ents
No. of angle
rs
% s
uccess
(angle
rs w
/ at
least 1 fis
h)
Tota
l hrs
. fis
hed
Tota
l bass
caught
% la
rgem
outh
% s
potted b
ass
% s
mallm
outh
Perc
ent of bass
rele
ased a
live
Tota
l lbs. of bass
Avg. bass
weig
ht
Bass o
ver
5lb
.
Bass o
ver
8lb
.
Avg. big
bass
weig
ht
Avg. w
innin
g
weig
ht
Bass p
er
day
1
Pounds p
er
day1
Hrs
. to
catc
h a
bass o
ver
5 lb
.
Eufaula JAN . . . . . . . . . . . . . . . . . .
FEB 6 97 62.9 896 188 86.2 13.8 0.0 99 418 2.22 6 0 5.66 13.42 2.10 4.67 149
MAR 9 137 73.7 1245 423 82.9 17.1 0.0 99 1004 2.37 18 2 5.62 14.46 3.40 8.07 62
APR 12 624 66.0 5255 1237 77.8 22.2 0.0 97 2996 2.42 31 0 6.07 16.61 2.35 5.70 170
MAY 1 13 84.6 117 38 89.5 10.5 0.0 97 72 1.90 0 0 4.62 10.80 3.25 6.17 .
JUN 1 62 88.7 496 212 . . . 97 794 3.74 9 0 7.61 27.05 4.27 16.00 55
JUL 3 44 61.4 438 72 83.3 16.7 0.0 85 167 2.32 2 0 4.58 12.23 1.64 3.81 219
AUG 8 291 60.8 2299 436 97.4 2.6 0.0 92 943 2.16 4 0 5.11 12.99 1.90 4.10 575
SEP 4 69 62.3 523 94 72.3 27.7 0.0 94 182 1.94 4 0 4.51 9.17 1.80 3.48 131
OCT 5 259 73.4 2072 645 63.4 36.6 0.0 99 1902 2.95 10 0 4.64 14.58 3.11 9.18 207
NOV 3 44 72.7 335 100 74.0 26.0 0.0 100 196 1.96 5 0 5.92 13.84 2.99 5.86 67
DEC . . . . . . . . . . . . . . . . . .
Guntersville JAN . . . . . . . . . . . . . . . . . .
FEB 5 349 66.8 2794 565 96.1 2.0 2.0 100 1799 3.18 20 4 8.06 20.70 2.02 6.44 140
MAR 7 506 67.8 4327 1023 85.2 14.4 0.5 100 3168 3.10 29 6 7.47 24.08 2.36 7.32 149
APR 11 638 77.3 5159 1525 92.2 7.1 0.6 98 4097 2.69 21 1 5.75 16.80 2.96 7.94 246
MAY 5 103 92.2 1439 411 95.3 4.7 0.0 96 1067 2.60 13 1 6.56 19.16 2.86 7.42 79
JUN 1 17 88.2 136 45 . . . . 127 2.82 2 0 5.94 . 3.31 9.34 68
JUL 1 14 71.4 98 28 . . . 86 74 2.64 2 0 6.78 12.41 2.86 7.53 49
AUG . . . . . . . . . . . . . . . . . .
SEP 7 301 70.4 2496 562 100.0 0.0 0.0 80 1425 2.54 10 0 5.54 13.36 2.25 5.71 250
OCT 1 14 50.0 112 13 92.3 7.7 0.0 100 29 2.21 0 0 3.46 15.16 1.16 2.57 .
NOV . . . . . . . . . . . . . . . . . .
DEC . . . . . . . . . . . . . . . . . .
Harris JAN 2 24 95.8 192 107 21.5 78.5 0.0 100 185 1.73 4 0 6.66 14.16 5.57 9.64 48
FEB 2 45 86.7 360 138 15.9 84.1 0.0 99 227 1.65 4 0 4.72 11.98 3.83 6.31 90
MAR 2 38 94.7 337 160 27.2 72.8 0.0 93 283 1.77 8 1 7.72 16.34 4.75 8.39 42
APR . . . . . . . . . . . . . . . . . .
MAY 3 44 79.5 352 125 40.0 60.0 0.0 86 258 2.07 2 0 4.86 11.04 3.55 7.34 176
JUN 1 10 60.0 90 16 31.3 68.8 0.0 88 24 1.50 . 0 5.63 7.25 1.78 2.67 .
JUL . . . . . . . . . . . . . . . . . .
AUG 1 30 70.0 240 74 58.1 41.9 0.0 80 115 1.56 1 0 5.82 11.82 3.08 4.80 240
SEP . . . . . . . . . . . . . . . . . .
OCT . . . . . . . . . . . . . . . . . .
NOV 2 44 93.2 394 180 8.3 91.7 0.0 100 303 1.68 0 0 5.46 12.22 4.57 7.69 .
DEC . . . . . . . . . . . . . . . . . .
Jones Bluff JAN 1 22 63.6 176 37 . . . 100 92 2.49 0 0 4.53 17.59 2.10 5.24 .
FEB . . . . . . . . . . . . . . . . . .
MAR . . . . . . . . . . . . . . . . . .
APR 1 10 90.0 60 44 . . . 98 97 2.20 0 0 4.55 13.55 7.33 16.13 .
MAY 5 52 82.7 394 180 31.3 68.8 0.0 96 307 1.71 2 0 4.38 12.16 4.57 7.80 197
JUN 4 25 68.0 193 72 90.5 9.5 0.0 94 115 1.60 0 0 3.64 9.00 3.73 5.98 .
JUL 3 33 84.8 266 98 37.5 62.5 0.0 95 138 1.41 0 0 3.88 7.43 3.68 5.19 .
AUG 3 21 66.7 187 40 22.6 77.4 0.0 93 57 1.42 0 0 2.89 7.06 2.14 3.03 .
SEP 2 14 92.9 108 47 . . . 96 70 1.49 0 0 2.90 14.40 4.35 6.50 .
OCT 3 27 92.6 352 149 . . . 100 240 1.61 0 0 3.90 14.80 4.23 6.81 .
NOV . . . . . . . . . . . . . . . . . .
DEC . . . . . . . . . . . . . . . . . .
1a day is defined as one angler f ishing for 10 hours

21
Table 6. Cont'd.
Lake Month
No. of
tourn
am
ents
No. of angle
rs
% s
uccess
(angle
rs w
/ at
least 1 fis
h)
Tota
l hrs
. fis
hed
Tota
l bass
caught
% la
rgem
outh
% s
potted b
ass
% s
mallm
outh
Perc
ent of bass
rele
ased a
live
Tota
l lbs. of bass
Avg. bass
weig
ht
Bass o
ver
5lb
.
Bass o
ver
8lb
.
Avg. big
bass
weig
ht
Avg. w
innin
g
weig
ht
Bass p
er
day
1
Pounds p
er
day1
Hrs
. to
catc
h a
bass o
ver
5 lb
.
Jordan JAN 3 25 72.0 210 70 5.6 94.4 0.0 100 115 1.65 0 0 3.64 12.83 3.33 5.49 .
FEB . . . . . . . . . . . . . . . . . .
MAR 4 51 84.3 408 152 . . . 100 334 2.20 0 0 4.19 13.35 3.73 8.19 .
APR 2 22 95.5 195 83 26.5 73.5 0.0 100 180 2.17 0 0 3.76 12.53 4.26 9.24 .
MAY . . . . . . . . . . . . . . . . . .
JUN 1 143 76.9 1144 508 41.5 58.5 0.0 97 1134 2.23 0 0 4.95 18.37 4.44 9.91 .
JUL . . . . . . . . . . . . . . . . . .
AUG . . . . . . . . . . . . . . . . . .
SEP 3 44 77.3 391 105 37.7 62.3 0.0 97 187 1.78 0 0 3.40 11.75 2.69 4.77 .
OCT 1 28 75.0 224 92 39.1 60.9 0.0 89 167 1.81 0 0 4.36 14.36 4.11 7.44 .
NOV 1 6 66.7 48 19 . . . 100 32 1.69 0 0 3.13 10.31 3.96 6.69 .
DEC . . . . . . . . . . . . . . . . . .
Lay JAN . . . . . . . . . . . . . . . . . .
FEB 1 198 62.6 1584 323 65.0 35.0 0.0 100 730 2.26 4 0 6.16 19.15 2.04 4.61 396
MAR 1 160 93.1 1280 657 42.6 57.4 0.0 100 1659 2.53 7 2 8.08 25.29 5.13 12.96 183
APR 3 26 92.3 218 86 22.2 77.8 0.0 100 191 2.22 2 0 4.01 13.93 3.94 8.74 109
MAY 6 287 85.0 2432 960 54.6 45.4 0.0 96 1958 2.04 18 0 5.78 15.29 3.95 8.05 135
JUN . . . . . . . . . . . . . . . . . .
JUL . . . . . . . . . . . . . . . . . .
AUG . . . . . . . . . . . . . . . . . .
SEP . . . . . . . . . . . . . . . . . .
OCT 3 39 74.4 337 106 66.7 33.3 0.0 95 188 1.77 1 0 4.01 10.39 3.15 5.58 337
NOV 1 7 100.0 56 25 28.0 72.0 0.0 100 43 1.71 0 0 3.91 10.18 4.46 7.61 .
DEC . . . . . . . . . . . . . . . . . .
Logan Martin JAN . . . . . . . . . . . . . . . . . .
FEB 2 42 92.9 359 154 27.0 73.0 0.0 100 340 2.21 2 0 5.07 17.23 4.29 9.48 180
MAR . . . . . . . . . . . . . . . . . .
APR 3 84 100.0 685 384 12.0 88.0 0.0 99 656 1.71 0 0 4.40 13.69 5.61 9.58 .
MAY 3 29 96.6 232 118 38.6 61.4 0.0 97 170 1.44 0 0 4.01 10.04 5.09 7.34 .
JUN 7 99 94.9 1031 448 39.1 60.9 0.0 90 726 1.62 1 0 4.40 12.26 4.35 7.04 711
JUL . . . . . . . . . . . . . . . . . .
AUG 2 41 75.6 328 93 46.2 53.8 0.0 91 148 1.59 0 0 4.78 11.39 2.84 4.51 .
SEP 1 33 97.0 297 147 34.7 65.3 0.0 27 226 1.54 0 0 4.12 12.38 4.95 7.61 .
OCT 5 69 100.0 676 305 35.7 64.3 0.0 94 417 1.37 0 0 3.28 7.87 4.51 6.17 .
NOV 3 23 100.0 298 143 14.0 86.0 0.0 97 199 1.39 0 0 3.04 8.65 4.80 6.67 .
DEC 1 12 100.0 96 42 23.8 76.2 0.0 100 70 1.66 0 0 3.90 11.76 4.38 7.28 .
Martin JAN 4 78 88.5 624 290 6.2 93.8 0.0 100 451 1.56 2 0 5.26 12.14 4.65 7.23 312
FEB 4 242 92.1 1936 1071 37.7 62.3 0.0 97 1894 1.77 4 0 4.84 13.46 5.53 9.78 484
MAR 3 252 98.0 2027 1180 7.2 92.8 0.0 99 1769 1.50 2 1 6.00 14.00 5.82 8.73 1013
APR 3 190 93.7 1638 758 56.1 43.9 0.0 100 1202 1.59 6 0 6.13 13.94 4.63 7.34 273
MAY . . . . . . . . . . . . . . . . . .
JUN 1 30 86.7 240 59 13.6 86.4 0.0 97 77 1.30 0 0 4.17 8.39 2.46 3.20 .
JUL . . . . . . . . . . . . . . . . . .
AUG . . . . . . . . . . . . . . . . . .
SEP 1 9 88.9 90 39 15.4 84.6 0.0 97 62 1.59 0 0 4.08 11.93 4.33 6.88 .
OCT 1 43 93.0 344 198 50.5 49.5 0.0 99 354 1.79 0 0 4.62 15.15 5.76 10.28 .
NOV 1 19 84.2 152 62 43.5 56.5 0.0 100 92 1.48 0 0 3.10 10.88 4.08 6.05 .
DEC 1 13 69.2 104 42 . . . 100 70 1.67 0 0 3.78 10.97 4.04 6.76 .
1a day is defined as one angler f ishing for 10 hours

22
Table 6. Cont'd.
Lake Month
No. of
tourn
am
ents
No. of angle
rs
% s
uccess
(angle
rs w
/ at
least 1 fis
h)
Tota
l hrs
. fis
hed
Tota
l bass
caught
% la
rgem
outh
% s
potted b
ass
% s
mallm
outh
Perc
ent of bass
rele
ased a
live
Tota
l lbs. of bass
Avg. bass
weig
ht
Bass o
ver
5lb
.
Bass o
ver
8lb
.
Avg. big
bass
weig
ht
Avg. w
innin
g
weig
ht
Bass p
er
day
1
Pounds p
er
day1
Hrs
. to
catc
h a
bass o
ver
5 lb
.
Mobile Delta JAN 2 27 85.2 230 64 100.0 0.0 0.0 98 81 1.27 0 0 3.28 6.81 2.79 3.54 .
FEB 5 175 75.4 2076 685 93.0 7.0 0.0 100 1220 1.78 3 0 4.20 16.39 3.30 5.88 692
MAR 5 104 91.3 915 352 96.6 3.4 0.0 100 593 1.68 0 0 2.99 9.74 3.85 6.48 .
APR 3 259 75.3 2189 792 62.8 37.2 0.0 99 1345 1.70 3 0 5.48 15.38 3.62 6.15 730
MAY 4 161 89.4 1449 667 97.3 2.7 0.0 99 1321 1.98 1 0 4.58 14.54 4.60 9.11 1449
JUN 4 156 79.5 1393 564 96.5 3.5 0.0 96 1051 1.86 2 0 4.09 10.91 4.05 7.55 697
JUL 5 153 85.0 1367 551 96.4 3.6 0.0 98 1031 1.87 4 0 4.44 13.57 4.03 7.54 342
AUG 3 124 72.6 1116 396 93.9 6.1 0.0 97 680 1.72 0 0 3.86 12.71 3.55 6.09 .
SEP 6 125 88.8 1110 424 95.3 4.7 0.0 99 823 1.94 2 0 3.31 11.06 3.82 7.41 555
OCT 3 67 79.1 587 215 98.1 1.9 0.0 100 380 1.77 0 0 2.64 8.15 3.66 6.47 .
NOV 3 39 87.2 347 140 99.0 1.0 0.0 99 215 1.53 0 0 3.14 9.16 4.03 6.19 .
DEC 3 38 92.1 304 136 100.0 0.0 0.0 100 206 1.52 0 0 2.81 9.72 4.47 6.79 .
Millers Ferry JAN . . . . . . . . . . . . . . . . . .
FEB . . . . . . . . . . . . . . . . . .
MAR 4 286 68.9 2360 711 63.1 36.9 0.0 100 1454 2.04 9 0 5.83 17.29 3.01 6.16 262
APR 2 29 96.6 221 111 36.9 63.1 0.0 99 195 1.76 0 0 4.38 14.38 5.02 8.83 .
MAY 1 162 76.5 1296 601 . . . 99 1201 2.00 5 0 6.27 19.13 4.64 9.27 259
JUN 3 74 97.3 687 339 85.0 15.0 0.0 94 669 1.97 4 0 5.19 15.60 4.93 9.74 172
JUL 1 17 94.1 170 70 . . . 94 129 1.85 1 0 5.00 14.30 4.12 7.60 170
AUG 1 27 85.2 216 64 . . . . 115 1.80 0 0 4.44 . 2.96 5.32 .
SEP 4 156 89.1 1404 489 76.9 23.1 0.0 98 820 1.68 2 0 4.91 13.53 3.48 5.84 702
OCT . . . . . . . . . . . . . . . . . .
NOV 1 14 92.9 140 61 . . . 100 124 2.03 0 0 4.02 12.82 4.36 8.84 .
DEC . . . . . . . . . . . . . . . . . .
Mitchell JAN 1 9 100.0 72 40 . . . 100 97 2.43 0 0 4.50 18.82 5.56 13.47 .
FEB 3 28 78.6 233 76 8.3 91.7 0.0 100 147 1.93 0 0 3.99 15.68 3.26 6.31 .
MAR 1 26 100.0 247 123 . . . 99 307 2.49 1 0 5.40 18.92 4.98 12.41 247
APR 4 85 89.4 728 350 37.1 62.9 0.0 96 791 2.26 1 0 4.60 13.60 4.81 10.87 728
MAY 2 173 98.8 1384 564 . . . 100 995 1.76 2 0 4.94 17.35 4.08 7.19 692
JUN 2 16 81.3 144 52 65.4 34.6 0.0 92 81 1.56 1 0 4.51 11.78 3.61 5.65 144
JUL . . . . . . . . . . . . . . . . . .
AUG 1 4 100.0 32 8 50.0 50.0 0.0 100 15 1.86 0 0 3.14 5.16 2.50 4.65 .
SEP 3 43 76.7 504 116 17.1 82.9 0.0 97 194 1.67 0 0 4.06 8.49 2.30 3.85 .
OCT 3 39 94.9 337 139 25.4 74.6 0.0 99 230 1.65 1 0 4.79 12.02 4.12 6.82 337
NOV 2 29 86.2 232 104 . . . 100 156 1.50 0 0 2.95 9.42 4.48 6.71 .
DEC 1 20 90.0 180 87 . . . 100 167 1.92 0 0 4.58 16.38 4.83 9.27 .
Neely Henry JAN 1 13 76.9 104 27 . . . 100 56 2.06 1 0 5.44 12.36 2.60 5.36 104
FEB 3 109 61.5 872 174 . . . 100 419 2.41 2 0 5.54 13.65 2.00 4.81 436
MAR . . . . . . . . . . . . . . . . . .
APR 1 26 92.3 260 74 67.6 32.4 0.0 96 167 2.25 3 0 5.61 16.42 2.85 6.41 87
MAY 1 146 87.7 1168 615 46.5 53.5 0.0 98 1359 2.21 3 0 5.61 18.12 5.27 11.64 389
JUN 1 30 96.7 270 131 79.4 20.6 0.0 92 256 1.96 2 0 5.36 13.49 4.85 9.49 135
JUL 2 21 90.5 168 64 51.6 48.4 0.0 95 104 1.62 0 0 3.69 10.51 3.81 6.17 .
AUG 2 18 88.9 144 39 82.1 17.9 0.0 97 62 1.60 0 0 3.52 8.20 2.71 4.33 .
SEP 1 14 92.9 112 48 . . . 100 92 1.92 0 0 3.31 14.23 4.29 8.24 .
OCT 8 382 88.0 3780 1469 44.1 55.9 0.0 99 2494 1.70 5 0 4.44 11.69 3.89 6.60 756
NOV . . . . . . . . . . . . . . . . . .
DEC . . . . . . . . . . . . . . . . . .
1a day is defined as one angler f ishing for 10 hours

23
Table 6. Cont'd.
Lake Month
No. of
tourn
am
ents
No. of angle
rs
% s
uccess
(angle
rs w
/ at
least 1 fis
h)
Tota
l hrs
. fis
hed
Tota
l bass
caught
% la
rgem
outh
% s
potted b
ass
% s
mallm
outh
Perc
ent of bass
rele
ased a
live
Tota
l lbs. of bass
Avg. bass
weig
ht
Bass o
ver
5lb
.
Bass o
ver
8lb
.
Avg. big
bass
weig
ht
Avg. w
innin
g
weig
ht
Bass p
er
day
1
Pounds p
er
day1
Hrs
. to
catc
h a
bass o
ver
5 lb
.
Pickw ick JAN 2 28 46.4 238 36 . . . . 124 3.46 3 0 6.93 16.35 1.51 5.23 79
FEB 3 71 77.5 590 132 . . . . 361 2.74 2 0 6.28 17.19 2.24 6.13 295
MAR 3 50 72.0 461 141 75.0 15.0 10.0 100 392 2.78 6 2 5.77 17.24 3.06 8.51 77
APR 4 513 71.7 4307 1179 80.2 2.2 17.6 99 2865 2.43 7 1 7.29 18.32 2.74 6.65 212
MAY 9 721 79.3 6129 1907 . . . . 4935 2.59 4 0 5.37 19.28 3.11 8.05 85
JUN 4 147 85.7 1242 430 64.4 22.1 13.4 93 1053 2.45 9 1 6.71 19.89 3.46 8.48 138
JUL 5 86 82.6 702 228 96.2 0.0 3.8 90 695 3.05 8 0 5.61 17.72 3.25 9.90 88
AUG 3 44 77.3 362 107 76.1 10.9 13.0 98 273 2.55 1 1 6.35 18.15 2.96 7.54 362
SEP 2 12 83.3 102 49 . . . . 120 2.45 1 0 3.89 14.01 4.80 11.78 102
OCT 4 312 66.0 2652 524 . . . . 1260 2.41 1 0 6.07 14.27 1.98 4.75 1105
NOV 5 95 68.4 808 209 . . . 100 537 2.57 5 0 5.54 15.38 2.59 6.65 162
DEC 6 88 84.1 748 304 . . . . 977 3.21 11 2 7.31 23.83 4.06 13.06 68
Smith JAN 3 42 78.6 336 91 12.1 87.9 0.0 100 201 2.20 0 0 3.81 11.67 2.71 5.97 .
FEB 2 159 91.2 1263 615 58.5 41.5 0.0 99 1387 2.25 2 0 5.83 15.49 4.87 10.98 632
MAR . . . . . . . . . . . . . . . . . .
APR 5 723 95.2 5791 2623 6.7 93.3 0.0 99 5645 2.15 4 0 6.14 13.20 4.53 9.75 1448
MAY . . . . . . . . . . . . . . . . . .
JUN . . . . . . . . . . . . . . . . . .
JUL 1 19 73.7 152 21 14.3 85.7 0.0 100 36 1.72 0 0 4.42 . 1.38 2.38 .
AUG . . . . . . . . . . . . . . . . . .
SEP . . . . . . . . . . . . . . . . . .
OCT 2 43 90.7 344 109 3.7 96.3 0.0 94 181 1.66 0 0 4.28 13.97 3.17 5.25 .
NOV . . . . . . . . . . . . . . . . . .
DEC . . . . . . . . . . . . . . . . . .
Weiss JAN . . . . . . . . . . . . . . . . . .
FEB . . . . . . . . . . . . . . . . . .
MAR . . . . . . . . . . . . . . . . . .
APR 1 9 66.7 72 17 70.6 29.4 0.0 94 44 2.58 1 0 5.33 15.57 2.36 6.09 72
MAY 1 9 88.9 72 30 63.3 36.7 0.0 100 69 2.30 2 0 5.19 18.75 4.17 9.59 36
JUN 3 150 78.0 1214 496 37.9 62.1 0.0 98 1181 2.38 7 0 5.73 17.59 4.09 9.73 173
JUL 3 66 89.4 702 161 66.5 33.5 0.0 88 326 2.02 0 0 5.10 14.32 2.29 4.64 .
AUG . . . . . . . . . . . . . . . . . .
SEP 5 170 92.9 1384 569 69.7 30.3 0.0 98 1048 1.84 5 0 5.44 13.32 4.11 7.57 277
OCT . . . . . . . . . . . . . . . . . .
NOV 1 12 100.0 102 60 . . . 100 123 2.05 0 0 4.16 16.43 5.88 12.07 .
DEC . . . . . . . . . . . . . . . . . .
Wheeler JAN . . . . . . . . . . . . . . . . . .
FEB 1 34 82.4 272 75 85.3 1.3 13.3 100 127 1.69 4 0 6.31 17.88 2.76 4.66 68
MAR . . . . . . . . . . . . . . . . . .
APR 1 10 100.0 160 67 76.1 16.4 7.5 99 131 1.96 1 0 5.13 . 4.19 8.20 160
MAY 1 6 50.0 57 12 91.7 0.0 8.3 100 30 2.51 0 0 4.13 13.56 2.11 5.29 .
JUN 1 188 94.1 3008 972 58.5 19.5 21.9 98 1785 1.84 8 0 7.46 17.52 3.23 5.93 376
JUL . . . . . . . . . . . . . . . . . .
AUG 4 130 97.7 1040 586 . . . . 1153 1.97 4 0 6.07 16.58 5.63 11.09 60
SEP . . . . . . . . . . . . . . . . . .
OCT 3 57 89.5 588 231 90.5 0.0 9.5 97 410 1.78 2 0 4.92 12.54 3.93 6.98 294
NOV . . . . . . . . . . . . . . . . . .
DEC . . . . . . . . . . . . . . . . . .
1a day is defined as one angler f ishing for 10 hours

Table 6. Cont'd.
Lake Month
No. of
tourn
am
ents
No. of angle
rs
% s
uccess
(angle
rs w
/ at
least 1 fis
h)
Tota
l hrs
. fis
hed
Tota
l bass
caught
% la
rgem
outh
% s
potted b
ass
% s
mallm
outh
Perc
ent of bass
rele
ased a
live
Tota
l lbs. of bass
Avg. bass
weig
ht
Bass o
ver
5lb
.
Bass o
ver
8lb
.
Avg. big
bass
weig
ht
Avg. w
innin
g
weig
ht
Bass p
er
day
1
Pounds p
er
day1
Hrs
. to
catc
h a
bass o
ver
5 lb
.
Wilson JAN . . . . . . . . . . . . . . . . . .
FEB . . . . . . . . . . . . . . . . . .
MAR 1 37 97.3 333 162 93.2 0.6 6.2 100 401 2.48 7 0 7.00 20.00 4.86 12.05 48
APR 4 141 98.6 1156 613 89.7 0.9 9.3 97 1169 1.91 8 0 5.29 13.90 5.30 10.11 145
MAY 4 101 85.1 890 339 96.0 0.0 4.0 97 635 1.87 5 0 5.13 14.45 3.81 7.14 178
JUN 1 31 87.1 279 79 86.1 0.0 13.9 95 206 2.61 1 0 6.56 . 2.83 7.40 279
JUL . . . . . . . . . . . . . . . . . .
AUG . . . . . . . . . . . . . . . . . .
SEP 1 24 75.0 216 69 91.3 0.0 8.7 97 170 2.46 0 0 4.75 20.09 3.19 7.87 .
OCT 1 14 64.3 126 26 100.0 0.0 0.0 100 35 1.36 0 0 2.64 8.58 2.06 2.82 .
NOV . . . . . . . . . . . . . . . . . .
DEC . . . . . . . . . . . . . . . . . .
West Point JAN . . . . . . . . . . . . . . . . . .
FEB . . . . . . . . . . . . . . . . . .
MAR 8 118 92.4 1004 471 29.3 70.7 0.0 93 829 1.76 4 0 4.69 12.67 4.69 8.26 251
APR 1 28 85.7 224 63 38.1 61.9 0.0 87 93 1.48 . 0 5.53 8.14 2.81 4.16 .
MAY 2 41 90.2 455 136 36.8 63.2 0.0 96 239 1.76 0 0 4.51 9.23 2.99 5.27 .
JUN 1 13 69.2 104 19 52.6 47.4 0.0 100 30 1.58 0 0 4.84 7.20 1.83 2.89 .
JUL 3 27 48.1 216 24 62.5 37.5 0.0 92 37 1.53 0 0 4.04 4.40 1.11 1.70 .
AUG 1 13 69.2 104 22 27.3 72.7 0.0 73 30 1.36 0 0 3.25 7.81 2.12 2.88 .
SEP 2 23 73.9 184 41 22.0 78.0 0.0 56 46 1.12 0 0 2.20 5.60 2.23 2.50 .
OCT 2 38 97.4 360 182 17.6 82.4 0.0 87 264 1.45 0 0 3.12 11.75 5.06 7.33 .
NOV 1 17 100.0 281 99 12.1 87.9 0.0 99 130 1.31 0 0 3.88 14.94 3.53 4.63 .
DEC 1 19 100.0 171 67 17.9 82.1 0.0 100 94 1.40 0 0 3.98 9.84 3.92 5.47 .
1a day is defined as one angler f ishing for 10 hours
24

25
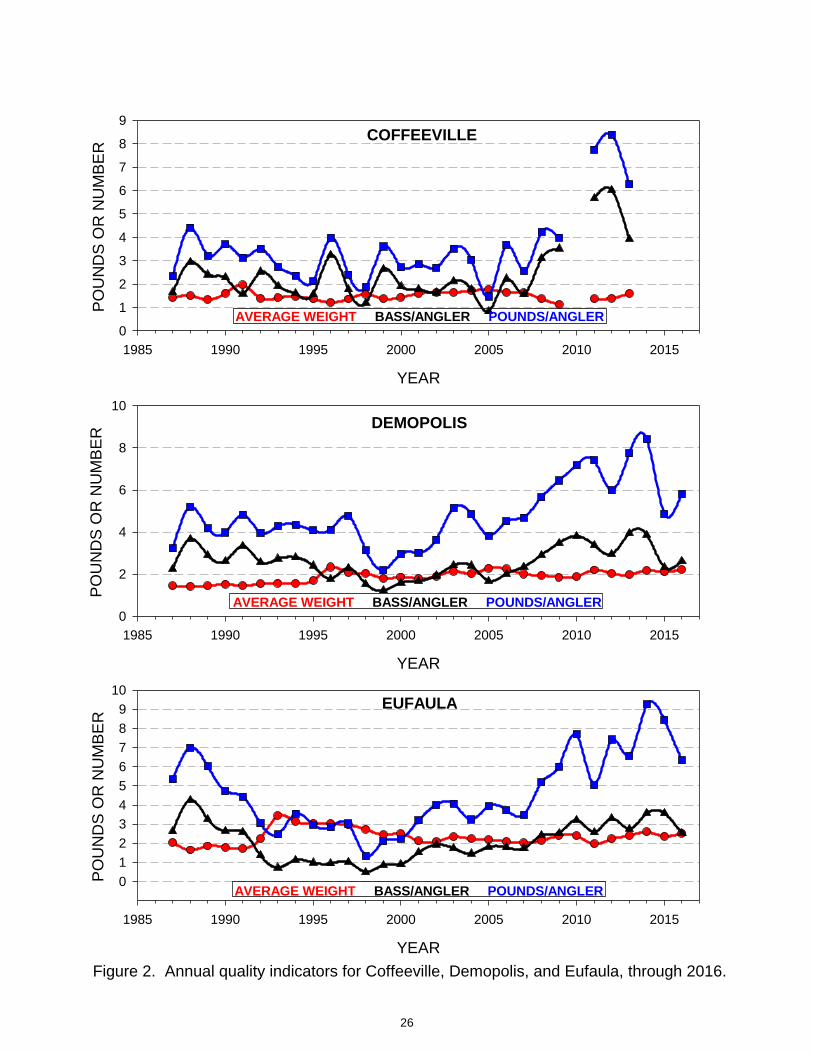
Figure 2. Annual quality indicators for Coffeeville, Demopolis, and Eufaula, through 2016.
YEAR
1985 1990 1995 2000 2005 2010 2015
PO
UN
DS
OR
NU
MB
ER
0
1
2
3
4
5
6
7
8
9
YEAR
1985 1990 1995 2000 2005 2010 2015
PO
UN
DS
OR
NU
MB
ER
0
2
4
6
8
10
AVERAGE WEIGHT BASS/ANGLER POUNDS/ANGLER
COFFEEVILLE
AVERAGE WEIGHT BASS/ANGLER POUNDS/ANGLER
DEMOPOLIS
YEAR
1985 1990 1995 2000 2005 2010 2015
PO
UN
DS
OR
NU
MB
ER
0
1
2
3
4
5
6
7
8
9
10EUFAULA
AVERAGE WEIGHT BASS/ANGLER POUNDS/ANGLER
26

YEAR
1985 1990 1995 2000 2005 2010 2015
PO
UN
DS
OR
NU
MB
ER
0
2
4
6
8
YEAR
1985 1990 1995 2000 2005 2010 2015
PO
UN
DS
OR
NU
MB
ER
0
2
4
6
8
10
12
AVERAGE WEIGHT BASS/ANGLER POUNDS/ANGLER
GAINESVILLE
AVERAGE WEIGHT BASS/ANGLER POUNDS/ANGLER
GUNTERSVILLE
YEAR
1985 1990 1995 2000 2005 2010 2015
PO
UN
DS
OR
NU
MB
ER
0
1
2
3
4
5
6HARDING
AVERAGE WEIGHT BASS/ANGLER POUNDS/ANGLER
Figure 3. Annual quality indicators for Gainesville, Guntersville, and Harding, through 2016.
27

YEAR
1985 1990 1995 2000 2005 2010 2015
PO
UN
DS
OR
NU
MB
ER
0
2
4
6
8
10
YEAR
1985 1990 1995 2000 2005 2010 2015
PO
UN
DS
OR
NU
MB
ER
0
1
2
3
4
5
6
7
8
9
AVERAGE WEIGHT BASS/ANGLER POUNDS/ANGLER
HARRIS
AVERAGE WEIGHT BASS/ANGLER POUNDS/ANGLER
JONES BLUFF
YEAR
1985 1990 1995 2000 2005 2010 2015
PO
UN
DS
OR
NU
MB
ER
0
1
2
3
4
5
6
7
8
9
10
11JORDAN
AVERAGE WEIGHT BASS/ANGLER POUNDS/ANGLER
Figure 4. Annual quality indicators for Harris, Jones Bluff, and Jordan, through 2016.
28

YEAR
1985 1990 1995 2000 2005 2010 2015
PO
UN
DS
OR
NU
MB
ER
0
2
4
6
8
10
YEAR
1985 1990 1995 2000 2005 2010 2015
PO
UN
DS
OR
NU
MB
ER
0
1
2
3
4
5
6
7
8
9
10
AVERAGE WEIGHT BASS/ANGLER POUNDS/ANGLER
LAY
AVERAGE WEIGHT BASS/ANGLER POUNDS/ANGLER
LOGAN MARTIN
YEAR
1985 1990 1995 2000 2005 2010 2015
PO
UN
DS
OR
NU
MB
ER
0
1
2
3
4
5
6
7
8
9MARTIN
AVERAGE WEIGHT BASS/ANGLER POUNDS/ANGLER
Figure 5. Annual quality indicators for Lay, Logan Martin, and Martin, through 2016.
29

YEAR
1985 1990 1995 2000 2005 2010 2015
PO
UN
DS
OR
NU
MB
ER
0
1
2
3
4
5
6
7
8
9
AVERAGE WEIGHT BASS/ANGLER POUNDS/ANGLER
MITCHELL
YEAR
1985 1990 1995 2000 2005 2010 2015
PO
UN
DS
OR
NU
MB
ER
0
1
2
3
4
5
6
7
8MOBILE DELTA
AVERAGE WEIGHT BASS/ANGLER POUNDS/ANGLER
Figure 6. Annual quality indicators for Millers Ferry, Mitchell, and the Mobile Delta, through 2016.
YEAR
1985 1990 1995 2000 2005 2010 2015
PO
UN
DS
OR
NU
MB
ER
0
2
4
6
8
10
12
AVERAGE WEIGHT BASS/ANGLER POUNDS/ANGLER
MILLERS FERRY
30
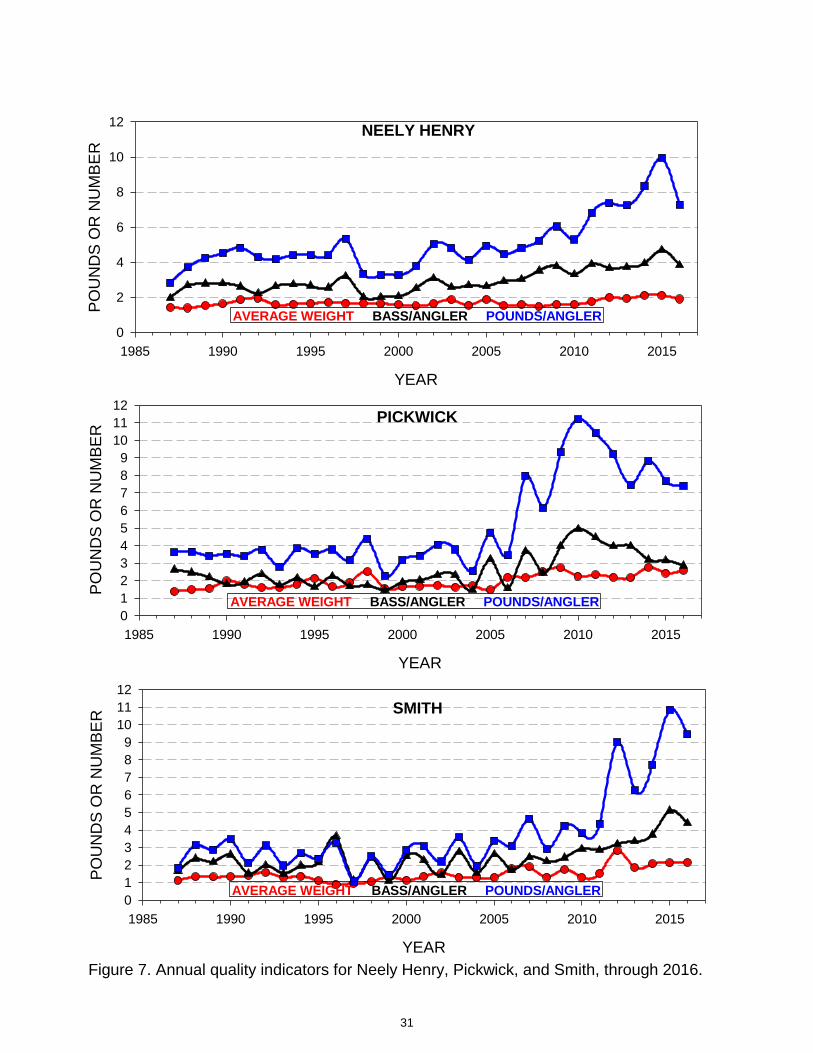
YEAR
1985 1990 1995 2000 2005 2010 2015
PO
UN
DS
OR
NU
MB
ER
0
2
4
6
8
10
12
YEAR
1985 1990 1995 2000 2005 2010 2015
PO
UN
DS
OR
NU
MB
ER
0
1
2
3
4
5
6
7
8
9
10
11
12
AVERAGE WEIGHT BASS/ANGLER POUNDS/ANGLER
NEELY HENRY
AVERAGE WEIGHT BASS/ANGLER POUNDS/ANGLER
PICKWICK
YEAR
1985 1990 1995 2000 2005 2010 2015
PO
UN
DS
OR
NU
MB
ER
0
1
2
3
4
5
6
7
8
9
10
11
12
SMITH
AVERAGE WEIGHT BASS/ANGLER POUNDS/ANGLER
Figure 7. Annual quality indicators for Neely Henry, Pickwick, and Smith, through 2016.
31

YEAR
1985 1990 1995 2000 2005 2010 2015
PO
UN
DS
OR
NU
MB
ER
0
2
4
6
8
10
YEAR
1985 1990 1995 2000 2005 2010 2015
PO
UN
DS
OR
NU
MB
ER
0
1
2
3
4
5
6
7
8
9
AVERAGE WEIGHT BASS/ANGLER POUNDS/ANGLER
WARRIOR
AVERAGE WEIGHT BASS/ANGLER POUNDS/ANGLER
WEISS
YEAR
1985 1990 1995 2000 2005 2010 2015
PO
UN
DS
OR
NU
MB
ER
0
1
2
3
4
5
6
7
WEST POINT
AVERAGE WEIGHT BASS/ANGLER POUNDS/ANGLER
Figure 8. Annual quality indicators for Warrior, Weiss, and West Point, through 2016.
32

YEAR
1985 1990 1995 2000 2005 2010 2015
PO
UN
DS
OR
NU
MB
ER
0
2
4
6
8
10
12
YEAR
1985 1990 1995 2000 2005 2010 2015
PO
UN
DS
OR
NU
MB
ER
0123456789
1011121314
AVERAGE WEIGHT BASS/ANGLER POUNDS/ANGLER
WHEELER
AVERAGE WEIGHT BASS/ANGLER POUNDS/ANGLER
WILSON
Figure 9. Annual quality indicators for Wheeler and Wilson, through 2016.
33

Other Topics
TOURNAMENT PERMITS
The Alabama Division of Wildlife & Freshwater Fisheries does not
require tournament organizations to secure tournament permits for any of
their events. However, the Alabama Law Enforcement Agency (ALEA),
Department of Public Safety (DPS), Marine Patrol requires a Marine Event
Permit for any event (including bass tournaments) with more than 100
boats participating. Applications can be obtained from the ALEA Marine
Patrol free of charge by calling (334) 242-3630, and must be completed
and submitted to them at least 15 days prior to the event.
The U.S. Army Corps of Engineers also requires a Special Use
Permit for bass tournaments with more than 10 boats which are held on
any of their reservoirs. Corps permits must be submitted 30 days prior to
the event, and can be obtained from your local project office or from their
website at: http://www.sam.usace.army.mil/Missions/Civil-
Works/Recreation/.
CORPS OF ENGINEERS ANNUAL DAY USE PERMITS
Annual passes can be obtained from the guard station at all park
entrances, or by contacting your local Corp of Engineers Resources
Management office. These passes allow you to use any boat ramp
operated and maintained by the Corps of Engineers, nationwide. The
charge for these permits is $40 and is good for one year from the date of
purchase. Local and regional offices are listed below.
Alabama River Lakes Site Office (Hayneville) 334-872-9554
Millers Ferry Resource Office (Camden) 334-682-4244
Holt Resource Office (Peterson) 205-553-9373
Black Warrior/Tombigbee Project Mgmt. Office (Tuscaloosa) 205-752-3571
Demopolis Site Office (Demopolis) 334-289-3540
Tennessee-Tombigbee Waterway Office (Carrollton) 205-373-8705
TRAILER TOURNAMENTS
Any tournaments where rules permit anglers to fish in various water
bodies and then bring their catch to a particular lake for a weigh-in where
fish are then released alive into that body of water are in direct violation of
Alabama’s Public Water Stocking (220-2-.129) regulation. Moving live fish
from one lake to another can have a number of detrimental consequences;
examples include 1) moving fish caught from lakes with consumption
advisories into lakes without advisories, 2) introducing genetically inferior
strains of spotted bass into our world-class spotted bass fisheries of the
Coosa River, 3) introducing diseases such as the Largemouth Bass Virus
which decimated many of our bass fisheries in Alabama beginning in the
late 1990’s, 4) diluting the genetic benefits of our Florida bass stocking
program, and 5) introducing non-native, potentially harmful species into
lakes where they do not currently exist.
It is important for anglers to know that only the act of releasing fish
into a body of water other than where they were caught is
illegal. If tournament organizations want to continue to offer these
types of tournaments to their competitors, they are certainly free to do
so as long as the fish brought in from other reservoirs are not
released there. If you participate in one of these tournaments, do not
release your fish into a lake you did not catch them from. Your
fish can be eaten, donated to a charitable organization such as an
orphanage, or returned to the reservoir from which they were caught.
Fish can only be moved legally from one reservoir to another if they
are transported by boat through a navigable lock.
CATCH-AND-RELEASE
Access area creel surveys conducted by Wildlife & Freshwater
Fisheries biologists have revealed a significant decline in bass
harvest rates, statewide. In 2016, nearly 100% of all bass caught
from public waters were released.
As the catch-and-release ethic has evolved during the last 20
years due to intense promotion by tournament organizations and
participants, many well-intentioned anglers have become so
passionate about this angling ethic that they feel a moral obligation to
release every bass they catch, which often leads them to make some
poor choices with regard to the handling of their fish.
An unfortunate consequence of catch-and-release is that
tournament anglers are often so focused on releasing their fish alive,
that they sometimes fail to recognize when a fish is too far gone to
survive the stress. Making this mistake can result in numerous dead
fish floating in the water around the boat ramp the following day. The
number of complaints received by ADCNR accusing tournament
anglers of killing and wasting fish during organized bass tournaments
is on the rise, so please encourage your anglers to be aware of this
growing problem, and consider adopting tournament rules that
discourage the release of fish in poor condition following bass
tournaments. Recommended guidelines for tournament weigh-in
procedures can be found at: http://www.outdooralabama.com/catch-
and-release.
34

Tournament Website
Please let other tournament anglers know
about this website, and if you have
questions or comments call 334-242-3471.
This website exists for your convenience
and we welcome any suggestions you might
have that would improve this valuable tool.
www.outdooralabama.com/tournaments
Type the above link into your web browser to access the improved “Fishing Tournaments” webpage
where you can post your tournaments or view those posted by other organizations.
Select from these
options to search all
tournaments being
held statewide.
Click here to post
information about
your tournament,
then . . .
enter your tournament
information including
contacts, a link to
your website, or even
a copy of the
registration form.
35

Boating Access The Alabama Division of Wildlife & Freshwater Fisheries maintains
113 public boating access areas statewide. Several of these facilities
received upgrades during 2016, and two new facilities were completed. For
more information on ADCNR freshwater boating access, visit
boatramps.dcnr.alabama.gov/.
Pollard Landing (Conecuh River)
A new boat ramp at Pollard Landing near Brewton was completed
winter 2016. The facility includes a 15’ wide launching slab and paved
parking for 17 truck and trailer rigs. The project was completed in
cooperation with the Escambia County Commission.
Cedar Bluff (Weiss)
Alabama Power Company repaved the parking lot with asphalt and
ADCNR restriped the parking lot with thermoplastic striping in a
configuration that makes it more boater friendly. The parking lot now
accommodates 71 truck and trailer rigs.
Shoal Creek (Wilson)
Construction was completed on a new boat landing directly across
Hwy. 72 from the old Shoal Creek Boat Landing. The ramp includes a 20’
wide launching slab, paved parking for 36 truck and trailer rigs and a prep
area to accommodate one truck and trailer rig. This project was completed
in cooperation with the Alabama Department of Transportation.
Shoal Creek (Wilson)
Chocolatta Bay Boat Ramp (Mobile Delta)
A new 4’x80’ stationary access pier with thru-flow decking was
installed to replace an old pier that had received significant flood
damage.
Claysville (Guntersville)
A new 6’x20’ floating access pier was installed to replace an
old pier that had received significant flood damage.
Second Creek (Wheeler)
A new 8’x30’ floating access pier was installed to replace an
old pier that had received significant flood damage
Hokes Bluff (Neely Henry)
Alabama Power Co. constructed new sidewalks to provide
handicap access to the existing pier.
Leesburg (Weiss)
ADCNR is working in cooperation with the Town of Leesburg
to provide a major boat ramp facility on Weiss Lake. The property
containing the boat ramp is leased to ADCNR from Alabama Power
Co. Phase one of two will be completed by summer 2018 and
phase two will be completed fall of 2020. Phase one of the project
includes construction of a new 60’ wide concrete launching slab,
paved entrance / exit roads with make ready and tie down areas,
paved parking for approximately 113 truck and trailer rigs, a gravel
overflow parking area to accommodate approximately 150 parking
spaces for truck / trailer rigs and construction of two 50’ floating
piers. Phase two will include the construction of a 412’ wharf style
pier with 18 finger piers.
Canoe Creek (Neely Henry)
Construction is ongoing at Canoe Creek to build a new
boating access facility. The ramp is anticipated to be opened in
summer 2017 and will include a 4 lane boat ramp, paved parking for
80 truck and trailer rigs, prep areas to accommodate 12 truck and
trailer rigs, two 100’ floating access piers and two fixed boardwalk
piers. The project is under construction in cooperation with St. Clair
County Commission.
Pollard Landing (Conecuh River)
Three bulldozers ready to push in ramp slab at Canoe
Creek (Neely Henry)
36

Habitat Enhancement Habitat is a pillar that allows all organisms to thrive. As our
reservoirs continue to age, we need to curtail loss of habitat and explore
ways to effectively manage our watersheds for the benefit of our natural
resources and the public. Our program intends to efficiently attract fish
in our state’s reservoirs, produce more fish if habitat is a limiting factor in
a particular waterbody, improve water quality in our streams, rivers and
reservoirs, and monitor effectiveness. Our efforts should increase angler
success, improve fishery health, water quality and contribute research
data and ideas for use by other resource managers.
In 2016, the Habitat Enhancement and Restoration Team
completed a number of reservoir habitat restoration projects, and
prepared for many upcoming enhancement activities. Since the first
year of the program (2015) over 2,600 fish attractors have been installed
throughout the state.
While most of the projects have focused on fish attraction (i.e.
artificial structures), other projects are aimed to enhance fish production.
The Environmental Affairs Division of Alabama Power Co. and other
partners have assisted with many projects, including transplanting native
American water willow (Justicia americana) on Martin and Smith
Reservoirs), as well as buttonbush (Cephalanthus occidentalis) on
Martin, Smith, Logan Martin and Weiss Reservoirs. These projects will
greatly enhance aquatic habitat, providing cover for juvenile fishes and
nesting cover for largemouth bass. Reservoirs selected for aquatic
vegetation enhancement operate on an annual drawdown schedule.
These unstable water levels are not conducive for “natural”
establishment of aquatic vegetation, therefore, efforts to transplant
native vegetation are ongoing. We expect that placing these plants in
the “drawdown zone” will coax them into long-term colonization.
A successfully planted water willow site
Buttonbush ready for transplanting
The following is a list of habitat projects completed in 2016.
Visit the Outdoor Alabama Interactive Map on the web
(http://conservationgis.alabama.gov/dcnr/) to view detailed structure
locations.
37
Waterbody Type Amount Install Date
Eufaula Large cedar trees 55 Feb. 2016
West Point Bamboo 50 Feb. 2016
Logan Martin Christmas Trees 40 Feb. 2016
Mitchell Christmas Trees 100 Mar. 2016
Upper Bear Bamboo 50 Jun. 2016
Martin Water willow 600 ft² Jun. 2016
Smith Water willow 600 ft² Jul. 2016
Smith Spiderblocks 100 Aug. 2016
Cedar Spiderblocks 100 Aug. 2016
Little Bear Spiderblocks 100 Aug. 2016
Yates Porcupine®Fish Attractors 150 Aug. 2016
Martin Porcupine®Fish Attractors 150 Sep. 2016
Smith Porcupine®Fish Attractors 150 Sep. 2016
Mitchell Porcupine®Fish Attractors 150 Sep. 2016
Holt Porcupine®Fish Attractors 150 Oct. 2016
Martin Buttonbush 200 Nov. 2016
Martin Stakebeds (PVC) 100 Nov. 2016
Logan Martin Buttonbush 200 Dec. 2016
Weiss Buttonbush 200 Dec. 2016
Smith Buttonbush 200 Dec. 2016
Planting Buttonbush on Smith Lake Constructing fish attractors on Lake Martin

The mission of the Wildlife and Freshwater Fisheries Division is to manage, protect, conserve and
enhance the wildlife and aquatic resources of Alabama for the sustainable benefit of the people of
Alabama.

The Department of Conservation and Natural Resources does not discriminate on the
basis of race, color, religion, age, gender, pregnancy, national origin, genetic information,
veteran status, or disability in its hiring or employment practices nor in admission to, access to,
or operations of its programs, services, or activities.
This publication is available in alternative formats.


SP
ORTFISH
RES
TORAT
ION