basic fisheries management theory - background - fame workshop on new developments in rights-based...
TRANSCRIPT

Basic Fisheries Management Theory- Background -
Fame workshop on
New Developments in Rights-based Fisheries Management:Community Fishing Rights
Esbjerg, August 29-30
Ragnar Arnason

The Fisheries Management Regime (FMR)
• The institutional framework under which the fishing activity operates
• This may be set by(a) Social custom and tradition(b) The government (the fisheries authority)(c) The association of fishermen(d) Other means
• It may be explicit or implicit
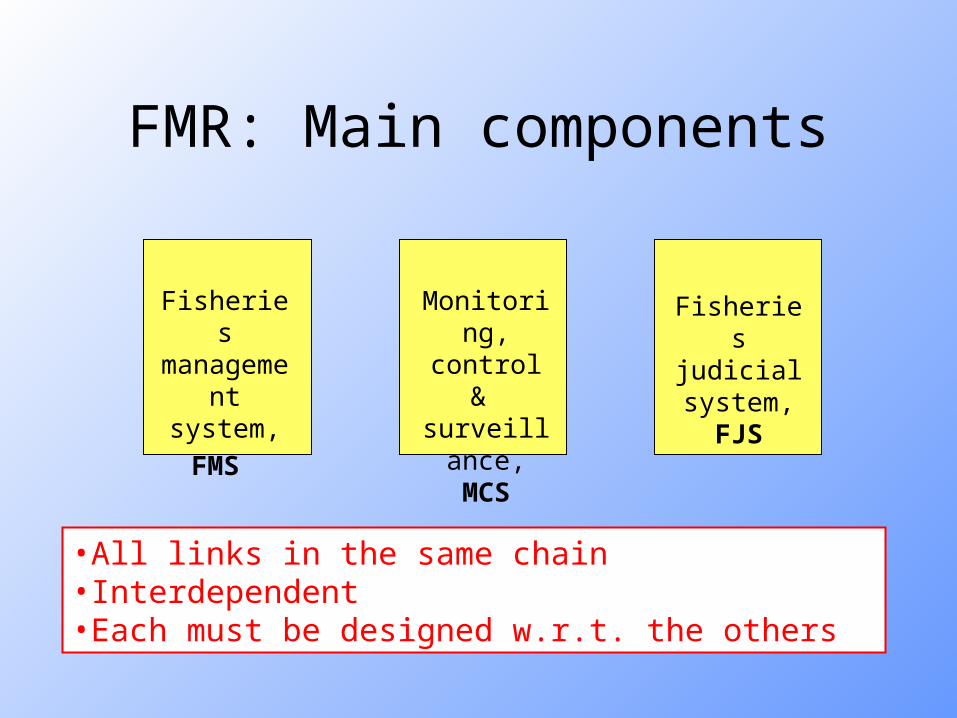
FMR: Main components
Fisheriesmanagement
system,
FMS
Monitoring,control &
surveillance,MCS
Fisheries judicial system,
FJS
•All links in the same chain•Interdependent•Each must be designed w.r.t. the others

The fisheries management system:Useful Definitions
1. Fisheries management toolA variable influencing the fishery that can be adjusted by the fisheries manager. (E.g. Area/time restrictions, mesh size,TACs)
2. Fisheries management measuresA particular application of a fisheries management tool. (E.g. fishing is not allowed on sundays, TAC=100.000 mt)
3. Fisheries management systemA particular collection of fisheries management tools.

Examples of fisheries management tools
1 Fishing gear restrictions
2 Fishing area restrictions
3 Fishing time restrictions (Certain dates excluded from fishing)
4 Fish size restrictions
5 Total harvest restrictions (Total allowable catch, TAC)
6 Individual harvest restrictions (Individual catch quotas)
7 Taxes and subsidies (The fishing activity subject to taxes or subsidies)
8 Fishery access restrictions (Fishing licences)
9 Fishing vessel restrictions (Restrictions on vessels' size, power, equipment etc.)
10 Fishing effort restrictions (Limited total fishing time)
11 Sole ownership (exclusive ownership over a fish stock or a part of it)
12 Territorial use rights in fisheries (TURFs)
13 Community fishing rights

Huge number of possible fisheries management systems
2nN (including no management)
N = number of fisheries management systemsn = number of fisheries management tools
n=10 N=1.024n=20 N=1.048.576
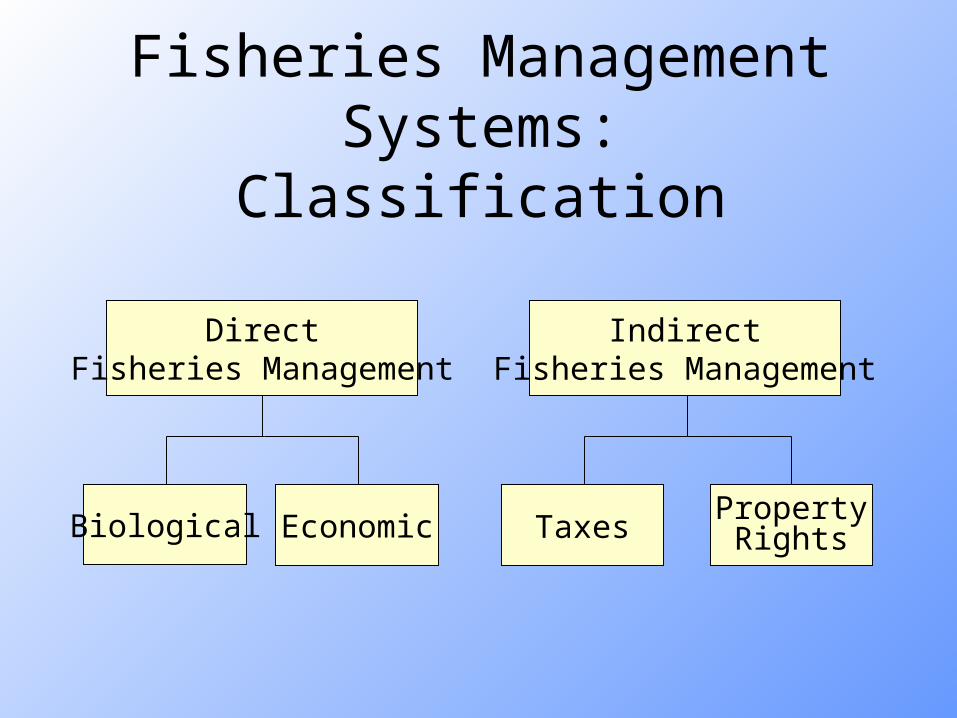
Fisheries Management Systems:Classification
DirectFisheries Management
Biological Economic
IndirectFisheries Management
TaxesPropertyRights
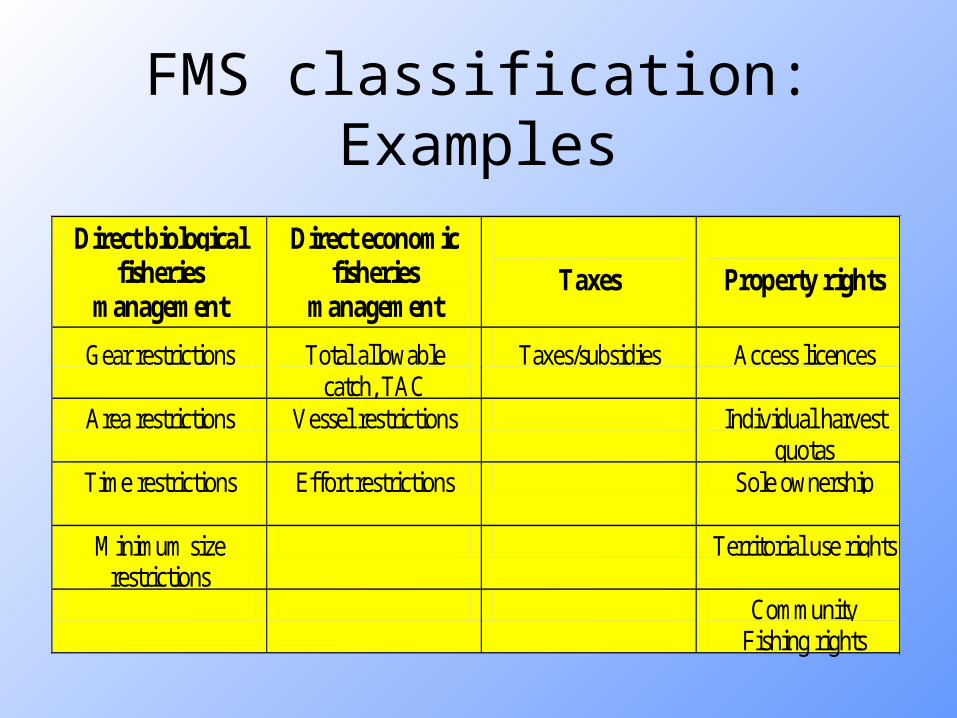
FMS classification: Examples
Direct biological fisheries
management
Direct economic fisheries
management
Taxes
Property rights
Gear restrictions Total allowable catch, TAC
Taxes/subsidies Access licences
Area restrictions Vessel restrictions Individual harvest quotas
Time restrictions
Effort restrictions Sole ownership
Minimum size restrictions
Territorial use rights
Community Fishing rights
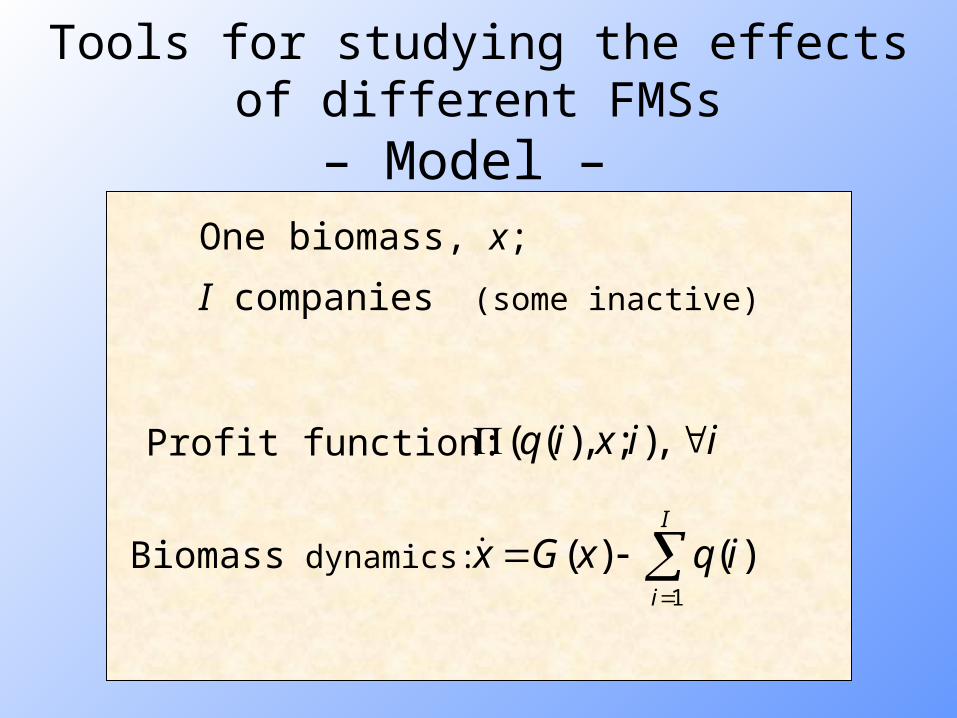
Tools for studying the effects of different FMSs– Model –
( ( ), ; ), q i x i i Profit function:
1
( ) ( )I
i
x G x q i
Biomass dynamics:
One biomass, x;
I companies (some inactive)
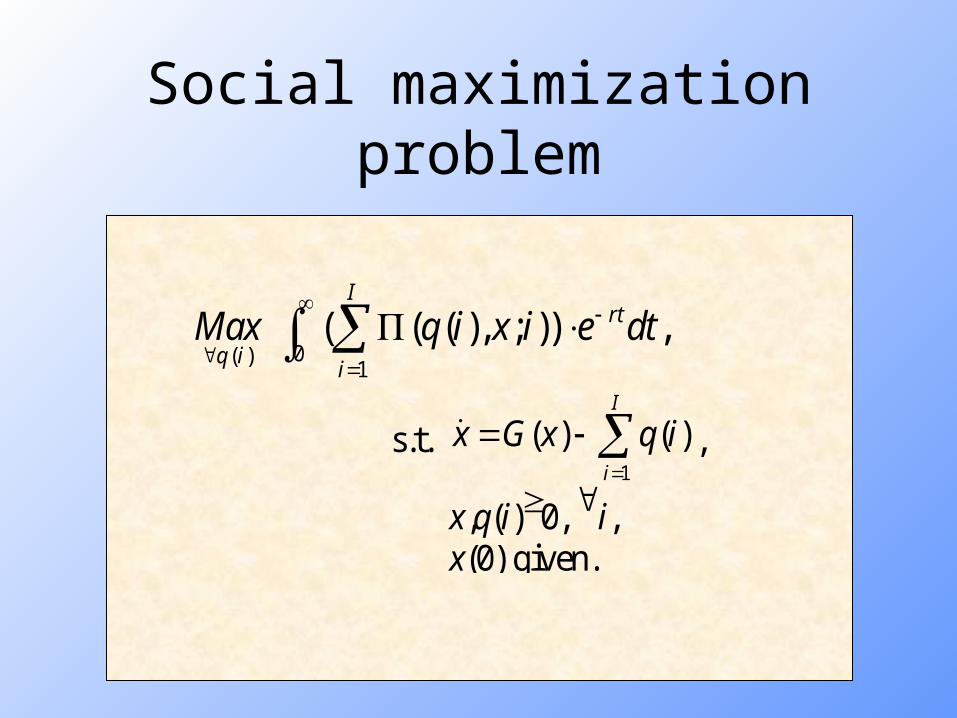
Social maximization problem
0( )1
( ( ( ), ; )) ,I
rt
q ii
Max q i x i e dt
s.t. 1
( ) ( )I
i
x G x q i
,
x,q(i)0, i, x(0) given.

Necessary conditions
( )q i , all active firms.
1
Nix x
i
r G
.
( ) (0, ; ))q j x N j , all j1.
Behavioural rules

Private maximization problem
0() ( (), ; ) rt
qiMax qi xi e dt
s.t. 1
( ) ()I
i
x Gx qi
,
x,q(i)0, x(0) given.

( ) ( )q i i , all active firms.
( ) ( ) ( )ix xi r i i G .
( ) (0, ; )) 0q j x M j , all j1.
Necessary conditions
Behavioural rules
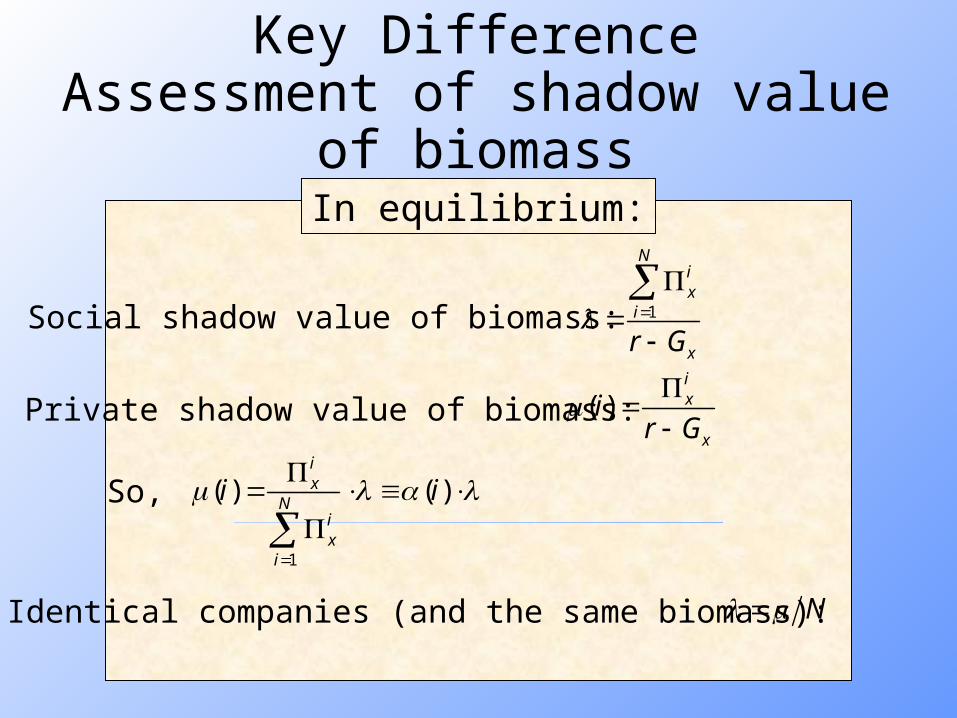
Key DifferenceAssessment of shadow value of biomass
In equilibrium:
Private shadow value of biomass: ( )ix
x
ir G
Social shadow value of biomass: 1
Nix
i
xr G
So,
1
( ) ( )ix
Nix
i
i i
Identical companies (and the same biomass): N
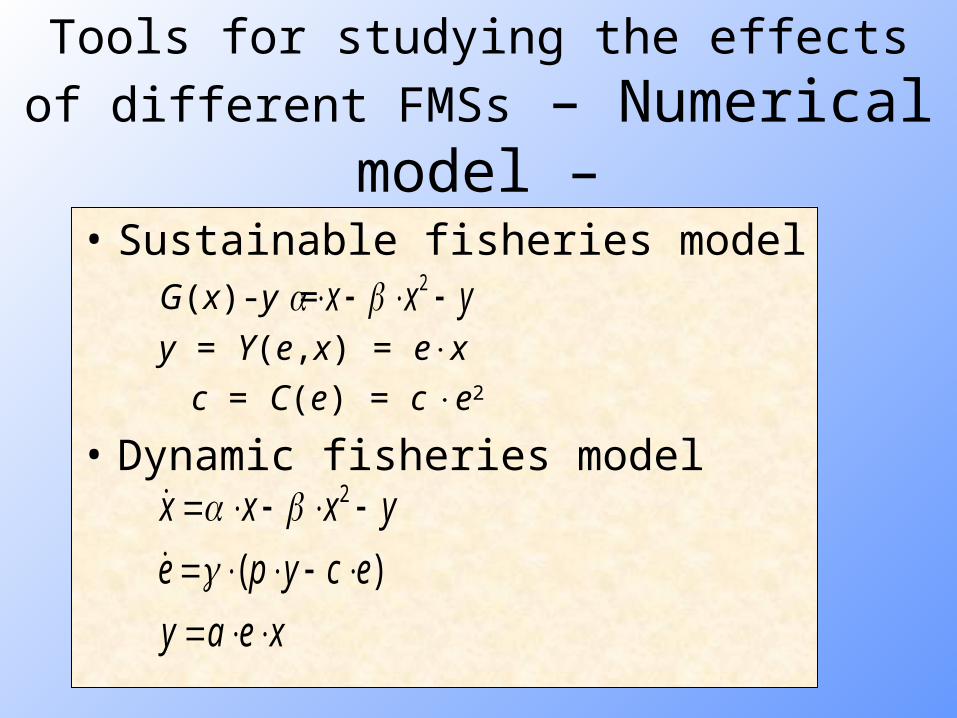
Tools for studying the effects of different FMSs – Numerical model –
• Sustainable fisheries modelG(x)-y =
y = Y(e,x) = ex
c = C(e) = c e2
• Dynamic fisheries model
2x x y
2
( )
x x x y
e p y c e
y a e x
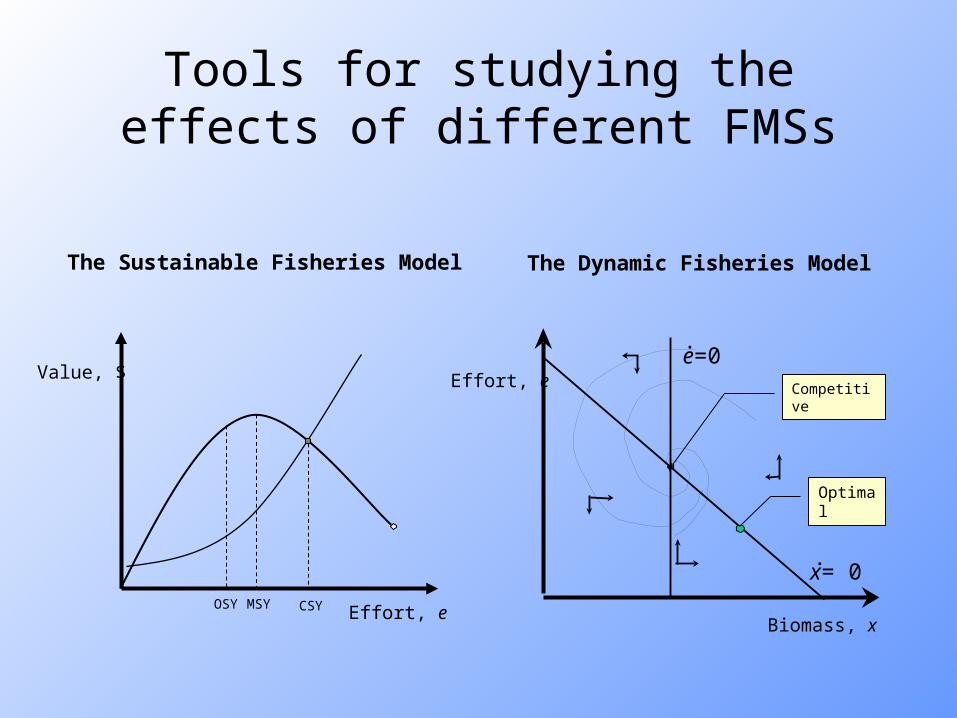
Tools for studying the effects of different FMSs
OSY CSYMSY
Value, $
Effort, e
The Sustainable Fisheries Model The Dynamic Fisheries Model
Biomass, x
Effort, ee=0
x= 0
.
.
Competitive
Optimal

Biological Fisheries Management
• Purpose: Increase the biological yield of the resource
• Methods: Protect young fish, spawners and habitat• Common measures
– Area closures– Seasonal closures– Gear restrictions– Pollution restrictions

Impact
• Behavioural rules are unchanged
• But equation for shadow value modified:
• However, if free entry or large M, (i) 0
( )( , )
ix
x
ir G x

Biological Fisheries Management: Effects
Value, $
OSY CSY Effort, e
The Sustainable Fisheries Model The Dynamic Fisheries Model
Biomass, x
Effort, e
OSY CSY
• So, little or no long term gains• Possible gains along adjustment path• Note also the cost of management
Loss Profits
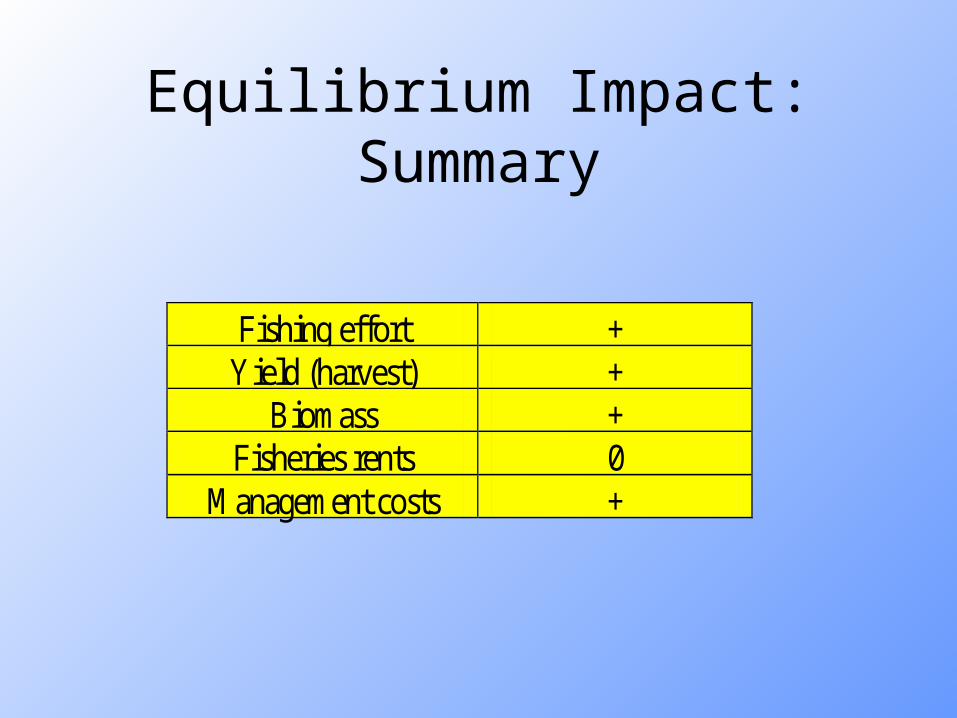
Equilibrium Impact: Summary
Fishing effort + Yield (harvest) +
Biomass + Fisheries rents 0
Management costs +

Direct Economic Restrictions
• Purpose: Enhance the economic yield from the resource
• Method: Constrain fishing effort and capital• Common measures:
– Limited fishing effort (days at sea, fishing etc.)– Capital restrictions (vessel size, power, shape, type,
equipment)– Investment restrictions – Gear restrictions (number, size, type)– Total allowable catch (TACs)

Impact
• Behavioural rules are unchanged
• But equation for shadow value modified:
• However, if free entry or large M, (i) 0
( ( ), , ; )( )
( )
ix
x
q i x ii
r G x

Direct Economic Restrictions: Effects
Value, $
OSY CSY Effort, e
The Sustainable Fisheries Model The Dynamic Fisheries Model
Biomass, x
Effort, e
OSY=CSY
• So, little or no long term gains• Losses along adjustment path• Note distortive effect• Note also the cost of management
Loss Profits

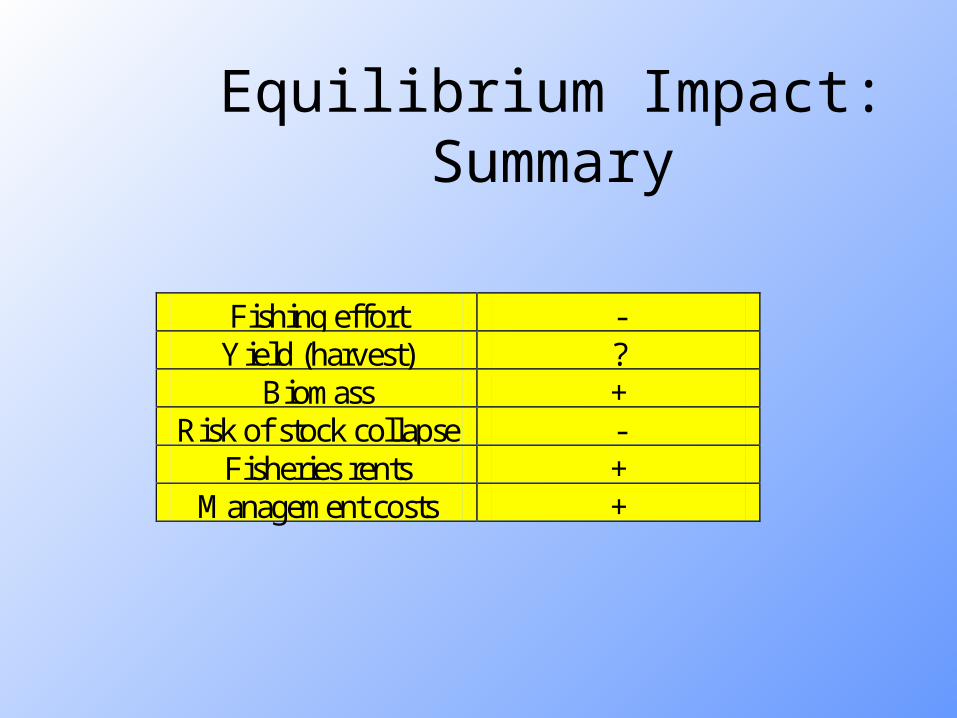
Note on TAC restrictions
• If binding private shadow value of biomass 0.
race for fish is exacerbated
• Economically damaging

Equilibrium Impact: Summary
Fishing effort - Yield (harvest) ?
Biomass + Risk of stock collapse -
Fisheries rents 0 Management costs +

Taxation
• Purpose: Obtain economic rents
• Method: Induce industry to reduce effort (in a wide sense) by making it less profitable
• Variants:– Tax on the volume of landings
– Tax on the value of landings
– Tax on inputs [Not recommended because of substitution effects]
Note: Apparently nowhere used as a fisheries management method
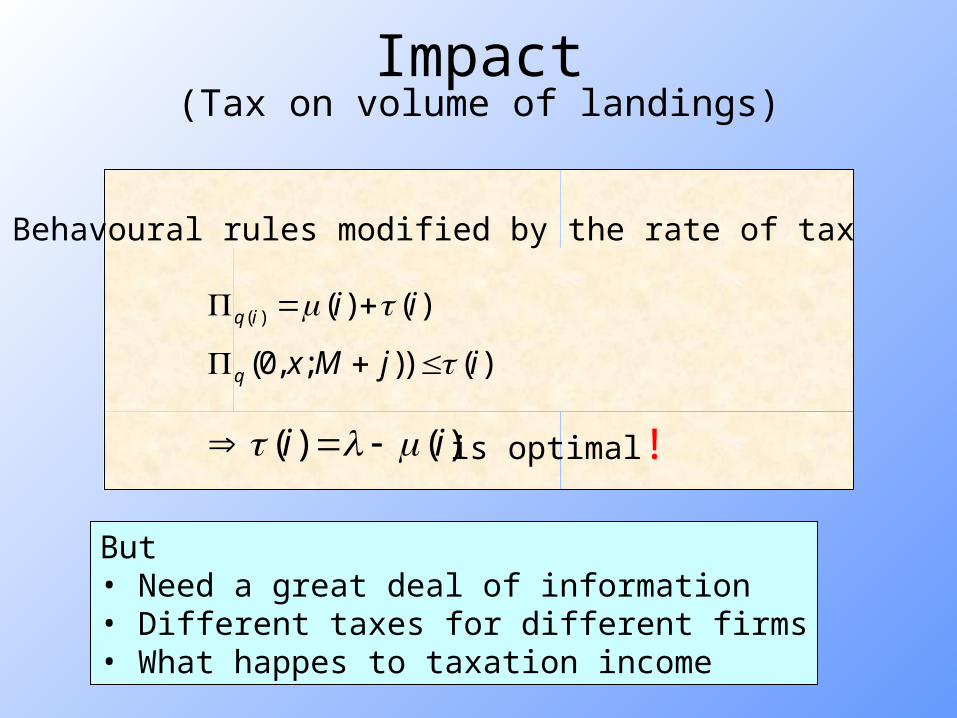
Impact(Tax on volume of landings)
Behavoural rules modified by the rate of tax
( ) ( ) ( )q i i i
(0, ; )) ( )q x M j i
( ) ( )i i is optimal!
But• Need a great deal of information• Different taxes for different firms• What happes to taxation income

Effects of Taxes (on landings)
Value, $
OSY= CSY
CSY Effort, e
The Sustainable Fisheries Model The Dynamic Fisheries Model
Biomass, x
Effort, e
• So, Long term gains equal to taxation revenue• Private losses along adjustment path• Remember the cost of management
Loss Profits
Tax
Equilibrium Impact: Summary
Fishing effort - Yield (harvest) ?
Biomass + Risk of stock collapse -
Fisheries rents + Management costs +

Property Rights
• Purpose: Obtain economic rents• Method: By introducing property rihgts reduce or
eliminate the common property externality => private incentives coincide with public objectives
• Variants:– Licences– Sole ownership– Turfs– IQs/ITQs– Communal property rights

TheoremIf perfect (full quality) property rights*
full economic efficiency *and no market asymmetry
If fisheries property rights are perfect full efficiency
TheoremThe higher the quality of a property right*
the higher the economic efficiency *and no market asymmetry

Quality of Property Rights
• Really bundles of rights (attributes)
• The following are often quoted– Quality of Title (security)– Exclusivity– Permanence (durability)– Transferability

Property Rights Attributes:A Representation
TransferabilityTransferability
SecuritySecurity PermanencePermanence
ExclusivityExclusivity
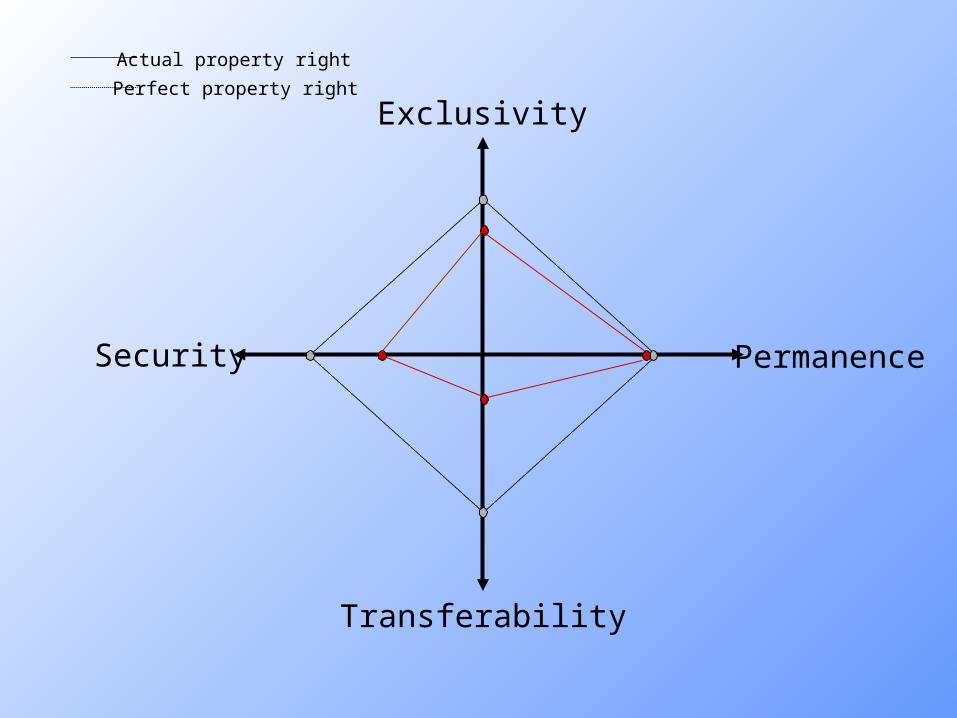
Security
Exclusivity
Permanence
Transferability
Actual property right
Perfect property right

Q-measures of property rights
1 2,
1 1
( ) ( ),ji
N Maa
i j ji j N
x w w x
Q SE
P(w1
+ w2T
)
Q
, , , , w1, w2>0 and w1 + w2 =1
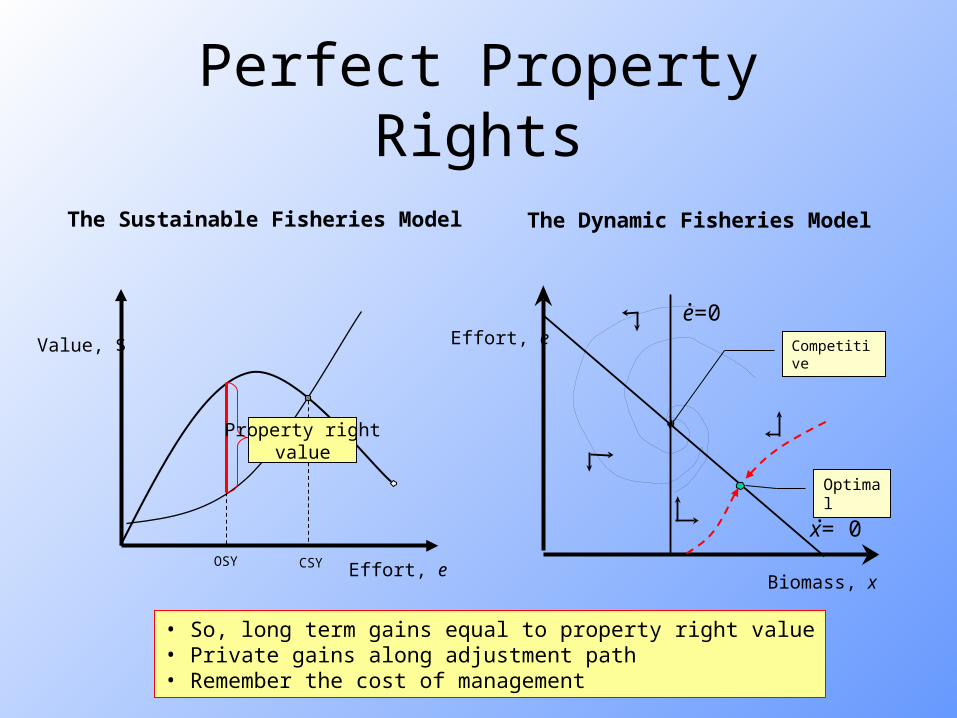
Perfect Property Rights
Value, $
OSY CSY Effort, e
The Sustainable Fisheries Model The Dynamic Fisheries Model
Biomass, x
Effort, ee=0
x= 0
.
.
Competitive
Optimal
Property rightvalue
• So, long term gains equal to property right value• Private gains along adjustment path• Remember the cost of management
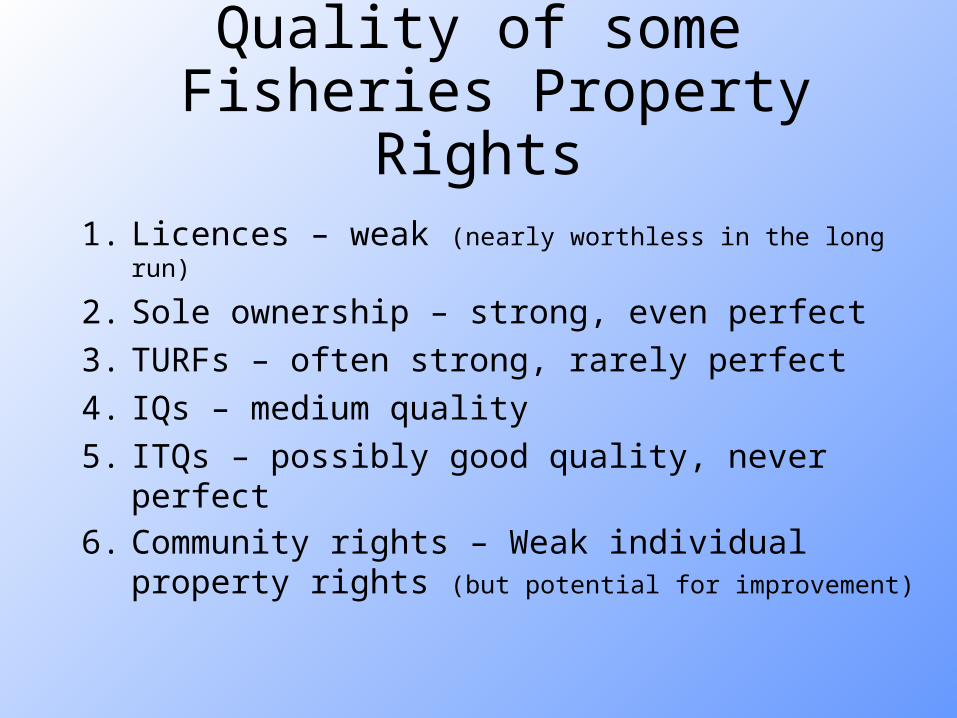
Quality of some Fisheries Property Rights
1. Licences – weak (nearly worthless in the long run)
2. Sole ownership – strong, even perfect
3. TURFs – often strong, rarely perfect
4. IQs – medium quality
5. ITQs – possibly good quality, never perfect
6. Community rights – Weak individual property rights (but potential for improvement)

Communal self-management under property rights
Setting: A group of people (N1) with property rights
=> they have a degree of common interest.

Can they manage themselves well?
• N=1, easy
• N>1, more difficult => need to bargain, negotiate etc.
• Fundamentally a bargaining game
• Nature of problem:– Must agree on procedures (voting, majority etc.)
– Must talk
– Must reach a conclusion
• Some formal framework (legal) may help
Fisheries management systems:Summary
• Only indirect economic methods work• The most promising are:
– Property rights• Sole ownership
• Turfs (where applicable)
• ITQs (where applicable)
• Communal rights
– Taxes• Taxes on landings
• Taxes on the value of landings

ENDEND

ITQ-systems
• Shares in TAC (much superior to quantity quotas)
• Annual quota for firm i: q(i)=a(i)TAC• The q(i), being a property right, will be fished in the
most efficient manner• If the a(i) is a permanent asset the firm can plan and
will adjust its capital structure to fit.• Nota Bene: The ITQ is not a property right in what
really counts; the fish stocks themselves.– Unlike e.g. a farm property right– No stock enhancement, genetic improvements, feeding, spawning
assistance etc. will be undertaken by individual ITQ holders

ITQ markets and prices
• There will arise a market and a price for both q(i) and a(i). (Why?)
• These prices will faithfully reflect the marginal benefits of using (and holding) these quotas. (Why?)
• Price of q(i) will be approximately marginal variable profits of using these annual quotas. (Why?)
• Price of a(i) will approximately equal the expected present value of using the expected quotas for fishing. (Just as the value of any productive asset)
• It follows that the price of a(i) will provide a measure of the appropriateness of the TAC-policy.

Fisheries management under ITQs
• The fisheries authority just has to– Set the TAC– Enforce the property rights
• But setting the TAC correctly requires immense biological and economic information. (Basically everything about the fishery)

Minimum information management, MIMS
Quota values,resource
rents
Total allowable catch, TAC

MIMS in the multispecies Context
Total Quota, TAC
Quota price
Positive
Positive(i.e., fishery)
Negative
Negative(i.e., stock enhancement)
Unprofitable stockenhancement
(subsidized releases)
Profitable stockenhancement(ocean ranching)
Unprofitable fishery(subsidized removal
of predators/competitors)
Profitable fishery(Commercial fishery)

Available theorems
• If each group member’s benefits increase with total benefits he will support the common good.
• That happens e.g. in limited companies (i.e. in principle)

Advantages of self-management
• Vested interest in good management=> (a) Good decisions
(b) Minimum cost management
• Have much of the best information
• The government does not have to be involved