basic electronics (code: 131101)
TRANSCRIPT

Basic Electronics (Code: 131101)
B.E. SEM. III (COMPUTER), Year 2012-13 (Odd Sem.)
! " " # $ # % & ' ( & ) * + , % - % & . ' / 0 1 ) $ ) 2 # / % $ 3 1 # 4 ' - 5 # & 6 78 ' % - . ) $ $ 9 ) ) & 0 : ! 0 ; ' ( % < % ( = > ' 0 5 % 1 % ? @ A - ' 5 5 B % 6 : C # $ $ % 2 ' = > ' B % (D # 5 & - # / & > ' 0 5 % 1 % = * + , % - % &E ) 1 & % / & 8 ) F G H I J H = H K H H J H L J M
Enrollment No:

GUJARAT POWER ENGINEERING AND RESEARCH
INSTITUTE, MEHSANA (APPROVED BY AICTE)
(Affiliated to Gujarat Technological University)
CERTIFICATE
This is to certify that Mr./Ms.________________________________
Enrollment No. ___________________ of semester _____________________has
satisfactorily completed the laboratory work in the course
_____________________________________ within the four walls of the Institute.
Date of submission:
Faculty In-charge Head of Department

GUJARAT POWER ENGINEERING AND RESEARCH INSTITUTE, MEHSANA
Affiliated with Gujarat Technological University (GTU)
B.E. SEM. III (ELECTRICAL), Year: 2012-13 (Odd Sem.)
131101: Basic Electronics
INDEX
Sr.
No. TITLE Page
From To
DATE SIGN REMARK
1 To obtain the characteristics of P-N junction
diode.
2 To obtain the characteristics of LED.
3 To obtain the characteristics of Zener diode.
4 To verify the operation of half wave, full
wave centre tapped & bridge rectifier.
5 To calculate the ripple factor & efficiency
of half wave, full wave centre tapped & full
wave bridge rectifier.
6 To perform shunt & series positive and
negative clipper circuits.
7 To perform positive and negative clamper
circuits.
8 To perform biased shunt & series positive &
negative clamper
9 To obtain the input & output characteristics
of C.E. configuration of BJT.
10 To obtain the input & output characteristics
of C.B. configuration of BJT

EXPERIMENT NO.1 DATE: _______
AIM:-To obtain the forward biased & Reverse biased characteristics of P-N
junction diode.
SPECIFICATION:-
On board DC power supply : +12V DC
Mains supply : 230V AC ±10%, 50Hz
Ammeter Range : 0 mA to 200 mA
Voltmeter Range : 0V to 12V
APPARATUS:-
(1)NV6501 Diode Characteristics Trainer
(2) Patch Cords
THEORY:- A diode is an electrical device allowing current to move through it in one
direction with greater ease than in the other. The most common type of diode in
modern circuit design is the semiconductor diode, although other diode
technologies exist. Semiconductor diodes are symbolized in schematic diagrams
as shown below:
Figure 1 When placed in a simple battery-lamp circuit, the diode will either allow or
prevent current through the lamp, depending on the polarity of the applied voltage
Figure 2 When the polarity of the battery is such that electrons are allowed to flow through
the diode, the diode is said to be forward-biased. Conversely, when the battery is
"backward" and the diode blocks current, the diode is said to be reverse biased. A
diode may be thought of as a kind of switch: "closed" when forward-biased and
"open" when reverse-biased.

V-I Characteristic :-
The static voltage-current characteristic for a P-N Junction Diode is shown in
Figure 3.
Figure 3
Forward Characteristic :-
When the diode is in forward-biased and the applied voltage is increased from
zero, hardly any current flows through the device in the beginning. It is so
because the external voltage is being opposed by the internal barrier voltage VB
whose value is 0.7 V for Si and 0.3 V for Ge. As soon as VB is neutralized,
current through the diode increases rapidly with increasing applied supply
voltage. It is found that as little a voltage as 1.0 V produces a forward current of
about 50mA.
Reverse Characteristic:-
When the diode is reverse-biased, majority carrier are blocked and only a small
current (due to minority carrier) flows through the diode. As the reverse voltage is
increased from zero, the reverse current very quickly reaches its maximum or
saturation value Io which is also known as leakage current. It is of the order of
nanoamperes (nA) and microamperes (µA) for Ge. As seen from Figure 3, when
reverse voltage exceeds a certain value called breakdown voltage VBR, the leakage
current suddenly and sharply increases, the curve indicating zero resistance at this
point.
PROCEDURE:-
To plot Forward Characteristics proceed as follows :-
1. Before switch ‘On’ the supply connect TP1 and TP2 to Voltage positive and
negative terminals respectively.
2. Switch ‘on’ the power supply.
3. Check +12V DC power supply.
4. Now switch ‘Off’ the supply.
5. Rotate potentiometer P1 fully in CCW (counter clockwise direction).
6. Connect Current positive terminal to test point TP4 and Current negative
terminal to test point TP10, to measure diode current ID (mA).
7. Connect Voltage positive terminal to test point TP3 and Voltage negative
terminal to TP11, to measure diode voltage VD.

8. Switch ‘On’ the power supply.
9. Vary the potentiometer P1 so as to increase the value of diode voltage VD from
0 to 1V (0.83V) in step and measure the corresponding values of diode current
ID in an observation Table 1.
10. Plot a curve between diode voltage VD & diode current ID as shown in figure 3
(First quadrant) using suitable scale, with the help of observation Table 1.
This curve is the required forward characteristics of Si diode.
11. Switch ‘off’ the supply.
To plot Reverse Characteristics of a Si diode proceed as follows:-
1. Disconnect previous connections.
2. Rotate potentiometer P1 fully in CCW (counter clockwise direction).
3. Connect Current positive terminal to test point TP5 and Current negative
terminal to test point TP10 to measure diode current ID (mA).
4. Connect Voltage positive terminal to test point TP3 and Voltage negative
terminal to TP11 to measure diode voltage VD.
5. Switch ‘on’ the power supply.
6. Vary the potentiometer P1 so as to increase the value of diode voltage VD from
zero to 10V in step and measure the corresponding values of diode current ID
in an observation Table 2.
7. Plot a curve between diode voltage VD & diode current ID as shown in figure 3
(third quadrant) using suitable scale with the help of observation Table 2. This
curve is the required reverse characteristics of Si diode.
8. Switch ‘off’ the supply.
OBSERVATION TABLE:-
Table:1 Forward biased Characteristics Table:2 Reverse biased Characteristics
Sr.
No.
Diode Voltage
(VD)
Diode current
ID ( µA )
1.
2.
3.
4.
5.
6.
7.
8.
9.
10.
Sr.
No.
Diode Voltage
(VD)
Diode current
ID (mA)
1.
2.
3.
4.
5.
6.
7.
8.
9.
10.

GRAPH:- Plot the graph of Diode Voltage and Diode current ID for both Forward biased and
Reverse biased.
CONCLUSION:- Comment on the nature of graph.
QUIZ:-
1. What is the difference between the semiconductor, conductor and
insulator?
2. What is the difference between the intrinsic and extrinsic
semiconductors?
3. Explain what the barrier potential is and how it is created.
4. Compare the depletion regions in forward bias and reverse bias.
5. What happens to the barrier potential when the temperature
increases?

EXPERIMENT NO.2 DATE: _______
AIM:-To obtain the forward biased & Reverse biased characteristics ofLED.
SPECIFICATION:-
On board DC power supply:+12V DC
Mains supply:230V AC ±10%, 50Hz
AmmeterRange:0 - 200 mA
VoltmeterRange:0 - 12V
APPARATUS:-
(1)NV6501 Diode Characteristics Trainer
(2) Patch Cords
THEORY:- Diodes, like all semiconductor devices, are governed by the principles described
inquantum physics. One of these principles is the emission of specific-frequency
radiantenergy whenever electrons fall from a higher energy level to a lower
energy level.
A diode intentionally designed to glow like a lamp is called a light-emitting diode,
orLED. Diodes made from a combination of the elements gallium, arsenic,
andphosphorus (called gallium-arsenide-phosphide) glow bright red, and are some
of themost common LEDs manufactured. By altering the chemical constituency
of the PNjunction, different colours may be obtained. Some of the currently
available coloursother than red are green, blue, and infra-red (invisible light at a
frequency lower thanred). Other colours may be obtained by combining two or
more primary-colours (red,green, and blue). The schematic symbol for an LED is
a regular diode shape inside ofa circle, with two small arrows pointing away
(indicating emitted light).
Figure 1
This notation of having two small arrows pointing away from the device is
commonto the schematic symbols of all light-emitting semiconductor devices.
Conversely, if adevice is light-activated (meaning that incoming light stimulates
it), then the symbolwill have two small arrows pointing toward it. It is interesting
to note, though, thatLEDs are capable of acting as light-sensing devices: they will
generate a smallvoltage when exposed to light, much like a solar cell on a small

scale. This propertycan be gainfully applied in a variety of light-sensing
circuits.Because LEDs are made of different chemical substances than normal
rectifyingdiodes, their forward voltage drops will be different. Typically, LEDs
have muchlarger forward voltage drops than rectifying diodes, anywhere from
about 1.6 volts toover 3 volts, depending on the color. Typical operating current
for a standard sizedLED is around 20 mA. When operating an LED from a DC
voltage source greater than the LEDs forward voltage, a series-connected
"dropping" resistor must beincluded to prevent full source voltage from damaging
the LED. LED starts emittinglight as its forward voltage reaches at a particular
level and its intensity will increasefurther with the increase in applied forward
voltage. LEDs emit no light when reversebiased. In fact, operating LEDs in
reverse direction will quickly destroy them if theapplied voltage is quite large.
LEDs V-I characteristic curve is shown in Figure 2.
Figure 2 Characteristics of LED
PROCEDURE:-
To plot Forward Characteristics proceed as follows:-
1. Rotate potentiometer P1 fully in CCW (counter clockwise direction).
2. Connect Current positive terminal to test point TP6 and Current
negativeterminal to test point TP10 to measure diode current ID (mA).
3. Connect Voltage positive terminal to test point TP3 and Voltage
negativeterminal to TP11 to measure LED voltage VD.
4. Switch ‘on’ the power supply.
5. Vary the potentiometer P1 so as to increase the value of LED voltage VD
fromzero to maximum in steps and measure the corresponding values of LED
currentID in an observation Table 1.
6. Also consider the effect on light intensity of LED, with the change in
diodevoltage and diode current.
7. Switch ‘off’ the supply.
To plot Reverse Characteristics of a Si diode proceed as follows:-
1. Rotate potentiometer P1 fully in CCW (counter clockwise direction).
2. Connect Current positive terminal to test point TP7 and Current
negativeterminal to test point TP10 to measure LED current ID (mA).

3. Connect Voltage positive terminal to test point TP3 and negative terminal
toTP11 to measure LED voltage VD.
4. Switch ‘on’ the power supply.
5. Vary the potentiometer P1 so as to increase the value of diode voltage VD
fromzero to maximum in steps and measure the corresponding values of
diodecurrent ID in an Observation Table 2.
6. Switch ‘off’ the supply.
OBSERVATION TABLE:-
Table:1Forward biased Characteristics Table:2Reverse biased Characteristics
GRAPH:- Plot the graph of Diode Voltage and Diode current ID for both forwardbiased
andReverse biased.
CONCLUSION:-
Comment on the nature of graph.
Sr.
No.
Diode Voltage
(VD)
Diode current
ID (mA)
1.
2.
3.
4.
5.
6.
7.
8.
9.
10.
Sr.
No.
Diode Voltage
(VD)
Diode current
ID ( µA )
1.
2.
3.
4.
5.
6.
7.
8.
9.
10.

QUIZ:-
1) In what bias condition is an LED normally operated?
2) What is the operating principle of LED?
3) What happens to the light emission of an LED as the forward current increases?
4) Name two types of LED in terms of their light-emission spectrum.
5) The forward voltage drop of an LED is 0.7 V (true or false)

EXPERIMENT NO. 3 DATE: _______
AIM:-To obtain the characteristics of Zener diode.
SPECIFICATION:-
On board DC power supply: +12V DC
Mains supply: 230V AC ±10%, 50Hz
Ammeter Range: 0 mA to 200 mA
Voltmeter Range: 0V to 12V
APPARATUS:-
(1)NV6501 Diode Characteristics Trainer
(2) Patch Cords
THEORY:- It is the reverse-biased heavily-dopped silicon (or germanium) P-N Junction diode
which is operated in the breakdown region where current is limited by both
external resistance and power dissipation of the diode. Silicon is preferred to
diode because of its higher temperature and current capability. Zener breakdown
occurs due to breaking of covalent bonds by the strong electric field set up in the
depletion region by the reverse voltage. It produces an extremely large number of
electrons and holes, which constitute the reverse saturation current (called zener
current Iz) whose value is limited only by the external resistance in the circuit.
V-I Characteristic:-
Figure 1 shows typical characteristics in the negative quadrant. The forward
characteristic is simply that of an ordinary forward-biased junction diode. The
important points of the reverse characteristic are Vz = Zener breakdown voltage.
Iz min = Minimum current to sustain breakdown, Iz max = Maximum Zener
current limited by, maximum power dissipation. Since its reverse characteristic is
not exactly vertical, the diode possesses some resistance called Zener dynamic
impedance. Its value is given by Zz =
Vz /
Iz. Zener diode are available having
zener voltage of 2.4V to 200V. This voltage is temperature dependent. The
product Vz, Iz, gives their power dissipation. Maximum ratings vary from 150mV
to 50W.
Figure:-1

For proper working of a Zener diode in any circuit, it is essential that it must
1. Be reverse-biased,
2. Have voltage across it which is greater than Vz,
3. Be in a circuit where current is less than Iz maximum
PROCEDURE:-
To plot Forward Characteristics proceed as follows :- 1. Rotate potentiometer P1 fully in CCW (counter clockwise direction).
2. Connect Current positive terminal to test point TP8 and Current negative terminal
to test point TP10 to measure diode current ID (mA).
3. Connect Voltage positive terminal to test point TP3 and negative terminal to TP11
to measure diode voltage VD.
4. Switch ‘On’ the power supply.
5. Vary the potentiometer P1 so as to increase the value of Zener voltage Vz from zero
to 0.8 in step and measure the corresponding values of Zener current Iz in an
observation Table 1.
6. Plot a curve between diode voltage Vz and diode current Iz as shown in figure 1
(First quadrant) using suitable scale, with the help of Observation Table 1. This
curve is the required Forward Characteristics of Zener diode.
7. Switch ‘Off’ the supply.
To plot Reverse Characteristics of a Si diode proceed as follows:- 1. Rotate potentiometer P1 fully in CCW (counter clockwise direction).
2. Connect Current positive terminal to test point TP9 and Current negative terminal
to test point TP10 to measure diode current ID (mA).
3. Connect Voltage positive terminal to test point TP3 and Voltage negative terminal
to TP11 to measure voltage VD diode.
4. Switch ‘On’ the power supply.
5. Vary the potentiometer P1 so as to increase the value of diode voltage VD from zero
to 6.8V in steps and measure the corresponding values of diode current Iz in an
observation Table 2.
6. Plot a curve between diode voltage Vz and diode current Iz as shown in figure 1
(third quadrant) using suitable scale, with the help of Observation Table 2. This
curve is the required Reverse Characteristics of Zener diode.
7. Switch ‘Off’ the supply.

OBSERVATION TABLE:-
Table:1 Forward biased Characteristics Table:2 Reverse biased Characteristics
GRAPH:- Plot the graph of Diode Voltage and Diode current ID for both forward biased and
Reverse biased.
CONCLUSION:- Comment on the nature of graph.
QUIZ:- 1. What is the difference between the zener diode and p-n junction
diode?
2. List the application of zener diode.
3. Compare zener and avalanche breakdown.
Sr.
No.
Diode Voltage
(Vz)
Diode current
Iz ( mA )
1.
2.
3.
4.
5.
6.
7.
8.
9.
10.
Sr.
No.
Diode Voltage
(Vz)
Diode current
Iz (mA)
1.
2.
3.
4.
5.
6.
7.
8.
9.
10.

EXPERIMENT NO. 4 DATE: _______
AIM: - To verify the operation of half wave, full wave centre tapped & bridge
rectifier.
SPECIFICATION:-
Mains Supply: 230V ±10%, 50Hz
Transformer Rating: 9 V center tapped (300mA)
Half-wave Rectifier Output: 4V DC
Center-Tapped Rectifier Output: 8V DC
Bridge Rectifier Output: - 8V DC
Load: Resistive 220 ohms, ½ Watt
APPARATUS:-
(1) NV6503 Rectifier Trainer
(2) Patch Cords
(3) CRO
(4) Digital Multimeter (DMM)
THEORY:- Rectifier: - A rectifier is a circuit, which uses one or more diodes to convert AC
Voltage into pulsating DC voltage. It may be broadly categorized in
(a) Half-wave Rectifier
(b) Full-wave Rectifier : Full-wave Rectifier is again subdivided into
i. Center-tapped Rectifier
ii. Bridge Rectifier
Half-wave Rectifier:-
Figure 1 shows the half-wave rectifier circuit. It consists of a single diode in a
series with a load resistor. The input to the half-wave rectifier is an AC waveform
as shown in Figure 1. The working of a half-wave rectifier circuit may be studied
by considering separately the positive and negative half cycles of the AC input
voltage.
Figure 1

During the positive half-cycle of the AC input voltage, the diode is forward biased
and conducts for all instantaneous voltages greater than the threshold voltage (0.7
V for silicon and 0.3 V for germanium diodes). However, for all practical
purposes, we assume that the diode is forward biased, whenever the AC input
voltage goes above zero. While conducting, the diode acts as a short- circuit, so
that the circuit current flows and produces a voltage across the load resistor (RL).
The voltage produced across the load resistor has the same shape as that of the
positive input half cycle of AC input voltage as shown in Figure 1. The waveform
of diode current (which is equal to load current) is also shown in Figure 1.
During negative half-cycle, the diode is reverse biased and hence it does not
conduct. Thus, there is no current flow or voltage drop across load resistor (RL)
i.e. ID = 0 and VO=0. The net result is that only the positive half cycle of the AC
input voltage appears across RL. It means that only the positive half cycle of the
AC input voltage is utilized for delivering AC power.
Full - wave Rectifier: A full-wave rectifier is a circuit, which allows a
unidirectional current to flow through the load during the entire input cycle as
shown in Figure 2. The result of full-wave rectification is a DC output voltage
that pulsates every half-cycle of the input. On the other hand, a half-wave rectifier
allows the current to flow through the load during positive half-cycle only.
Figure 2 Full wave Rectifier, with input and output voltage waveforms
Center-tapped Full-wave Rectifier:
Figure 3 Center-tapped Full-wave Rectifier

During the positive input half-cycle, forward biases the diode D1 and reverse-
biases the diode D2.
As a result of this, the diode D1 conducts some current whereas the diode D2 is
‘Off’.
During the negative input half-cycle, this reverse-biases the diode D1 and forward-
biases the diode D2. As a result of this, the diode D1 is ‘Off’ and the diode D2
conducts some current.
Full-wave Bridge Rectifier:
It uses four diodes connected across the main supply, as shown in Figure 4. The
operation of the circuit may be studied as follows :
Figure 4 Bridge rectifier with step-down transformer
When the input voltage is positive as shown in Figure 4, the diodes D1 and D2 are
forward biased and conduct some current in the direction as indicated in the
figure. A voltage is developed across the resistance RL due to the current flow
through it. The voltage looks like the positive half of the input cycle. At this time
the diodes D3 and D4 are reverse biased. When the input voltage is negative as
shown in Figure 4, the diodes D3 and D4 are forward biased and conduct some
current in the same direction through RL as during the positive half- cycle. During
this time, the diodes D1 and D2 are reverse biased. As a result of this action, a full-
wave rectified output voltage is developed across the resistance RL.
PROCEDURE:-
Procedure for Half Wave Rectifier:- 1. Make the connections on the Rectifier Trainer NV6503.
a. Connect output of transformer (0-9 Vrms) to the input of half-wave rectifier
i.e. connect TP1 and TP2 across TP4 and TP5 using 2mm patch cords.
b. Directly connect the output of rectifier to load i.e. connect TP6 and TP7
across TP19 and TP20.
c. For using filter, connect output of half-wave rectifier to the input of filter i.e.
connect TP6 to TP15 and TP7 to TP16.
d. Now connect the output of filter to the load i.e.connect TP17 and TP18

across TP19 and TP20.
2. Connect the mains cord to the Rectifier Trainer and switch on the mains
supply.
3. Now switch ‘On’ the power switch of the trainer.
4. Connect CRO across TP1 and TP2 and observe the step down output of
transformer.
5. Connect CRO across TP19 and TP20 and observe the output which is a
rectified voltage waveform or pulsating DC.
6. Measure output frequency on CRO and you will observe that in half-wave
rectifier, the output frequency is same as that of input. fout = fin (50 Hz)
Procedure for Center - Tapped Rectifier:- 1. Make the connections on the Rectifier Trainer NV6503.
a. Connect output of transformer (9-0-9 Vrms) to the input of center-tapped full-
wave rectifier i.e. connect TP1 and TP3 across TP8 and TP9 using 2mm patch
cords.
b. Directly connect output of center-tapped rectifier, TP10 and center-tap of
transformer TP2 across load i.e. TP19 and TP20.
c. For using filter, connect output of center-tapped rectifier to the input of filter
i.e. connect TP10 to TP15 and TP2 to TP16.
d. Now connect the output of filter to the load i.e. connect TP17 and TP18 across
TP19 and TP20.
2. Connect the mains cord to the Rectifier Trainer and switch on the mains
supply.
3. Now switch ‘On’ the power switch of the trainer.
4. Connect CRO across TP19 and TP20 and observe the output which is a
rectified voltage waveform or pulsating DC.
5. Measure output frequency on CRO and you will observe that in center-tapped
rectifier, the output frequency is double as that of input. fout = 2fin (100 Hz
approximately)
Procedure for Bridge Rectifier:- 1. Make the connections on the Rectifier Trainer NV6503 .
a. Connect output of transformer (0-9 Vrms) to the input of bridge rectifier i.e.
connect TP1 and TP2 across TP11 and TP14 using 2mm patch cords.
b. Connect the output of rectifier to the load i.e. connect TP13 and TP12 across
TP19 and TP20.
c. For using filter, connect output of bridge rectifier to the input of filter i.e.,
connect TP13 to TP15 and TP12 to TP16.
d. Now connect the output of filter to the load i.e. connect TP17 and TP18 across
TP19 and TP20.
2. Connect the mains cord to the Rectifier Trainer and switch ‘On’ the mains
supply.
3. Now switch ‘On’ the power switch of the trainer.
4. Connect CRO across TP19 and TP20 and observe the output which is a
rectified voltage waveform or pulsating DC.

5. Measure output frequency on CRO and you will observe that in bridge
rectifier, the output frequency is double as that of input. fout = 2fin (100 Hz
approximately)
CALCULATION:- Calculate the value of output d.c. voltage Vdc and output direct current Idc
WAVEFORM:-
Plot the waveform of Output Voltage and current.
CONCLUSION:-
Comment on the nature of waveform.
QUIZ:- (1) For half wave rectifier, there is current through the load for
approximately what percentage of the input cycle?
(2) What is the average of a half wave rectified voltage with a peak
value of 10V ?
(3) How does a full wave voltage differ from a half wave voltage?
(4) Which type of full wave rectifier has the greater output voltage for
the same input voltage and transformer turns ratio?
(5) What is the average value of a full wave rectified voltage with a
peak value of 60 V ?
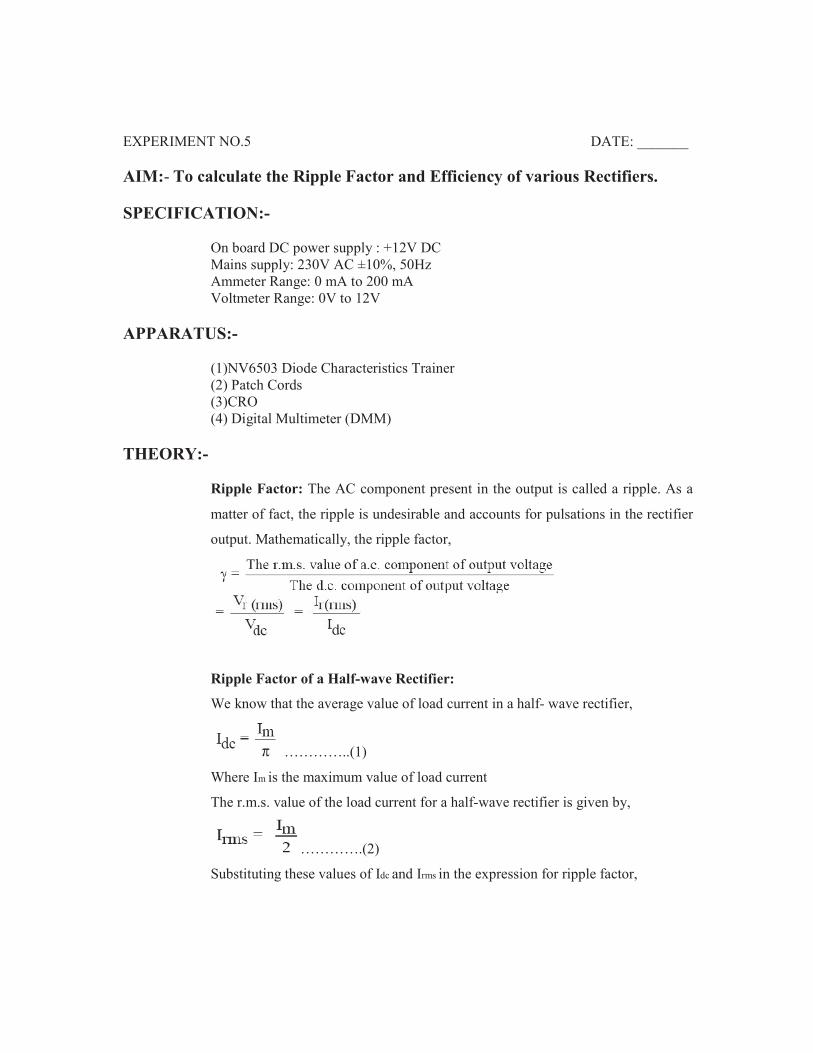
EXPERIMENT NO.5 DATE: _______
AIM:- To calculate the Ripple Factor and Efficiency of various Rectifiers.
SPECIFICATION:-
On board DC power supply : +12V DC
Mains supply: 230V AC ±10%, 50Hz
Ammeter Range: 0 mA to 200 mA
Voltmeter Range: 0V to 12V
APPARATUS:-
(1)NV6503 Diode Characteristics Trainer
(2) Patch Cords
(3)CRO
(4) Digital Multimeter (DMM)
THEORY:-
Ripple Factor: The AC component present in the output is called a ripple. As a
matter of fact, the ripple is undesirable and accounts for pulsations in the rectifier
output. Mathematically, the ripple factor,
Ripple Factor of a Half-wave Rectifier:
We know that the average value of load current in a half- wave rectifier,
…………..(1)
Where Im is the maximum value of load current
The r.m.s. value of the load current for a half-wave rectifier is given by,
………….(2)
Substituting these values of Idc and Irms in the expression for ripple factor,

If ripple factor is expressed in terms of a percentage, its value is 121%. This
indicates that the amount of AC component present in the output of a half-wave
rectifier is 121% of DC output voltage. Hence the half-wave rectifier is not very
successful in converting the current from AC to DC.
Ripple Factor of a Full-wave Rectifier :
We know that the average value of load current in a full-wave rectifier (either
centertapped
or bridge rectifier) is given by the relation,
The r.m.s. value of the load current for a full-wave rectifier is given by,
Substituting these values of Idc and Irms in the expression for ripple factor,
From the above result it is evident that the ripple factor of a full-wave rectifier is
0.482 and is much smaller than that of a half-wave rectifier. Because of this
reason, full-wave rectifier is used more commonly in actual practice.
Efficiency : It may be defined as the ratio of DC power delivered to the load to
the AC input
power from the secondary winding of the transformer. Mathematically, the
rectifier efficiency,

Efficiency of a Half-wave Rectifier:
We know that the efficiency of a rectifier is given by the expression,
We also know that for a half-wave rectifier,
Substituting the values of Idc and Irms in equation (i),
Now efficiency will be maximum, if RL >> Rf = 0.406 or 40.6 %.
It shows that efficiency of a half-wave rectifier is 40.6% under the condition that
the value of load resistance is very large as compared to the forward resistance of
a diode (i.e., RL >> Rf) However, in actual practice, the efficiency is always less
then 40.6 %.
Efficiency of a Full-wave Rectifier:
As we know that rectifier efficiency is given by the relation,
We also know that for a full-wave rectifier,
Substituting the values of Idc and Irms in equation (i),

Now efficiency will be maximum if RL >> Rf. Thus, max = 0.812 or 81.2 %.
It shows that maximum efficiency of a full-wave rectifier is twice that of half-
wave rectifier. It means that a full-wave rectifier is twice as effective as a half-
wave rectifier.
OBSERVATION:-
Type Vr.m.s Vm
Half Wave Rectifier
Centre tapped Wave Rectifier
Bridge Rectifier
CALCULATION:-
Type Ripple Factor efficiency
Half Wave Rectifier
Centre tapped Wave Rectifier
Bridge Rectifier
CONCLUSION:-

QUIZE:- 1).Define the ripple factor.
2). Define the effiency of rectifier.
3). Explain the term : PIV in rectifier service.
4). Compare the half wave and full wave rectifier.
5). Comments on the full wave rectifier output.

EXPERIMENT NO.6 DATE: _______
AIM: To Perform shunt & series positive and negative Clipper Circuits.
APPARATUS: -
NV6511 Trainer Kit CRO Multimeter
THEORY:-
Wave Shaping Circuits
A process by which non-sinusoidal as well as sinusoidal waveforms are altered in
passing through the circuit elements (such as diodes, resistors, inductors and
capacitors) is called wave shaping. The wave shaping is used to perform any one
of the following functions:
1. To generate one wave from the other.
2. To limit the voltage level of the waveform to some preset value and
suppressing all other voltage levels in excess of the preset level.
3. To cut-off the positive and negative portions of the input waveform.
4. To hold the waveform to a particular DC level.
The wave shaping is important in most of the signal process systems and is
performed by the circuits known as differentiators, integrators, limiters, clippers
and clampers.
Types of Wave Shaping Circuits:
Following two types of wave shaping circuits are important from the subject point
of view:
1. Linear wave shaping circuits:
The circuits, which make use of only linear circuit elements such as the inductors,
capacitors and resistors, are known as linear wave shaping circuits.
2. Nonlinear wave shaping circuits:
The circuits, which (in addition to linear circuit elements) make use of nonlinear
circuit elements such as diodes and transistors are known as nonlinear wave
shaping circuits. Such circuits are used to perform functions of amplitude
limiting, clipping and clamping.
Clipping Circuits:
A wave shaping circuit which controls the shape of out waveform by removing or
clipping a portion of the applied wave is known as clipping circuit. The clippers

are used in Radar, Digital and other electronic devices. The various types of
clippers are:
Positive Clipper:
The clipper which removes the positive half cycles of the input voltage is known
as positive clipper.
Negative Clipper:
The clipper which removes the negative half cycles of the input voltage is known
as negative clipper.
Biased Clipper:
A biased clipper is used when it is desired to remove a small portion of positive or
negative half cycle of the signal voltage.
Combination Clipper: The combination of a biased positive clipper and a biased negative clipper is
called combination clipper. Such a clipper circuit can clip at two-independent
levels depending upon the bias voltages.
PROCEDURE:-
Procedure for Series Positive Clipper:
Connect point 1 and point 2 of Sine Wave Generator Section to point 7 and
point 8 of Series Positive Clipper respectively. Connect the mains cord to the trainer and switch on the mains supply. Switch ON the power switch of the trainer. Connect CRO across TP3 and TP4 and observe the output, which is a
positively clipped waveform. Draw the input and output waveforms on the graph paper.
Procedure for Series Negative Clipper:
Connect point 1 and point 2 of Sine Wave Generator Section to point 11 and
point 12 of Series Negative Clipper respectively.. Connect the mains cord to the trainer and switch on the mains supply. Switch ON the power switch of the trainer. Connect CRO across TP7 and TP8 and observe the output, which is a
negatively clipped waveform. Draw the input and output waveforms on the graph paper.
Procedure for Shunt Positive Clipper:
Connect point 1 and point 2 of Sine Wave Generator Section to point 9 and

point 10 of Shunt Positive Clipper respectively.. Connect the mains cord to the trainer and switch on the mains supply. Switch ON the power switch of the trainer. Connect CRO across TP5 and TP6 and observe the output, which is a
positively clipped waveform. Draw the input and output waveforms on the graph paper
Procedure for Shunt Negative Clipper:
Connect point 1 and point 2 of Sine Wave Generator Section to point 13 and
point 14 of Shunt Negative Clipper respectively. Connect the mains cord to the trainer and switch on the mains supply. Switch ON the power switch of the trainer. Connect CRO across TP9 and TP10 and observe the output, which is a
negatively clipped waveform. Draw the input and output waveforms on the graph paper
CONCLUSION:-
Comment on the nature of output waveform.
QUIZ:-
1. Define ripple factor.
2. What are the disadvantages of a half wave rectifier circuit?
3. Define the peak inverse voltage.
4. What is the advantage of bridge rectifier?
5. Why filter circuit is necessary with rectifier?

EXPERIMENT NO.7 DATE: _______
AIM:-To Perform positive and negative Clamper Circuits.
APPARATUS: -
NV6511 Trainer Kit CRO Multimeter
THEORY:-
Wave Shaping Circuits
A process by which non-sinusoidal as well as sinusoidal waveforms are altered in
passing through the circuit elements (such as diodes, resistors, inductors and
capacitors) is called wave shaping. The wave shaping is used to perform any one
of the following functions:
1. To generate one wave from the other.
2. To limit the voltage level of the waveform to some preset value and
suppressing all other voltage levels in excess of the preset level.
3. To cut-off the positive and negative portions of the input waveform.
4. To hold the waveform to a particular DC level.
The wave shaping is important in most of the signal process systems and is
performed by the circuits known as differentiators, integrators, limiters, clippers
and clampers.
Types of Wave Shaping Circuits:
Following two types of wave shaping circuits are important from the subject point
of view:
1. Linear wave shaping circuits:
The circuits, which make use of only linear circuit elements such as the inductors,
capacitors and resistors, are known as linear wave shaping circuits.
2. Nonlinear wave shaping circuits:
The circuits, which (in addition to linear circuit elements) make use of nonlinear
circuit elements such as diodes and transistors are known as nonlinear wave
shaping circuits. Such circuits are used to perform functions of amplitude
limiting, clipping and clamping.
Clamping Circuits:
The circuits, with which the waveform can be shifted in such a way so that a
particular part of it (say positive or negative peak) is maintained at a specified voltage
level, is called a clamping circuit (or simply a clamper). As a matter of fact, a

clamping circuit introduces (or restores) a dc level to an ac signal. Thus a clamping
circuit is also known as dc restorer. Such circuits are used in television receivers to
restore the original dc reference signal to the video signal.
Positive Clamper:
When a clamper shifts the original signal in vertical upward direction, it is known
as positive clamper.
Negative Clamper:
When a clamper shifts the original signal in vertical downward direction, it is
known as positive clamper.
Biased Clampers:
A biased clamper means that the clamping can be done at any voltage level other than
zero.
PROCEDURE:-
Procedure for Positive Clamper:
Connect point 1 and point 2 of Sine Wave Generator Section to point 37 and
point 38 of Positive Clamper respectively.. Connect the mains cord to the trainer and switch on the mains supply. Switch ON the power switch of the trainer. Connect CRO across TP21 and TP22 and observe the output, which is lifted up
so as the trough of the waveform touch the reference level (or horizontal axis).
This causes the waveform to clamp positively at 0V and is known as positively
clamped waveform at 0V.. Draw the input and output waveforms on the graph paper.
Procedure for Negative Clamper:
Connect point 1 and point 2 of Sine Wave Generator Section to point 39 and
Point 40 of Negative Clamper respectively.. Connect the mains cord to the trainer and switch on the mains supply. Switch ON the power switch of the trainer. Connect CRO across TP 23 and TP 24 and observe the output waveform
which is shifted down so as the crest of the waveform touch the reference
level (or horizontal axis). This causes the waveform to clamp negatively at 0V
and is known as negatively clamped waveform at 0V. Draw the input and output waveforms on the graph paper.

CONCLUSION:-
Comment on the nature of output waveform.
QUIZ:-
1. What is transfer characteristics? State its physical significance.
2. What is rectifier ?
3. Which are the important characteristics of a rectifier circuit ?
4. Why diode can be used as a rectifier ?
5. Define transformer utilization factor

EXPERIMENT NO.8 DATE: _______
AIM:- To perform biased positive & negative clamper.
APPARATUS: -
NV6511 Trainer Kit CRO Multimeter
THEORY:-
Wave Shaping Circuits
A process by which non-sinusoidal as well as sinusoidal waveforms are altered in
passing through the circuit elements (such as diodes, resistors, inductors and
capacitors) is called wave shaping. The wave shaping is used to perform any one
of the following functions:
1. To generate one wave from the other.
2. To limit the voltage level of the waveform to some preset value and
suppressing all other voltage levels in excess of the preset level.
3. To cut-off the positive and negative portions of the input waveform.
4. To hold the waveform to a particular DC level.
The wave shaping is important in most of the signal process systems and is
performed by the circuits known as differentiators, integrators, limiters, clippers
and clampers.
Types of Wave Shaping Circuits:
Following two types of wave shaping circuits are important from the subject point
of view:
1. Linear wave shaping circuits:
The circuits, which make use of only linear circuit elements such as the inductors,
capacitors and resistors, are known as linear wave shaping circuits.
2. Nonlinear wave shaping circuits:
The circuits, which (in addition to linear circuit elements) make use of nonlinear
circuit elements such as diodes and transistors are known as nonlinear wave
shaping circuits. Such circuits are used to perform functions of amplitude
limiting, clipping and clamping.
Clamping Circuits:
The circuits, with which the waveform can be shifted in such a way so that a
particular part of it (say positive or negative peak) is maintained at a specified voltage
level, is called a clamping circuit (or simply a clamper). As a matter of fact, a

clamping circuit introduces (or restores) a dc level to an ac signal. Thus a clamping
circuit is also known as dc restorer. Such circuits are used in television receivers to
restore the original dc reference signal to the video signal.
Positive Clamper:
When a clamper shifts the original signal in vertical upward direction, it is known
as positive clamper.
Negative Clamper:
When a clamper shifts the original signal in vertical downward direction, it is
known as positive clamper.
Biased Clampers:
A biased clamper means that the clamping can be done at any voltage level other
than zero. Now consider a circuit shown in figure 1. Here a battery of 5V is added
in such a way that the clamping takes place positively at –5V as shown in figure 2
Figure 1 Biased clamper
Figure 2 Output waveforms
Similarly, it is also possible to clamp the input waveform positively at +5V by
reversing the battery connections.
PROCEDURE:-
Procedure for Biased Positive Clamper: Connect the Sine Wave Generation to the input terminals of the circuit. Connect the mains cord to the trainer and switch on the mains supply. Switch ON the power switch of the trainer. Connect the positive DC power supply to appropriate terminals for biased
clamping circuits. Connect the CRO across the output terminals and observe the output
waveform on the CRO. Draw the input and output waveforms on the graph paper
Procedure for Negative Clamper:
Connect the Sine Wave Generation to the input terminals of the circuit. Connect the mains cord to the trainer and switch on the mains supply. Switch ON the power switch of the trainer. Connect the negative DC power supply to appropriate terminals for biased
clamping circuits. Connect the CRO across the output terminals and observe the output
waveform on the CRO. Draw the input and output waveforms on the graph paper.
CONCLUSION:-
Comment on the nature of output waveform.
QUIZ:-
1. What is clipper circuit?
2. What is clamper circuit?
3. Explain the application of clipper circuit.
4. Explain the application of clamper circuit.
5. Explain the biased clamper circuit.

EXPERIMENT NO. 09 DATE: _____________
AIM: To Obtain the Input & Output Characteristics of CE Configuration of
BJT.
APPARATUS: -
NPN Transistor
Resistances 1KΩ
DC Power Supply 0 – 30 V
Ammeter 0 – 1 mA & 0 – 10 mA
Voltmeter 0 – 2 V & 0 – 30 V
Bread Board
THEORY:-
The CE configuration of transistor has two types of characteristics.
I/P characteristic
O/P characteristic
Input Characteristic:
It is the curve between base current IB & base-emitter voltage VBE at constant
collector-emitter voltage VCE. From this characteristic, we can have the following
information.
The input characteristic is same as that of the forward diode curve since the
base-emitter section of transistor is a diode & it is forward bias.
IB increases less rapidly with VBE, thus the input resistance of CE connection
is somewhat higher.
The characteristic gives the i/p resistance which is the ratio of change in base-
emitter voltage (∆VBE) to the resulting change in base current (∆IB) at constant
collector-emitter voltage VCE.
Input resistance, ri = (∆VBE) / (∆IB) at constant VCE
Output Characteristic: It is the curve between collector current IC & collector-emitter voltage VCE at
constant base current IB. From this characteristic, we can have the following
information.
The collector current IC varies with VCE only at very low voltages (<1V).The
transistor is never operated in this region. When the collector-emitter voltage
VCE is increased above 1-2 volt, the collector current becomes constant. It
means the collector current IC is independent of collector-emitter voltage VCE.
The value of VCE up to which collector current IC changes is called Knee
voltage (Vknee).The transistor operates above this region as above knee region,
IC is almost constant.

For any value of VCE above knee voltage, the collector current is
approximately equal to β X IB.
The o/p resistance is the ratio of change in collector-emitter voltage (∆VCE) to
the resulting change in collector current (∆IC) at constant base current.
Output resistance, ro= (∆VCE) / (∆IC) at constant IB
PROCEDURE:-
Input Characteristic:
Connect the circuit as per the circuit diagram.
Set VCE=4V, very VBE in step of 0.1V & note down the corresponding IB.
Repeat the above procedure for VCE=6 & 8 V.
Plot the graph VBE vs IB for a constant VCE.
Output Characteristic:
Connect the circuit as per circuit diagram.
Set IB=20μA, very VCE in step of 1V & note down the corresponding IC.
Repeat the above procedure for IB=40μA.
Plot the graph VCE vs IC for a constant IB.
Plot the graph VCB vs. IC for a cons
OBSERVATIN TABLE:- Input Characteristics
Sr.
No.
VCE= ___ V VCE= ___ V VCE= ___ V
IB
(mA)
VBE
(Volt)
IB
(mA)
VBE
(Volt)
IB
(mA)
VBE
(Volt)
1.
2.
3.
4.
5.
6.
7.
8.
9.
10.

Output Characteristics
CONCLUSION:-
Sr.
No.
IB= ___ µA IB= ___ µA
IC
(mA)
VCE
(Volt)
IC
(mA)
VCE
(Volt)
1.
2.
3.
4.
5.
6.
7.
8.
9.
10.

EXPERIMENT NO. 10 DATE: _____________
AIM: To Obtain the Input & Output Characteristics of CB Configuration of
BJT.
APPARATUS: -
NPN Transistor
Resistances 1KΩ
DC Power Supply 0 – 30 V
Ammeter 0 – 1 mA & 0 – 10 mA
Voltmeter 0 – 2 V & 0 – 30 V
Bread Board
THEORY:-
The CB configuration of transistor has two types of characteristics:
I/P characteristic
O/P characteristic.
Input Characteristic:
It is the curve between emitter current IE & emitter-base voltage VBE at constant
collector-base voltage VCB. From this characteristic, we can have the following
information.
The emitter current IE increases rapidly with small increase in emitter-base
voltage VBE. It means that input resistance is very small.
The emitter current is almost independent of collector-base voltage VCB.
The characteristic gives the i/p resistance which is the ratio of change in
emitter-base voltage (∆VBE) to the resulting change in emitter current (∆IE) at
constant collector-base voltage VCB.
Input resistance, ri = (∆VBE) / (∆IE) at constant VCB
Output Characteristic:
It is the curve between collector current IC & collector-base voltage VCB at
constant emitter current IE. From this characteristic, we can have the following
information.
The collector current IC varies with VCB only at very low voltages (< 1V).The
transistor is never operated in this region.
When the collector-base voltage VCB is increased above 1-2 volt, the collector
current becomes constant. It means the collector current IC is independent of

collector-base voltage VCB & depends upon IE only. Thus the entire emitter
current will go to the collector terminal.
The o/p resistance is very high because a very large change in collector-base
voltage produces only a small change in collector current. The o/p resistance
is the ratio of change in collector-base voltage (∆VCB) to the resulting change
in collector current (∆IC) at constant emitter current.
Output resistance, ro= (∆VCB) / (∆IC) at constant IE
PROCEDURE:-
Input Characteristic
Connect the circuit as per the circuit diagram.
Set VCB=4V, very VEB in step of 0.1V & note down the corresponding IE.
Repeat the above procedure for VCB=6 & 8 V.
Plot the graph VEB vs. IE for a constant VCB.
Output Characteristic
Connect the circuit as per circuit diagram.
Set IE=2mA, very VCB in step of 1V & note down the corresponding IC.
Repeat the above procedure for IE=4mA.
Plot the graph VCB vs. IC for a cons
OBSERVATIN TABLE:-
Input Characteristics
Sr.
No.
VCB=___V VCB=___V VCB=___V
IE
(mA)
VEB
(Volt)
IE
(mA)
VEB
(Volt)
IE
(mA)
VEB
(Volt)
1.
2.
3.
4.
5.
6.
7.
8.
9.
10.

Output Characteristics
CONCLUSION:-
Sr.
No.
IE=___mA IE=___mA
IC
(mA)
VCB (Volt) IC
(mA)
VCB (Volt)
1.
2.
3.
4.
5.
6.
7.
8.
9.
10.
