basic education quality in ghanaunescoghana.org/wp-content/uploads/2017/08/basic...review of basic...
TRANSCRIPT

Basic Education Quality in Ghana
Basic Education in Ghana: Progress and Problems
Final Report
June 2009

Review of Basic Education Quality in Ghana
Basic Education in Ghana: Progress and Problems
by
The Mitchell Group Kafui Etsey
Thomas M Smith Emma Gyamera
Joe Koka Jennifer de Boer Emmanuel Havi
Stephen P. Heyneman (coordinator)
June 29, 2009 Disclaimer: Ths report is made possible by the support of the American People through the United States Agency for International Development (USAID) . The authors’ views expressed in this publication do not necessarily reflect the views of the U.S. Agency for International Development or the United States Government

Contents
Page Number
Executive summary…………………………………………………………...2 Background…………………………………………………………………...3 Methods………………………………………………………………………5 Data analysis…………………………………………………………………7 Case studies…………………………………………………………………16 Discussion…………………………………………………………………..22 Recommendations for Education Sector Group Ghana…………………….24 Appendices

Executive Summary Enrollment in basic education has made significant progress in Ghana but learning achievements appear to have stagnated. This four month project was designed to combine achievement and school resource information into a single data base and assess the degree to which particular resources were associated with better performance. Background documents were studied to assess the current context of education in Ghana. Interviews with teachers, head teachers, district education officers and other stakeholders were conducted to gauge their views on the source of the problems and possible solutions. Two districts were chosen as case studies for a more in depth analysis. The new data base provided a district-by-district snapshot of achievement and school input improvements over time by comparison to national averages for each of the 138 districts in the country. The results of the data analyses suggest that the quality of basic education is at a cross roads. The system will require new resources, including those from non-government sources. Improving student achievement will also require that new resources are allocated in new ways. Suggestions are made to USAID, other development partners and to the GOG on the content of these new directions.
Background In the past, Ghanain education sector strategies have tried to provide basic education for all free of private cost, concentrated assistance on increasing access in deprived districts, shifted emphasis from hardware (school construction) to software (improvements to teacher training, learning materials, and classroom management) and emphasized aid to specific populations known to be underserved and rural. USAID for instance have helped to support projects on:
• Quality Improvement in Primary Schools (QUIPS)
• Basic Education Comprehensive Assessment System (BECAS)
• Quality Education for All (EQUALL)
• National Literacy Acceleration Program (NALAP)
• The Grants and Reporting Accountability to Improve Trust (GAIT) Between 2003 and 2006 the Gross Enrollment Rate in Ghana increased from 87 to 94% and the junior secondary school enrollment rate from 73 – 77%. The completion rate of primary school is currently 85% and the completion rate in junior secondary school is 65%. These are significant accomplishments in relation to the 2003 – 2015 Education Sector Plan. However this plan is scheduled to be replaced with a new plan which would guide Ghana’s Education Sector from 2010 to 2020. One key question for this new plan is whether recent increases in enrollment have been matched by an increase in achievement. Collaboration between the Government of Ghana and USAID has generated several new sets of data able to respond to this question. The National Education Assessment (NEA) tested children in grade three and six in a national sample of schools in 2005 and 2007. A School Education Assessment tested children in 2006 in both English and Mathematics. While enrollment rates in primary and junior secondary schooling have risen as policies have been implemented to support Education for All, English and mathematics achievement results from the 2005 and 2007 NEA indicate that Ghanaian primary students continue to perform at levels far below proficiency. For example, in 2007 70.62 percent of P6 students performed at the minimum competency level (35% correct on the assessment) in English, the language of instruction in the upper primary grades, and only 27.69% attained the level of proficient or above (55% correct on the assessment). Performance in mathematics was even worse, with only 48.05% of P6 students reaching the minimum competency level and 14.39% attaining proficiency (Ministry of Education, 2009). What accounts for the low level of achievement across schools in Ghana? To what extent does variability in human and physical resource explain differences across schools? Fortunately the education sector in Ghana has reasonably reliable information on available equipment, infrastructure and management characteristics of every primary school in the country. This Education Management Information System (EMIS) however, has never been used in conjunction with academic achievement information. Hence one important purpose of this project was to merge the EMIS and the NEA data sources into a single file and to explore the characteristics which associated with high or low performance. This project was designed to be rapidly implemented between March and June, 2009 so that it could inform the new discussions occurring within the Ministry of Education and the Ghana Education Service over the design and objectives of the new Education Sector Plan of 2010 – 2020. Four products were envisioned:
• A district-by-district snapshot of the state of education in each of the 139 districts with, so far as possible, information on learning achievements, infrastructure improvements and management characteristics by comparison to national and regional averages

• An analytic report on the characteristics which appeared to be most closely associated with better achievement
• A study of two illustrative case districts with descriptions of findings relevant to those of the
snapshot and analytic report
• A PowerPoint presentation to summarize the three other projects and the recommendations for USAID and, perhaps, the Government of Ghana.
The Mitchell Group engaged temporary consultants from Vanderbilt and from Ghana to implement the work and deliver the products requested.

Methods Background documents on the Education Sector in Ghana were gathered and analyzed. A list of these documents appears in Appendix A and the essence of their findings appears throughout the report, the data analysis, and the presentation. 2005 and 2007 NEA data sets were obtained and merged into a single STATA file with the school-level EMIS data. These data are the basis of the data analysis section of this report. Th District Snap Shots include data from multiple sources, including district-level average scores from the NEA, district-level pass rates from the high stakes West African Examination Council BECE test for tertiary education, and enrollment, resource and management information form the EMIS. Our original intent was to choose two outlier districts as case study districts, a low-resourced, high performing rural district and a high resourced low-performing urban or peri-urban districts. In practice, however. two ideal examples were not so easy to identify. For the first district we picked Assin South, a typical rural community in the Central Region with both poor performance and moderate resources relative to others. For the second district we picked North Dayi (Kapando), a district privileged in terms of resources and but average in terms of performance relative to others. In each district we interviewed teachers and administrators in five schools which had participated in the 2005 or 2007 NEA achievement study. We examined the performance of each school its resources, infrastructure, teacher quality, community and managerial support and teacher motivation. Stakeholders were interviewed as to their perception of the problems and successes of the education sector. These included five senior members of the Ministry of Education, 13 members of the GES including Circuit Supervisors, officials in District Education Offices (DEOs), and headteachers of both primary schools and teacher training colleges. Interviews were also conducted with USAID staff members, contractors, and senior staff at the World Bank, UNICEF, and the West African Examinations Council. The name and affiliation of each stakeholder and a summary of these interviews can be found in Appendix F. Missing data or variables without sufficient variation made the selection of data for the District Snap Shots more complex than it appeared at the outset. In the final version, we included indicators which we believe are important to monitor for the improvement of education quality and are available for most of the the 138 districts in Ghana. District indicators include:
• Achievement over time on NEA and BECE tests
• Participation rates in terms of net school enrollment over time, as well as completion, dropout and repetition rates
• The quality of school infrastructure in terms of drinking water, electricity, toilets and needed
repairs
• School management in terms of the frequency of school management committee (SMC) meetings and visits from the circuit supervisor, free meals provided, and the portion of schools with a book to record teacher attendance
• Teaching and learning materials in terms of available writing places, library books and textbooks /
student.
Each of these characteristics is compared over time with a national average, in each year between the school years ending in 2005 and 2008. For the data analysis chapter on school resources and academic achievement, NEA and EMIS data were used in multiple ways. First descriptive statistics on achievement and resource variables were used to

identify basic tendencies. Further analyses were conducted using ordinary least squares regressions, adjusted for the school-based sampling design of the NEA assessment. Checks for robustness were conducted using fixed- and random effects models and testing the sensitivity of the results from the inclusion of different independent variables. These sources of information were then analyzed for the design of the Power Point presentation to USAID and GOG personnel. Though quite different in their purposes, designs and intentions, the results were quite consistent across products. Thes are summarized in the Overall Findings section and the implications discussed in the Recommendations section.

The Production of Education Quality in Ghana Thomas M. Smith Jennifer DeBoer Vanderbilt University Background Education in Ghana has gone through numerous and substantial changes since independence. The last ten years alone have seen a series of concerted efforts on the parts of the Ghanaian government and its development partners to address educational inequity and improve overall quality. While a number of policy reforms and interventions have improved access to Ghana’s school-aged population, improving instructional quality and student achievement remain critical challenges. This report uses recent assessment data and school census information to examine the link between educational achievement and school-level supports and resources in Ghana today. Previous Successes and Challenges To conform to the Millennium Development Goals (MDGs) and the efforts of Education for All (EFA), Ghana has put resources towards expanding access to primary education. Previous strategies in Ghana have focused on providing support for “deprived districts” and particular demographic groups (e.g., out-of-school children in the Schools for Life program, Casely-Hayford, L., and Baisie, A., 2007; Appendix A lists the literature reviewed, Appendix B for recent notable interventions in Ghana). The Free, Compulsory, Universal Basic Education Program (fCUBE),has helped Ghana make important strides towards bringing children from deprived demographic groups into the formal education system. As has been the case in countries expanding to meet EFA goals, however, the massive influx of students has put a corresponding strain on resources. Physical resources such as desks and classroom space, human resources like trained teachers, and learning materials like textbooks have not keep pace with the number of students enrolling. To address this shortage of resources, the bulk of support from development partners and the government has gone towards building classrooms and recruiting and training more teachers. More recently there has been a move away from focusing support on basic physical resources toward improving the management of schools and classrooms (von Donge, J., White, W., Masset, E.,2002). More significantly, there has been a shift in donor support and government programs from a focus on access (as exemplified by programs like fCUBE) to a greater focus on achievement and quality (e.g., EQUALL). For example, USAID has supported the development of the Basic Education Comprehensive Assessment System (BECAS), which introduced a nationwide measurement tool for assessing education quality in primary grades, where previously, the “Criterion Referenced Test” (CRT) was not well-aligned with what the schools taught and did not have an accessible scale for reporting results (Long, Schuh Moore, Snyder, P& Adu, 2007). International Comparisons The perception of Ghana is one of a successful, stable developing country that draws much attention from the donor community. Education institutions, including universities, have been in place for a number of years, and education reforms targeted toward expanding enrollment and improving management and supervision have been implemented for decades. However, in cross-national comparisons Ghana performs significantly below other African countries. For example, in the Trends in International Math and Science Study (TIMSS) 2003, Ghana’s scores fell well below all of the others that took part in the assessment, including South Africa, Botswana, Morocco, Tunisia, and Egypt. In TIMSS 2007, Ghana’s scores were also among the lowest, behind Algeria, Botswana, Egypt, and Tunisia as well as falling short of the scores of countries at similar income levels in other regions, as well as the upper and middle income countries that

comprise the OECD. (Data to generate these scores can be downloaded from the TIMSS website, timss.bc.edu.) Current Situation The lack of advancement in achievement is conspicuous given the level resources invested to date. (US$1 billion was spent on the education sector in 2006, including government, donor, and other sources. Thompson & Casely-Hayford, 2008.) The predominately supply-driven improvements have not sparked a corresponding leap in achievement for public school students. In addition, the private school system consistently outperforms the public schools. The challenges of supporting universal basic education while at the same time delivering quality learning have been recognized, and more recent policies have concentrated on education quality. However, achievement at the primary level has yet to move forward. Purpose The purpose of this paper is to examine the relationship between primary student achievement and the level of human and physical resources allocated across schools in Ghana. The first question we address is whether schools with greater resources tend to have better average achievement. We then examine which resources are more associated with greater achievement. For example, the government has increased funding for teaching and learning materials like textbooks in recent years, but are more textbooks per students associated with greater academic outcomes? We also look at whether differences in resources can explain disparities in achievement between urban and rural areas and between different regions in Ghana. The general trends in the data point towards a need for devoting more funding towards key resources and to utilizing current available resources more efficiently. Data This analysis examined data from BECAS, including the National Education Assessment data (NEA), and from the Ministry of Education, including school census information stored in the Education Management Information System data (EMIS). The report describes the multiple data analyses conducted, first on the NEA achievement data and then on the school-level factors in the EMIS dataset. The NEA data come from assessments conducted in the spring of academic years 2004-2005 and 2006-2007. The schools assessed comprise a nationally representative sample, approximately 3.5% of the schools in Ghana. The English and mathematics assessments were given on separate days, so the number of students taking each test differed. The EMIS data come from the yearly school census that gathers data on school-level inputs, including physical, learning, and human resource information. For this report, EMIS data was available from 2004/2005, 2005/2006, 2006/2007, and 2007/2008. However, the census developed over this time period, and some information available more recently is not available for earlier years. Also, there is a notable amount of missing data for some schools. For this, the data analysis part of the report, only EMIS information for the schools included in the NEA sample was used. Methods A variety of methods were used to analyze these data and explore our research questions. Descriptive statistics on the achievement and resource variables of interest illustrate basic tendencies. Further analyses were conducted using ordinary least squares regressions, adjusted for the school-based sampling design of the NEA assessment. Robustness checks were conducted using fixed-effects and random-effects models and testing the sensitivity of the results to the inclusion of different independent variables. Results of Data Analysis—2005 and 2007 National Education Assessment The new measurement tool, the National Education Assessment (NEA), is a multiple choice assessment at P3 and P6 students in mathematics and English in a random sample of schools across Ghana. The

assessment was first conducted in 2005, a comparable follow-up was done in 2007, and a revised assessment is planned for 2009. Both Ghanaian policy makers and international development officials perceive current achievement outcomes as falling short when compared to the resources invested in the education system over the past two decades. Although previous research noted in the background section indicates that major investments in human and physical resources have not resulted in major increases in student achievement, there is a tendency for student achievement to be greater in schools that have greater human and physical resources, although the relationship is strong for only a few selected inputs. The data presented in Table 0 illustrate this relationship, showing the level of a particular resource for low, medium, and high performing schools on the P6 English assessment. For example, while 45.1 percent of teachers in low performing schools (defined as those below the 35th percentile of performance) held no teaching qualification (i.e., they were “untrained”), only 8.7 percent of teachers in high performing schools (those at or above the 55th percentile of performance) held no teaching qualification. Higher performing schools were also more likely to have electricity (47.3%) and functional toilets (60%) than low performing schools (9.1 and 53.7%, respectively). High performing schools also tended to be located in urban communities (those with over 5,000 residents) and in districts that include four major population centers in Ghana (Accra, Tema, Kumasi, or Takoradi). High performing schools also tend to have lower dropout rates, as well as similar numbers of students in P6 and P1, an indicator that may proxy retention (Tables 1-4 in Appendix D show this in more detail). This relationship between resources and achievement outcomes is the focus of the analysis that follows. Table 0. Mean resources in 2007, by class 6 English proficiency level (abbreviated) LOW MEDIUM HIGH % untrained teachers 45.1 26.0 8.7 % schools with functional toilets 53.7 58.5 60.0 % schools with electricity 9.1 22.9 47.3 % urban 8.5 31.7 72.2 % in one of the four largest urban districts 1.6 8.0 39.1 % dropout 5.8 3.7 2.9 P6/P1 enrolment 0.66 0.84 0.95 We begin our analysis by exploring recent changes in both primary level inputs and processes. Considerable resources have been invested in improving the level of teacher quality, amount of teaching and learning materials, and the infrastructure of Ghanaian primary schools. More recently, reform initiatives have focused on increasing local decision making and increasing monitoring and supervision of teachers and head teachers. We focus on changes between 2005 and 2007 in these inputs and processes across the schools in which students took the NEA in these years1. Then we examine the relationship between these inputs and processes and between-school variation in P6 student achievement. While the cross-sectional nature of the NEA data, merged with school level census data from EMIS, does not allow causal attribution to specific inputs or processes, the relationships detailed below can be useful for setting priorities, including targeting funding to schools facing particular challenges or for designing intervention to address specific education needs. Next we examine whether between region differences in inputs and processes explain variability across regions in P6 student achievement. Prior analyses by the MoESS have shown that students in the Greater Accra region score higher than the national average and that students in the Northern Region score lower than the national average (Ghana Ministry of Education, 2009). We extend these findings by examining the degree to which both regional differences and urban/rural differences in P6 achievement can be explained by regional or urban/rural differences in the level of teacher quality, the amount of teaching and learning materials, the quality of school infrastructure, and variation in local decision making and monitoring and supervision of teachers and head teachers. These analyses can help build the case for targeting resources 1 Variables only available for 2007 and therefore used as proxies for where the school might be in 2005: (a) school in need of major repairs, (b) existence of a school meals program, (c) library books per pupil, (d) urbanicity, (e) dropout, (f) SMC meetings, (g) CS visits, (h) drinking water, (i) electricity, (j) deprived.

and interventions to regions and districts (as detailed in the District Snapshots in Appendix E) that lag behind in both inputs, processes, and outcomes. Large regional differences could imply more careful targeting of managerial interventions at the district level to correspond to the recent changes in district governance. There are further within-region differences that could indicate targeting specific districts (e.g., rural school districts) might address important disparities. Gender comparisons were run, and while there appear to be disparities in one or two particular regions, differences were relatively small and not explained by the resources present. The hypothesis that the Northern Zone has a greater gender gap was not confirmed. However, interacting the female and rural/urban variable revealed that rural areas may have a larger gender gap. Further, some regions in particular display larger gender gaps, for example, the Upper West region (Table 9). For the purposes of illustration, the descriptions of results focus on P6 English scores. Relationships for mathematics and for P3 were roughly comparable, as illustrated in regression results in Appendix D, Table 7. School type (to investigate EQUALL schools) was included as a regressor in an additional analysis (Table 11). Differences in inputs and processes in NEA schools in 2005 and 2007 We begin by examining changes in the level of teacher quality, the quantity of teaching and learning materials, and the quality of some school infrastructure measures between 2005 and 2007 (Table 5). The school census only began asking questions about availability of electricity and drinkable water, the condition of classrooms, and the level of local decision making and monitoring and supervision in 2007, so we are not able to assess change over time on these measures. Table 5. Mean resource levels in 2005 and 2007 2005 2007 change standard error Pupil/teacher ratio 44.00 38.11 -5.89 1.79 Math texts per pupil 0.55 0.89 0.34 0.04 English texts per pupil 0.25 0.87 0.63 0.03 Seats per pupil 0.81 0.88 0.07 0.03 Writing places per pupil 0.81 0.85 0.03 0.03 Percent of schools with toilets 0.51 0.56 0.06 0.04 Guides per teacher 3.47 2.24 -1.23 0.52 P6/P1 enrolment 0.86 0.75 -0.12 0.04 Dropout 0.05 0.04 -0.01 0.02 There is considerable concern among both policy makers and head teachers surrounding the employment of “untrained” teachers, often individuals hired by District Assemblies, such as through the National Youth Unemployment Program, or by communities. Untrained teachers often begin teaching at schools with minimal or no formal training in pedagogy. A lack of formal training may constitute not only less training in teaching practices, but also lower overall educational attainment (and or/quality). In one of our remote, case-study schools in the Central Region the Head Teacher complained that untrained teachers assigned to his school “do not know how to prepare lesson books and do not know how to prepare and use teaching and learning materials.” A community teacher at the same school reported having only completed her secondary school certificate. According to the EMIS data for all schools, the proportion untrained teachers increased from 29.57% to 35.77% in 20072. Over the same time period, the pupil teacher ratio declined from 43.99 to 38.113, indicating that teacher recruitment and retention has kept up with expanding enrolment.
2 (t=2.03, p=.044) 3 (t=3.28, p=.001)

Consistent with previous studies, teachers in our case study schools cited a lack of teacher and learning materials as being a major challenge to improving teaching and learning. The EMIS data made available to us only contained information on the number of English textbooks per student, the number of mathematics textbooks per student, the number of library books per student, and the number of teacher guides / handbooks per teacher. Information about availability of charts and drawings or hand on science or mathematics materials is not available. Between 2005 and 2007, there was a decline in teacher guides per teacher4, but sizable increases in mathematics textbooks per student (.55 to .89)5 and English textbooks per student (.24 to .87)6. Data on library books per student is only available for 2007, where the average was .56. The MOESS, District Assemblies, and wide range of donors have invested in the improvement of school infrastructure over the past two decades. Between 2005 and 2007, the proportion of schools with functioning toilets increased from 51% to 56%7 and in schools with functioning urinals increased from 37% to 61%8. In 2007, 50% of students were in schools with drinkable water available, 17% of students were in schools with electricity, and 24% of students classrooms were in need of major repair. Another component of school infrastructure involves whether students have a place to sit and a place to write in their classroom. We created a variable that takes the number of seating places per student and the number of writing places per student and capped it at one, under the assumption that benches and desks/tables can be moved from classroom to classroom and students are not likely to benefit from having an excess of sitting and writing places in their school. The average number of sitting and writing places per student in students’ schools were stable between 2005 and 2007, with both being around .75. As noted above, decentralization and increased monitoring and supervision of school have been key components of both government reform initiatives and donor funded interventions (Thompson & Casely-Hayford, 2008). Two measures from the school census are available to assess the extent to which these forms of management and supervision are affecting schools: the frequency of school management committee (SMC) meetings (does not meet, once a year, once a term, twice a term or more) and the frequency of visits by the Circuit Supervisor. School management committees were instituted as a way to bring together the important players in local school management, originally to review BECE scores. These groups comprise teachers, school administration, community members and parents, and students. Circuit Supervisors are employed by the district office to visit a set of schools periodically and assess teaching and administrative practices. One of the difficulties often mentioned in prior research and in our case study interviews, though, is that these supervisors are not reimbursed for their travel to the schools, and so they may not visit as often as reported or demanded (Ampiah & Yamada, 2008). In 2007, few NEA schools reported that their SMCs were not meeting (6%). The vast majority of students’ schools reported that their SMC met once per term (42%) or twice a term or more (35%). Students’ schools also reported frequent visits from Circuit Supervisors, with 87 percent reporting visits of twice or more per term. While frequent meetings of the SMC do not necessarily mean that schools are being governed in effective ways any more than frequent visits by Circuit Supervisors necessarily mean that teachers are being held accountable for high quality teaching and learning, these measure indicate that schools and districts are at least adopting the forms of decentralization and increased monitoring of instruction. Explaining between school variation9 in NEA scores 4 (t=-2.34, p=.02) 5 (t=8.66, p<.001) 6 (t=20.15, p<.001) 7 (t=1.43, p<.153) 8 (t=5.88, p<.001) 9 Between-school variation refers to the overall differences in the achievement of students at different schools, a result of differences in resources that are true for entire schools above and beyond factors that differ from student to student. We look at between-school variation here as an amenable policy lever, both because of the lack of student background factors in our datasets and because of the policy options in Ghana’s system.

Next we examine the relationship between primary school achievement and the school-level inputs and processes detailed in the previous section. To conduct the analysis we ran a series of regression analyses modeling school-level teacher quality (proportion of teachers in the school who are untrained), quantity of teaching and learning materials (English textbooks per student (or math textbooks per student in models predicting math achievement), library books per student, and guides/handbooks per teacher), quality of school infrastructure (whether the school has functioning toilets, functioning electricity, access to drinkable water; the percentage of classrooms in need of major repairs, and the number of writing places per student), and the level of community involvement and district-level supervision (frequency of SMC meeting and Circuit Supervisor visits) on P6 English achievement in 2005 and 200710. In doing so, we tried to use these input variables to explain the achievement outcomes. We also controlled for the year of the assessment (2005 or 2007), whether the school was in an urban community (5,000 or more people), whether the district included one of the four major population centers in Ghana (Accra, Tema, Kumasi, or Takoradi)11, school size, and whether the district in which the school is located is classified as “deprived” by the MOESS or whether the school was part of the USAID sponsored EQUALL program. We also control for the ratio of P6 enrollment to P1 enrolment as a rough estimate of the likelihood that students in the school progress to P6. This measure can also be affected, however, by policies and other trends affecting P1 enrolment rates, such as the introduction of the Capitation Grant, which would not have an immediate effect on P6 enrolment).
Controls for the number of children present on test day were also included. This variable was constructed by counting the number of children present in each school for the respective exams and dividing that by the school’s reported enrolment for the respective grade.) The results are presented in Appendices A-E and the main relationships are summarized here. Location and control variables Location of the community or school a student is in may be closely related to the opportunities and support they have for learning. In order to be able to say, for example, that textbooks are related to higher achievement scores, we have to also take into account “control variables” such as urbanicity or region. The English NEA scores of P6 students in the districts of Accra, Tema, Kumasi, or Shama-Ahanta East scored 6.3 points higher than their counterparts in other districts12, holding other variables in the model constant. Students whose school was located in an urban community (5,000 or more people) also tended to score higher than students whose schools were located in smaller communities13. While predicted English scores of students in districts classified as deprived were less than those in districts not classified as deprived14, the difference was not significant. P6 students in schools supported by the EQUAL program also had scores similar to their counterparts in other schools for math and slightly higher for English. This is a positive finding in that student performance in EQUALL schools at the start of the interventions tended to be low compared to other schools (EQUALL, 2008). Schools with more students enrolled also tended to have higher scores. Teacher Training “Teacher quality” is an elusive concept to describe and to measure. Here, the most information is available on teacher training, which is what we use in our report to gauge teacher quality, though it is not the only
10 As noted above, some of the input/processes variables recorded in 2006/2007 were used as proxies for unavailable data in 2004/2005. 11 VIF was calculated for the full model; while many of these explanatory variables were correlated, including urban and superurban, they did not appear to present a multicollinearity problem. 12 (β= 6.33, p=.001) 13 (β= 3.44, p=.003) 14 (β= -.09, p= 0.930)

measure. The proportion of teachers in a school who are untrained had a strong association with P6 students’ English achievement15, holding other variables in the model constant. A student in a school where half of the teachers were untrained would have a predicted English score 3.5 points lower than a student in a school with no untrained teachers, an effect size of approximately .23. While this may noinitially appear to be a practically significant difference, it is nearly the same difference in expected scores between a student in a rural school and an urban school, and in education research, this is a moderatelystrong effect. Differences in P6 student performance across schools with different pupil teacher ratios weresmall and not statistically significa 16
t
nt .
Quantity of teaching and learning materials Increased access to teaching and learning materials in the school, as measured by English textbooks per student, library books per student, and guides/handbooks per teacher, were not strongly related to increased student performance in English. One possible reason for this lack of relationship could be that the materials reported in the census did not directly benefit P6 students (e.g., if an increase in textbooks corresponded to large increases in P1 enrollment as a result of the capitation grant). Quality of school infrastructure Students with schools with functional electricity17 tended to have higher performance on the English assessment than the counterparts without these resources. Electricity here may be a proxy for remoteness of the school, as our case study reports indicate that electricity in the schools was not used for learning purposes (unless the schools had computers). Whether the school has functioning toilets or access to drinkable water was not strongly related to English achievement, nor was the proportion of classrooms in need of major repair. Access to electricity in school may be serving as a proxy for a school not being located near a major road. This variable may also be serving as a proxy for schools that do not have sufficient classroom space and conduct classes in the “plain air”. Community involvement and district-level supervision Increased frequency of SMC meetings was not clearly associated with increased student performance in English at P6. While students in schools whose SMC met once a year had lower average achievement relative to schools whose SMC met more frequently18, students in schools whose SMC did not meet tended to have higher scores than those in schools whose SMCs met once per year, though none of these comparisons were significant19. It may be possible that higher performing schools have not felt the need to organize or actively engage a SMC. In addition, frequency of visits by the Circuit Supervisor was not associated with variation in English achievement, although there was not a lot of variability across schools in the reported frequency of these visits. Explaining between school region variation in NEA scores While the ultimate goal of education reform and donor support is to effect change for each student in Ghana, policy changes at the macro-level can more easily produce changes between schools, districts, and regions, so we are interested in these larger variations. As noted above, performance on NEA English scores varied considerably across regions. Students in P6 in the Greater Accra Region scored between 8.8 and 15.0 points more than their counterparts in the other 9 regions. Students in the Ashanti region scored between 2 and 6 points greater than students in the other regions (Figure 1; Table 8).
15 (β= -6.57, p<.001) 16 (β= .011, p= 0.773) 17 (β= 4.16, p=.001) 18 (t=1.06, p=0.481; t=1.81, p=0.224) 19 (t=1.61, p=0.108)

At least part of this difference can be explained by between-region differences in the proximity of schools to urban areas. After controlling for students enrolled in the districts of Accra, Tema, Kumasi, and Shama-Ahanta East (Takoradi) gaps between the Greater Accra region and others narrow by about a half, although each of the gaps remain statistically significant. After adjusting for a school’s location in an urban community (5,000 or more people), the gaps between regions narrow further (Figure 2). After controlling for between school, and thus regional, differences in teacher quality, quantity of teaching and learning materials, infrastructure, or either the level of participation of the community in school affairs or the degree of monitoring of the school by district authorities, the gaps in P6 English achievement continued to narrow across regions. However, the gap in predicted scores between Greater Accra and other regions remains between 1.5 and 5.5 percentage points, although gaps with Brong Ahafo and the Eastern Region are no longer statistically significant (Table 8). There may be factors that have not been measured that are different between schools and students areas across regions and are important for achievement. Much of this considerable closing of the regional gaps is explained by the cross regional differences in the inputs and processes introduced in the model presented in Figures 3-5. For example, while the Greater Accra, Volta, Ashanti, and Eastern regions had P3 and P6 students in schools with 16 percent or fewer untrained teachers (2.3%, 9.6%, 16.1%, and 16.6%, respectively) the Upper East, Brong Ahafo, Central, Upper West, Western, and Northern regions had students in schools with between 29% and 40% of teachers untrained. Further, the percentage of P3 and P6 students in schools with functional electricity was greatest in the Greater Accra Region (52%) and least in the Northern and Upper West regions (2.7% and 3.3% respectively). Finally, while the number of writing places per student was a significant predictor of between school variation in P6 English achievement, this indicator varied less than other across regions, ranging from below .70 in the Upper East, Northern, and Brong Ahafo regions to .80 or above in the Central, Western, and Greater Accra Regions. Regarding localized decision making, students in the Central and Greater Accra regions were most likely to be in schools were the SMC does not meet at all while students in the Volta Region were most likely to have their school’s SMC meet twice or more a term. SMC meetings did not display a strong, intuitive relationship to achievement, so more research may be necessary to discern the utility of this governance support; perhaps groups are only meeting in areas where academic problems must be addressed, or perhaps ad hoc meetings and not official SMC meetings abound in some areas where the school is strongly supported. Explaining between school urban/rural variation The urban/rural gap is a persistent problem for education systems around the world. While previous strategies in Ghana have targeted this disparity, and some resource disadvantages appear to have been addressed, the gap in achievement is still strong and significant. Table 10 illustrates how the basic score difference between students in urban and rural areas is not fully explained by the resource differences between the locales20. Living in or near one of the four large population centers is also strongly related to higher achievement21. There could be a number of explanations for this continued inequality, one of which is a difference in home background resources that is unmeasured in our dataset. Conclusions These results suggest a few general conclusions. First, although previous investments in resources do not seem to have jump-started achievement to the extent hoped by the government and donor partners, some resources do appear to be related to achievement in an important way. Overall, the findings show that demographic differences (e.g., urban/rural) in resources have been mitigated to a certain extent, but the corresponding disparities in achievement have yet to follow suit. Targeting the resources that appear to be most closely related to achievement may be more effective (e.g., teacher quality, community attitudes
20 (β= 4.16, p<.001 for full model) 21 (β= 5.53, p<.001)

towards education). Most markedly, the urban/rural and regional differences persist, even when controlling for resource differences. Some of these resources may be amenable to policy interventions—improving human resources, for example, could be effective policy levers by focusing on putting better-educated teachers in underperforming areas. Learning resources like textbooks do not appear to be related achievement in our study, but the question of implementation raised in the literature and in interviews may indicate these resources are still an issue. In some areas, schools receive the necessary materials halfway through the year; more generally, sufficient numbers of textbooks are a recent development, and achievement outcomes may need more time to catch up to these input changes. Finally, community resources could be key for long-term, sustained improvement. Electricity was a strong predictor of achievement, but interviews pointed out that electricity is not often used for learning purposes but is instead more of a proxy of remoteness and of community investment in the schools. In rural, agricultural areas, it is an accepted practice for parents to pull children out of school for market days or for harvesting. Local capital for schools in the form of community attitudes and investment in primary schooling may be vital to significantly improving achievement in Ghana. To address these conclusions in a meaningful way, policymakers could implement the following suggestions. First, the types of data collection that permitted the above analyses are vital to better understanding Ghana’s school system and how to move it forward. In our basic models, we were able to explain at most 18% of the variance. While this is not extremely low for education models, this would probably be much higher if variables like student-level SES could be included. Further, when running a multilevel model, there is a reduction of 39.48% in the between-school variance when including the variables used in our full model (Model 4). These and other assessments should continue, and the quality of the datasets that result from gathering this important information should be improved. Second, more detailed data on student background factors could reveal more precisely the determinants of achievement here and could shed light on the “dilemma” that this analysis does not completely answer. Having no background on students (e.g., SES, other home environment factors) handicaps the research that analysts can conduct. More thorough data collection practices, resulting in less missing data, could serve future researchers well. Additional school- and teacher-level data would also be helpful, such as education data on teachers, school expenditure information, and more detailed, accurate data on school management, culture, and community relations. Finally, structuring the achievement and resources assessments to easily permit longitudinal analyses could help policymakers better understand the effects of interventions and the trajectory of Ghanaian education quality. These data-gathering practices should be permanent features of the education system as it goes through its next round of reforms, and the improvement of the information gathered will aid in the further development of Ghana’s education programs.

Case Study Findings North Dayi (Kpando) District North Dayi is a peri-urban district in the Volta Region. The administrative district capital is Kpando. Most of the population is employed in the fishing and agricultural sectors. While the North Dayi district is privileged in terms of some resources, including schools having trained teachers, electricity and toilets, academic performance in English and Mathematics is below the national average. This case study is based on information from five schools in the district that participated in the 2005 or 2007 National Education Assessment (NEA). It examines the academic performance, resources and infrastructure, teacher quality and support, teacher motivation, school supervision and community support. Information on challenges and problems facing the schools and strategies and plans to deal with these issues are also provided. Performance on Assessments School performance on assessments in North Dayi mirror the overall performance of schools in the Volta Region, although one of the schools in the case study scored considerably below the national average for Ghana as a whole. For example, on the 2005 and 2007 National Education Assessment (NEA), P6 students in the five North Dayi (Kpando) primary schools in this case study had school average scores ranging from 30 to 38 out of 100 in English (compared to a national average of 44 in 2007). School average scores on the mathematics NEA ranged from 31 to 40, compared to a national average of 35 in 2007. For the district as a whole, BECE cores subject pass rates in 2007 slightly above the national average in English (79.7% vs. 76.5%) in English and slightly below the national average in mathematics (69.4% vs. 75.1%). While primary completion rates are similar to the national average (86.0% vs. 85.5%), completion rates at the junior secondary level are slightly below the national average (63.8% vs. 67.7%). Infrastructure and Resources. Mediocre academic performance cannot be explained by a lack of infrastructure and resources in North Dayi. While, infrastructure varied across the five schools, with two schools without functional electricity and one school without drinking water or functional toilets, in most schools the classroom facilities were adequate, with cement floors, a tin roof, a blackboard, and enough desks or tables for all of the students to sit. Recent textbook arrivals in English, mathematics and science have been sufficient to allow each student to have their own books in these subjects, while textbook shortages remain for other subjects. While both teachers and head teachers consistently complained about the lack of teaching and learning materials to supplement textbooks, including pictures, charts, and “hands on” materials for science and mathematics, prior research has shown that these concerns are shared by teachers across the country. Teacher quality and forms of support Below average academic performance in North Dayi did not appear to be related to having a shortage of trained teachers in the district, in fact head teachers were generally pleased with the new teachers that had been recently posted from Teacher Training Colleges. Only one head teacher noted a problem with a teacher being posted who struggled to teach in the local language (Ewe). Each of the heads reported that teacher absenteeism was a minor problem or not a problem. Each of Head teachers described a cooperative relationship with their primary teachers, with one noting “Teachers take advice when offered, they don’t feel they have been accused wrongly or belittled.” Access to in-service training for teachers appeared consistent with national trends, although all of the heads reported inadequate funding for teacher in-service training as a major problem. The main school based-forms of support for teachers included feedback from the Head teacher and staff meetings where instructional issues were raised. Only one school organized school- based in-service for teachers, a case where one teacher who was computer literate instructed the others on ICT. The District Education Office (DEO) had provided multi-day workshops on the syllabi that had been introduced at the beginning of the

year, as well as training on HIV/AIDS. Teachers generally found these in-service workshops helpful. There appeared to be little emphasis on improving the quality of instructional practice in-service workshops. Teacher motivation Teacher morale appeared to be a major problem in most of the schools. The teachers and Head teachers gave several suggestions to increase teacher morale and motivate them. Some of these suggestions are (a) increasing salaries (b) providing staff accommodation (c) providing free medicals (d) allowance marking lesson preparation (e) scholarship for teachers’ children up to University level. (f)Unconditionally grant study leave with pay to all teachers on course in tertiary intuitions. Supervision of schools by the District office Although lack of supervision of schools has been suggested as reason for some schools poor performance, the level of supervision of schools by the district office was not a major problem in North Dayi. Head teachers report that Circuit Supervisors visit their schools at least monthly and that their unscheduled visits help to “keep teachers on their toes.” The Circuit Supervisor comes to inspects records, looks for whether teachers are punctual, turning in lesson books, and assigning and grading exercises. Observing and providing feedback on teachers’ lessons or providing support for teachers was less emphasized, however. While most of the head teachers found supervisory visits helpful in reinforcing their expectations for teachers, at least one noted that “nothing happens when a teacher has an absenteeism problem or does not meet expectations.” In other words, frequency of visits does not necessarily imply strong accountability for teachers or head teachers, although head teachers did note that they can be demoted or transferred for low BECE scores. Several of the head teachers had been recently transferred to their schools. Community support Community support was stronger in North Dayi. Communities lent support to schools in two major ways: mediating disputes between teachers and community members, typically through the School Management Council (SMC) and providing additional funding for schools, typically through the PTA. In one of the case study schools a community that provided a computer centre and library also employed an ICT teacher and pay part of the schools electricity bill through PTA. The SMCs also planned school improvement activities and endorsed expenditures of the capitation grant. All of the schools found their SMC’s helpful, although some schools would like their SMC/PTA be able to raise additional funds. A school could not access the new toilet built five years ago by the district assemble because of her inability to pay 10 % (50 Ghana cedis) of the cost. All of the schools acknowledged that while Free Compulsory and Universal Basic Education (FCUBE) policies, including the capitation grants, had helped to increase enrolment, they noted that many parents now feel that education should be completely free and that they should not be required to purchase supplies (e.g., exercise books) or contribute to PTA funding requests. Challenges to improving teaching and learning The challenges to improving teaching and learning listed by head teachers and teachers were numerous, with some being consistent across the five schools and others more school specific. A consistent concern was a lack of individual parents monitoring their children homework and also providing basic supplies such as pencils and exercise books. Poverty, parental illiteracy, and the need for children to help families earn a living by working in fishing or farming after school were common explanations for this lack of support. These concerns about parental support are consistent with other researches that blame the lack of student progress on either parents or a lack of teaching materials. Further, although government policy mandates promotion of students irrespective of performance, all of the school retained low performing students if their parents gave permission. On the positive side, teachers and head teachers in North Dayi reported that student absenteeism and student dropout were either not a problem or only a minor problem in some cases, including girls dropping out of JSS because of pregnancy. Conclusions

The low level of performance in this peri-urban district can be attributed to three main factors. The first is teacher motivation. In reflecting on teacher quality, one head teacher noted that “teachers need more motivation to do work ‘sacrificially.’ One teacher observed that “the teachers don’t have the interest of pupils at heart but how to make their ends meet” This was demonstrated in all the schools visited when most teachers abandon the classroom to serve as resource personnel for the national identification registration exercise. Secondly, some individual parents are reluctant to provide basic needs for their children, for instance in one school a pupil used one note book one for five different subjects while in another school a pupil used the same for three subjects. A teacher deferred teaching a first term course to this third term because most parents couldn’t buy mathematical set for their children. He said “I am just forced to teach that topic not because pupils have brought the necessary materials” Thirdly, pupils appeared not to have enthusiasm and commitment to learning and furthering their education as most of them stayed late into the night watching TV and films at the expense of completing their homework and preparing for school the next day. In three of the sampled schools teachers complained some pupils engage in fishing activities. A pupil who was interviewed confirmed coming to school late because he went to fish and sold the proceeds before coming to school.
Kpando

Assin South District, Central Region Assin South is a rural district in the Central Region with the administrative capital as Nsuaem. The district was part of the Assin district in 2005 but in 2007 it was created as a separate district. The population is largely employed in the agricultural sector. The district was selected as a case study because it illustrates the educational problems in a typical rural community with poor performance and moderate resources. This case study is based on information from a sample of 5 out of 87 schools in the district. These five schools (three from 2005 and two from 2007) were randomly selected and included in a national sample to participate in the National Education Assessment (NEA) in July 2005 and 2007. Three of the schools selected in the district are in very remote areas where access to transportation is difficult. This situation makes it difficult for trained teachers to accept posting to these schools. In three of the schools, teachers left the schools on the weekends and returned on Mondays. Teacher absenteeism in these schools is thus rampant on Mondays. This case study examines the academic performance, infrastructure and resources, teacher motivation, teacher quality and support, supervision, and community support as found in the five schools. Challenges to improving teaching and learning as well as strategies to handle these challenges are included. Performance on Assessments School performance on 2007 national assessments in Assin South was below average. On the 2007 National Education Assessment (NEA) English for Primary 6, the five schools had a mean score of 36 out of 100 (compared to a national average of 44) while performance in Mathematics was 28 (compared to a national average of 35). For the district as a whole, the Basic Education Certificate Examination (BECE) core subjects’ (which are English, Math, Social Studies & Science) pass rates in 2007 were below the national average in English (43.3% vs. 76.5%) in English and below the national average in mathematics (40.9% vs. 75.1%). Primary school completion rates are much higher than the national average (99.6% vs. 85.5%), and completion rates at the junior secondary level are also higher than the national average (79.7% vs. 67.7%). The data reveals that students do well to complete school, but raises questions about how much they have learned upon completion. The NEA is a standardized achievement test conducted country-wide for Primary 3 and 6 students in 3% random sample of all primary schools in Ghana. The test is in English and Mathematics. The BECE is a national certificate examination conducted by the West African Examinations Council for all final year (Year 3) of Junior High Schools. Infrastructure and Resources Infrastructure and resources cannot fully explain the low academic performance of students in the district. Though textbooks in English, and mathematics arrived late, they were sufficient to allow each student to have their own books in these subjects. Textbook shortages, however, remain for other subjects. Both head teachers and teachers consistently complained about the lack of teaching and learning materials to supplement textbooks. , These materials include I charts, pictures, and “hands on” materials for science and mathematics. School infrastructure was a not a major concern, as three out of the five schools have well-roofed cement-floor classrooms. Classroom facilities were adequate with a chalkboard and enough desks or tables for all of the students to sit in. However, in the other two schools, the building facilities were inadequate. There was no functional toilet, no drinking water, no electricity and roofs of the building had holes in them. The classroom walls were short and made of mud. When it began to rain, the schools had to close. These schools were in higher poverty communities and were more remote. It was also observed that in these two schools, achievement in the national assessments was lower than the three schools with better facilities. Teacher quality and forms of support

Generally, there were more untrained than trained teachers in the studied schools. Out the five schools, three of them have untrained teachers who are beneficiaries of the National Youth Employment Programme (NYEP). These teachers did not have any pedagogical training or practice teaching prior to taking their posts and the head teacher reported that most of them showed a lack of commitment to teaching. The reason they gave for becoming teachers was that they did not have enough money to continue further education and that given the chance they would leave the teaching profession. Both teachers and head teachers in the schools reported that teacher absenteeism was not a major problem except on Mondays in some schools. Each head teacher described a cooperative relationship with their colleagues. The head teachers however reported that the quality of teaching was either moderate or low. Professional development through in-service training for teachers was provided by the district, although not regularly. The District Education Office provided workshops on the new syllabi that had been introduced at the beginning of the year. It also provided training on HIV/AIDS. The workshops were very useful to the teachers. However, teachers reported that during the workshops there was little emphasis on improving the quality of instruction. The head teachers reported inadequate funding as the major inhibiting factor for providing additional training. Teacher motivation Teachers reported that their morale was low. This is because they were not paid on time and not enough to live in the rural areas. Accommodation was not decent and there was no electricity in some of the towns and teachers had to use lanterns. Teachers used public toilets which were not neat. Transportation was not efficient and there were no hospitals or clinics. The teachers and head teachers gave several suggestions to increase teacher morale and motivate them. These suggestions include, (a) increasing the salaries and allowances of rural teachers, (b) providing free decent accommodation for rural teachers, (c) providing free medical treatment for family, (d) granting study-leave with pay for further education irrespective of course to be pursued and (e) providing rural teachers with grants that would finance their children’s education up to the tertiary level. Supervision Generally teachers reported that head teachers often supervised their work by observing them during teaching. Feedback from the observation was found useful. However, the level of supervision of schools by the district office was a major problem. Head teachers reported that Circuit Supervisors visited their schools but not regularly. The Circuit Supervisor visited the schools to inspect school records and lesson notes and check whether the teachers were regular and punctual. They also checked students’ exercise books for evidences of class assignments. Observing and providing feedback on teachers’ lessons or providing support for teachers was less emphasized, however. Community support Community support was strong in some schools but weak in others. Communities provided support through the Parent Teacher Association (PTA) mostly through organized labor. Some communities provided some funds for schools for the purchase of teaching and learning materials. The School Management Committees (SMCs) were not functional in most of the schools. The SMCs help in providing support especially to the head teachers in managing the schools. The absence of a functional SMC meant that the head teacher had to face several major problems in the school alone. And in a rural town this is a herculean task. In two of the case study schools the community employed a kindergarten teacher and a Primary 6 teacher. However, the community was not able to provide funding for payment of salaries. One of the teachers had been teaching for two years without pay. The head teachers and teachers in all the schools acknowledged that the Free Compulsory and Universal Basic Education (FCUBE) policies had helped to increase enrolment. They however reported that many parents now feel that education should be absolutely free and that they should not be required to purchase

school materials such as exercise books for their wards. The FCUBE program was introduced by the Ghana Government in 1995 to provide a free and compulsory quality basic education for every school-age child by the year 2005. Challenges to improving teaching and learning Numerous challenges to improving teaching and learning were mentioned by head teachers and teachers. One common concern was a lack of parental support. Parents do not show commitment to their children’s work especially at home. They do not monitor their homework and provide basic school materials such as pencils and exercise books. This lack of support was attributed to parental illiteracy, poverty, and the need for children to help families earn a living by working on farms after school. On market days, most students especially the girls did not go to school because the parents needed them in the market. During the farming season, especially in cocoa growing areas, students were taken to the farms for a couple of months. Conclusions The low level of performance in this rural district can be attributed to three main factors. The first is the quality of teachers. Though the head teachers reported that there is cooperation among the teachers, the majority of them was untrained and received little professional development. Secondly, teacher morale is low. The school and community environment as well as low pay and late payment of salaries demoralizes the teachers. Thirdly, the parents in the district are poor (average household expenditure is about $4.40 a day for a household of 3) as well as semi-illiterate. As a result, they are not able to provide the necessary school materials for the children. Children often go to school hungry. To improve achievement in the rural district, it is suggested that trained teachers be posted there with an incentive package. There is the need for sensitization of the communities to the importance of education and schooling. School feeding program should be given a priority in the rural schools and investments in the agricultural sector in the rural communities would provide additional employment for the parents so that they could have additional income to supplement the seasonal agricultural income. In addition, there is the need for greater support as well as increased accountability from the district education office.
Assin South District

Overall findings Past efforts to improve primary education in Ghana have been significant and have been successful in improving the opportunity to attend school. Physical infrastructure has improved as has the rate of attendance. But original concerns over educational quality in Ghana have been reinforced by the research conducted for this project. There has been little improvement in academic achievement. Ghana remains low by comparison to the quality of education in other countries measured through the TIMSS project. Moreover, private primary schools, often with high portions of teachers without pedagogical training tend to outperform public primary schools. There is no single or simple explanation for this stagnation in the quality of learning. It is true that as nations increase the proportion of an age cohort in school or university attendance, that the nature of the teaching and learning challenges changes. If 10 percent of an age cohort is school the challenge is different than if 90 percent are in school. But this challenge is universal, and all nations face it. One issue emerged from the background readings which may help explain why Ghana has not yet successfully managed the new teaching and learning challenge. An internal ministry report suggested that the implementation of planned changes in the education sector has been low; that for instance only 38% of the national education priorities and only 67% of the planned activities had been carried out a year after they had been identified and agreed upon.22 Low implementation can occur because of low financing and other reasons. One other reason was suggested to the team in the course of the interviews and case studies. One school teacher put it this way: “Parents and communities have gone to sleep with respect to their responsibilities in education”. The suggestion, heard from many informants and many managers, had to do with the nature of school/community and parent relations since the declaration of ‘free education’. As all were quick to point out, Ghana has a proud tradition of self help in basic education stemming from the 19th century. Primary and secondary schools were originally created by local communities and churches, not by colonial authorities.23 However since the declaration of free education, many community leaders and families have assumed that no private contribution is necessary today for public schools. The same assumption is not made in the case of private school, churches or many other arenas of social welfare. In those other arenas private contributions remain the main reason for the expansion of coverage and quality. But in public basic education this private responsibility has, in the words of one teacher,’ gone to sleep’. This is unfortunate. Few if any countries supply public education in which there is no private contribution. In the United States it is common for school PTAs to raise school funds through public fairs, bake sales, and other charitable activities, and do not allow private contributions to exclude low income or underprivileged children for attendance. In many wealthy OECD countries, families make private contributions to augment the state support of primary and secondary education. In Spain for instance, private contributions constitute 12% of the total education expenditures. In the Japan and the United States they constitute nine percent; in France they constitute seven percent, in the United Kingdom and Canada private contributions constitute five percent of the total.24 If these countries treat private contributions to compulsory education as normal, perhaps is it realistic for Ghana to do the same. It might be useful to recall where the education sector in Ghana is situated with respect to school quality. There are basically four general categories (see chart below). In category A, an instructor may have access to the only textbook and will copy its content onto a chalkboard. The pupil is then expected to copy the content of the chalkboard into an exercise book. The content of the exercise book then becomes the source of information to which the pupil has access. This ‘copy/copy’ level is common in many parts of rural south Asia and sub-Saharan Africa. 22 Ministry of Education, Policy, Research, Monitoring and Evaluation Unit (PBME), Accra, March, 2008. 23 Philip J. Foster 1965 Education and Social Change in Ghana. Chicago: University of Chicago Press. 24 Nancy Matheson, Laura Salgarnik, Richard Phelps, Marianna Perie, and Thomas Smith 1996 Educational Indicators: An International Perspective. Paris: OECD.

If a nation is able to finance (through public and private sources) approximately three times more/pupil in non-salary resources it may attain a status of having one textbook/child in each subject, each year. The former Soviet Union attained this level in the early 1930’s China in the 1950s. In general the Philippines is today at this level. If a nation is able to able to finance 40 times the level of non-salary student expenditures as schools of category A, they may reach the level of Malaysia in which the teacher has a choice of approximately ten different titles of textbooks which can be assigned depending on a child’s interest and ability. The teacher will also have multiple sources of print and electronic background information to utilize. In this instance teachers shift from being providers of information to being managers of information. If a nation is able to finance 300 times the level of non-salary expenditures as school in category A, they may reach the level of a Sweden, Japan and Canada in which all pupils have access to internet-based information sources, all schools have access to electronic data bases. The role of the teacher has to shift once again. Instead of managing information the teacher is required to distinguish between strong and weak information sources and to teach pupils how to make this distinction for themselves. Although there is a wide variety of qualities of basic education in Ghana, most of the stakeholders interviewed agreed that Ghana was at the level of Category B, and that Ghana’s main task now would be to progress to Category C. The recommendations below will all be addressed to making this progress feasible. Thus the first conclusion from this report is that the public education system in Ghana needs considerably more resources in order to be brought up to the international standards of Category C education quality. However, it is impossible to imagine that the tax base can, on its own, support such an increase. Thus the first conclusion is that public education in Ghana needs support from both public and private sources. Insufficient resources are one explanation for low performance. A second concerns the efficiency by which resources are utilized. This might be illustrated by a second quotation, this time from a District Education Officer: “There is no reason for teachers to try hard; those who work less get rewarded the same as those who don’t.” This illustrates the fact not only that teachers in Ghana are paid poorly but that the salary structure is ‘flat’. There are few ways to identify and reward good teachers and good teaching. The same is true for administrators and school management; headmasters and DEOs who perform well are not compensated either with monetary or non-monetary benefits sufficiently. This suggests that new resources would be more effectively utilized if management within the system was vibrant and responsive. The question is how is it possible to get more resources, including private resources into the system and how is it possible to get a fast ‘supply response’ using the resources effectively from the management of the system itself. The recommendations which follow focus on those two challenges.

General Recommendations Target new resources differently. Targeting resources to the most deprived districts has been successful in ‘pushing the system up’ from the bottom, but it has had three unintended negative consequences: (i) it has drawn attention away from the needs of other districts; (ii) it has rewarded poverty rather than management creativity; and (iii) it has neglected an equally important strategy in education development, that of ‘pulling the system up’ from the top. The donor-coordinated strategy of Education-for-All has had significant virtues, but historical clarity is not one of them. Successful nations have achieved universal primary school attendance not only by investing in primary education but by investing in secondary and higher education, making the benefits of primary education more visible and accessible.25 Instead of targeting resources to districts which have been declared ex ante as deprived, new resources should be targeted in three new ways. First special resources should be targeted to districts on the basis of low achievement (In terms of BECE pass rates for instance), insuring that the focus of attention is on learning. This new definition of deprived might focus managers and teachers on achieving non-deprived status over, say, a five year period and rewarded substantially for their progress. Second is on the basis of management and teaching creativity regardless of whether they are classified as deprived. This would help insure that flexibility and performance are adequately rewarded across the system as a whole. This would help reduce the risk that some districts feel left out for not being categorized as ‘deprived’ justifying new and highly visible assistance. A third way to target new resources is on the basis of quality and targetging gaps in the system wherever they occur, not only in basic education. This would apply to the significant quality problems in higher education for instance as well as the outdated structures of pre-service teacher and vocational training. Recommendations for USAID The priority of education in the country program of USAID should be re-assessed and when justified by evidence of creativity and implementation success, it should be raised. New programs should emphasize the management incentives discussed above. The five suggestions below are illustrations: District Development Fund. This would be a fund to reward districts with SMCs, PTAs and District Assemblies which have been most successful at attracting new resources into basic education. The fund might work on the basis of a ratio of top up rewards: an impoverished district which attracted one Cedi might receive three in return from the special fund; a wealthier district which attracted one Cwdi might receive one in return from the special fund. District Achievement Fund. BECE results are of critical importance to everyone, but the results themselves are distributed as gross scores hiding one of their truly important values for the improving of pedagogy. An analysis of the answer to ‘wrong items’ leads the way to understanding the mistakes in pedagogy the previous year. When these school-by-school mistakes are used for in-service teacher training, the results for BECA improvement can be immediate for the school and for the district. This fund would be available, perhaps on a national and competitive basis, for those districts who successfully design a plan to use an
25 Mary Jean Bowman, 1962 “ Land Grant Colleges and Universities in Human Development,” Journal of Economic History Vol. 22 No. 4 (December), pp. 523 - 46

analysis of wrong scores as in-service training.26 Preliminary discussions with the WAEC and several DEO are confirmed, if resources were available, that this would be a popular and feasible proposition. District Performance Fund. This would be a fund for school districts that were creative in proposing how to reward excellence in school management. District Teaching Fund. This would be a fund available to districts creative in proposing how to identify and reward good teaching. District Innovation Fund. This would be a fund available to districts that were creative in exploring new structural mechanisms to deliver public education. This might, for instance, include charter schools,27 the use of one computer/child or one computer/teacher programs, and districts which digitalize school records on a trial basis. Recommendations for Development Partners All development partners in Ghana, both multilateral and bilateral, have demonstrated an extraordinary record of coordination; all have focused on basic education in rural and deprived areas. One recommendation is that the assistance strategies should be more diversified so that problems of efficiency, quality and equity, could be addressed at all education levels, including higher education. Nationalized statistical assessments, particularly in terms of education finance and achievement should be regularized. The long-term structures and personnel to enable local education policy review and analysis should be assisted in both universities and in government. As occurred in Chile, Ghana deserves a greater ‘in-house’ market for education policy, with an emphasis on economics. Having strong local institutes to reflect on public policy strengthens government strategy, and allows full participation in international statistical reviews from OECD, UNESCO/UIS and other institutional mechanisms. Recommendations for the Government of Ghana For Immediate Action. If the GOG finds the district snap shots useful they could be distributed to each of the 138 districts for their analysis. Each DEO might be asked to select district targets for the next five years. These targets might include improvements in supplementary reading materials, the portion of schools with libraries, functioning toilets, clear water, transition rates and BECE pass rates. They might also be asked to suggest new information which might be useful to include in new district snap shots. Medium Term Action. Three types of action would be useful to consider. (i) New district benchmarks might be designed for the attraction of non-state income, per/pupil expenditure and available electricity. (ii) A change in the methods of supervision. Currently supervision is interpreted as reviewing student workbookds and observing classroom teaching. This is labor-intensive, methodologically non-standardized and given the absence of local transport, infeasible to implement. The methods of supervision should shift from observing classroom to monitoring headmaster strategic plans and targeting interventions to where a local school which has difficulty in meeting the objectives of those plans. (iii) Lastly are the methods of regulating private schools. Currently the GOG places a ceiling on the tuition fees which private schools may charge. This lowers their ability to creatively provide high quality education and is, hence, counterproductive. Capping private tuition is assumed to be equity-enhancing. No one wishes the poor to be excluded from the opportunity to attend private schools. But there is a way to enhance private school creativity and equity simultaneously. The GOG should remove tuition restrictions and require private 26 Stephen P. Heyneman and Angela Ransom, 1990 "Using Examinations To Improve the Quality of Education," Educational Policy, vol. 4, no. 3, 1990, pp. 177-192. 27 Charter schools are public schools relieved of administrative regulations for a fixed contractual period, usually five years. They follow the national curriculum but have other elements of private schools.

schools to allocate perhaps as much as 25% of the school places to children with high ability and low family income. In this way private schools may augment their natural role as stimulation to the innovation in public schools but not at the expense of equity. Long Term Action. Over the next ten years, GOG should focus attention on raising new the resources to finance public education and rewarding performance of good teachers and managers. It should address the problem of identifying and rewarding new teachers sufficiently. To do this will require a restructuring of the pre and in-service teacher training system. Current teacher training colleges are under-utilized because of the cost of the publicly provided fellowships. While these fellowships were justified when the school and university system was small, they are not sustainable today.28 To address the problem the GOG should consider: (i) confining higher education fellowships (whether in TTCs or other university faculties) to teachers who are committed to teach for five years in a hard-to-staff school. Because good teaching can be acquired from well educated individuals, teacher licenses should be provided through an examination independent from an academic institute. In this way, retiring engineers and businessmen and new university graduates in chemistry may acquire teaching licenses quickly and without requirements for residential pedagogy training. University graduates should be attracted to teaching with special incentives dependent on the record of their performance. Summary Basic education in Ghana is at a crossroads. There has been significant progress in terms of enrollment, but the improvement in quality has stagnated. To improve quality two major changes need to be considered. One is a major use of management incentives and the offloading of outdated ministry functions. The second is the inauguration of a new shared responsibility for financing public education. .
28 Keith Lewin 2002 “Costs and Demand for Teacher Education: Dilemmas for Development” International Journal of Education Development Vol. 22 No 1 / 2 pp 221 – 42.


Appendix A. Background Documents Ankomah, Y., Koomson, J., Bosu, R., Oduro, G. 2005. Implementing Quality Education in Low Income Countries: Literature Review for Ghana. Cape Coast, Ghana: Institute for Educational Planning and Administration. Appiah, B. (2008). The Impact of Rural-Urban Divide on Quality Basic Education in Ghana. Accra: Ghana National Education Campaign Coalition. Casely-Hayford, L., and Baisie, A. 2007. The Leap to Literacy and Life Change in Northern Ghana: An Impact Assessment of School for Life. Final Report (Abridged Version). Accra: School for Life. DHS 2009 EdData Education Profile: Ghana 1993, 1998, 2003 Effective Technical Cooperation of Capacity Building: Ghana Country Case Study Government of Ghana. 2007 Education Sector Performance Report. __________________. 2008 Education Sector Performance Report ___________________ 2010-2020 Education Strategic Plan. Volume 1: Policies, Strategies, Delivery, and Finance. Volume 2: Strategies and Work Programme. One-Year Implementation of the Education Reform. ___________________ 2007 Basic Education Comprehensive Education System (BECES) English and Mathematics. Final Report ____________________ 2009 A Study of Teacher Placement in Underserved Areas of Ghana Accra: Ministry of Education (March) ____________________ 2008 Education Strategic Plan: 2010 – 2020. Strategy and Work Program. Accra: Ministry of Education _____________________ 2009 One Year Implementation of the Education Reform. Planning, Budgeting, Monitoring and Evaluation Unit (March) Kingdon, G., Soderbom, M. 2007. Education Skills and Labor Market Outcomes: Evidence from Ghana. Oxford: Centre for the Study of African Economies. Lewin, Keith 2002 “Costs and Demand for Teacher Education: Dilemmas for Development,” International Journal of Education Development Vol. 22 No. ½ pp. 221 – 42. Oduro, A. 2008 An Investigation into Poverty, Educational Attainment, and Outcomes in Ghana. Accra: Associates for Change. Rolleston, Caine 2009 Human Capital, Poverty, Educational Access and Exclusion: The Case of Ghana 1991 – 2006 Consortium for Research and Educational Access Transition and Equity, Working Paper No. 22 (January) USAID 2005 A look at Learning: The Final Evaluation of USAID/Ghana’s Quality Improvement in Primary Schools (QUIPS) Program. Washington, DC: The Mitchell Group ______ 2007 Long, E., Schuh Moore, A.M., Snyder, C., Adu, J. Ghana Basic Education Comprehensive Assessment System (BECAS): Final Report. Washington, DC: Academy for Education Development.
_______ 2009 Education Quality for All (EQUALL): FY 2008 Annual Report ________ 2009 Hartwell, A. (2009). Notes to USAID: Quality Issues in the Education Sector. Unpublished. World Bank 2008 Technical Reports on Education Strategic Plan (June). __________ 2009 Policy Report (Victor Levine) ___________ 2009 MOESS Budget Outline Report for FY 2009 (Jonathan Caseley); ___________ (N.D.) Pre-Tertiary Policy Report (Margaret Nkrumah); Education Sector Analysis (Maurice Boissiere); TVET Policy Report (Robert Palmer). ________________ 2004 Ingram, G.K., Chhibber, A., Barbu, A., White, H.N. Books, Buildings, and Learning Outcomes: An Impact Evaluation of World Bank Support to Basic Education in Ghana. Washington, DC: The World Bank. ________________ 2002 von Donge, J., White, W., Masset, E. Into the Black Box of Ghanaian Education: Why Do Increased Inputs Not Lead to Better Outputs? Nii Moi Thompson and Leslie Casely-Hayford, (2008). The Financing and Outcomes of Education in Ghana.
Ampiah, J.G. & Yamada, S. (2008). UPE Policy Implementation in Ghana: Challenges and Policy Implications. Chapter 2.

Appendix B. Highlighted interventions to date in Ghana (information gathered from readings in Appendix A) Access fCUBE: Free, Compulsory, Universal Basic Education, includes capitation grant scheme and responsibilities for district assemblies. Schools for Life (SfL): functional literacy program for out-of-school children in the Northern Region. Special Education Division (SpED): supported the introduction of inclusive education training and tools into all primary schools in five pilot districts. Quality EQUALL: Education Quality for All: (1) Increased access to basic education for children, especially girls, who have not had the opportunity for schooling, (2) Improved reading instructional practices, and (3) Improved education management practices. QUIPS: Quality Improvement in Primary Schools, USAID-funded program focused on district and school level management, teacher capacity, community participation in education, and monitoring and evaluation. NALAP: National Literacy Acceleration Program; newly-developed program to support literacy teaching and learning. Teachers UTT/DBEP: Untrained Teacher Diploma in Basic Education Program; administered by the Teacher Education Division, provides opportunity for untrained teachers (e.g., from the community program or youth program) to receive teaching certification. NYEP: National Youth Employment Program; nationwide volunteer program, administered by local District Assemblies, which recruits youth to serve in social service positions, including teaching in underserved schools. CSTs: Community Support Teachers; designed to help alleviate the impacts of severe teacher shortages in northern Ghana, particularly in the primary schools, EQUALL program that recruits local volunteers to fill vacancies in lower primary classrooms. Other SMC: School Management Committees; new school-governance initiative that brings together parents, teachers, and administrators to address problems such as school finance. SPAM: School Performance Appraisal Meetings; bring together all stakeholders (students, parents, teachers, administrators) to discuss school issues. SPAMs arose from groups meeting to discuss unsatisfactory BECE results, which is still one of the primary issues for these meetings.

Appendix C. Graphs Figure 1. Predicted means before and after controlling for full model
020
4060
ASHANTIBRONG AHAFO
CENTRALEASTERN
GREATER ACCRANORTHERN
UPPER EASTUPPER WEST
VOLTAWESTERN
Basic mean English scoreMean English score controlling for regional resources differences
Figure 2. Predicted means before and after controlling for urbanicity and resource differences
3540
4550
55
ASHANTIBRONG AHAFO
CENTRALEASTERN
GREATER ACCRANORTHERN
UPPER EASTUPPER WEST
VOLTAWESTERN
Basic mean English scoreMean English score controlling for proximity to large urban centerMean English score controlling for large urb. center and >5k pop.Mean English score controlling for urban. and reg. resource diffs.

Figure 3. Between-region differences in access to electricity
0.0
5.1
.15
% s
choo
ls w
ith e
lect
ricity
ASHANTIBRONG AHAFO
CENTRALEASTERN
GREATER ACCRANORTHERN
UPPER EASTUPPER WEST
VOLTAWESTERN
Figure 4. Between-region differences in frequency of SMC meeting
01
23
4Fr
eque
ncy
of S
MC
mee
ting
ASHANTIBRONG AHAFO
CENTRALEASTERN
GREATER ACCRANORTHERN
UPPER EASTUPPER WEST
VOLTAWESTERN

Figure 5. Between-region differences in percent untrained teachers
0.2
.4.6
.8m
ean
of p
erun
train
ed
ASHANTIBRONG AHAFO
CENTRALEASTERN
GREATER ACCRANORTHERN
UPPER EASTUPPER WEST
VOLTAWESTERN

Appendix D. Tables
Table 1. Mean resource levels by 2005, class 6 English proficiency LOW MEDIUM HIGH Pupil/teacher ratio 41.59 41.76 39.95 % untrained teachers 0.35 0.18 0.16 Math texts per pupil 0.56 0.58 0.62 English texts per pupil 0.27 0.28 0.40 Seats per pupil 0.83 0.83 0.86 Writing places per pupil 0.84 0.86 0.86 % schools needing major repairs 0.26 0.26 0.15 % schools with meals programs 0.09 0.12 0.13 Library books per pupil 0.59 0.64 0.40 % urban 0.13 0.39 0.69 % in one of the four largest urban districts 0.01 0.14 0.22 % dropout 0.05 0.08 0.02 P6/P1 enrolment 0.85 0.97 1.01 Teacher guides per teacher 3.99 3.65 2.38 % schools with functional toilets 0.52 0.49 0.49 % schools with functional urinals 0.39 0.33 0.35 % schools with accessible drinking water 0.49 0.59 0.52 % schools with electricity 0.09 0.25 0.37 Table 2. Mean resource levels by 2007, class 6 English proficiency LOW MEDIUM HIGH Pupil/teacher ratio 36.26 36.99 42.22 % untrained teachers 0.45 0.26 0.09 Math texts per pupil 0.88 0.91 0.81 English texts per pupil 0.88 0.93 0.81 Seats per pupil 0.88 0.87 0.95 Writing places per pupil 0.89 0.83 0.92 % schools needing major repairs 0.25 0.23 0.18 % schools with meals programs 0.12 0.14 0.08 Library books per pupil 0.76 0.55 0.67 % urban 0.09 0.32 0.72 % in one of the four largest urban districts 0.02 0.08 0.39 % dropout 0.06 0.04 0.03 P6/P1 enrolment 0.66 0.84 0.96 Teacher guides per teacher 2.33 2.57 1.50 % schools with functional toilets 0.54 0.59 0.60 % schools with functional urinals 0.55 0.66 0.58 % schools with accessible drinking water 0.60 0.50 0.64 % schools with electricity 0.09 0.23 0.47 Table 3. Mean resource levels by 2005, class 6 math proficiency LOW MEDIUM HIGH Pupil/teacher ratio 40.80 41.70 45.70 % untrained teachers 0.28 0.12 0.17 Math texts per pupil 0.56 0.62 0.73 English texts per pupil 0.28 0.31 0.46
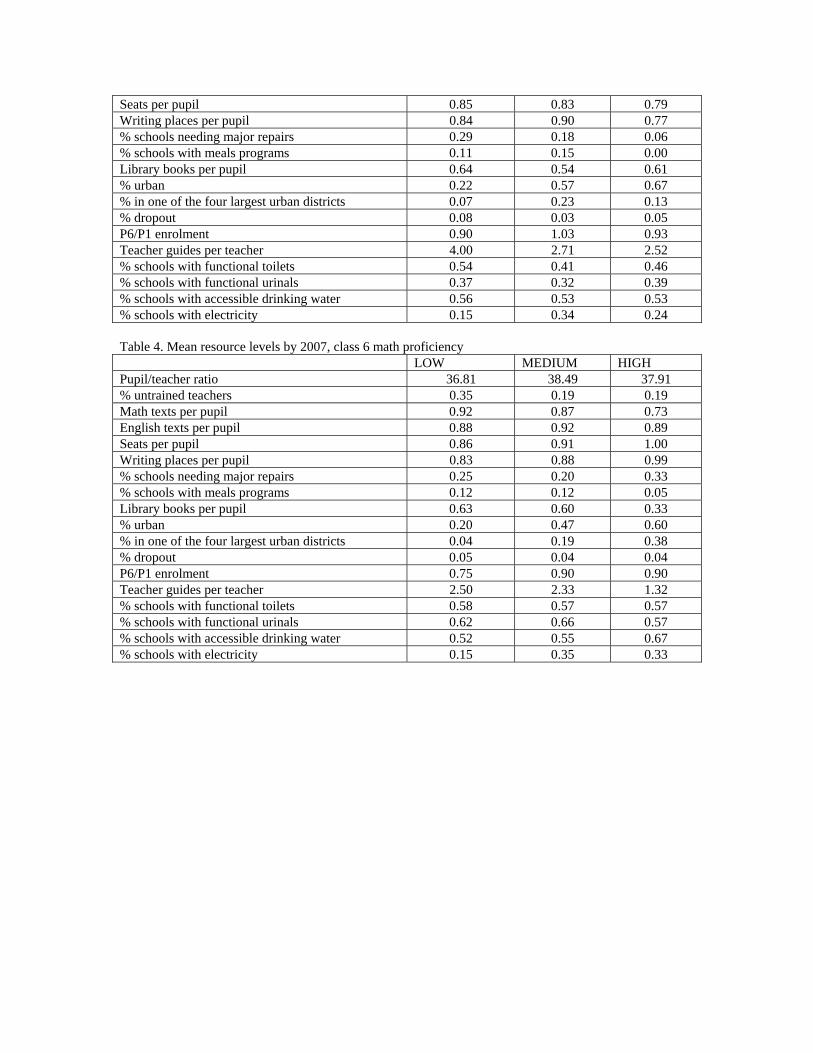
Seats per pupil 0.85 0.83 0.79 Writing places per pupil 0.84 0.90 0.77 % schools needing major repairs 0.29 0.18 0.06 % schools with meals programs 0.11 0.15 0.00 Library books per pupil 0.64 0.54 0.61 % urban 0.22 0.57 0.67 % in one of the four largest urban districts 0.07 0.23 0.13 % dropout 0.08 0.03 0.05 P6/P1 enrolment 0.90 1.03 0.93 Teacher guides per teacher 4.00 2.71 2.52 % schools with functional toilets 0.54 0.41 0.46 % schools with functional urinals 0.37 0.32 0.39 % schools with accessible drinking water 0.56 0.53 0.53 % schools with electricity 0.15 0.34 0.24 Table 4. Mean resource levels by 2007, class 6 math proficiency LOW MEDIUM HIGH Pupil/teacher ratio 36.81 38.49 37.91 % untrained teachers 0.35 0.19 0.19 Math texts per pupil 0.92 0.87 0.73 English texts per pupil 0.88 0.92 0.89 Seats per pupil 0.86 0.91 1.00 Writing places per pupil 0.83 0.88 0.99 % schools needing major repairs 0.25 0.20 0.33 % schools with meals programs 0.12 0.12 0.05 Library books per pupil 0.63 0.60 0.33 % urban 0.20 0.47 0.60 % in one of the four largest urban districts 0.04 0.19 0.38 % dropout 0.05 0.04 0.04 P6/P1 enrolment 0.75 0.90 0.90 Teacher guides per teacher 2.50 2.33 1.32 % schools with functional toilets 0.58 0.57 0.57 % schools with functional urinals 0.62 0.66 0.57 % schools with accessible drinking water 0.52 0.55 0.67 % schools with electricity 0.15 0.35 0.33

Table 5. Mean resource levels in 2005 and 2007 2005 2007 change standard error Pupil/teacher ratio 44.00 38.11 -5.89 1.79 Math texts per pupil 0.55 0.89 0.34 0.04 English texts per pupil 0.25 0.87 0.63 0.03 Seats per pupil 0.81 0.88 0.07 0.03 Writing places per pupil 0.81 0.85 0.03 0.03 Percent of schools with toilets 0.51 0.56 0.06 0.04 Guides per teacher 3.47 2.24 -1.23 0.52 P6/P1 enrolment 0.86 0.75 -0.12 0.04 Dropout 0.05 0.04 -0.01 0.02 Table 6. Series of models tested, English scores for P6 (1) (2) (3) (4) (5) (6) Model 1,
Naïve estimate
Model 2, dropout control
Model 3, Full model
Model 4, Full model for 2007
Model 5, Fixed effects
Model 6, Random effects
year07 0.80 (0.77)
0.75 (0.79)
1.05 (0.82)
0.71 (0.77)
0.74 (0.77)
superurban 6.15
(1.29) 6.20
(1.32) 5.42
(1.34) 6.33
(1.82) 0.00
. 4.81
(10.82) urban 4.03
(0.81) 4.07
(0.82) 4.12
(0.88) 3.44
(1.16) 4.44
(0.83) 4.44
(0.83) peruntrained -5.50
(1.18) -5.55 (1.19)
-7.12 (1.23)
-6.57 (1.58)
-7.09 (1.31)
-7.05 (1.29)
ptroverall -0.01
(0.02) -0.01 (0.02)
0.00 (0.03)
0.01 (0.04)
0.01 (0.02)
0.01 (0.02)
mathtext -0.92
(0.91) -0.92 (0.90)
-0.78 (0.87)
-0.21 (1.96)
-0.42 (0.88)
-0.47 (0.87)
engtext 0.17
(0.30) 0.19
(0.31) 0.09
(0.26) -0.14 (0.23)
-0.13 (0.22)
-0.12 (0.21)
libbksperpup 0.18
(0.27) 0.18
(0.27) 0.28
(0.25) 0.69
(0.38) 0.26
(0.32) 0.26
(0.30) guide -0.05
(0.04) -0.04 (0.04)
-0.05 (0.04)
-0.24 (0.12)
-0.02 (0.05)
-0.03 (0.05)
toilets -0.91
(0.65) -0.91 (0.65)
-0.41 (0.69)
-0.05 (0.95)
0.13 (0.64)
0.07 (0.64)
urinals -0.18
(0.65) -0.17 (0.65)
-0.51 (0.74)
-0.05 (0.99)
-0.83 (0.71)
-0.79 (0.71)
water 0.28
(0.64) 0.28
(0.64) 0.04
(0.70) -0.09 (0.90)
0.52 (0.72)
0.49 (0.72)

elec 3.38
(0.93) 3.40
(0.92) 3.71
(0.94) 4.16
(1.23) 2.88
(0.93) 2.94
(0.93) repairs -0.48
(0.81) -0.48 (0.81)
-0.35 (0.89)
0.20 (1.27)
-0.63 (0.85)
-0.56 (0.85)
seatmax 4.09
(1.86) 4.02
(1.86) 2.25
(2.27) 1.96
(2.52) 4.08
(2.29) 4.00
(2.28) writemax 0.02
(1.52) 0.07
(1.52) 2.05
(2.00) 1.42
(2.07) -0.05 (1.91)
0.06 (1.92)
Not_Meet_SMC 1.86
(2.07) 1.86
(2.07) 3.09
(2.29) 3.48
(3.23) 0.36
(2.08) 0.53
(2.11) Once_Year_SMC -0.42
(2.02) -0.42 (2.02)
0.44 (2.25)
0.30 (3.13)
0.82 (2.09)
0.82 (2.13)
Once_Term_SMC 1.72
(1.76) 1.71
(1.76) 2.34
(2.04) 2.11
(2.90) 2.99
(1.91) 2.98
(1.95) Twice_term_SMC 2.22
(1.73) 2.20
(1.73) 2.58
(1.99) 1.36
(2.84) 2.32
(1.89) 2.35
(1.92) Hardly_CSup -5.45
(3.23) -5.47 (3.22)
-5.27 (4.10)
-9.25 (6.11)
-3.31 (3.69)
-3.49 (3.70)
Once_Year_CSup -3.20
(3.33) -3.18 (3.33)
-3.07 (3.61)
-2.89 (4.65)
-1.61 (3.66)
-1.71 (3.61)
Once_Term_CSup -5.12
(2.56) -5.12 (2.56)
-4.63 (3.19)
-6.17 (3.88)
-4.94 (3.27)
-4.93 (3.20)
Twice_Term_CSup -4.46
(2.34) -4.47 (2.33)
-4.79 (2.95)
-6.12 (3.54)
-4.81 (3.16)
-4.82 (3.08)
totenrol 0.01
(0.00) 0.01
(0.00) 0.01
(0.00) 0.01
(0.00) 0.01
(0.00) 0.01
(0.00) p6p1enrol
-0.23 (0.70)
-0.36 (0.84)
-0.29 (1.27)
-1.23 (0.83)
-1.18 (0.83)
deprived
-0.88 (0.79)
-0.09 (0.98)
0.00 .
-1.22 (2.11)
engpercent
-2.56 (2.53)
-2.09 (3.24)
-1.96 (2.33)
-1.90 (2.34)
gradep6 5.34
(0.32) 5.34
(0.32)
Constant 33.82
(2.21) 34.08 (2.28)
40.25 (3.90)
42.72 (4.81)
39.87 (3.85)
39.23 (3.86)
Observations 68611 68535 77196 81226 32635 32635

R2 0.16 0.16 0.17 0.17 0.06 Adjusted R2 0.06 F 26.26 25.59 12.59 8.26 7.59 D.F. Model 26 27 28 27 26 28 D.R. Residuals 779 778 976 1027 766 Standard errors in parentheses Note: Basic models. Table 7. Comparing math and English relationships (7) (8) Model 1,
Math score full model
Model 2, English
score full model
year07 0.78 (0.65)
1.05 (0.82)
superurban 2.69
(1.08) 5.42
(1.34) urban 3.21
(0.74) 4.12
(0.88) peruntrained -5.76
(0.98) -7.12 (1.23)
ptroverall 0.01
(0.02) 0.00
(0.03) mathtext -0.97
(0.78) -0.78 (0.87)
engtext 0.20
(0.26) 0.09
(0.26) libbksperpup 0.24
(0.23) 0.28
(0.25) guide -0.05
(0.02) -0.05 (0.04)
toilets -0.42
(0.57) -0.41 (0.69)
urinals -0.03
(0.59) -0.51 (0.74)
water 0.43
(0.55) 0.04
(0.70) elec 1.91
(0.79) 3.71
(0.94) repairs -0.91 -0.35

(0.72) (0.89) seatmax 2.17
(2.02) 2.25
(2.27) writemax 2.53
(1.77) 2.05
(2.00) Not_Meet_SMC 4.07
(2.01) 3.09
(2.29) Once_Year_SMC 1.67
(1.87) 0.44
(2.25) Once_Term_SMC 3.13
(1.81) 2.34
(2.04) Twice_term_SMC 3.03
(1.76) 2.58
(1.99) Hardly_CSup -3.46
(3.39) -5.27 (4.10)
Once_Year_CSup -2.71
(2.99) -3.07 (3.61)
Once_Term_CSup -3.65
(2.78) -4.63 (3.19)
Twice_Term_CSup -3.94
(2.66) -4.79 (2.95)
totenrol 0.01
(0.00) 0.01
(0.00) p6p1enrol -1.40
(0.64) -0.36 (0.84)
deprived -1.29
(0.69) -0.88 (0.79)
mathpercent 0.03
(2.16)
engpercent
-2.56 (2.53)
Constant 29.51
(3.38) 40.25 (3.90)
Observations 76851 77196 R2 0.11 0.17 Adjusted R2 F 9.09 12.59 D.F. Model 28 28 D.R. Residuals 970 976
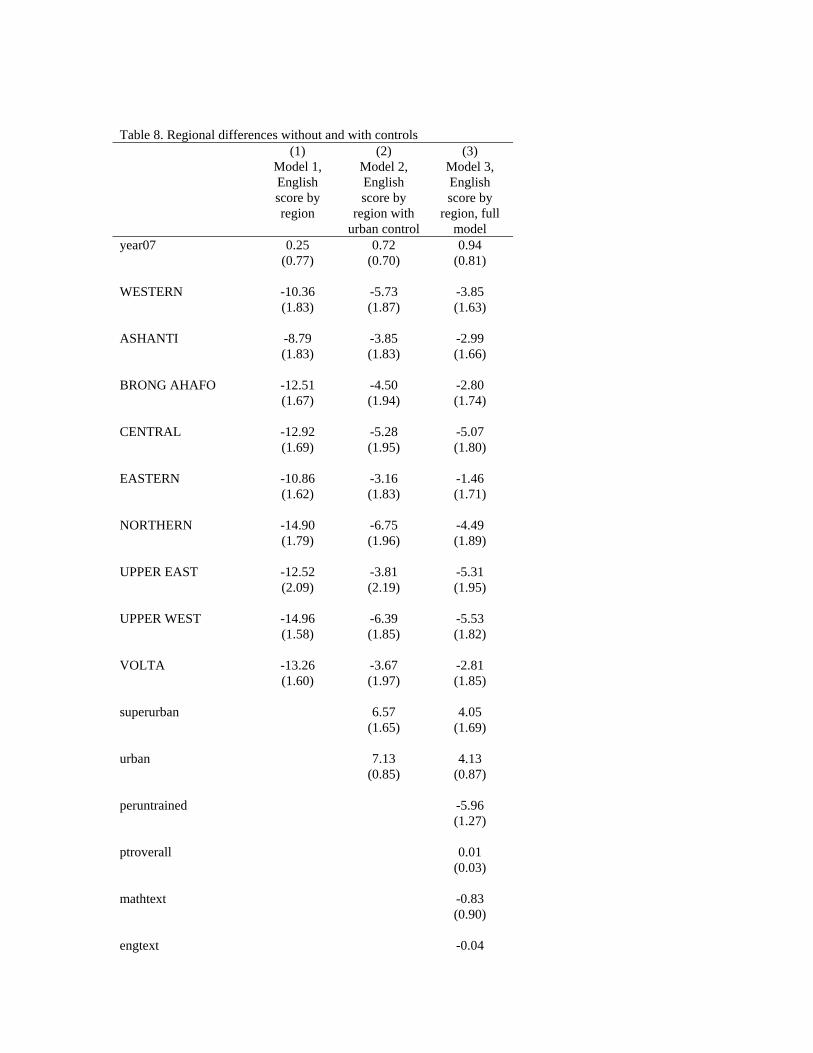
Table 8. Regional differences without and with controls (1) (2) (3) Model 1,
English score by region
Model 2, English score by
region with urban control
Model 3, English score by
region, full model
year07 0.25 (0.77)
0.72 (0.70)
0.94 (0.81)
WESTERN -10.36
(1.83) -5.73 (1.87)
-3.85 (1.63)
ASHANTI -8.79
(1.83) -3.85 (1.83)
-2.99 (1.66)
BRONG AHAFO -12.51
(1.67) -4.50 (1.94)
-2.80 (1.74)
CENTRAL -12.92
(1.69) -5.28 (1.95)
-5.07 (1.80)
EASTERN -10.86
(1.62) -3.16 (1.83)
-1.46 (1.71)
NORTHERN -14.90
(1.79) -6.75 (1.96)
-4.49 (1.89)
UPPER EAST -12.52
(2.09) -3.81 (2.19)
-5.31 (1.95)
UPPER WEST -14.96
(1.58) -6.39 (1.85)
-5.53 (1.82)
VOLTA -13.26
(1.60) -3.67 (1.97)
-2.81 (1.85)
superurban
6.57
(1.65) 4.05
(1.69) urban
7.13
(0.85) 4.13
(0.87) peruntrained
-5.96 (1.27)
ptroverall
0.01 (0.03)
mathtext
-0.83 (0.90)
engtext -0.04

(0.25) libbksperpup
0.13 (0.26)
guide
-0.05 (0.04)
toilets
-0.38 (0.70)
urinals
-0.63 (0.73)
water
0.06 (0.72)
elec
3.56 (0.94)
repairs
-0.26 (0.91)
seatmax
2.86 (2.26)
writemax
1.27 (2.03)
Not_Meet_SMC
2.77 (2.37)
Once_Year_SMC
0.72 (2.38)
Once_Term_SMC
2.63 (2.18)
Twice_term_SMC
2.80 (2.12)
Hardly_CSup
-5.56 (4.17)
Once_Year_CSup
-2.98 (3.57)
Once_Term_CSup
-4.85 (3.18)
Twice_Term_CSup
-5.29 (2.97)
totenrol
0.01 (0.00)

p6p1enrol
-0.28 (0.81)
deprived
-0.08 (0.83)
engpercent
-2.02 (2.50)
Constant 54.13
(1.41) 43.04 (1.75)
42.33 (4.20)
Observations 83663 81486 77196 R2 0.07 0.15 0.17 Adjusted R2 F 11.65 20.08 11.08 D.F. Model 10 12 37 D.R. Residuals 1006 980 976 Standard errors in parentheses Note: Regional variation. Table 9. Regional and zonal interactions with gender (12) (13) (14) (15) (16) Model 1,
Region by gender
interaction, English
Model 2, Region by
gender interaction,
math
Model 3, Region by
gender interaction,
with urbanicity
Model 4, Region by
gender interaction, full model
Model 5, Zone by gender
interaction, full model
year07 0.25 (0.77)
0.16 (0.68)
0.72 (0.70)
0.98 (0.82)
0.92 (0.61)
WESTERN -9.50
(1.77) -5.32 (1.76)
-4.51 (1.84)
-3.14 (1.59)
ASHANTI -8.44
(1.77) -5.53 (1.75)
-3.30 (1.79)
-2.95 (1.67)
BRONG AHAFO -11.16
(1.64) -6.69 (1.58)
-2.86 (1.94)
-1.46 (1.75)
CENTRAL -12.73
(1.64) -9.43 (1.53)
-5.18 (1.94)
-5.46 (1.74)
EASTERN -10.61
(1.57) -7.34 (1.55)
-2.77 (1.80)
-1.54 (1.75)
NORTHERN -14.20
(1.69) -11.69 (1.77)
-5.89 (1.91)
-3.93 (1.91)
UPPER EAST -12.16
(2.08) -6.70 (1.99)
-3.49 (2.22)
-5.79 (2.04)
UPPER WEST -13.37 -7.37 -4.75 -4.41

(1.47) (2.06) (1.92) (1.93) VOLTA -12.25
(1.56) -9.44 (1.51)
-2.60 (1.92)
-3.25 (1.84)
female 1.65
(0.64) -1.16 (0.73)
1.55 (0.66)
1.32 (0.62)
-2.14 (0.22)
WESTERN*female -1.58
(0.93) -0.56 (0.88)
-2.35 (0.94)
-2.13 (0.88)
ASHANTI*female -0.55
(0.76) -0.30 (0.87)
-1.00 (0.74)
-1.13 (0.71)
BRONG AHAFO*female
-2.67 (0.84)
-1.96 (0.91)
-3.37 (0.85)
-3.20 (0.82)
CENTRAL*female -0.11
(0.84) 0.75
(0.92) 0.02
(0.89) 0.76
(1.19)
EASTERN*female -0.37
(0.83) 0.04
(0.84) -0.69 (0.84)
-0.91 (0.82)
NORTHERN*female -1.23
(0.88) 0.15
(0.91) -1.65 (0.87)
-1.30 (0.82)
UPPER EAST*female -0.59
(1.13) 0.36
(1.01) -0.56 (1.16)
-0.68 (1.15)
UPPER WEST*female -3.12
(1.39) -2.70 (1.36)
-3.31 (1.51)
-4.23 (1.58)
VOLTA*female -1.94
(0.81) -0.62 (0.86)
-2.13 (0.85)
-1.82 (0.82)
superurban
6.55 (1.64)
5.20 (1.64)
2.68 (1.08)
urban
7.15 (0.85)
3.28 (0.75)
peruntrained
-8.09 (1.28)
-5.74 (0.96)
ptroverall
0.01 (0.02)
0.01 (0.02)
mathtext
-0.42 (0.91)
-0.93 (0.77)
engtext
-0.08 (0.27)
libbksperpup
0.16 (0.27)
0.24 (0.23)

guide
-0.07 (0.04)
-0.05 (0.02)
toilets
-0.12 (0.71)
-0.39 (0.56)
urinals
-0.92 (0.73)
water
-0.21 (0.72)
0.35 (0.55)
elec
3.88 (0.96)
1.84 (0.80)
repairs
-0.17 (0.91)
-1.11 (0.72)
seatmax
2.97 (2.31)
writemax
0.96 (2.07)
3.95 (1.05)
Not_Meet_SMC
2.31 (2.88)
1.25 (1.15)
Once_Year_SMC
-0.29 (2.80)
-1.27 (0.76)
Once_Term_SMC
1.52 (2.66)
Twice_term_SMC
1.43 (2.62)
Hardly_CSup
-4.08 (4.72)
0.65 (2.23)
Once_Year_CSup
-2.38 (3.96)
1.08 (1.39)
Once_Term_CSup
-4.45 (3.63)
Twice_Term_CSup
-4.79 (3.44)
totenrol
0.01 (0.00)
0.01 (0.00)
p6p1enrol
0.38 (0.80)
-1.24 (0.63)

deprived
-0.44 (0.88)
-1.00 (0.74)
engpercent
-0.98 (2.55)
0.42 (2.09)
Northern zone
-1.30 (0.81)
Northern zone*female
0.32 (0.47)
Constant 53.25
(1.38) 42.67 (1.49)
42.22 (1.73)
42.49 (4.29)
29.77 (2.61)
Observations 83639 83417 81464 77873 76826 R2 0.07 0.05 0.15 0.17 0.12 Adjusted R2 F 7.30 8.30 12.07 9.80 12.72 D.F. Model 20 20 22 46 24 D.R. Residuals 1006 999 980 976 970 Standard errors in parentheses Note: Regional by gender variation. Table 10. Urban/rural comparisons, without and with controls and with gender interaction (17) (18) (19) (20) Model 1,
Urbanicity Model 2,
Urban and superurban
Model 3, Urban and
superurban, full model
Model 4, Urban by
gender interaction, full model
year07 0.44 (0.75)
0.75 (0.70)
1.05 (0.75)
0.95 (0.61)
urban 10.33
(0.84) 7.19
(0.86) 4.16
(0.88)
superurban
8.70
(1.34) 5.53
(1.33) 2.84
(1.09) peruntrained
-7.22 (1.22)
-6.02 (0.97)
ptroverall
-0.00 (0.03)
0.01 (0.02)
mathtext
-0.79 (0.87)
-0.89 (0.78)
libbksperpup
0.35 (0.25)
0.29 (0.24)
guide
-0.05 (0.05)
-0.05 (0.02)

toilets
-0.44 (0.68)
-0.39 (0.56)
water
-0.06 (0.69)
0.34 (0.55)
elec
3.65 (0.93)
1.90 (0.79)
repairs
-0.57 (0.89)
-1.10 (0.72)
writemax
3.50 (1.20)
4.01 (1.04)
Not_Meet_SMC
0.76 (1.29)
1.18 (1.14)
Once_Year_SMC
-1.91 (1.16)
-1.27 (0.76)
Hardly_CSup
-0.43 (3.08)
0.32 (2.25)
Once_Year_CSup
1.47 (1.97)
0.90 (1.40)
totenrol
0.01 (0.00)
0.01 (0.00)
p6p1enrol
-0.38 (0.82)
-1.34 (0.63)
deprived
-0.94 (0.80)
-1.34 (0.72)
engpercent
-2.28 (2.51)
0.26 (2.08)
rural
-2.14 (0.75)
ruralfemale
-2.28 (0.20)
Constant 39.00
(0.58) 38.59 (0.53)
38.39 (3.01)
32.27 (2.80)
Observations 81486 81486 77196 76826 R2 0.10 0.14 0.17 0.11 Adjusted R2 F 75.43 69.05 15.84 15.86 D.F. Model 2 3 21 22 D.R. Residuals 980 980 976 970 Standard errors in parentheses Note: Urbanicity.
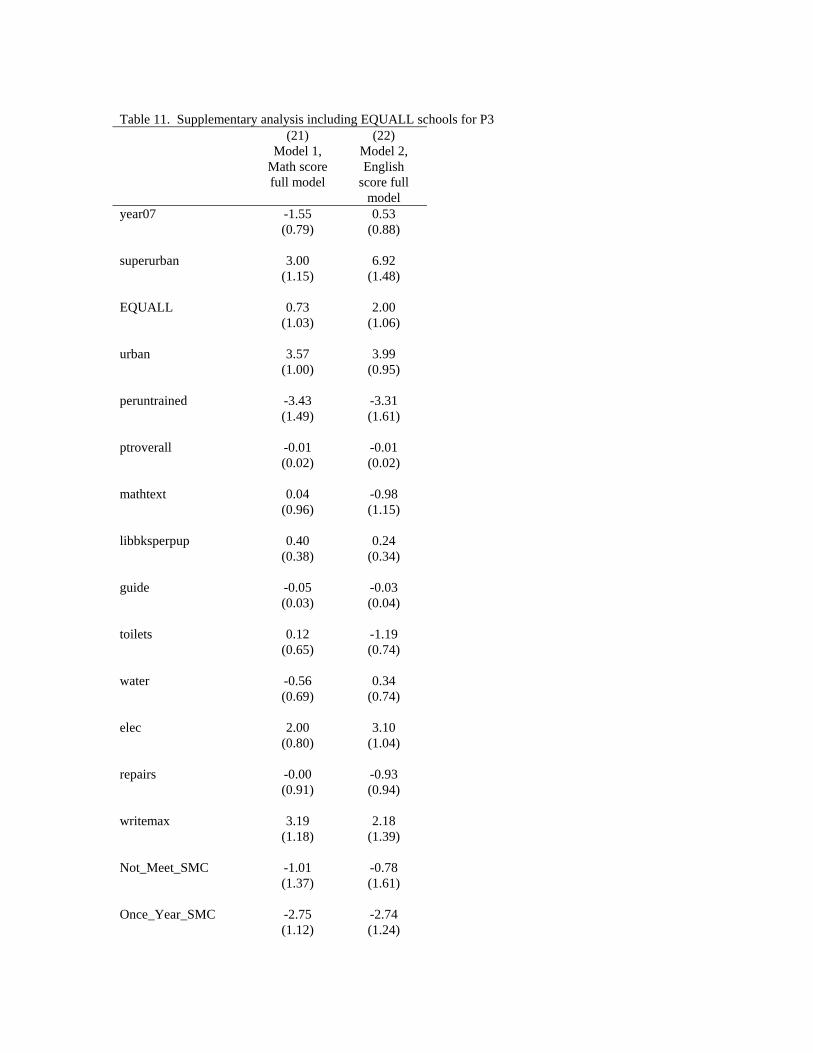
Table 11. Supplementary analysis including EQUALL schools for P3 (21) (22) Model 1,
Math score full model
Model 2, English
score full model
year07 -1.55 (0.79)
0.53 (0.88)
superurban 3.00
(1.15) 6.92
(1.48) EQUALL 0.73
(1.03) 2.00
(1.06) urban 3.57
(1.00) 3.99
(0.95) peruntrained -3.43
(1.49) -3.31 (1.61)
ptroverall -0.01
(0.02) -0.01 (0.02)
mathtext 0.04
(0.96) -0.98 (1.15)
libbksperpup 0.40
(0.38) 0.24
(0.34) guide -0.05
(0.03) -0.03 (0.04)
toilets 0.12
(0.65) -1.19 (0.74)
water -0.56
(0.69) 0.34
(0.74) elec 2.00
(0.80) 3.10
(1.04) repairs -0.00
(0.91) -0.93 (0.94)
writemax 3.19
(1.18) 2.18
(1.39) Not_Meet_SMC -1.01
(1.37) -0.78 (1.61)
Once_Year_SMC -2.75
(1.12) -2.74 (1.24)

Hardly_CSup 0.24 (2.97)
-0.55 (1.93)
Once_Year_CSup -1.56
(2.39) 0.54
(2.62) totenrol 0.01
(0.00) 0.00
(0.00) p6p1enrol -0.94
(0.93) -0.61 (0.79)
deprived -0.60
(0.94) -1.73 (0.88)
mathpercent 5.07
(2.28)
engpercent
4.09
(2.45) Constant 28.31
(2.85) 30.51 (3.02)
Observations 76596 76228 R2 0.05 0.11 Adjusted R2 F 6.32 8.36 D.F. Model 22 22 D.R. Residuals 990 990 Standard errors in parentheses Note: Compare math and English including EQUALL schools.

Appendix E. District Snapshots
Appendix F. Stakeholders interviewed Ministry of Education
James Afrani Director, Finance and Administration (acting Chief Director of MOE) Charles Aheto-Tsegah Director, Planning, Budgeting, Monitoring and Evaluation Division Victor Kofi Mante Director Teacher Education Service Sarah Agyeman-Durah Director Curriculum Research and Development Division (CRDD) Kwame Apiadu-Agyen Planning Offier and Coordinator of Development Partners
Ghana Education Service
Charles Otoo Financial Controller Stephen Adu Director Basic Education Division Victoria Donkor Director, Tema Municipal School District Mary Geisey Head Teacher, Mallam DA 1 & 2 Akua Akyeabea Larbi Director, Mallam DA 1 & 2 Reverend Naana-Danyame Circuit Supervisor Mallam Junction, Ga South District Esther Edjani Director, Pre-Tertiary Private Schools Rose Oduro-Koranteng Principal, Aburi Teacher Training College
Emmannuel Kingsley-Osei Principal, Akropong Teacher Training College Christiana Boateng District Education Officer Koforidua District Peter Bonney Headmaster, Danehira School Ga South District Gbetekpo Primay School Ho District Abutia-Kloe Primary School Ho District
USAID
Bob Davidson Chief, Education Division William Osafo Deputy Team Leader, Education Division Eric Johnson Education Advisor Ewura-Abena Ahwoi Coordinator, Textbooks and Learning Materials Program
Other Agencies
Josua Baku Deputy Registrar, Research Division West African Examination Council Kay Leherr Team Leader, Education Quality for All (EQUALL) Kwesi Dzidzienyo Country Representative International Foundation for Education and Self-Help (IFESH) Emmanuel Acquaye Ex-Dirctor of Basic Education, Director, New Age Strategies Peter Darvas Senior Education Economist

Ghana Resident Mission, World Bank Madeez Adamu-Issah Education Project Officer UNICEF
Case Study Schools (P1, P3, and P6 teachers, head teacher) AKOTEYKROM D/A PRIMARY ANYINABRIM METHODIST ASRATOASE D/A PRIMARY ASSIN KUMASI D/A BASIC ASSIN MANSO D/A PRIMARY ANFOEGA AKUKOME E.P. KPANDO AGBENOXOE R/C KPANDO DZOANTI R. C. SOVIE AVENU L/A KG/PRIMARY WUSUTA HOTOR R/C PRIMARY
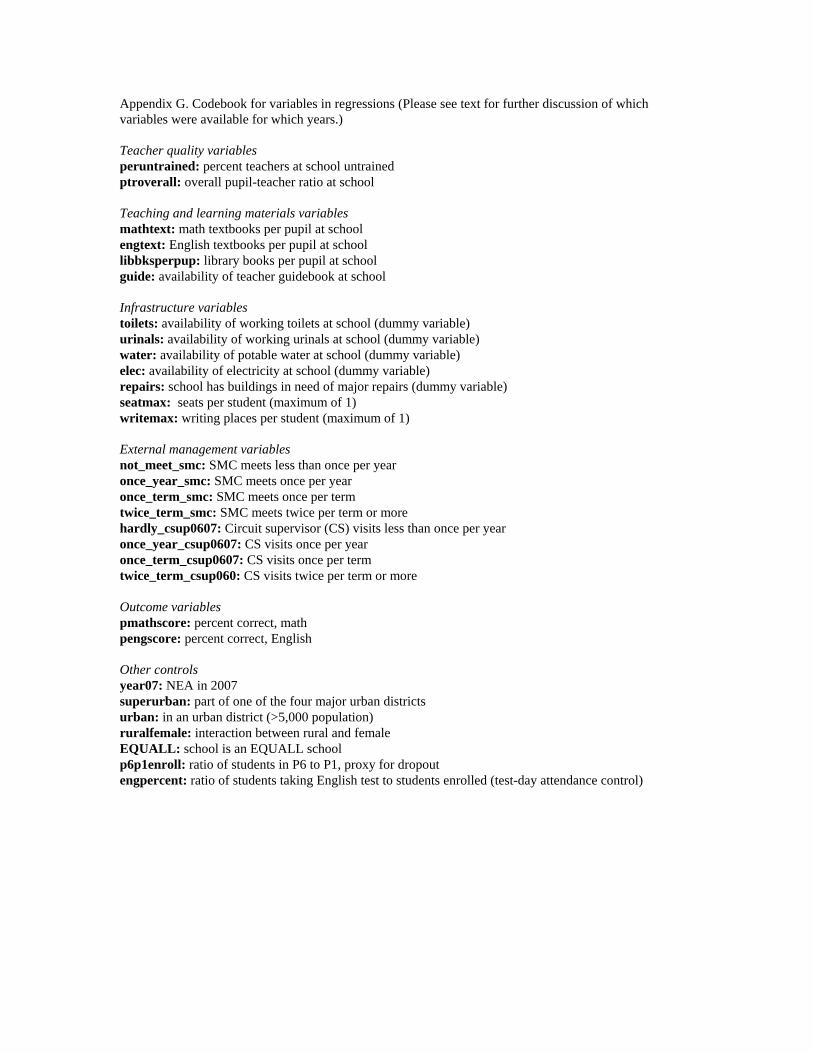
Appendix G. Codebook for variables in regressions (Please see text for further discussion of which variables were available for which years.) Teacher quality variables peruntrained: percent teachers at school untrained ptroverall: overall pupil-teacher ratio at school Teaching and learning materials variables mathtext: math textbooks per pupil at school engtext: English textbooks per pupil at school libbksperpup: library books per pupil at school guide: availability of teacher guidebook at school Infrastructure variables toilets: availability of working toilets at school (dummy variable) urinals: availability of working urinals at school (dummy variable) water: availability of potable water at school (dummy variable) elec: availability of electricity at school (dummy variable) repairs: school has buildings in need of major repairs (dummy variable) seatmax: seats per student (maximum of 1) writemax: writing places per student (maximum of 1) External management variables not_meet_smc: SMC meets less than once per year once_year_smc: SMC meets once per year once_term_smc: SMC meets once per term twice_term_smc: SMC meets twice per term or more hardly_csup0607: Circuit supervisor (CS) visits less than once per year once_year_csup0607: CS visits once per year once_term_csup0607: CS visits once per term twice_term_csup060: CS visits twice per term or more Outcome variables pmathscore: percent correct, math pengscore: percent correct, English Other controls year07: NEA in 2007 superurban: part of one of the four major urban districts urban: in an urban district (>5,000 population) ruralfemale: interaction between rural and female EQUALL: school is an EQUALL school p6p1enroll: ratio of students in P6 to P1, proxy for dropout engpercent: ratio of students taking English test to students enrolled (test-day attendance control)