baseline survey on the attitude and level of knowledge of
TRANSCRIPT
The Government of the
Hong Kong Special Administrative Region
Agriculture, Fisheries and Conservation Department
Baseline Survey on the Attitude and
Level of Knowledge of the General Public
and Stakeholder Groups towards
Biodiversity in Hong Kong
Research Report
Centre for Communication and Public Opinion Survey
The Chinese University of Hong Kong
September 2018
Centre for Communication and Public Opinion Survey, Agriculture, Fisheries and Conservation Department,
CUHK HKSAR
1
“Baseline Survey on the Attitude and Level of Knowledge of the General Public and Stakeholder Groups
Towards Biodiversity in Hong Kong” Research Report
Content
Executive Summary P.5
1. Introduction P.7
2. Research Design and Methods P.8
3. Research Findings P.20
3.1 Telephone Survey with the General Public P.20
3.1.1 Knowledge of Biodiversity P.20
3.1.1.1 Knowledge of the term “biodiversity” P.20
3.1.1.2 Knowledge of the biodiversity in Hong Kong P.22
3.1.1.3 Knowledge of designated protected area for nature
conservation in Hong Kong
P.23
3.1.1.4 Knowledge of the land area of country parks and special
areas in Hong Kong
P.25
3.1.1.5 Knowledge of legally protected local wild animals and
plants in Hong Kong
P.26
3.1.1.6 Overall knowledge of the three specific aspects of
biodiversity in Hong Kong
P.28
3.1.2 Importance of Preserving Biodiversity P.29
3.1.2.1 Level of concern with the biodiversity in Hong Kong P.29
3.1.2.2 Perceptions of the importance of preserving biodiversity P.30
3.1.3 Closeness to Biodiversity P.35
3.1.4 Willingness to Preserve Biodiversity P.39
3.1.5 Overall Biodiversity Indexes P.43
3.1.5.1 “Knowledge Index” P.43
3.1.5.2 “Importance Index”, “Closeness Index” and “Willingness
Index”
P.45
Centre for Communication and Public Opinion Survey, Agriculture, Fisheries and Conservation Department,
CUHK HKSAR
2
“Baseline Survey on the Attitude and Level of Knowledge of the General Public and Stakeholder Groups
Towards Biodiversity in Hong Kong” Research Report
3.2 Online Survey with Stakeholder Groups - Teachers and Planning and
Development Professionals
P.48
3.2.1 Knowledge of Biodiversity P.48
3.2.1.1 Knowledge of the term “biodiversity” P.48
3.2.1.2 Knowledge of the biodiversity in Hong Kong P.50
3.2.1.3 Knowledge of designated protected area for nature
conservation in Hong Kong
P.52
3.2.1.4 Knowledge of the land area of country parks and special
areas in Hong Kong
P.55
3.2.1.5 Knowledge of legally protected local wild animals and
plants in Hong Kong
P.57
3.2.1.6 Overall knowledge of the three specific aspects of
biodiversity in Hong Kong
P.61
3.2.2 Importance of Preserving Biodiversity P.63
3.2.2.1 Level of concern about the biodiversity in Hong Kong P.63
3.2.2.2 Perceptions of the importance of preserving biodiversity P.65
3.2.3 Closeness to Biodiversity P.70
3.2.4 Willingness to Preserve Biodiversity P.75
3.2.5 Overall Biodiversity Indexes P.80
3.2.5.1 “Knowledge Index” P.80
3.2.5.2 “Importance Index”, “Closeness Index” and “Willingness
Index”
P.82
3.2.6 Teachers’ opinions and attitudes towards biodiversity in the sector P.84
3.2.6.1 Whether their schools have enough teachers who are
knowledgeable about biodiversity
P.84
3.2.6.2 Whether their schools value teaching students about
biodiversity conservation
P.85
3.2.6.3 Whether their schools organize any biodiversity-related P.86
Centre for Communication and Public Opinion Survey, Agriculture, Fisheries and Conservation Department,
CUHK HKSAR
3
“Baseline Survey on the Attitude and Level of Knowledge of the General Public and Stakeholder Groups
Towards Biodiversity in Hong Kong” Research Report
activities
3.2.6.4 The effectiveness of the current curriculum and teaching
materials on biodiversity education
P.87
3.2.6.5 The government’s support to schools or teachers to teach
biodiversity
P.88
3.2.7 Planning and development professionals’ opinions and attitudes
towards biodiversity in the sector
P.89
3.2.7.1 Whether their professional sector is informed about
biodiversity
P.89
3.2.7.2 Whether their professional sector values biodiversity
conservation
P.90
3.2.7.3 The considerations for biodiversity conservation in
planning and decision-making processes
P.91
3.2.7.4 Whether incentives or pressures are adequate to urge their
professional sector to incorporate considerations for
biodiversity conservation in planning and decision
making processes
P.92
3.2.7.5 Views on the government’s job in promoting and
educating their professional sector on biodiversity
conservation
P.93
3.3 Focus Group Discussion (Summary) P.94
3.3.1 General Public P.94
3.3.2 Secondary School Teachers P.97
3.3.3 Planning and Development Professionals P.99
4. Discussion and Conclusion P.101
Appendix 1: Questionnaires and Discussion Guides P.110
Appendix 2: Demographics of Survey Respondents and Focus Group
Participants
P.137

Centre for Communication and Public Opinion Survey, Agriculture, Fisheries and Conservation Department,
CUHK HKSAR
4
“Baseline Survey on the Attitude and Level of Knowledge of the General Public and Stakeholder Groups
Towards Biodiversity in Hong Kong” Research Report
Appendix 3: Statistical Tables P.147
Appendix 4: Full Focus Group Discussion Findings P.245
Centre for Communication and Public Opinion Survey, Agriculture, Fisheries and Conservation Department,
CUHK HKSAR
5
“Baseline Survey on the Attitude and Level of Knowledge of the General Public and Stakeholder Groups
Towards Biodiversity in Hong Kong” Research Report
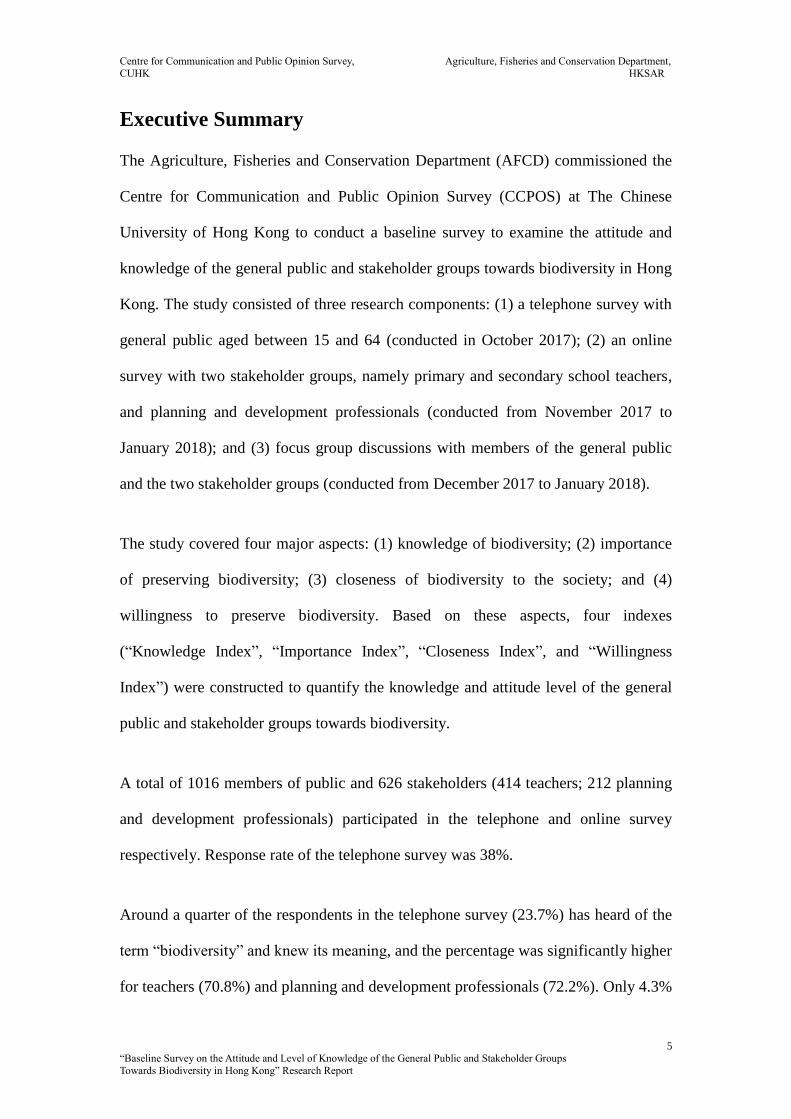
Executive Summary
The Agriculture, Fisheries and Conservation Department (AFCD) commissioned the
Centre for Communication and Public Opinion Survey (CCPOS) at The Chinese
University of Hong Kong to conduct a baseline survey to examine the attitude and
knowledge of the general public and stakeholder groups towards biodiversity in Hong
Kong. The study consisted of three research components: (1) a telephone survey with
general public aged between 15 and 64 (conducted in October 2017); (2) an online
survey with two stakeholder groups, namely primary and secondary school teachers,
and planning and development professionals (conducted from November 2017 to
January 2018); and (3) focus group discussions with members of the general public
and the two stakeholder groups (conducted from December 2017 to January 2018).
The study covered four major aspects: (1) knowledge of biodiversity; (2) importance
of preserving biodiversity; (3) closeness of biodiversity to the society; and (4)
willingness to preserve biodiversity. Based on these aspects, four indexes
(“Knowledge Index”, “Importance Index”, “Closeness Index”, and “Willingness
Index”) were constructed to quantify the knowledge and attitude level of the general
public and stakeholder groups towards biodiversity.
A total of 1016 members of public and 626 stakeholders (414 teachers; 212 planning
and development professionals) participated in the telephone and online survey
respectively. Response rate of the telephone survey was 38%.
Around a quarter of the respondents in the telephone survey (23.7%) has heard of the
term “biodiversity” and knew its meaning, and the percentage was significantly higher
for teachers (70.8%) and planning and development professionals (72.2%). Only 4.3%
Centre for Communication and Public Opinion Survey, Agriculture, Fisheries and Conservation Department,
CUHK HKSAR
6
“Baseline Survey on the Attitude and Level of Knowledge of the General Public and Stakeholder Groups
Towards Biodiversity in Hong Kong” Research Report
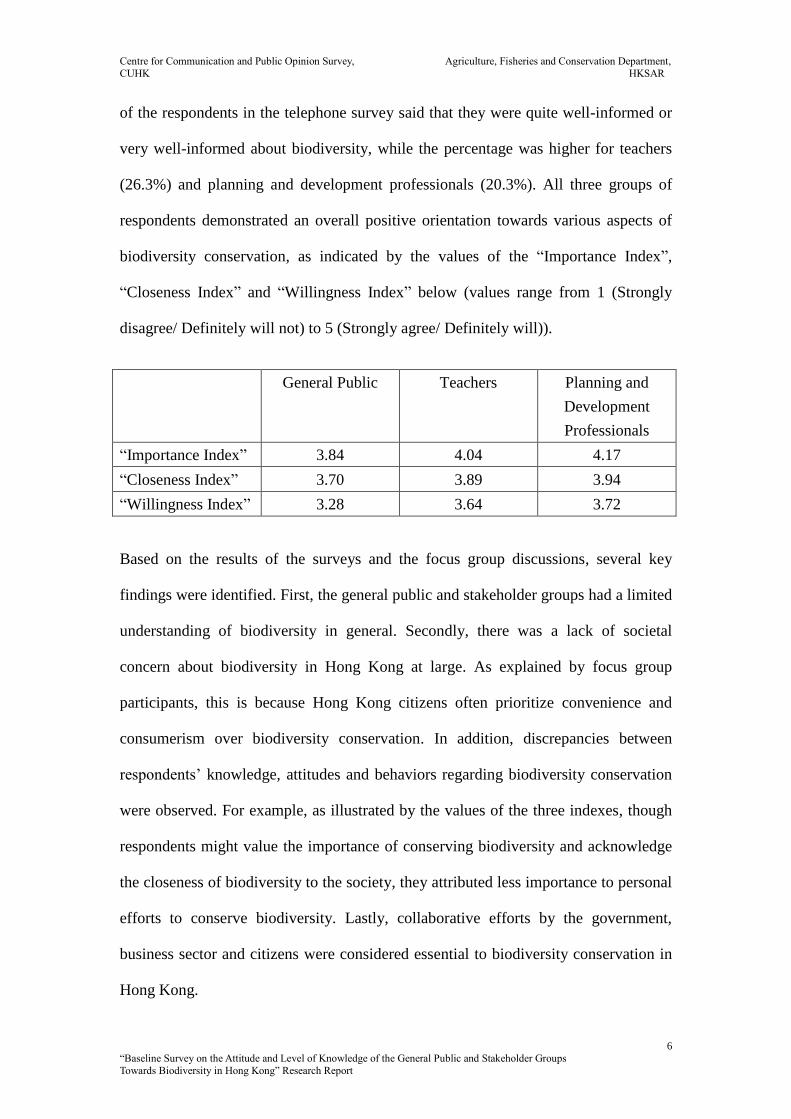
of the respondents in the telephone survey said that they were quite well-informed or
very well-informed about biodiversity, while the percentage was higher for teachers
(26.3%) and planning and development professionals (20.3%). All three groups of
respondents demonstrated an overall positive orientation towards various aspects of
biodiversity conservation, as indicated by the values of the “Importance Index”,
“Closeness Index” and “Willingness Index” below (values range from 1 (Strongly
disagree/ Definitely will not) to 5 (Strongly agree/ Definitely will)).
General Public Teachers Planning and
Development
Professionals
“Importance Index” 3.84 4.04 4.17
“Closeness Index” 3.70 3.89 3.94
“Willingness Index” 3.28 3.64 3.72
Based on the results of the surveys and the focus group discussions, several key
findings were identified. First, the general public and stakeholder groups had a limited
understanding of biodiversity in general. Secondly, there was a lack of societal
concern about biodiversity in Hong Kong at large. As explained by focus group
participants, this is because Hong Kong citizens often prioritize convenience and
consumerism over biodiversity conservation. In addition, discrepancies between
respondents’ knowledge, attitudes and behaviors regarding biodiversity conservation
were observed. For example, as illustrated by the values of the three indexes, though
respondents might value the importance of conserving biodiversity and acknowledge
the closeness of biodiversity to the society, they attributed less importance to personal
efforts to conserve biodiversity. Lastly, collaborative efforts by the government,
business sector and citizens were considered essential to biodiversity conservation in
Hong Kong.
Centre for Communication and Public Opinion Survey, Agriculture, Fisheries and Conservation Department,
CUHK HKSAR
7
“Baseline Survey on the Attitude and Level of Knowledge of the General Public and Stakeholder Groups
Towards Biodiversity in Hong Kong” Research Report
1 Introduction
In December 2016, the Environment Bureau of the Hong Kong Special
Administrative Region Government issued a landmark document, the Hong Kong
Biodiversity Strategy and Action Plan (2016-21) (hereafter BSAP), with an aim to
conserve biodiversity and support sustainable development. Against this background,
the Agriculture, Fisheries and Conservation Department (AFCD) commissioned the
Centre for Communication and Public Opinion Survey (CCPOS) at The Chinese
University of Hong Kong to carry out a baseline survey to examine the attitude and
knowledge of the general public and stakeholder groups towards biodiversity in Hong
Kong. The survey was among the first of its kind in the city.
The study has the following research objectives:
1. To develop a baseline picture on the attitude and level of knowledge of the
general public and various stakeholder groups towards biodiversity in Hong
Kong.
2. To establish an in-depth understanding on the perceptions, opinions, attitudes and
beliefs of the general public and various stakeholder groups towards biodiversity
in Hong Kong.
3. To develop a survey evaluation tool that can be used to track the progress in
achieving a key objective of BSAP on raising awareness and knowledge of the
general public and relevant stakeholders towards biodiversity in Hong Kong.
4. To provide information for the planning of public awareness and education
programmes in the future.

Centre for Communication and Public Opinion Survey, Agriculture, Fisheries and Conservation Department,
CUHK HKSAR
8
“Baseline Survey on the Attitude and Level of Knowledge of the General Public and Stakeholder Groups
Towards Biodiversity in Hong Kong” Research Report
2 Research Design and Methods
This baseline study consisted of three research components. The first component was
a general public survey, which aimed to examine the knowledge and views of Hong
Kong citizens towards biodiversity. The second component was an online survey with
two stakeholder groups, namely teachers and planning and development professionals.
Similarly, the purpose of the online survey was to gather views of the concerned
stakeholder groups towards biodiversity in Hong Kong. The third component was
focus group discussions, which served to gain in-depth understandings of the
knowledge and views of Hong Kong citizens, teachers, planning and development
professionals towards biodiversity.
2.1 Telephone Survey with the General Public
2.1.1 Target Respondents
Target respondents were Hong Kong residents (Cantonese, Mandarin and English
speakers) aged between 15 and 64.
2.1.2 Sampling
To perform random sampling, all telephone numbers in the latest residential telephone
directories were transformed into six-digit numbers by erasing the last two digits. A
hundred two-digit numbers from 00 to 99 were then appended to each number, which
generated a sampling frame of household telephone numbers. Telephone numbers
were then randomly selected from the sampling frame during the survey. After
successful contact with the household, if there was more than one member eligible for
the interview, the “Next Birthday” rule was employed to select the eligible household
member whose birthday would come soonest.
Centre for Communication and Public Opinion Survey, Agriculture, Fisheries and Conservation Department,
CUHK HKSAR
9
“Baseline Survey on the Attitude and Level of Knowledge of the General Public and Stakeholder Groups
Towards Biodiversity in Hong Kong” Research Report
2.1.3 Data Collection Method
The computer-assisted telephone interviewing (CATI) system was deployed to
conduct the telephone survey. All data were inputted into the system by the
interviewers.
2.1.4 Questionnaire
To prepare for questionnaire design, the BSAP has been studied intensively to
comprehend its background and objectives thoroughly. Besides, international and
local studies have also been reviewed to gain a more in-depth understanding of
similar public awareness surveys and the issue of biodiversity.1
In designing the questionnaire, it has been borne in the mind that this study should
accord with the needs and purposes of the BSAP. Therefore, while references from
international studies have been drawn, it has been made sure that the survey would
reveal the specific situations of Hong Kong.
The questionnaire contained 30 questions, which included 24 main questions and six
demographics items. The main questions covered four aspects – Knowledge of
biodiversity (“Knowledge” questions), Importance of preserving biodiversity
(“Importance” questions), Closeness of biodiversity to the society (“Closeness”
questions), and Willingness to preserve biodiversity (“Willingness” questions).
1 The following international and local studies were mainly reviewed for designing the study:
(1) European Commission (2015). Attitudes of Europeans towards biodiversity. Special Eurobarometer
436. Retrieved from http://ec.europa.eu/COMMFrontOffice/publicopinion/index.cfm;
(2) Federal Ministry for the Environment, Nature Conservation, Building and Nuclear Safety (2016).
2015 Nature Awareness Study:Population survey on nature and biological diversity. Retrieved from
http://www.bmub.bund.de/fileadmin/Daten_BMU/Pools/Broschueren/naturbewusstseinsstudie_2015_e
n_bf.pdf;
(3) Martin, S., & Rollason, R. (2017). The First Baseline Study of General Public’s Awareness and
Attitudes Towards Biodiversity Conservation in Hong Kong. Retrieved from
http://civic-exchange.org/wp-content/uploads/2017/01/Biodiversity-report_v2-2015.C.008.15D.pdf

Centre for Communication and Public Opinion Survey, Agriculture, Fisheries and Conservation Department,
CUHK HKSAR
10
“Baseline Survey on the Attitude and Level of Knowledge of the General Public and Stakeholder Groups
Towards Biodiversity in Hong Kong” Research Report
Before the survey was officially launched, a pilot survey was conducted to check the
feasibility of the questionnaire. According to the pilot results, the questionnaire was
then slightly modified (See the questionnaire in Appendix 1). Three sets of
questionnaire were prepared to cater to Cantonese, Mandarin and English speakers.
2.1.5 Polling Period
The survey was conducted during the period of 9-24 October 2017.
2.1.6 Sample Size and Response Rate
CCPOS has successfully interviewed 1,016 respondents. The response rate was 38%.
The calculation of the response rate is demonstrated as follows:
Total Number of Phone Calls Attempted 43335
A. Total Number of Confirmed Ineligible Phone Numbers for Interview
(Ineligibles) 24120
A1. Non-working number 19779
A2. Non-residence 1582
A3. Fax/ Modem/ Pager 2160
A4. No eligible living in 599
B. Total Number of Phone Numbers with Unconfirmed Eligible Interviewee
(Unknown) 17611
B1. No answer 8119
B2. Busy 2085
B3. Need password 58
B4. Language problem 17
B5. Without confirming as a household before hanging up 7332
C. Total Number of Phone Numbers with Confirmed Eligible Interviewees
(Eligibles) 1604
C1. Refusal (including refusal in the middle of interview ) 458
C2. Eligible interviewee unavailable in survey period 130
C3. Completed 1016
Response rate is computed in the following way:
Completed / [Eligibles + Unknown x Eligibles / (Eligibles + Ineligibles)]
= 1016 / [1604 + 17611 x 1604 / (1604 + 24120)]

Centre for Communication and Public Opinion Survey, Agriculture, Fisheries and Conservation Department,
CUHK HKSAR
11
“Baseline Survey on the Attitude and Level of Knowledge of the General Public and Stakeholder Groups
Towards Biodiversity in Hong Kong” Research Report
= 0.3760 (i.e. 38%)
2.1.7 Sampling Error
The sample size was 1,016. At the confidence level of 95%, the sampling error was
±3.1%.
2.1.8 Quality Assurance
The interviewer team mainly consisted of university students who were capable of
conducting interviews in Cantonese, Mandarin and English. Before fieldwork, all
interviewers received a comprehensive briefing. Besides, the CATI system at CCPOS
allows fieldwork supervisors to perform real time monitoring of telephone interviews.
This means supervisors can listen to the conversations between interviewers and
interviewees. At the same time, they can monitor the computer screens of interviewers
as well.
After data collection, all survey data were recorded in SPSS with clear variable names
and labels. Before carrying out data analysis, data checking was performed to make
sure that the dataset contained no flaws.
2.1.9 Weighting
To ensure the representativeness of the data, the final sample was weighted by the
proportions of gender, age and educational level according to the latest population
profile published by the Census and Statistics Department.

Centre for Communication and Public Opinion Survey, Agriculture, Fisheries and Conservation Department,
CUHK HKSAR
12
“Baseline Survey on the Attitude and Level of Knowledge of the General Public and Stakeholder Groups
Towards Biodiversity in Hong Kong” Research Report
2.2 Online Survey with Stakeholder Groups
2.2.1 Target Respondents
Target respondents of the online survey were members of two stakeholder groups,
namely teachers and planning and development professionals. The former group
included teachers in primary and secondary schools in Hong Kong. The latter group
consisted of architects, engineers, landscape architects, surveyors, urban designers,
urban planners, and other related professions.
2.2.2 Data Collection Method
For the “teachers” group, random sampling was used to select 300 primary schools
and 300 secondary schools in Hong Kong2. Teachers of various subjects in each
school were invited to participate in the online survey. A total of 122 schools (51
primary schools and 71 secondary schools) have participated in the survey. Besides,
the Hong Kong Professional Teachers’ Union, the largest teacher association in Hong
Kong, has also offered assistance in distributing the online questionnaire to its
individual members.
For the “planning and development professionals” group, cooperation of professional
bodies was primarily sought to disseminate the online survey questionnaire. Five
professional associations have helped to distribute the online questionnaire to their
members. They were The Hong Kong Institute of Architects, The Hong Kong Institute
of Landscape Architects, The Hong Kong Institute of Planners, The Hong Kong
Institute of Surveyors, and the Hong Kong Institute of Urban Design. Besides,
snowball sampling was also employed to further expand the base of respondents.
There is a potential limitation of the sampling method of the online survey. The way
2 International schools and special education schools were excluded in the sampling.

Centre for Communication and Public Opinion Survey, Agriculture, Fisheries and Conservation Department,
CUHK HKSAR
13
“Baseline Survey on the Attitude and Level of Knowledge of the General Public and Stakeholder Groups
Towards Biodiversity in Hong Kong” Research Report
the respondents were recruited might exhibit a self-selection bias. That is, the people
who voluntarily decided to participate in the survey were possibly the ones more
interested in, and informed and concerned about the biodiversity issue. In other words,
these people might be over-represented in the sample.
2.2.3 Questionnaire
The telephone survey questionnaire served as the foundation of the online survey
questionnaire. On top of that, the online survey questionnaire also included some
specific questions for the two stakeholder groups (See the questionnaires in Appendix
1).
For the “teachers” group, respondents were asked about their views towards various
aspects of biodiversity education in their schools. Besides, they were asked to
evaluate the support provided by the government for them to teach biodiversity in
schools.
For the “planning and development professionals” group, respondents were asked
about their understanding of the concept of biodiversity and the importance placed on
biodiversity conservation in their professional fields. Besides, they were also asked to
indicate whether the government has done an adequate job to promote and educate
them on biodiversity.
2.2.4 Polling Period
The online survey with the two stakeholder groups was carried out from November
2017 to January 2018.
Centre for Communication and Public Opinion Survey, Agriculture, Fisheries and Conservation Department,
CUHK HKSAR
14
“Baseline Survey on the Attitude and Level of Knowledge of the General Public and Stakeholder Groups
Towards Biodiversity in Hong Kong” Research Report
2.2.5 Sample Size
The online survey has successfully interviewed 414 teachers and 212 planning and
development professionals in Hong Kong.
2.2.6 Logistics
Every professional organization/ school had an individual online questionnaire link.
The respondents could easily access the questionnaire by simply clicking the link.
After they have finished the survey, all data of submitted questionnaires went directly
to CCPOS’s system.
The layout of the online questionnaire would affect the response rate. Questionnaires
with clearer layout will receive higher response rates. Therefore, efforts were put into
the layout design of the online questionnaires. Besides, the online survey platform
allows adjustment of questionnaire layout across different digital devices.
Respondents could clearly view the questionnaire on whatever device they use. This
technical feature could also enhance the response rate.

Centre for Communication and Public Opinion Survey, Agriculture, Fisheries and Conservation Department,
CUHK HKSAR
15
“Baseline Survey on the Attitude and Level of Knowledge of the General Public and Stakeholder Groups
Towards Biodiversity in Hong Kong” Research Report
2.3 Focus Group Discussion
Five focus group discussions were conducted. Three of them were with members of
the general public, one with teachers, and the remaining one with planning and
development professionals.
2.3.1 Formation of Focus Groups
For the “general public” focus groups, target participants were drawn from the pool of
respondents in the telephone survey who have indicated their interest in participating
in the focus groups. Target participants were Cantonese-speaking Hong Kong
residents aged between 15 and 64 (see Appendix 2 for the demographics of the focus
group participants).
The three focus groups were formed based on the results of the telephone survey.
Target participants were categorized into “high”, “medium”, and “low” groups
according to their answers to the Importance questions in the telephone survey. The
“high” group consisted of participants who scored relatively higher in the
“Importance” questions, meaning that they were the ones who valued the importance
of biodiversity conservation more. The “low” group comprised of participants who
had relatively lower scores in the “Importance” questions, meaning that they valued
the importance of biodiversity conservation less. The “medium” group was
in-between. Besides, each focus group aimed to achieve a certain level of
demographic diversity by mixing participants of different genders, age groups and
educational levels.
Target participants for the two stakeholder focus groups were recruited from the pool
of respondents in the online survey who have expressed interest in joining the focus
groups (see Appendix 2 for the demographics of the focus group participants). For the
Centre for Communication and Public Opinion Survey, Agriculture, Fisheries and Conservation Department,
CUHK HKSAR
16
“Baseline Survey on the Attitude and Level of Knowledge of the General Public and Stakeholder Groups
Towards Biodiversity in Hong Kong” Research Report
“teachers” focus group, only secondary school teachers of related subjects (i.e.,
Geography, Biology, Science, and Liberal Studies) were the target participants, since
these subjects are more relevant to biodiversity. This arrangement could foster a more
focused, thoughtful and substantive discussion among the participants.
For the “planning and development professionals” group, different fields of industry
practitioners (including architects, engineers, landscape architects, surveyors, and
urban planners) were recruited to join the focus group.
2.3.2 Discussion Guide
The focus groups with members of the general public served to elicit in-depth and
elaborate views of Hong Kong citizens towards the concept of biodiversity and the
biodiversity in Hong Kong. In this regard, the discussion items included how they
evaluated their knowledge of biodiversity, how they perceived the social and personal
importance in biodiversity conservation, how they viewed the relationship between
biodiversity conservation and social and economic development, and why and
whether they had the personal willingness to take actions to conserve biodiversity
(See the discussion guide in Appendix 1). A pilot focus group was conducted in
November 2017 to test and refine the discussion guide.
For the stakeholders’ focus groups, the core theme was the stakeholders’ views
towards the mainstreaming of biodiversity in their professional fields. Therefore, the
main discussion items focused on how stakeholders evaluated the importance of
biodiversity conservation in their professions and how they expected the government
would foster and help them implement biodiversity conservation measures in their
respective fields.
Centre for Communication and Public Opinion Survey, Agriculture, Fisheries and Conservation Department,
CUHK HKSAR
17
“Baseline Survey on the Attitude and Level of Knowledge of the General Public and Stakeholder Groups
Towards Biodiversity in Hong Kong” Research Report
In the “teachers” group, the discussion covered the views of secondary school
teachers on various aspects of biodiversity education. More specifically, it included
how participants evaluated the adequacy and importance of biodiversity education in
their schools, how they perceived the difficulties in undertaking biodiversity
education in schools, and how they assessed the effectiveness of biodiversity
education. Finally, they were also asked to evaluate the level of support offered by the
government for them to teach biodiversity in schools.
In the “planning and development professionals” group, participants discussed how
they perceived the importance of biodiversity conservation in their professional fields,
why and whether their professional fields have implemented biodiversity conservation
measures, and how they evaluated the government’s efforts in promoting and
supporting biodiversity conservation in their fields.
2.3.3 Format
Each focus group session comprised of seven to nine participants. Each lasted for one
to one-and-a-half hours. All focus groups were conducted in Cantonese.
At the beginning of each focus group discussion, the moderators made a brief
presentation to introduce the background of the focus group and the whole study. This
briefing could help participants better understand the objectives of the study.
Throughout the discussion, participants were encouraged to freely express their
opinions towards the selected discussion issues about the biodiversity in Hong Kong.
2.3.4 Time and Venue of the Focus Groups
The three focus groups with members of the general public were conducted in
December 2017. The two focus groups with members of the two stakeholder groups

Centre for Communication and Public Opinion Survey, Agriculture, Fisheries and Conservation Department,
CUHK HKSAR
18
“Baseline Survey on the Attitude and Level of Knowledge of the General Public and Stakeholder Groups
Towards Biodiversity in Hong Kong” Research Report
(namely teachers and planning and development professionals) were carried out in
January 2018. All focus groups were held at The Chinese University of Hong Kong.
2.3.5 Quality Assurance
CCPOS researchers served as the moderators of the focus group discussions.
Throughout the focus group discussions, participants were encouraged to freely
express their views and exchange ideas with other group members. All focus group
discussions were videotaped and audiotaped for later analysis.
2.3.6 Confidentiality of Personal Information
Focus group participants were fully informed about the need of audio and video
taping for research purposes. Participants were assured that the audio and video
recordings shall only be submitted to AFCD for its own research and archival
purposes. Besides, to ensure the anonymity of the participants, their personal
information shall not be disclosed in the research report (except for some general
demographic descriptions).
Centre for Communication and Public Opinion Survey, Agriculture, Fisheries and Conservation Department,
CUHK HKSAR
19
“Baseline Survey on the Attitude and Level of Knowledge of the General Public and Stakeholder Groups
Towards Biodiversity in Hong Kong” Research Report
2.4 Data Analysis Approach
As stated, the overarching research objective of this baseline survey is to develop a
baseline picture on the attitude and level of knowledge of the general public and
various stakeholder groups towards biodiversity in Hong Kong. To this end, the
following analyses were conducted in this study:
2.4.1 Basic Analysis of Survey Data
For the treatment of survey data, percentage analysis of each question item was
conducted to delineate the overall pattern of answers given by survey respondents. In
addition, subpopulation analysis was also performed to identify the different patterns
of answers given by different demographic groups (i.e., in terms of gender, age,
education, occupation, living district, and household income).
2.4.2 Index Construction
A major research goal of this baseline survey is to construct indexes for the purpose
of longitudinal tracking of Hong Kong people’s knowledge and attitude towards
biodiversity. In accordance with the conceptualization of the questionnaire, four
indexes were created to benchmark Hong Kong people’s knowledge level of
biodiversity and their attitude towards biodiversity conservation. Hence, the
“Knowledge Index”, “Importance Index”, “Closeness Index”, and “Willingness Index”
were constructed. Besides, subpopulation analysis was also conducted to examine the
differences of index scores among different demographic groups.
2.4.3 Focus Group Analysis
The major arguments and opinions of the focus group participants were identified and
neatly summarized to provide in-depth views of the general public and stakeholder
groups towards biodiversity conservation in Hong Kong.

Centre for Communication and Public Opinion Survey, Agriculture, Fisheries and Conservation Department,
CUHK HKSAR
20
“Baseline Survey on the Attitude and Level of Knowledge of the General Public and Stakeholder Groups
Towards Biodiversity in Hong Kong” Research Report
3 Research Findings
3.1 Telephone Survey with the General Public
3.1.1 Knowledge of Biodiversity
The first part of the survey was about Hong Kong citizens’ knowledge of biodiversity.
It contained two generic questions to gauge whether they have heard of the term
“biodiversity” and their overall subjective knowledge of biodiversity and three
specific questions to test their objective knowledge about the selected aspects of
biodiversity in Hong Kong.
3.1.1.1 Knowledge of the term “biodiversity”
First of all, respondents were asked about their knowledge of the term “biodiversity”.
More than half of respondents (53.0%) said they have never heard of the term
“biodiversity”, and 47.0% have heard of it. Among those who have heard of the term
“biodiversity”, 23.7% also knew what it meant, whereas 23.4% did not knew its
meaning.
Figure 1: Have you ever heard of the term “biodiversity”?
23.7% 23.4%
53.0%
0%
20%
40%
60%
80%
100%
Have heard of it, and know what
it meansHave heard of it, but don’t know
what it means
Have not heard of it
Centre for Communication and Public Opinion Survey, Agriculture, Fisheries and Conservation Department,
CUHK HKSAR
21
“Baseline Survey on the Attitude and Level of Knowledge of the General Public and Stakeholder Groups
Towards Biodiversity in Hong Kong” Research Report
A higher proportion of the following groups has heard of the term “biodiversity” and
knew what it meant (See Appendix 3, Table 3.1):
Males (28.0%)
Aged 15-29 (44.8%)
With tertiary education (43.5%)
Students (49.6%)
With household monthly income of HK$60,000 or above (34.2%)
Centre for Communication and Public Opinion Survey, Agriculture, Fisheries and Conservation Department,
CUHK HKSAR
22
“Baseline Survey on the Attitude and Level of Knowledge of the General Public and Stakeholder Groups
Towards Biodiversity in Hong Kong” Research Report
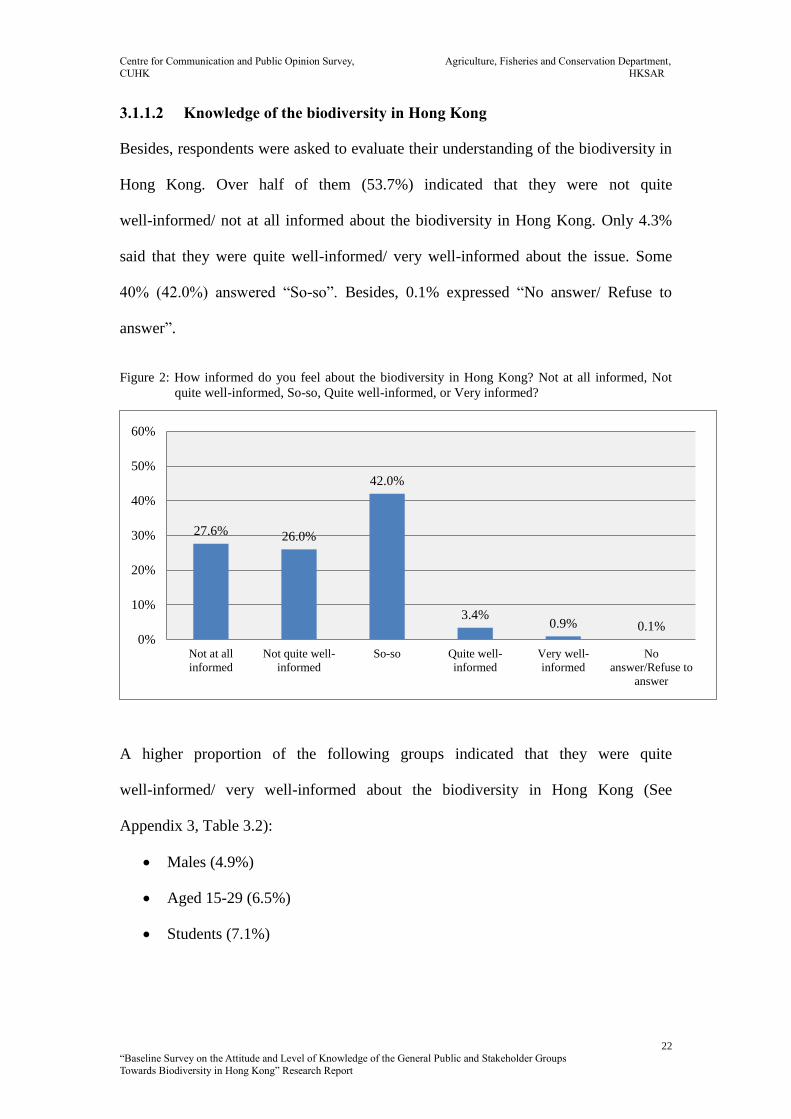
3.1.1.2 Knowledge of the biodiversity in Hong Kong
Besides, respondents were asked to evaluate their understanding of the biodiversity in
Hong Kong. Over half of them (53.7%) indicated that they were not quite
well-informed/ not at all informed about the biodiversity in Hong Kong. Only 4.3%
said that they were quite well-informed/ very well-informed about the issue. Some
40% (42.0%) answered “So-so”. Besides, 0.1% expressed “No answer/ Refuse to
answer”.
Figure 2: How informed do you feel about the biodiversity in Hong Kong? Not at all informed, Not
quite well-informed, So-so, Quite well-informed, or Very informed?
A higher proportion of the following groups indicated that they were quite
well-informed/ very well-informed about the biodiversity in Hong Kong (See
Appendix 3, Table 3.2):
Males (4.9%)
Aged 15-29 (6.5%)
Students (7.1%)
27.6% 26.0%
42.0%
3.4%0.9% 0.1%
0%
10%
20%
30%
40%
50%
60%
Not at all
informed
Not quite well-
informed
So-so Quite well-
informed
Very well-
informed
No
answer/Refuse to
answer
Centre for Communication and Public Opinion Survey, Agriculture, Fisheries and Conservation Department,
CUHK HKSAR
23
“Baseline Survey on the Attitude and Level of Knowledge of the General Public and Stakeholder Groups
Towards Biodiversity in Hong Kong” Research Report
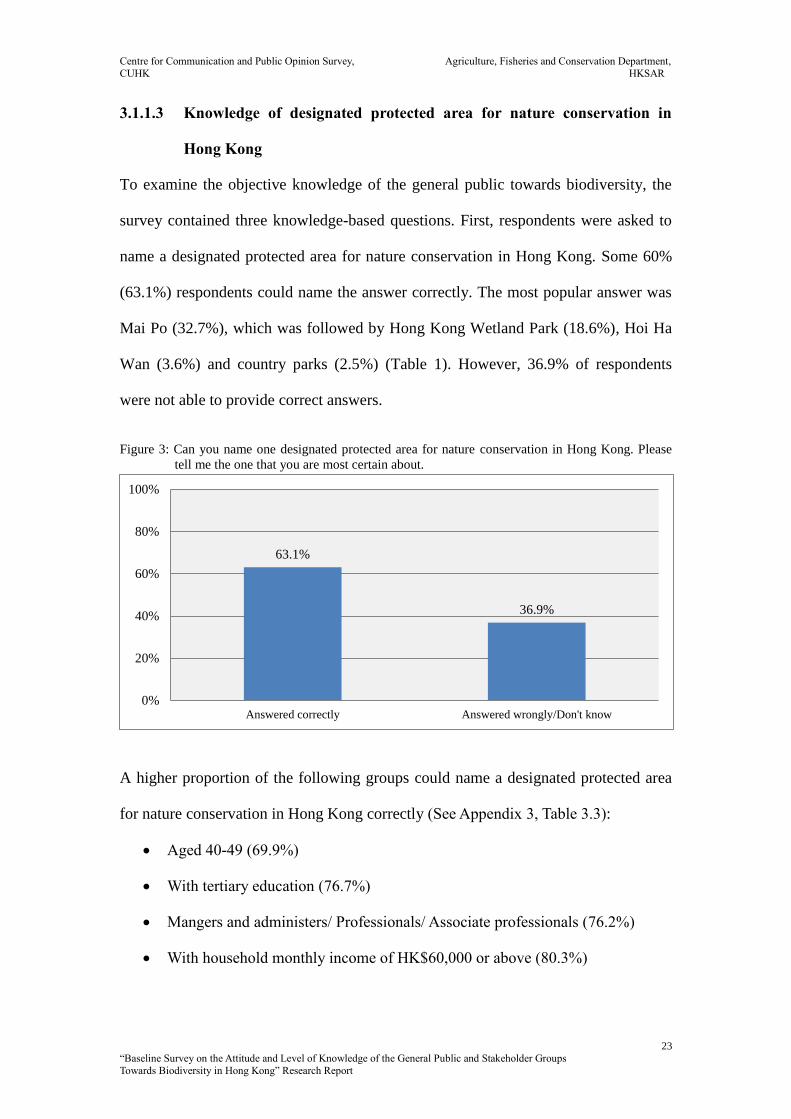
3.1.1.3 Knowledge of designated protected area for nature conservation in
Hong Kong
To examine the objective knowledge of the general public towards biodiversity, the
survey contained three knowledge-based questions. First, respondents were asked to
name a designated protected area for nature conservation in Hong Kong. Some 60%
(63.1%) respondents could name the answer correctly. The most popular answer was
Mai Po (32.7%), which was followed by Hong Kong Wetland Park (18.6%), Hoi Ha
Wan (3.6%) and country parks (2.5%) (Table 1). However, 36.9% of respondents
were not able to provide correct answers.
Figure 3: Can you name one designated protected area for nature conservation in Hong Kong. Please
tell me the one that you are most certain about.
A higher proportion of the following groups could name a designated protected area
for nature conservation in Hong Kong correctly (See Appendix 3, Table 3.3):
Aged 40-49 (69.9%)
With tertiary education (76.7%)
Mangers and administers/ Professionals/ Associate professionals (76.2%)
With household monthly income of HK$60,000 or above (80.3%)
63.1%
36.9%
0%
20%
40%
60%
80%
100%
Answered correctly Answered wrongly/Don't know
Centre for Communication and Public Opinion Survey, Agriculture, Fisheries and Conservation Department,
CUHK HKSAR
24
“Baseline Survey on the Attitude and Level of Knowledge of the General Public and Stakeholder Groups
Towards Biodiversity in Hong Kong” Research Report
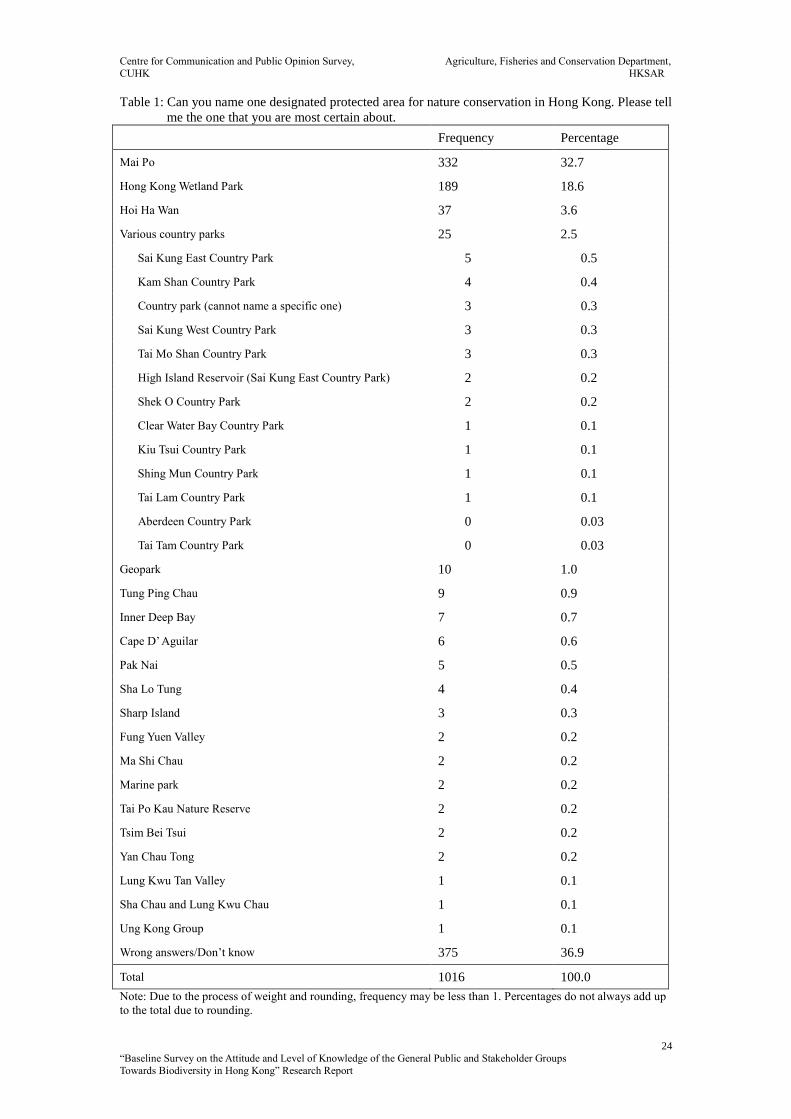
Table 1: Can you name one designated protected area for nature conservation in Hong Kong. Please tell
me the one that you are most certain about.
Frequency Percentage
Mai Po 332 32.7
Hong Kong Wetland Park 189 18.6
Hoi Ha Wan 37 3.6
Various country parks 25 2.5
Sai Kung East Country Park 5 0.5
Kam Shan Country Park 4 0.4
Country park (cannot name a specific one) 3 0.3
Sai Kung West Country Park 3 0.3
Tai Mo Shan Country Park 3 0.3
High Island Reservoir (Sai Kung East Country Park) 2 0.2
Shek O Country Park 2 0.2
Clear Water Bay Country Park 1 0.1
Kiu Tsui Country Park 1 0.1
Shing Mun Country Park 1 0.1
Tai Lam Country Park 1 0.1
Aberdeen Country Park 0 0.03
Tai Tam Country Park 0 0.03
Geopark 10 1.0
Tung Ping Chau 9 0.9
Inner Deep Bay 7 0.7
Cape D’ Aguilar 6 0.6
Pak Nai 5 0.5
Sha Lo Tung 4 0.4
Sharp Island 3 0.3
Fung Yuen Valley 2 0.2
Ma Shi Chau 2 0.2
Marine park 2 0.2
Tai Po Kau Nature Reserve 2 0.2
Tsim Bei Tsui 2 0.2
Yan Chau Tong 2 0.2
Lung Kwu Tan Valley 1 0.1
Sha Chau and Lung Kwu Chau 1 0.1
Ung Kong Group 1 0.1
Wrong answers/Don’t know 375 36.9
Total 1016 100.0
Note: Due to the process of weight and rounding, frequency may be less than 1. Percentages do not always add up
to the total due to rounding.

Centre for Communication and Public Opinion Survey, Agriculture, Fisheries and Conservation Department,
CUHK HKSAR
25
“Baseline Survey on the Attitude and Level of Knowledge of the General Public and Stakeholder Groups
Towards Biodiversity in Hong Kong” Research Report
3.1.1.4 Knowledge of the land area of country parks and special areas in Hong
Kong
The second knowledge-based question asked whether the respondents know the area
percentage of country parks and special areas in Hong Kong. An overwhelming
majority (84.6%) of respondents either got the wrong answers or could not provide
any answers. Only 15.4% got the answer correct that there is about 40% of Hong
Kong’s land being designated as country parks and special areas.
Figure 4: Do you know how much of Hong Kong’s land area is designated as country parks and special
areas? About 20%, 30%, 40%, 50%, or Don’t know?
A higher proportion of the following groups got the answer correct that there is about
40% of Hong Kong’s land being designated as country parks and special areas (See
Appendix 3, Table 3.4):
Aged 15-29 (20.7%)
With tertiary education (22.6%)
Students (28.0%)
Residents in New Territories West (20.0%)
With household monthly income of HK$60,000 or above (20.1%)
11.5% 13.4%15.4%
11.4%
48.3%
0%
10%
20%
30%
40%
50%
60%
About 20% About 30% About 40%
(Correct answer)
About 50% Don't know
Centre for Communication and Public Opinion Survey, Agriculture, Fisheries and Conservation Department,
CUHK HKSAR
26
“Baseline Survey on the Attitude and Level of Knowledge of the General Public and Stakeholder Groups
Towards Biodiversity in Hong Kong” Research Report
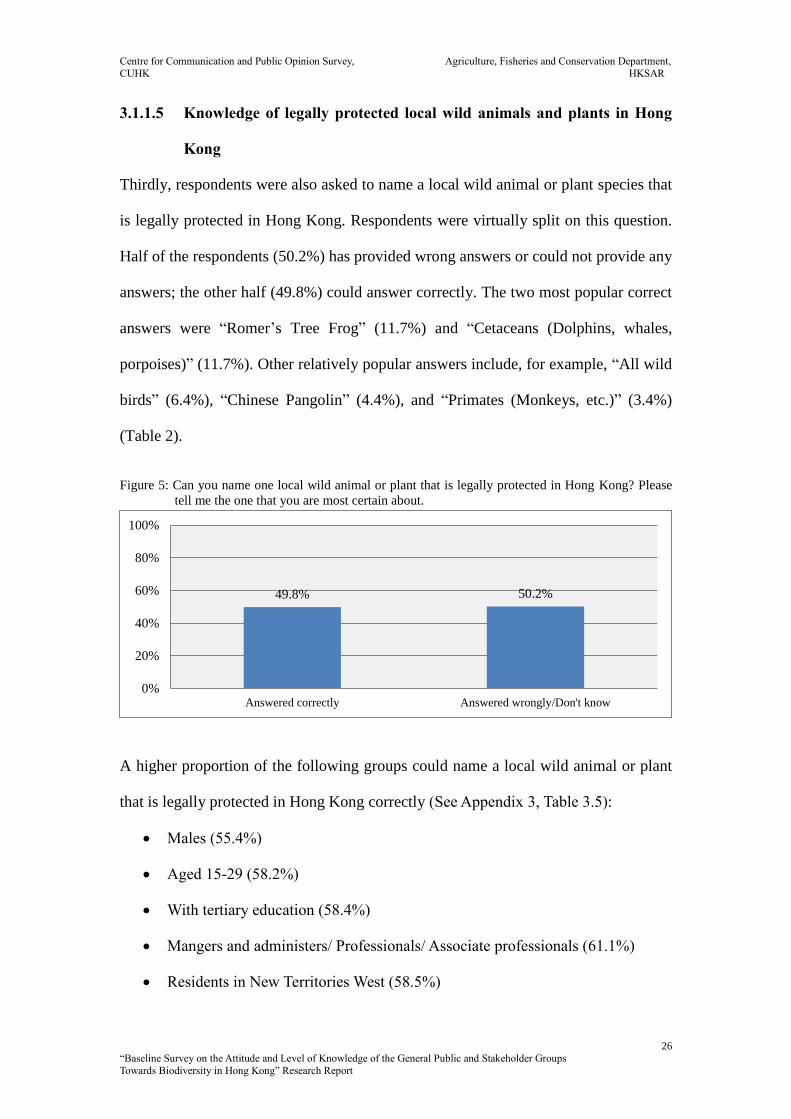
3.1.1.5 Knowledge of legally protected local wild animals and plants in Hong
Kong
Thirdly, respondents were also asked to name a local wild animal or plant species that
is legally protected in Hong Kong. Respondents were virtually split on this question.
Half of the respondents (50.2%) has provided wrong answers or could not provide any
answers; the other half (49.8%) could answer correctly. The two most popular correct
answers were “Romer’s Tree Frog” (11.7%) and “Cetaceans (Dolphins, whales,
porpoises)” (11.7%). Other relatively popular answers include, for example, “All wild
birds” (6.4%), “Chinese Pangolin” (4.4%), and “Primates (Monkeys, etc.)” (3.4%)
(Table 2).
Figure 5: Can you name one local wild animal or plant that is legally protected in Hong Kong? Please
tell me the one that you are most certain about.
A higher proportion of the following groups could name a local wild animal or plant
that is legally protected in Hong Kong correctly (See Appendix 3, Table 3.5):
Males (55.4%)
Aged 15-29 (58.2%)
With tertiary education (58.4%)
Mangers and administers/ Professionals/ Associate professionals (61.1%)
Residents in New Territories West (58.5%)
49.8% 50.2%
0%
20%
40%
60%
80%
100%
Answered correctly Answered wrongly/Don't know
Centre for Communication and Public Opinion Survey, Agriculture, Fisheries and Conservation Department,
CUHK HKSAR
27
“Baseline Survey on the Attitude and Level of Knowledge of the General Public and Stakeholder Groups
Towards Biodiversity in Hong Kong” Research Report
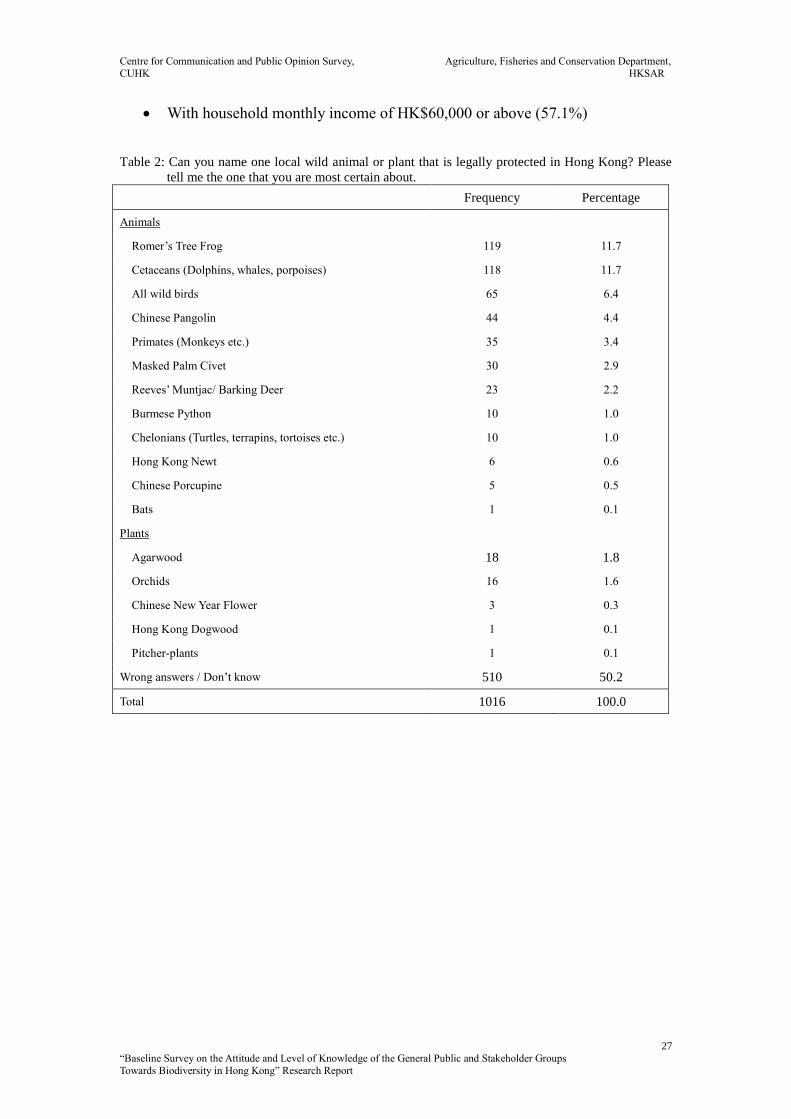
With household monthly income of HK$60,000 or above (57.1%)
Table 2: Can you name one local wild animal or plant that is legally protected in Hong Kong? Please
tell me the one that you are most certain about.
Frequency Percentage
Animals
Romer’s Tree Frog 119 11.7
Cetaceans (Dolphins, whales, porpoises) 118 11.7
All wild birds 65 6.4
Chinese Pangolin 44 4.4
Primates (Monkeys etc.) 35 3.4
Masked Palm Civet 30 2.9
Reeves’ Muntjac/ Barking Deer 23 2.2
Burmese Python 10 1.0
Chelonians (Turtles, terrapins, tortoises etc.) 10 1.0
Hong Kong Newt 6 0.6
Chinese Porcupine 5 0.5
Bats 1 0.1
Plants
Agarwood 18 1.8
Orchids 16 1.6
Chinese New Year Flower 3 0.3
Hong Kong Dogwood 1 0.1
Pitcher-plants 1 0.1
Wrong answers / Don’t know 510 50.2
Total 1016 100.0
Centre for Communication and Public Opinion Survey, Agriculture, Fisheries and Conservation Department,
CUHK HKSAR
28
“Baseline Survey on the Attitude and Level of Knowledge of the General Public and Stakeholder Groups
Towards Biodiversity in Hong Kong” Research Report
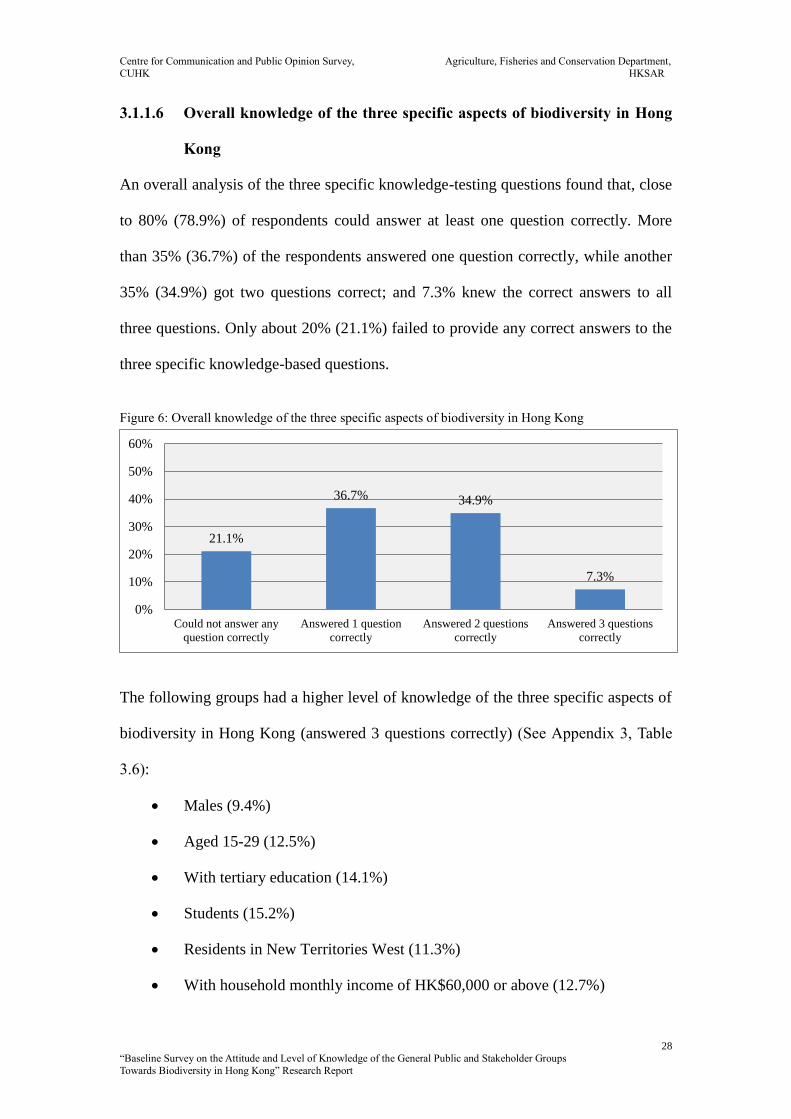
3.1.1.6 Overall knowledge of the three specific aspects of biodiversity in Hong
Kong
An overall analysis of the three specific knowledge-testing questions found that, close
to 80% (78.9%) of respondents could answer at least one question correctly. More
than 35% (36.7%) of the respondents answered one question correctly, while another
35% (34.9%) got two questions correct; and 7.3% knew the correct answers to all
three questions. Only about 20% (21.1%) failed to provide any correct answers to the
three specific knowledge-based questions.
Figure 6: Overall knowledge of the three specific aspects of biodiversity in Hong Kong
The following groups had a higher level of knowledge of the three specific aspects of
biodiversity in Hong Kong (answered 3 questions correctly) (See Appendix 3, Table
3.6):
Males (9.4%)
Aged 15-29 (12.5%)
With tertiary education (14.1%)
Students (15.2%)
Residents in New Territories West (11.3%)
With household monthly income of HK$60,000 or above (12.7%)
21.1%
36.7% 34.9%
7.3%
0%
10%
20%
30%
40%
50%
60%
Could not answer any
question correctly
Answered 1 question
correctly
Answered 2 questions
correctly
Answered 3 questions
correctly
Centre for Communication and Public Opinion Survey, Agriculture, Fisheries and Conservation Department,
CUHK HKSAR
29
“Baseline Survey on the Attitude and Level of Knowledge of the General Public and Stakeholder Groups
Towards Biodiversity in Hong Kong” Research Report
3.1.2 Importance of Preserving Biodiversity
The second part of the survey consisted of seven questions to examine Hong Kong
citizens’ perceived importance of biodiversity preservation.
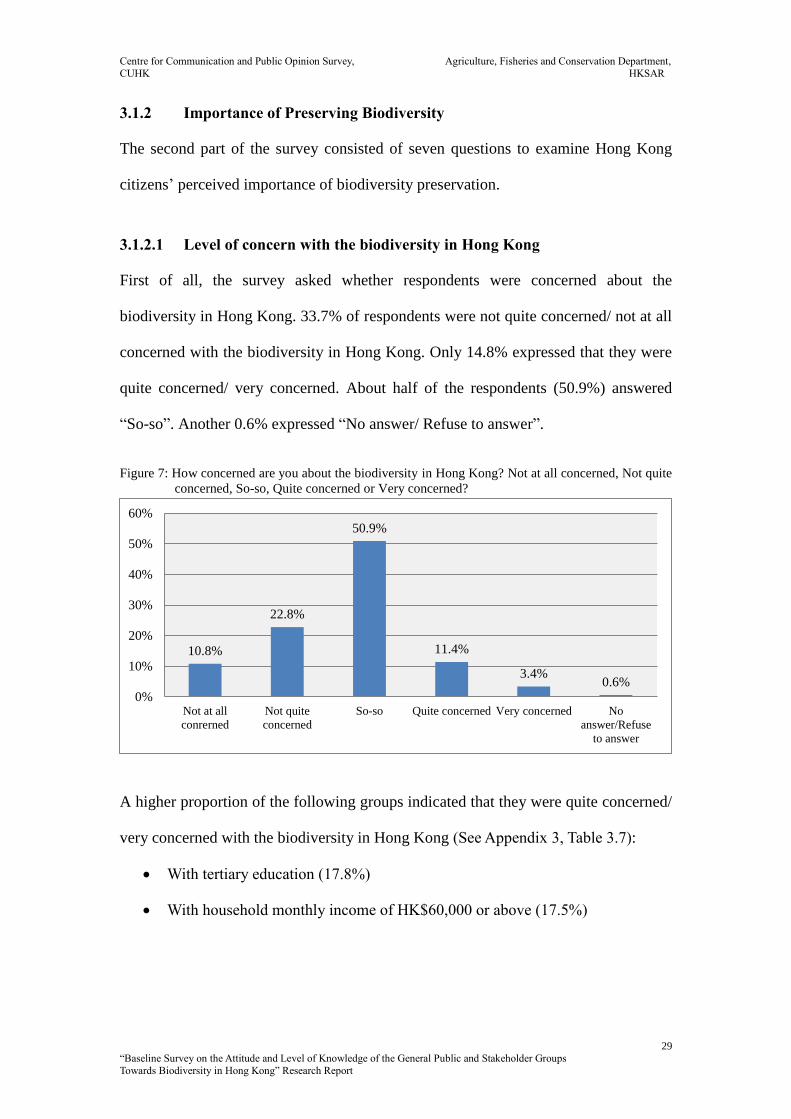
3.1.2.1 Level of concern with the biodiversity in Hong Kong
First of all, the survey asked whether respondents were concerned about the
biodiversity in Hong Kong. 33.7% of respondents were not quite concerned/ not at all
concerned with the biodiversity in Hong Kong. Only 14.8% expressed that they were
quite concerned/ very concerned. About half of the respondents (50.9%) answered
“So-so”. Another 0.6% expressed “No answer/ Refuse to answer”.
Figure 7: How concerned are you about the biodiversity in Hong Kong? Not at all concerned, Not quite
concerned, So-so, Quite concerned or Very concerned?
A higher proportion of the following groups indicated that they were quite concerned/
very concerned with the biodiversity in Hong Kong (See Appendix 3, Table 3.7):
With tertiary education (17.8%)
With household monthly income of HK$60,000 or above (17.5%)
10.8%
22.8%
50.9%
11.4%
3.4%0.6%
0%
10%
20%
30%
40%
50%
60%
Not at all
conrerned
Not quite
concerned
So-so Quite concerned Very concerned No
answer/Refuse
to answer
Centre for Communication and Public Opinion Survey, Agriculture, Fisheries and Conservation Department,
CUHK HKSAR
30
“Baseline Survey on the Attitude and Level of Knowledge of the General Public and Stakeholder Groups
Towards Biodiversity in Hong Kong” Research Report
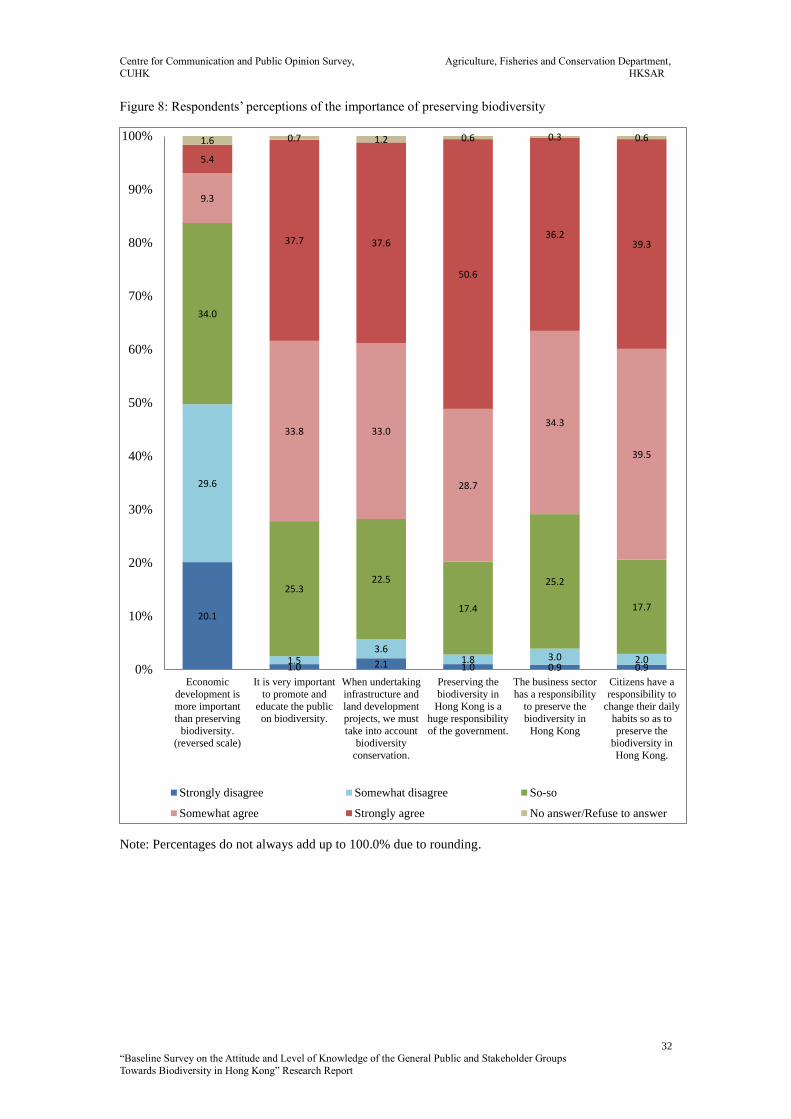
3.1.2.2 Perceptions of the importance of preserving biodiversity
Then, respondents were asked to evaluate six statements related to the importance of
biodiversity conservation.
When being asked whether economic development would be more important than
preserving biodiversity, nearly half of the respondents (49.7%) somewhat disagreed/
strongly disagreed with this notion. Only 14.8% prioritized economic development
over biodiversity conservation (somewhat agreed/ strongly agreed). Some 30%
(34.0%) answered “So-so”, and the remaining 1.6% expressed “No answer/ Refuse to
answer”.
With regard to the importance of public promotion and education on biodiversity, over
70% (71.6%) of respondents somewhat agreed/ strongly agreed that it was very
important; only 2.5% suggested that it was not very important (somewhat disagreed/
strongly disagreed). Some 20% (25.3%) claimed “So-so”, and 0.7% expressed “No
answer/ Refuse to answer”.
Similarly, about 70% (70.6%) of respondents also considered that biodiversity
conservation must be taken into account when undertaking infrastructure and land
development projects (somewhat agreed/ strongly agreed). Only 5.7% somewhat
disagreed/ strongly disagreed with it. More than 20% (22.5%) answered “So-so”.
Another 1.2% indicated “No answer/ Refuse to answer”.
The following three questions examined how Hong Kong citizens attributed the
responsibility of preserving biodiversity to different parties in the society, namely the
government, the business sector, and citizens themselves.
Centre for Communication and Public Opinion Survey, Agriculture, Fisheries and Conservation Department,
CUHK HKSAR
31
“Baseline Survey on the Attitude and Level of Knowledge of the General Public and Stakeholder Groups
Towards Biodiversity in Hong Kong” Research Report
The findings showed that a large portion of Hong Kong citizens thought that all three
parties should be responsible in one way or another: Close to 80% (79.3%) of
respondents thought that the government had a huge responsibility to preserve the
biodiversity in Hong Kong (somewhat agreed/ strongly agreed). Only 2.7% did not
think that the government had such responsibility (somewhat disagreed/ strongly
disagreed). 17.4% answered “So-so”. Another 0.6% indicated “No answer/ Refuse to
answer”.
About 70.6% somewhat agreed/ strongly agreed that the business sector had a
responsibility to preserve the biodiversity in Hong Kong. Less than 4% (3.9%) did not
think so (somewhat disagreed/ strongly disagreed). Some 20% (25.2%) answered
“So-so”. The remaining 0.3% expressed “No answer/ Refuse to answer”.
Finally, with regard to the responsibility of the citizens, close to 80% (78.8%) of
respondents claimed that citizens had a responsibility to change their daily habits so
as to preserve the biodiversity in Hong Kong (somewhat agreed/ strongly agreed).
Only 2.9% did not think the citizens have such a responsibility (somewhat disagreed/
strongly disagreed). 17.7% considered “So-so”. Another 0.6% suggested “No answer/
Refuse to answer”.
Centre for Communication and Public Opinion Survey, Agriculture, Fisheries and Conservation Department,
CUHK HKSAR
32
“Baseline Survey on the Attitude and Level of Knowledge of the General Public and Stakeholder Groups
Towards Biodiversity in Hong Kong” Research Report
Figure 8: Respondents’ perceptions of the importance of preserving biodiversity
Note: Percentages do not always add up to 100.0% due to rounding.
20.1
1.0 2.1 1.0 0.9 0.9
29.6
1.53.6
1.8 3.0 2.0
34.0
25.322.5
17.4
25.2
17.7
9.3
33.8 33.0
28.7
34.3
39.5
5.4
37.7 37.6
50.6
36.239.3
1.6 0.7 1.2 0.6 0.3 0.6
0%
10%
20%
30%
40%
50%
60%
70%
80%
90%
100%
Economic
development is
more important
than preserving
biodiversity.
(reversed scale)
It is very important
to promote and
educate the public
on biodiversity.
When undertaking
infrastructure and
land development
projects, we must
take into account
biodiversity
conservation.
Preserving the
biodiversity in
Hong Kong is a
huge responsibility
of the government.
The business sector
has a responsibility
to preserve the
biodiversity in
Hong Kong
Citizens have a
responsibility to
change their daily
habits so as to
preserve the
biodiversity in
Hong Kong.
Strongly disagree Somewhat disagree So-so
Somewhat agree Strongly agree No answer/Refuse to answer

Centre for Communication and Public Opinion Survey, Agriculture, Fisheries and Conservation Department,
CUHK HKSAR
33
“Baseline Survey on the Attitude and Level of Knowledge of the General Public and Stakeholder Groups
Towards Biodiversity in Hong Kong” Research Report
The following groups attached more importance to preserving the biodiversity in
Hong Kong (answered “somewhat agreed” or “strongly agreed”)3:
Importance Items Demographic groups
Economic development is
more important than
preserving biodiversity.
(Reversed scale)
(See Appendix 3, Table 3.8)
Aged 15-29 (66.8%)
With tertiary education (63.8%)
Students (70.7%)
With household monthly income of
HK$40,000-$59,999 (59.9%)
It is very important to
promote and educate the
public on biodiversity.
(See Appendix 3, Table 3.9)
Aged 15-29 (85.1%)
With tertiary education (82.2%)
Students (89.0%)
With household monthly income of
HK$40,000-$59,999 (78.3%)
When undertaking
infrastructure and land
development projects, we
must take into account
biodiversity conservation.
(See Appendix 3, Table 3.10)
Females (73.3%)
Aged 15-29 (85.2%)
With tertiary education (79.2%)
Students (84.9%)
With household monthly income of
HK$60,000 or above (74.4%)
Preserving the biodiversity in
Hong Kong is a huge
responsibility of the
government.
(See Appendix 3, Table 3.11)
Aged 15-29 (87.8%)
With tertiary education (88.5%)
Residents in Kowloon West (85.5%)
With household monthly income of
HK$60,000 or above (84.2%)
The business sector has a
responsibility to preserve the
biodiversity in Hong Kong.
(See Appendix 3, Table 3.12)
Females (74.5%)
3 Except for the first statement “Economic development is more important than preserving biodiversity.” It uses a
reversed scale and the percentages in the “demographic groups” column indicate the number of respondents who
answered “somewhat disagreed” or “strongly disagreed” to the question.

Centre for Communication and Public Opinion Survey, Agriculture, Fisheries and Conservation Department,
CUHK HKSAR
34
“Baseline Survey on the Attitude and Level of Knowledge of the General Public and Stakeholder Groups
Towards Biodiversity in Hong Kong” Research Report
The following groups attached more importance to preserving the biodiversity in
Hong Kong (answered “somewhat agreed” or “strongly agreed”) (Continued):
Importance Items Demographic groups
Citizens have a responsibility
to change their daily habits
so as to preserve the
biodiversity in Hong Kong.
(See Appendix 3, Table 3.13)
Females (84.5%)
Aged 15-29 (84.3%)
With tertiary education (85.4%)
With household monthly income of
HK$60,000 or above (86.7%)
Centre for Communication and Public Opinion Survey, Agriculture, Fisheries and Conservation Department,
CUHK HKSAR
35
“Baseline Survey on the Attitude and Level of Knowledge of the General Public and Stakeholder Groups
Towards Biodiversity in Hong Kong” Research Report
3.1.3 Closeness to Biodiversity
The third part of the survey gauged Hong Kong citizens’ evaluation of the
relationship between biodiversity and the society. It contained six questions to
examine how they thought biodiversity (or lack thereof) would impact the society at
large.
An overwhelming majority of respondents (80.8%) opined that biodiversity must be
preserved for future generations (somewhat agreed/ strongly agreed). Only 2.4%
suggested the otherwise (somewhat disagreed/ strongly disagreed). 15.9% answered
“So-so”, and 0.9% expressed “No answer/ Refuse to answer”.
Some 60% (64.9%) of respondents thought that preserving biodiversity could enrich
the leisure life of citizens (somewhat agreed/ strongly agreed). On the other hand,
4.6% considered the otherwise (somewhat disagreed/ strongly disagreed). 30.0% of
respondents answered “So-so”, and 0.5% indicated “No answer/ Refuse to answer”.
Over half of the respondents (56.9%) somewhat agreed/ strongly agreed that the loss
of biodiversity would affect citizens’ living environment. On the other hand, 13.4%
somewhat disagreed/ strongly disagreed with this notion. Besides, 29.2% answered
“So-so”. Another 0.5% expressed “No answer/ Refuse to answer”.
Close to half of the respondents (48.4%) suggested that the loss of biodiversity would
affect citizens’ health (somewhat agreed/ strongly agreed). 16.1% somewhat
disagreed/ strongly disagreed that people’s health would be affected by the loss of
biodiversity. Some 30% (34.7%) of respondents said “So-so”, and 0.9% indicated
“No answer/ Refuse to answer”.

Centre for Communication and Public Opinion Survey, Agriculture, Fisheries and Conservation Department,
CUHK HKSAR
36
“Baseline Survey on the Attitude and Level of Knowledge of the General Public and Stakeholder Groups
Towards Biodiversity in Hong Kong” Research Report
Similarly, close to half of the respondents (47.8%) somewhat agreed/ strongly agreed
that the loss of biodiversity would lead to a decrease in food and product choices for
citizens. On the other hand, 18.0% somewhat disagreed/ strongly disagreed with this
notion. About one-third of respondents (32.8%) answered “So-so”, and 1.4% said “No
answer/ Refuse to answer”.
Finally, about 40% (40.8%) of respondents indicated that biodiversity conservation
could bring economic gains to Hong Kong (somewhat agreed/ strongly agreed).
However, 12.3% did not think that biodiversity preservation could bring any
economic benefits (somewhat disagreed/ strongly disagreed). Besides, some 40%
(45.2%) of respondents answered “So-so” to the question. Another 1.6% indicated
“No answer/ Refuse to answer”.

Centre for Communication and Public Opinion Survey, Agriculture, Fisheries and Conservation Department,
CUHK HKSAR
37
“Baseline Survey on the Attitude and Level of Knowledge of the General Public and Stakeholder Groups
Towards Biodiversity in Hong Kong” Research Report
Figure 9: Respondents’ perceptions of the closeness of biodiversity to the society
Note: Percentages do not always add up to 100.0% due to rounding.
5.4 4.4 3.51.1 2.9 0.8
12.611.6
9.9
3.6
9.4
1.7
32.8 34.7
29.2
30.0
45.2
15.9
26.6 27.4
31.5
34.7
27.6
30.5
21.2 20.925.4
30.2
13.3
50.3
1.4 0.9 0.5 0.5 1.6 0.9
0%
10%
20%
30%
40%
50%
60%
70%
80%
90%
100%
The loss of
biodiversity will
lead to a decrease
in food and product
choices for citizens
The loss of
biodiversity will
affect citizens'
health
The loss of
biodiversity will
affect citizens'
living environment
Preserving
biodiversity can
enrich the leisure
life of citizens.
Preserving
biodiversity can
bring economic
gains to Hong
Kong
We must preserve
biodiversity for the
future generations
Strongly disagree Somewhat disagree So-so
Somewhat agree Strongly agree No answer/Refuse to answer

Centre for Communication and Public Opinion Survey, Agriculture, Fisheries and Conservation Department,
CUHK HKSAR
38
“Baseline Survey on the Attitude and Level of Knowledge of the General Public and Stakeholder Groups
Towards Biodiversity in Hong Kong” Research Report
The following groups perceived a significantly higher level of closeness of
biodiversity to the society (answered “somewhat agreed” or “strongly agreed”):
Closeness Items Demographic groups
The loss of biodiversity will
lead to a decrease in food and
product choices for citizens.
(See Appendix 3, Table 3.14)
Females (50.3%)
With senior secondary education (Form 4-7)
(49.0%)
Mangers and administers/ Professionals/
Associate professionals (50.6%)
Residents of Hong Kong Island (53.3%)
The loss of biodiversity will
affect citizens’ health.
(See Appendix 3, Table 3.15)
Females (50.8%)
Aged 40-49 (53.2%)
The loss of biodiversity will
affect citizens’ living
environment.
(See Appendix 3, Table 3.16)
Females (62.6%)
Aged 40-49 (62.1%)
With tertiary education (65.1%)
Preserving biodiversity can
enrich the leisure life of
citizens.
(See Appendix 3, Table 3.17)
Aged 30-39 (66.6%)
With tertiary education (72.5%)
Mangers and administers/ Professionals/
Associate professionals (74.7%)
Preserving biodiversity can
bring economic gains to
Hong Kong.
(See Appendix 3, Table 3.18)
Aged 30-39 (47.1%)
With junior secondary education (Form 3) or
below (44.9%)
Mangers and administers/ Professionals/
Associate professionals (47.7%)
We must preserve
biodiversity for the future
generations.
(See Appendix 3, Table 3.19)
Aged 15-29 (89.8%)
With tertiary education (87.9%)
Students (89.8%)
With household monthly income of
HK$60,000 or above (85.3%)
Centre for Communication and Public Opinion Survey, Agriculture, Fisheries and Conservation Department,
CUHK HKSAR
39
“Baseline Survey on the Attitude and Level of Knowledge of the General Public and Stakeholder Groups
Towards Biodiversity in Hong Kong” Research Report
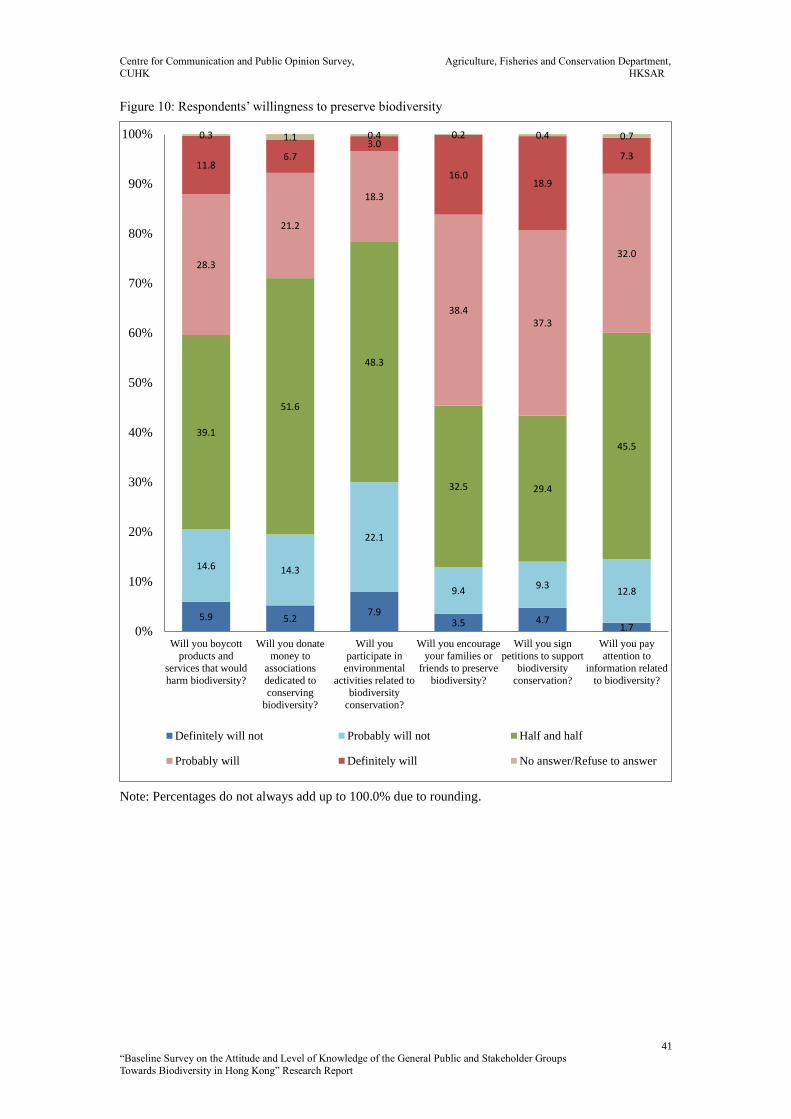
3.1.4 Willingness to Preserve Biodiversity
Finally, the survey examined the willingness of Hong Kong citizens to preserve
biodiversity. Respondents were asked to indicate their willingness to engage in a
range of activities related to biodiversity conservation.
The results demonstrated that Hong Kong citizens were most willing to sign petitions
to support biodiversity conservation. Over half of the respondents expressed that they
probably would/ definitely would do so (56.2%), whereas only 14.0% were not
willing to sign petitions (probably would not/ definitely would not). Close to 30%
(29.4%) of respondents indicated “Half and half”. Another 0.4% expressed “No
answer/ Refuse to answer”.
Also more than 50% (54.4%) of respondents indicated their willingness to encourage
families and friends to preserve biodiversity (probably would/ definitely would). The
percentage of respondents who did not intend to take this action was 12.9% (probably
would not/ definitely would not). More than 30% (32.5%) answered “Half and half”.
The remaining 0.2% indicated “No answer/ Refuse to answer”.
About 40% (40.1%) of respondents probably would/ definitely would boycott
products and services that would harm biodiversity, while about 20% (20.5%) said
they probably would not/ definitely would not do so. Besides, close to 40% (39.1%)
of respondents indicated “Half and half”, and the remaining 0.3% expressed “No
answer/ Refuse to answer”.
Similarly, about 40% (39.3%) of respondents probably would/ definitely would pay
attention to information related to biodiversity, but about 15% (14.6%) was not
willing to do so (probably would not/ definitely would not). And some 40% (45.5%)
Centre for Communication and Public Opinion Survey, Agriculture, Fisheries and Conservation Department,
CUHK HKSAR
40
“Baseline Survey on the Attitude and Level of Knowledge of the General Public and Stakeholder Groups
Towards Biodiversity in Hong Kong” Research Report
answered “Half and half”. Another 0.7% expressed “No answer/ Refuse to answer”.
Less than 30% (27.8%) of respondents probably would/ definitely would donate
money to associations dedicated to conserving biodiversity. On the other hand, close
to 20% (19.5%) of respondents were not willing to make such donation (probably
would not/ definitely would not). Besides, over half of the respondents (51.6%)
indicated “Half and half”, while 1.1% expressed “No answer/ Refuse to answer”.
The action that Hong Kong citizens were least willing to do was to participate in
environmental activities related to biodiversity conservation. Barely over 20% of
respondents probably would/ definitely would do so (21.3%). It is noteworthy that
unlike all other actions, the size of respondents not willing to take this action
(probably would not/ definitely would not: 30.0%) outweighed that of the willing
ones. Besides, close to half of respondents (48.3%) expressed “Half and half”.
Another 0.4% indicated “No answer/ Refuse to answer”.
Centre for Communication and Public Opinion Survey, Agriculture, Fisheries and Conservation Department,
CUHK HKSAR
41
“Baseline Survey on the Attitude and Level of Knowledge of the General Public and Stakeholder Groups
Towards Biodiversity in Hong Kong” Research Report
Figure 10: Respondents’ willingness to preserve biodiversity
Note: Percentages do not always add up to 100.0% due to rounding.
5.9 5.27.9
3.5 4.71.7
14.6 14.3
22.1
9.49.3
12.8
39.1
51.6
48.3
32.5 29.4
45.5
28.3
21.2
18.3
38.437.3
32.0
11.86.7
3.0
16.018.9
7.3
0.3 1.1 0.4 0.2 0.4 0.7
0%
10%
20%
30%
40%
50%
60%
70%
80%
90%
100%
Will you boycott
products and
services that would
harm biodiversity?
Will you donate
money to
associations
dedicated to
conserving
biodiversity?
Will you
participate in
environmental
activities related to
biodiversity
conservation?
Will you encourage
your families or
friends to preserve
biodiversity?
Will you sign
petitions to support
biodiversity
conservation?
Will you pay
attention to
information related
to biodiversity?
Definitely will not Probably will not Half and half
Probably will Definitely will No answer/Refuse to answer
Centre for Communication and Public Opinion Survey, Agriculture, Fisheries and Conservation Department,
CUHK HKSAR
42
“Baseline Survey on the Attitude and Level of Knowledge of the General Public and Stakeholder Groups
Towards Biodiversity in Hong Kong” Research Report
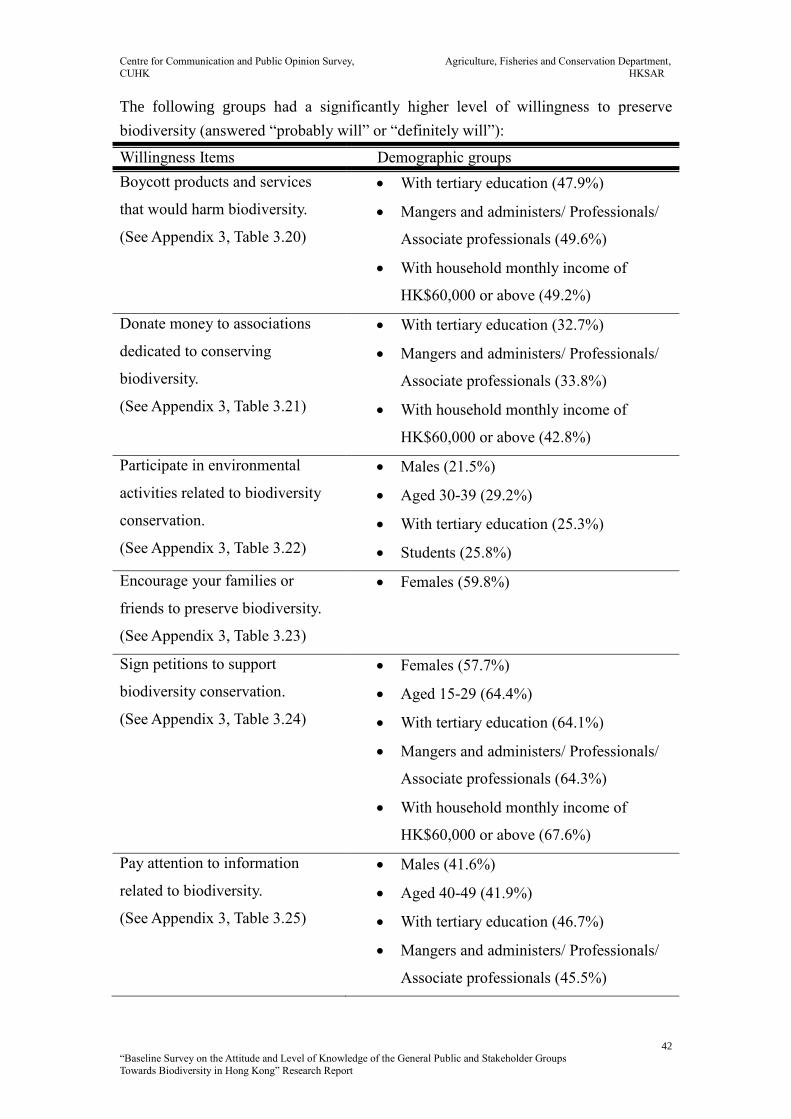
The following groups had a significantly higher level of willingness to preserve
biodiversity (answered “probably will” or “definitely will”):
Willingness Items Demographic groups
Boycott products and services
that would harm biodiversity.
(See Appendix 3, Table 3.20)
With tertiary education (47.9%)
Mangers and administers/ Professionals/
Associate professionals (49.6%)
With household monthly income of
HK$60,000 or above (49.2%)
Donate money to associations
dedicated to conserving
biodiversity.
(See Appendix 3, Table 3.21)
With tertiary education (32.7%)
Mangers and administers/ Professionals/
Associate professionals (33.8%)
With household monthly income of
HK$60,000 or above (42.8%)
Participate in environmental
activities related to biodiversity
conservation.
(See Appendix 3, Table 3.22)
Males (21.5%)
Aged 30-39 (29.2%)
With tertiary education (25.3%)
Students (25.8%)
Encourage your families or
friends to preserve biodiversity.
(See Appendix 3, Table 3.23)
Females (59.8%)
Sign petitions to support
biodiversity conservation.
(See Appendix 3, Table 3.24)
Females (57.7%)
Aged 15-29 (64.4%)
With tertiary education (64.1%)
Mangers and administers/ Professionals/
Associate professionals (64.3%)
With household monthly income of
HK$60,000 or above (67.6%)
Pay attention to information
related to biodiversity.
(See Appendix 3, Table 3.25)
Males (41.6%)
Aged 40-49 (41.9%)
With tertiary education (46.7%)
Mangers and administers/ Professionals/
Associate professionals (45.5%)
Centre for Communication and Public Opinion Survey, Agriculture, Fisheries and Conservation Department,
CUHK HKSAR
43
“Baseline Survey on the Attitude and Level of Knowledge of the General Public and Stakeholder Groups
Towards Biodiversity in Hong Kong” Research Report
3.1.5 Overall Biodiversity Indexes
As stated, one of the major objectives of this baseline study was to develop a survey
evaluation tool for longitudinal tracking of the awareness and knowledge of the
general public towards biodiversity in Hong Kong. To this end, four biodiversity
indexes – the “Knowledge Index”, the “Importance Index”, the “Closeness Index” and
the “Willingness Index” – were constructed to benchmark Hong Kong citizens’
knowledge and attitude towards biodiversity.
3.1.5.1 “Knowledge Index”
For the “Knowledge Index”, two generic knowledge questions served as the indicator
of the general public’s subjective knowledge level of biodiversity. The index was
conceptualized in the following way: if the respondents have heard of the term
“biodiversity” and knew what it meant (Q1) and that they were quite well-informed/
very well-informed about the biodiversity in Hong Kong (Q2), they were regarded as
knowledgeable about biodiversity (as they were familiar with both the concept of
biodiversity and the biodiversity in Hong Kong). The percentage of these respondents
was counted as the “Knowledge index”. Hence, the index is represented by a
percentage number.
The analysis showed that the value of the “Knowledge Index” is 2.4. It means only
2.4% of respondents in the telephone survey have heard of the term “biodiversity” and
knew its meaning, and that they also perceived themselves as being well-informed
about the biodiversity in Hong Kong. The following groups of Hong Kong citizens
had higher scores in the “Knowledge Index” (See Appendix 3, Table 3.26):
With tertiary education (4.7%)
Students (7.1%)
Centre for Communication and Public Opinion Survey, Agriculture, Fisheries and Conservation Department,
CUHK HKSAR
44
“Baseline Survey on the Attitude and Level of Knowledge of the General Public and Stakeholder Groups
Towards Biodiversity in Hong Kong” Research Report
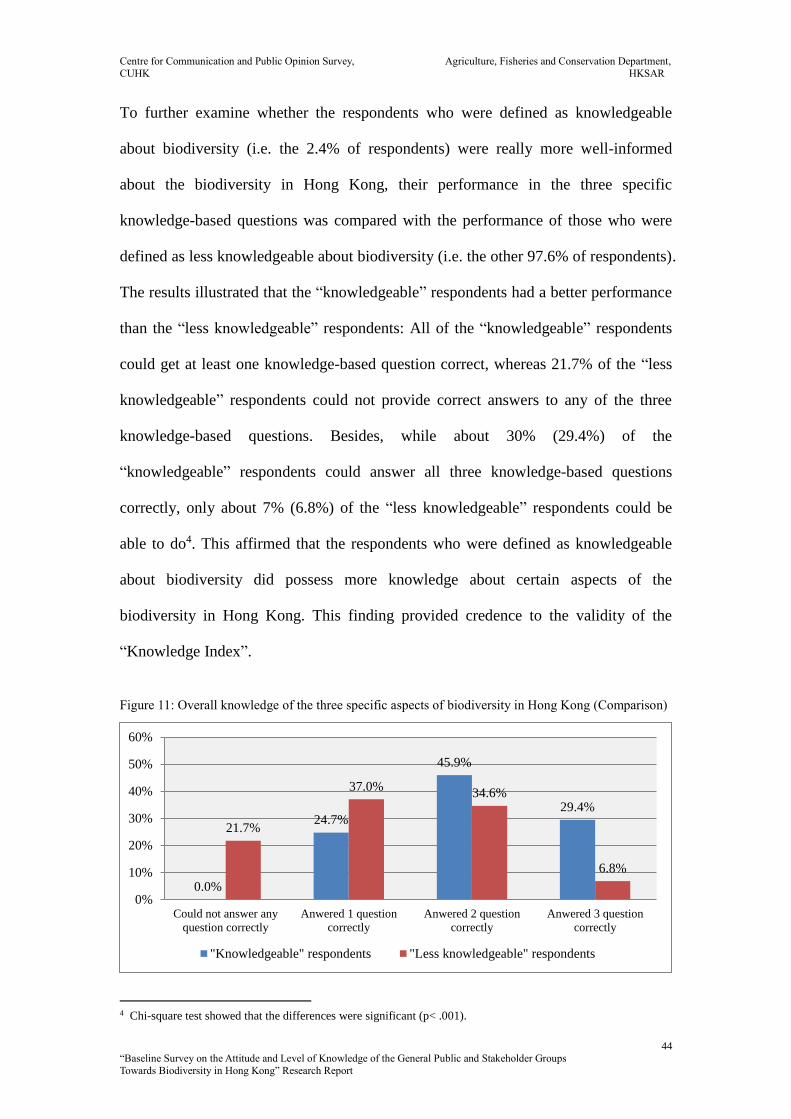
To further examine whether the respondents who were defined as knowledgeable
about biodiversity (i.e. the 2.4% of respondents) were really more well-informed
about the biodiversity in Hong Kong, their performance in the three specific
knowledge-based questions was compared with the performance of those who were
defined as less knowledgeable about biodiversity (i.e. the other 97.6% of respondents).
The results illustrated that the “knowledgeable” respondents had a better performance
than the “less knowledgeable” respondents: All of the “knowledgeable” respondents
could get at least one knowledge-based question correct, whereas 21.7% of the “less
knowledgeable” respondents could not provide correct answers to any of the three
knowledge-based questions. Besides, while about 30% (29.4%) of the
“knowledgeable” respondents could answer all three knowledge-based questions
correctly, only about 7% (6.8%) of the “less knowledgeable” respondents could be
able to do4. This affirmed that the respondents who were defined as knowledgeable
about biodiversity did possess more knowledge about certain aspects of the
biodiversity in Hong Kong. This finding provided credence to the validity of the
“Knowledge Index”.
Figure 11: Overall knowledge of the three specific aspects of biodiversity in Hong Kong (Comparison)
4 Chi-square test showed that the differences were significant (p< .001).
0.0%
24.7%
45.9%
29.4%
21.7%
37.0%34.6%
6.8%
0%
10%
20%
30%
40%
50%
60%
Could not answer any
question correctly
Anwered 1 question
correctly
Anwered 2 question
correctly
Anwered 3 question
correctly
"Knowledgeable" respondents "Less knowledgeable" respondents

Centre for Communication and Public Opinion Survey, Agriculture, Fisheries and Conservation Department,
CUHK HKSAR
45
“Baseline Survey on the Attitude and Level of Knowledge of the General Public and Stakeholder Groups
Towards Biodiversity in Hong Kong” Research Report
3.1.5.2 “Importance Index”, “Closeness Index” and “Willingness Index”
With regard to the “Importance Index”, “Closeness Index” and “Willingness Index”,
they were constructed based on respondents’ answers to the “Importance”, “Closeness”
and “Willingness” questions in the telephone survey.
The “Importance Index” was constructed by coding and averaging respondents’
answers to seven “Importance” questions (Q6-Q12) on a five-point Likert scale (Q6:
1= Not at all concerned; 5= Very concerned; Q7-Q12: 1= Strongly disagree; 5=
Strongly agree). The scale of the index ranges from 1 to 5. The higher the score, the
higher the level of importance is placed on preserving biodiversity, as perceived by
the general public.
Similarly, the “Closeness Index” was constructed by coding and averaging the
respondents’ answers to the six “Closeness” questions (Q13-Q18) on a five-point
Likert scale (1= Strongly disagree; 5= Strongly agree). The higher the score, the
closer the public perceives biodiversity is to the society.
Finally, in order to form the “Willingness Index”, respondents’ answers to six
“Willingness” questions (Q19-Q24) on a five-point Likert scale (1= Definitely will
not; 5= Definitely will) were coded and averaged. The scale of the index ranges from
1 to 5. The higher the score, the stronger is the personal willingness to preserve
biodiversity, as expressed by the respondents.
Centre for Communication and Public Opinion Survey, Agriculture, Fisheries and Conservation Department,
CUHK HKSAR
46
“Baseline Survey on the Attitude and Level of Knowledge of the General Public and Stakeholder Groups
Towards Biodiversity in Hong Kong” Research Report
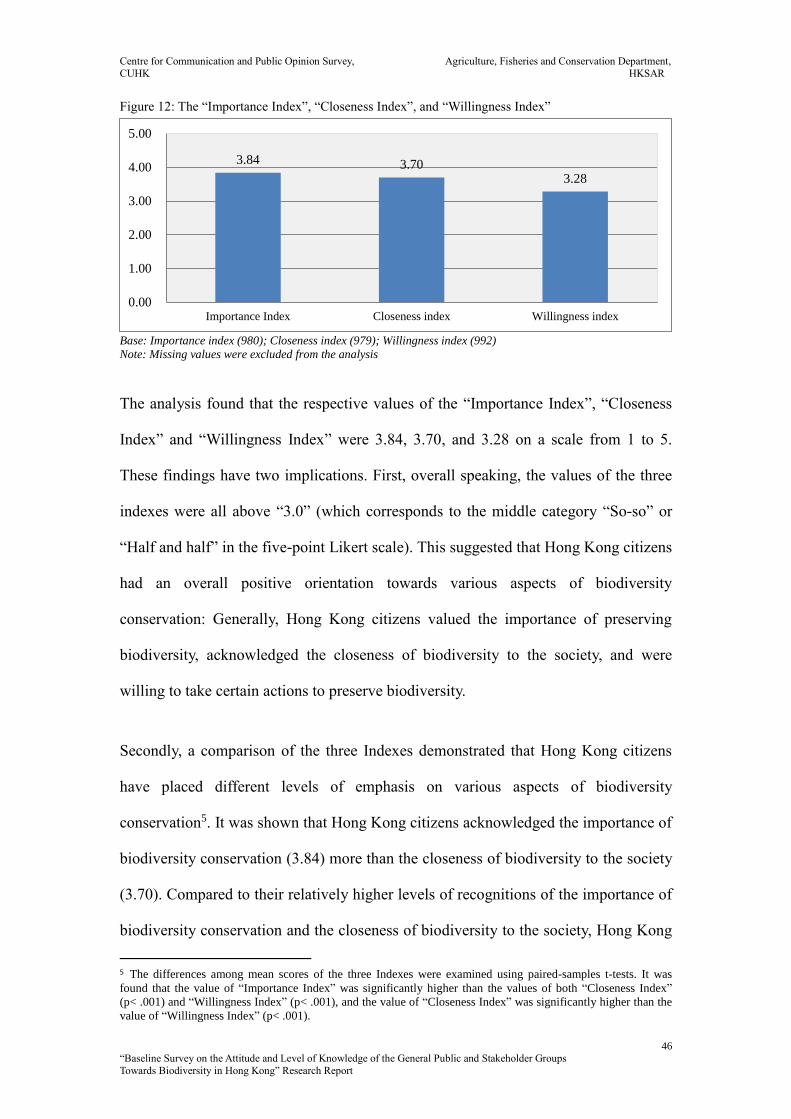
Figure 12: The “Importance Index”, “Closeness Index”, and “Willingness Index”
Base: Importance index (980); Closeness index (979); Willingness index (992)
Note: Missing values were excluded from the analysis
The analysis found that the respective values of the “Importance Index”, “Closeness
Index” and “Willingness Index” were 3.84, 3.70, and 3.28 on a scale from 1 to 5.
These findings have two implications. First, overall speaking, the values of the three
indexes were all above “3.0” (which corresponds to the middle category “So-so” or
“Half and half” in the five-point Likert scale). This suggested that Hong Kong citizens
had an overall positive orientation towards various aspects of biodiversity
conservation: Generally, Hong Kong citizens valued the importance of preserving
biodiversity, acknowledged the closeness of biodiversity to the society, and were
willing to take certain actions to preserve biodiversity.
Secondly, a comparison of the three Indexes demonstrated that Hong Kong citizens
have placed different levels of emphasis on various aspects of biodiversity
conservation5. It was shown that Hong Kong citizens acknowledged the importance of
biodiversity conservation (3.84) more than the closeness of biodiversity to the society
(3.70). Compared to their relatively higher levels of recognitions of the importance of
biodiversity conservation and the closeness of biodiversity to the society, Hong Kong
5 The differences among mean scores of the three Indexes were examined using paired-samples t-tests. It was
found that the value of “Importance Index” was significantly higher than the values of both “Closeness Index”
(p< .001) and “Willingness Index” (p< .001), and the value of “Closeness Index” was significantly higher than the
value of “Willingness Index” (p< .001).
3.84 3.703.28
0.00
1.00
2.00
3.00
4.00
5.00
Importance Index Closeness index Willingness index

Centre for Communication and Public Opinion Survey, Agriculture, Fisheries and Conservation Department,
CUHK HKSAR
47
“Baseline Survey on the Attitude and Level of Knowledge of the General Public and Stakeholder Groups
Towards Biodiversity in Hong Kong” Research Report
citizens have attributed less importance to personal efforts in preserving biodiversity
(3.28).
To further examine the different orientations among Hong Kong citizens towards
biodiversity, a subgroup analysis of the three Indexes was conducted. The following
demographic groups had higher scores in the three Indexes:
Indexes Demographic groups
“Importance Index”
(See Appendix 3, Table 3.27)
Aged 15-29 (3.95)
With tertiary education (3.97)
Mangers and administers/ Professionals/
Associate professionals (3.94)
With household monthly income of
HK$40,000-$59,999 (3.93) and of HK$60,000
or above (3.93)
“Closeness Index”
(See Appendix 3, Table 3.28)
Females (3.77)
Aged 30-39 (3.79)
With tertiary education (3.78)
“Willingness Index”
(See Appendix 3, Table 3.29)
Aged 30-39 (3.34)
With tertiary education (3.40)
Mangers and administers/ Professionals/
Associate professionals (3.39)
With household monthly income of
HK$60,000 or above (3.42)

Centre for Communication and Public Opinion Survey, Agriculture, Fisheries and Conservation Department,
CUHK HKSAR
48
“Baseline Survey on the Attitude and Level of Knowledge of the General Public and Stakeholder Groups
Towards Biodiversity in Hong Kong” Research Report
3.2 Online Survey with Stakeholder Groups - Teachers and Planning
and Development Professionals
3.2.1 Knowledge of Biodiversity
3.2.1.1 Knowledge of the term “biodiversity”
About 70% of teachers (70.8%) and planning and development professionals (72.2%)
had heard of the term “biodiversity” and also knew what it meant. About a fifth of
teachers (21.3%) and planning and development professionals (21.7%) had heard of
the term but didn’t know what it means. And relatively few teachers (8.0%) and
planning and development professionals (6.1%) had not heard of the term.
Figure 13a: (Teachers) Have you ever heard of the term “biodiversity”?
Figure 13b: (Planning and development professionals) Have you ever heard of the term “biodiversity”?
70.8%
21.3%
8.0%
0%
20%
40%
60%
80%
100%
Have heard of it, and know what
it meansHave heard of it, but don’t know
what it means
Have not heard of it
72.2%
21.7%
6.1%
0%
20%
40%
60%
80%
100%
Have heard of it, and know what
it meansHave heard of it, but don’t know
what it means
Have not heard of it
Centre for Communication and Public Opinion Survey, Agriculture, Fisheries and Conservation Department,
CUHK HKSAR
49
“Baseline Survey on the Attitude and Level of Knowledge of the General Public and Stakeholder Groups
Towards Biodiversity in Hong Kong” Research Report
A higher proportion of the following groups has heard of the term “biodiversity” and
knew what it meant:
Teachers (See Appendix 3, Table 4.1)
Aged 20-34 (84.6%)
Secondary school teachers (77.4%)
Teachers of biodiversity-related subjects6 (87.7%)
With teaching experience of 10 years or less (82.1%)
Planning and development professionals (See Appendix 3, Table 5.1)
Aged 50 or above (80.0%)
Landscape architects/ urban planners/ urban designers (96.6%)
6 Biodiversity-related subjects include Liberal Studies/ General Studies, Geography, Biology, and Science.
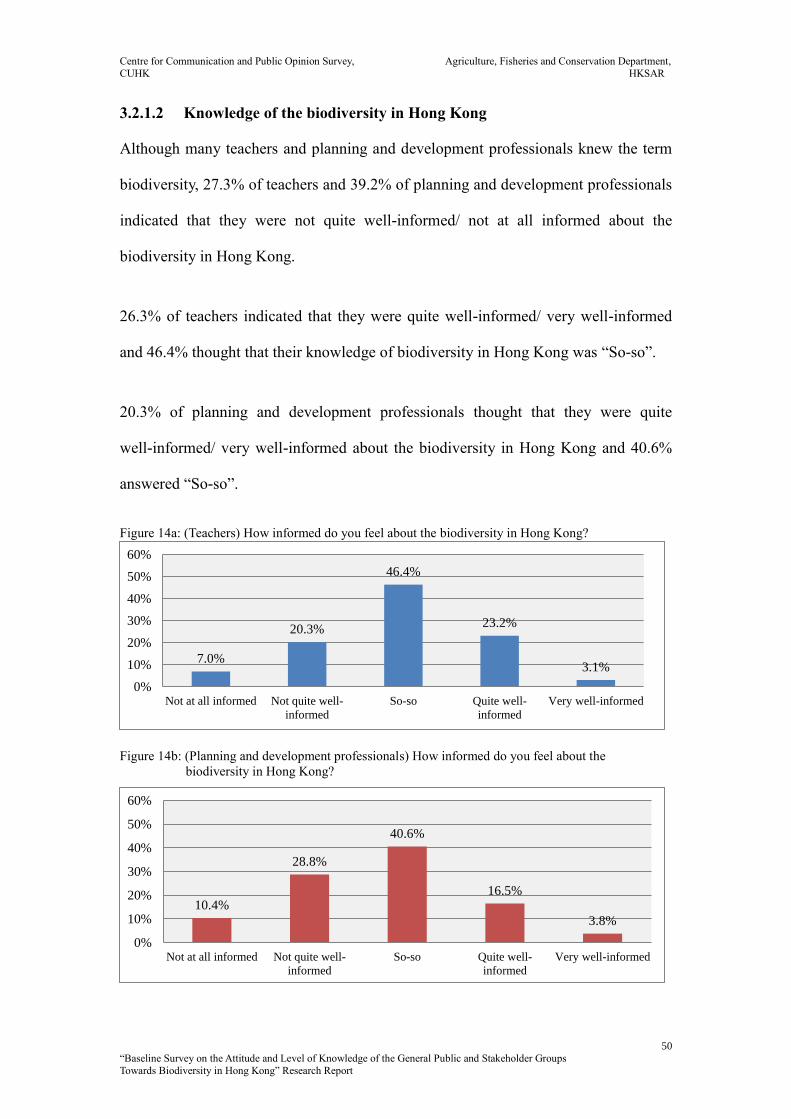
Centre for Communication and Public Opinion Survey, Agriculture, Fisheries and Conservation Department,
CUHK HKSAR
50
“Baseline Survey on the Attitude and Level of Knowledge of the General Public and Stakeholder Groups
Towards Biodiversity in Hong Kong” Research Report
3.2.1.2 Knowledge of the biodiversity in Hong Kong
Although many teachers and planning and development professionals knew the term
biodiversity, 27.3% of teachers and 39.2% of planning and development professionals
indicated that they were not quite well-informed/ not at all informed about the
biodiversity in Hong Kong.
26.3% of teachers indicated that they were quite well-informed/ very well-informed
and 46.4% thought that their knowledge of biodiversity in Hong Kong was “So-so”.
20.3% of planning and development professionals thought that they were quite
well-informed/ very well-informed about the biodiversity in Hong Kong and 40.6%
answered “So-so”.
Figure 14a: (Teachers) How informed do you feel about the biodiversity in Hong Kong?
Figure 14b: (Planning and development professionals) How informed do you feel about the
biodiversity in Hong Kong?
7.0%
20.3%
46.4%
23.2%
3.1%
0%
10%
20%
30%
40%
50%
60%
Not at all informed Not quite well-
informed
So-so Quite well-
informed
Very well-informed
10.4%
28.8%
40.6%
16.5%
3.8%
0%
10%
20%
30%
40%
50%
60%
Not at all informed Not quite well-
informed
So-so Quite well-
informed
Very well-informed
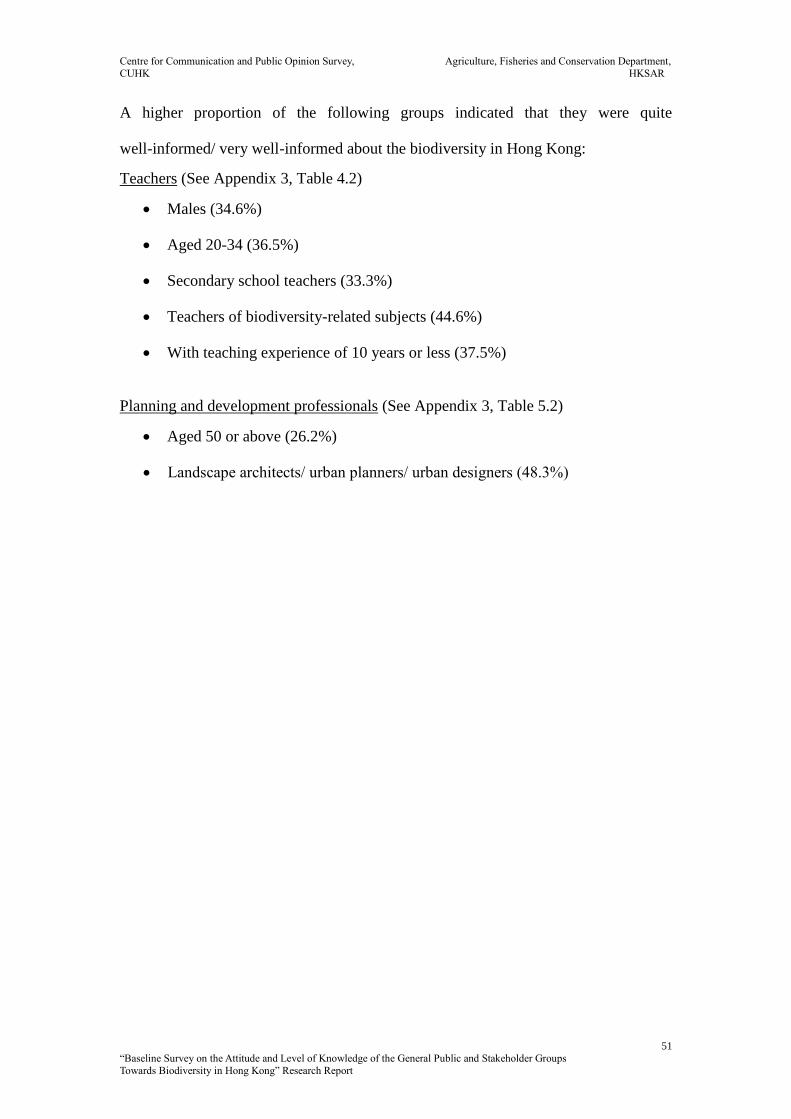
Centre for Communication and Public Opinion Survey, Agriculture, Fisheries and Conservation Department,
CUHK HKSAR
51
“Baseline Survey on the Attitude and Level of Knowledge of the General Public and Stakeholder Groups
Towards Biodiversity in Hong Kong” Research Report
A higher proportion of the following groups indicated that they were quite
well-informed/ very well-informed about the biodiversity in Hong Kong:
Teachers (See Appendix 3, Table 4.2)
Males (34.6%)
Aged 20-34 (36.5%)
Secondary school teachers (33.3%)
Teachers of biodiversity-related subjects (44.6%)
With teaching experience of 10 years or less (37.5%)
Planning and development professionals (See Appendix 3, Table 5.2)
Aged 50 or above (26.2%)
Landscape architects/ urban planners/ urban designers (48.3%)

Centre for Communication and Public Opinion Survey, Agriculture, Fisheries and Conservation Department,
CUHK HKSAR
52
“Baseline Survey on the Attitude and Level of Knowledge of the General Public and Stakeholder Groups
Towards Biodiversity in Hong Kong” Research Report
3.2.1.3 Knowledge of designated protected area for nature conservation in
Hong Kong
About 80% of teachers (80.9%) and planning and development professionals (80.7%)
could name a designated protected area for nature conservation in Hong Kong
correctly. Most teachers answered Mai Po (58.2%), which was followed by Hoi Ha
Wan (6.8%) and Hong Kong Wetland Park (5.3%) (Table 3a). For planning and
development professionals, Mai Po was also the most popular answer (49.5%), which
was followed by country parks (8.0%), Hoi Ha Wan (4.7%) and Hong Kong Wetland
Park (4.2%) (Table 3b). About a fifth of teachers (19.1%) and planning and
development professionals (19.3%) could not provide any answers or offered wrong
answers.
Figure 15a: (Teachers) To your knowledge, please write down ONE designated protected area for
nature conservation in Hong Kong, the one that you are most certain about.
Figure 15b: (Planning and development professionals) To your knowledge, please write down ONE
designated protected area for nature conservation in Hong Kong, the one that you are most
certain about.
80.9%
19.1%
0%
20%
40%
60%
80%
100%
Answered correctly Answered wrongly/Don't know/Refuse to answer
80.7%
19.3%
0%
20%
40%
60%
80%
100%
Answered correctly Answered wrongly/Don't know

Centre for Communication and Public Opinion Survey, Agriculture, Fisheries and Conservation Department,
CUHK HKSAR
53
“Baseline Survey on the Attitude and Level of Knowledge of the General Public and Stakeholder Groups
Towards Biodiversity in Hong Kong” Research Report
A higher proportion of the following groups could name a designated protected area
for nature conservation in Hong Kong correctly:
Teachers (See Appendix 3, Table 4.3)
Teachers of biodiversity-related subjects (89.2%)
Planning and development professionals (See Appendix 3, Table 5.3)
Landscape architects/ urban planners/ urban designers (96.6%)
Table 3a: (Teachers) To your knowledge, please write down ONE designated protected area for nature
conservation in Hong Kong, the one that you are most certain about.
Frequency Percentage
Mai Po 241 58.2
Hoi Ha Wan 28 6.8
Hong Kong Wetland Park 22 5.3
Various country parks 11 2.7
Country park (cannot name a specific one) 7 1.7
Clear Water Bay Country Park 1 0.2
High Island Reservoir (Sai Kung East Country Park) 1 0.2
Tai Lam Country Park 1 0.2
Tai Tam Country Park 1 0.2
Geopark 5 1.2
Inner Deep Bay 5 1.2
Tai Po Kau Nature Reserve 5 1.2
Cape D’ Aguilar 4 1.0
Marine park 4 1.0
Tung Ping Chau 3 0.7
Yan Chau Tong 2 0.5
Ma Shi Chau 1 0.2
Sha Chau and Lung Kwu Chau 1 0.2
Sha Lo Tung 1 0.2
Sharp Island 1 0.2
Ting Kok 1 0.2
Wrong answers/Don’t know/Refuse to answer 79 19.1
Total 414 100.0
Note: Percentages do not always add up to the total due to rounding.

Centre for Communication and Public Opinion Survey, Agriculture, Fisheries and Conservation Department,
CUHK HKSAR
54
“Baseline Survey on the Attitude and Level of Knowledge of the General Public and Stakeholder Groups
Towards Biodiversity in Hong Kong” Research Report
Table 3b: (Planning and development professionals) To your knowledge, please write down ONE
designated protected area for nature conservation in Hong Kong, the one that you are most
certain about.
Frequency Percentage
Mai Po 105 49.5
Various country parks 17 8.0
Country park (cannot name a specific one) 7 3.3
Clear Water Bay 2 0.9
Long Ke (Sai Kung East Country Park) 2 0.9
Tai Tam Country Park 2 0.9
Lion Rock Country Park 1 0.5
Ma On Shan Country Park 1 0.5
Pat Sin Leng Country Park 1 0.5
Pok Fu Lam Country Park 1 0.5
Hoi Ha Wan 10 4.7
Hong Kong Wetland Park 9 4.2
Cape D’ Aguilar 7 3.3
Tai Po Kau Nature Reserve 6 2.8
Inner Deep Bay 3 1.4
Marine park 3 1.4
Tung Ping Chau 3 1.4
Geopark 2 0.9
Lai Chi Wo 2 0.9
Lung Kwu Tan Valley 1 0.5
Ma Shi Chau 1 0.5
Sha Lo Tung 1 0.5
Sham Wan 1 0.5
Wrong answers/ Don’t know 41 19.3
Total 212 100.0

Centre for Communication and Public Opinion Survey, Agriculture, Fisheries and Conservation Department,
CUHK HKSAR
55
“Baseline Survey on the Attitude and Level of Knowledge of the General Public and Stakeholder Groups
Towards Biodiversity in Hong Kong” Research Report
3.2.1.4 Knowledge of the land area of country parks and special areas in Hong
Kong
65.5% of teachers either got the answer wrong or could not provide any answers.
34.5% answered correctly that there was about 40% of Hong Kong’s land being
designated as country parks and special areas.
59.0% of planning and development professionals either got the answer wrong or
could not provide any answers. 41.0% got the answer right.
Figure 16a: (Teachers) Do you know how much of Hong Kong’s land area is designated as country
parks and special areas?
Figure 16b: (Planning and development professionals) Do you know how much of Hong Kong’s land
area is designated as country parks and special areas?
6.0%
14.5%
34.5%
17.6%
27.3%
0%
10%
20%
30%
40%
50%
About 20% About 30% About 40%
(Correct answer)
About 50% Don't know
2.4%
10.4%
41.0%
28.8%
17.5%
0%
10%
20%
30%
40%
50%
About 20% About 30% About 40%
(Correct answer)
About 50% Don't know

Centre for Communication and Public Opinion Survey, Agriculture, Fisheries and Conservation Department,
CUHK HKSAR
56
“Baseline Survey on the Attitude and Level of Knowledge of the General Public and Stakeholder Groups
Towards Biodiversity in Hong Kong” Research Report
A higher proportion of the following groups got the answer correct that there is about
40% of Hong Kong’s land being designated as country parks and special areas:
Teachers (See Appendix 3, Table 4.4)
Teachers of biodiversity-related subjects (44.6%)
Planning and development professionals (See Appendix 3, Table 5.4)
Landscape architects/ urban planners/ urban designers (79.3%)
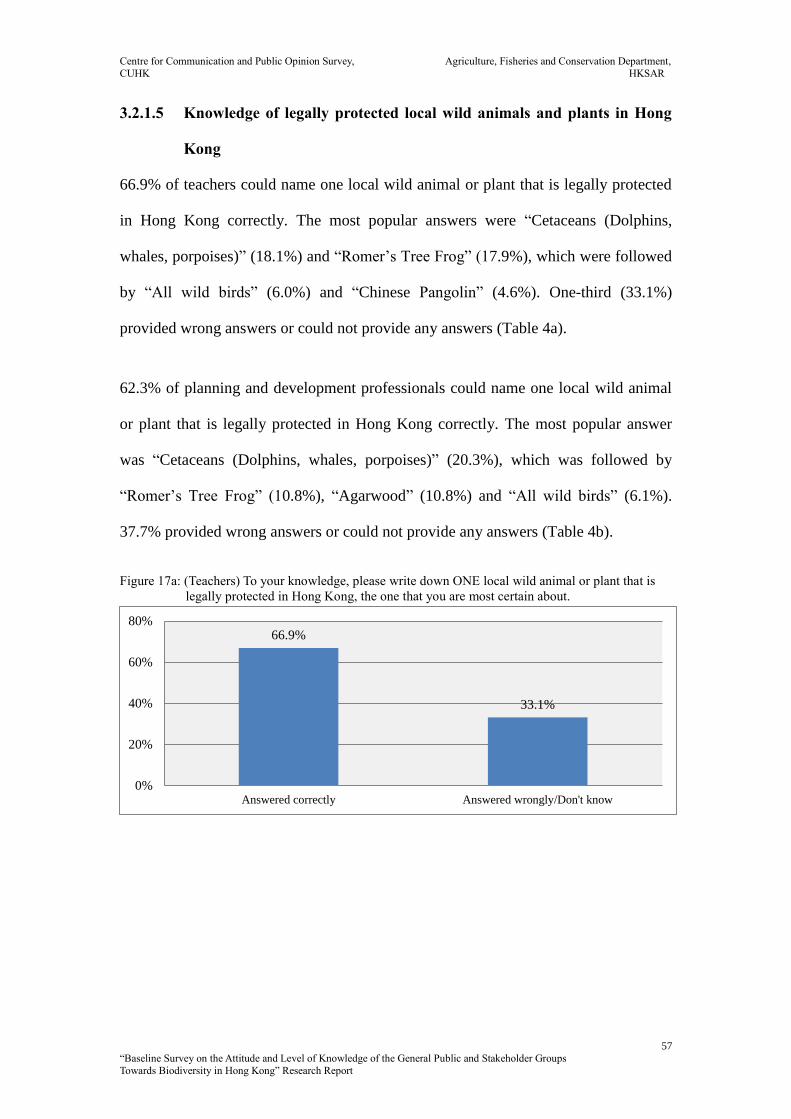
Centre for Communication and Public Opinion Survey, Agriculture, Fisheries and Conservation Department,
CUHK HKSAR
57
“Baseline Survey on the Attitude and Level of Knowledge of the General Public and Stakeholder Groups
Towards Biodiversity in Hong Kong” Research Report
3.2.1.5 Knowledge of legally protected local wild animals and plants in Hong
Kong
66.9% of teachers could name one local wild animal or plant that is legally protected
in Hong Kong correctly. The most popular answers were “Cetaceans (Dolphins,
whales, porpoises)” (18.1%) and “Romer’s Tree Frog” (17.9%), which were followed
by “All wild birds” (6.0%) and “Chinese Pangolin” (4.6%). One-third (33.1%)
provided wrong answers or could not provide any answers (Table 4a).
62.3% of planning and development professionals could name one local wild animal
or plant that is legally protected in Hong Kong correctly. The most popular answer
was “Cetaceans (Dolphins, whales, porpoises)” (20.3%), which was followed by
“Romer’s Tree Frog” (10.8%), “Agarwood” (10.8%) and “All wild birds” (6.1%).
37.7% provided wrong answers or could not provide any answers (Table 4b).
Figure 17a: (Teachers) To your knowledge, please write down ONE local wild animal or plant that is
legally protected in Hong Kong, the one that you are most certain about.
66.9%
33.1%
0%
20%
40%
60%
80%
Answered correctly Answered wrongly/Don't know
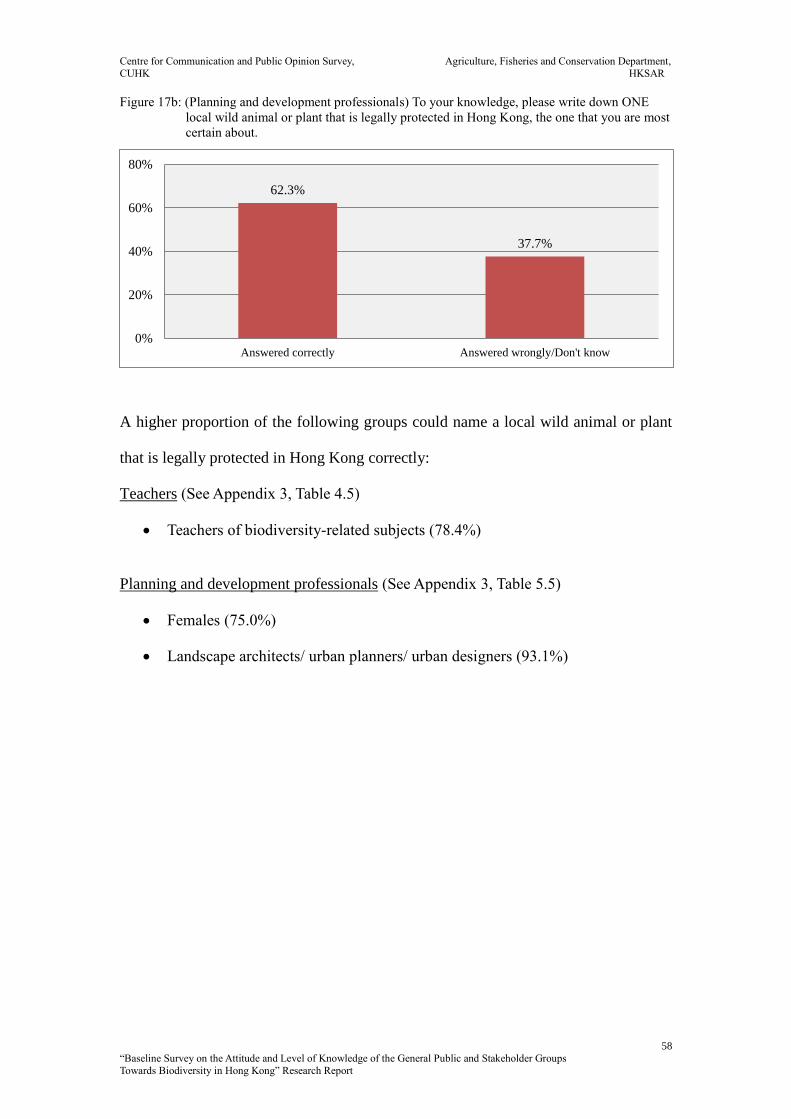
Centre for Communication and Public Opinion Survey, Agriculture, Fisheries and Conservation Department,
CUHK HKSAR
58
“Baseline Survey on the Attitude and Level of Knowledge of the General Public and Stakeholder Groups
Towards Biodiversity in Hong Kong” Research Report
Figure 17b: (Planning and development professionals) To your knowledge, please write down ONE
local wild animal or plant that is legally protected in Hong Kong, the one that you are most
certain about.
A higher proportion of the following groups could name a local wild animal or plant
that is legally protected in Hong Kong correctly:
Teachers (See Appendix 3, Table 4.5)
Teachers of biodiversity-related subjects (78.4%)
Planning and development professionals (See Appendix 3, Table 5.5)
Females (75.0%)
Landscape architects/ urban planners/ urban designers (93.1%)
62.3%
37.7%
0%
20%
40%
60%
80%
Answered correctly Answered wrongly/Don't know

Centre for Communication and Public Opinion Survey, Agriculture, Fisheries and Conservation Department,
CUHK HKSAR
59
“Baseline Survey on the Attitude and Level of Knowledge of the General Public and Stakeholder Groups
Towards Biodiversity in Hong Kong” Research Report
Table 4a: (Teachers) To your knowledge, please write down ONE local wild animal or plant that is
legally protected in Hong Kong, the one that you are most certain about.
Frequency Percentage
Animals
Cetaceans (Dolphins, whales, porpoises) 75 18.1
Romer’s Tree Frog 74 17.9
All wild birds 25 6.0
Chinese Pangolin 19 4.6
Hong Kong Newt 12 2.9
Bats 9 2.2
Chelonians (Turtles, terrapins, tortoises, etc.) 7 1.7
Masked Palm Civet 7 1.7
Primates (Monkeys etc.) 5 1.2
Reeves’ Muntjac/ Barking Deer 4 1.0
Hong Kong Cascade Frog 2 0.5
Leopard Cat 2 0.5
Squirrels 2 0.5
Birdwing Butterfly 1 0.2
Chinese Porcupine 1 0.2
Otter 1 0.2
Plants
Agarwood 13 3.1
Orchids 9 2.2
Pitcher-plants 5 1.2
Camellias 3 0.7
Chinese New Year Flower 1 0.2
Wrong answers / Don’t know 137 33.1
Total 414 100.0

Centre for Communication and Public Opinion Survey, Agriculture, Fisheries and Conservation Department,
CUHK HKSAR
60
“Baseline Survey on the Attitude and Level of Knowledge of the General Public and Stakeholder Groups
Towards Biodiversity in Hong Kong” Research Report
Table 4b: (Planning and development professionals) To your knowledge, please write down ONE local
wild animal or plant that is legally protected in Hong Kong, the one that you are most certain
about.
Frequency Percentage
Animals
Cetaceans (Dolphins, whales, porpoises) 43 20.3
Romer’s Tree Frog 23 10.8
All wild birds 13 6.1
Chinese Pangolin 4 1.9
Reeves’ Muntjac/ Barking Deer 4 1.9
Burmese Python 3 1.4
Hong Kong Newt 3 1.4
Masked Palm Civet 3 1.4
Chelonians (Turtles, terrapins, tortoises etc.) 1 0.5
Bats 1 0.5
Birdwing Butterfly 1 0.5
Chinese Porcupine 1 0.5
Plants
Agarwood 23 10.8
Orchids 3 1.4
Pavetta 2 0.9
Ailanthus 1 0.5
Camellias 1 0.5
Chinese New Year Flower 1 0.5
Pitcher-plants 1 0.5
Wrong answers/ Don’t know 80 37.7
Total 212 100.0

Centre for Communication and Public Opinion Survey, Agriculture, Fisheries and Conservation Department,
CUHK HKSAR
61
“Baseline Survey on the Attitude and Level of Knowledge of the General Public and Stakeholder Groups
Towards Biodiversity in Hong Kong” Research Report
3.2.1.6 Overall knowledge of the three specific aspects of biodiversity in Hong
Kong
Regarding the above three specific knowledge-based questions, a majority of teachers
(88.4%) and planning and development professionals (90.6%) could answer at least
one question correctly. Around 40% of teachers (41.8%) and planning and
development professionals (38.2%) could answer two questions correctly. Over a
quarter of teachers (26.1%) and planning and development professionals (27.8%)
were able to answer all three questions correctly. 20.5% of teachers and 24.5% of
planning and development professionals were able to answer one question correctly.
Only 11.6% of teachers and 9.4% of planning and development professionals could
not answer any questions correctly.
Figure 18a: (Teachers) Overall knowledge of the three specific aspects of biodiversity in Hong Kong
11.6%
20.5%
41.8%
26.1%
0%
10%
20%
30%
40%
50%
60%
Could not answer any
question correctly
Answered 1 question
correctly
Answered 2 questions
correctly
Answered 3 questions
correctly
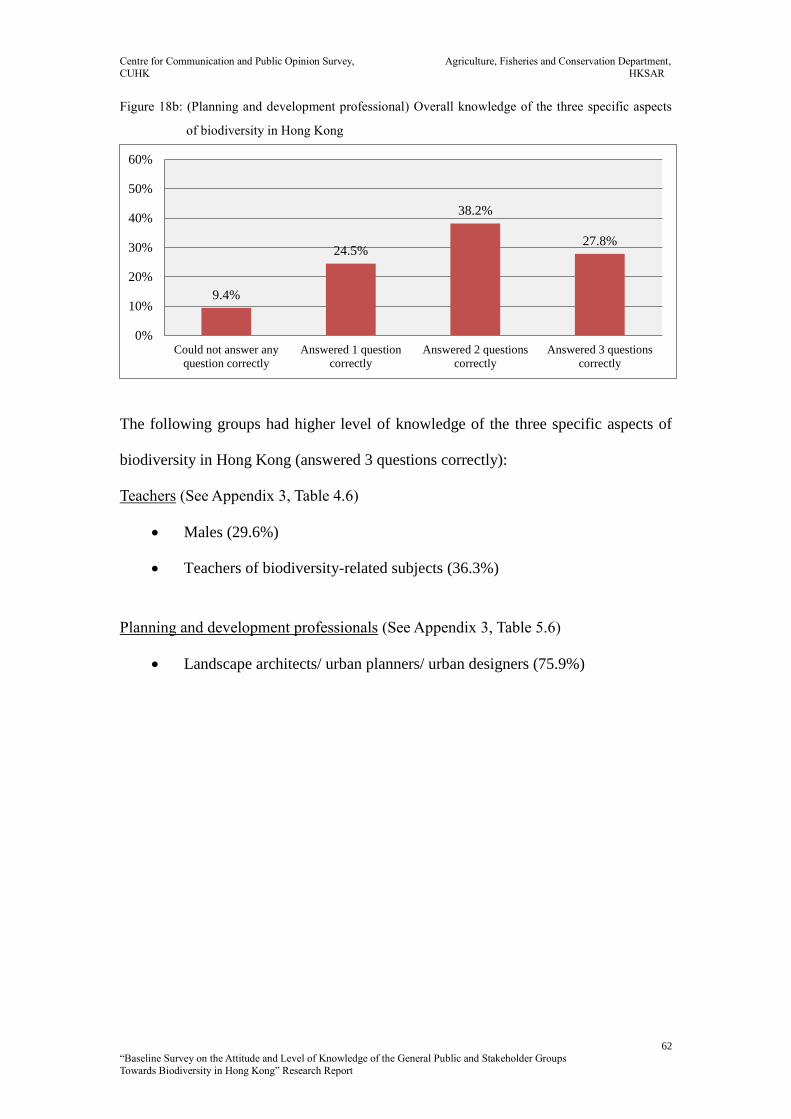
Centre for Communication and Public Opinion Survey, Agriculture, Fisheries and Conservation Department,
CUHK HKSAR
62
“Baseline Survey on the Attitude and Level of Knowledge of the General Public and Stakeholder Groups
Towards Biodiversity in Hong Kong” Research Report
Figure 18b: (Planning and development professional) Overall knowledge of the three specific aspects
of biodiversity in Hong Kong
The following groups had higher level of knowledge of the three specific aspects of
biodiversity in Hong Kong (answered 3 questions correctly):
Teachers (See Appendix 3, Table 4.6)
Males (29.6%)
Teachers of biodiversity-related subjects (36.3%)
Planning and development professionals (See Appendix 3, Table 5.6)
Landscape architects/ urban planners/ urban designers (75.9%)
9.4%
24.5%
38.2%
27.8%
0%
10%
20%
30%
40%
50%
60%
Could not answer any
question correctly
Answered 1 question
correctly
Answered 2 questions
correctly
Answered 3 questions
correctly
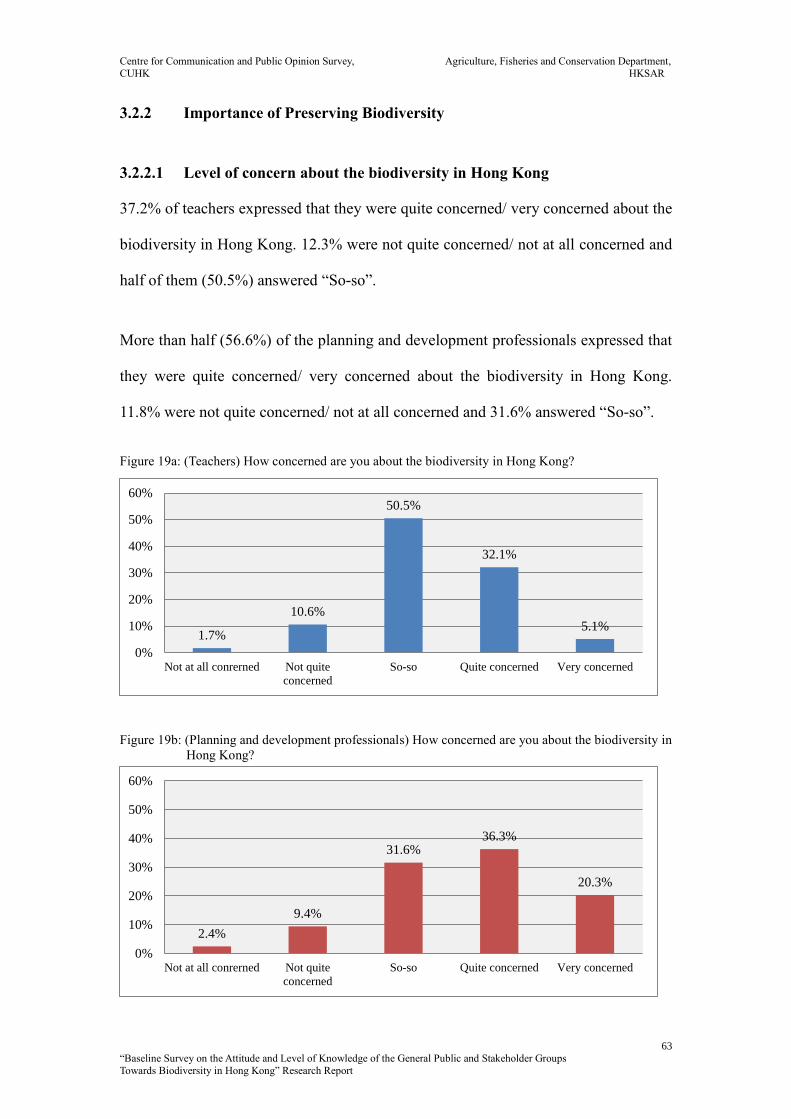
Centre for Communication and Public Opinion Survey, Agriculture, Fisheries and Conservation Department,
CUHK HKSAR
63
“Baseline Survey on the Attitude and Level of Knowledge of the General Public and Stakeholder Groups
Towards Biodiversity in Hong Kong” Research Report
3.2.2 Importance of Preserving Biodiversity
3.2.2.1 Level of concern about the biodiversity in Hong Kong
37.2% of teachers expressed that they were quite concerned/ very concerned about the
biodiversity in Hong Kong. 12.3% were not quite concerned/ not at all concerned and
half of them (50.5%) answered “So-so”.
More than half (56.6%) of the planning and development professionals expressed that
they were quite concerned/ very concerned about the biodiversity in Hong Kong.
11.8% were not quite concerned/ not at all concerned and 31.6% answered “So-so”.
Figure 19a: (Teachers) How concerned are you about the biodiversity in Hong Kong?
Figure 19b: (Planning and development professionals) How concerned are you about the biodiversity in
Hong Kong?
1.7%
10.6%
50.5%
32.1%
5.1%
0%
10%
20%
30%
40%
50%
60%
Not at all conrerned Not quite
concerned
So-so Quite concerned Very concerned
2.4%
9.4%
31.6%36.3%
20.3%
0%
10%
20%
30%
40%
50%
60%
Not at all conrerned Not quite
concerned
So-so Quite concerned Very concerned
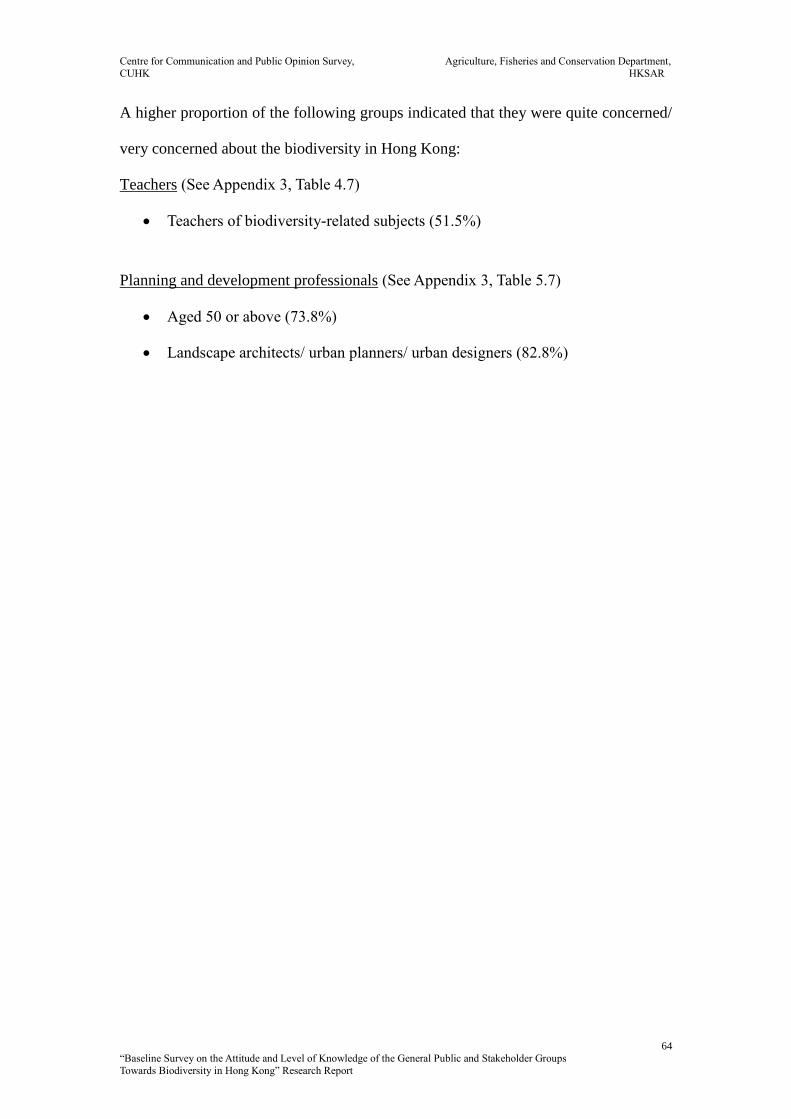
Centre for Communication and Public Opinion Survey, Agriculture, Fisheries and Conservation Department,
CUHK HKSAR
64
“Baseline Survey on the Attitude and Level of Knowledge of the General Public and Stakeholder Groups
Towards Biodiversity in Hong Kong” Research Report
A higher proportion of the following groups indicated that they were quite concerned/
very concerned about the biodiversity in Hong Kong:
Teachers (See Appendix 3, Table 4.7)
Teachers of biodiversity-related subjects (51.5%)
Planning and development professionals (See Appendix 3, Table 5.7)
Aged 50 or above (73.8%)
Landscape architects/ urban planners/ urban designers (82.8%)
Centre for Communication and Public Opinion Survey, Agriculture, Fisheries and Conservation Department,
CUHK HKSAR
65
“Baseline Survey on the Attitude and Level of Knowledge of the General Public and Stakeholder Groups
Towards Biodiversity in Hong Kong” Research Report
3.2.2.2 Perceptions of the importance of preserving biodiversity
An overwhelming majority of teachers and planning and development professionals
had a positive attitude towards the importance of biodiversity preservation.
Approximately 90% of teachers and planning and development professionals
somewhat agreed/ strongly agree most of the sentences:
89.6% of teachers and 91.0% of planning and development professionals somewhat
agreed/ strongly agreed that it was important to promote and educate the public on
biodiversity. 3.1% of teachers and 1.9% of planning and development professionals
somewhat disagreed/ strongly disagreed with it. About 7% of teachers (7.2%) and
planning and development professionals (7.1%) answered “So-so”.
89.6% of teachers and 87.3% of planning and development professionals considered
that biodiversity conservation must be taken into account when undertaking
infrastructure and land development projects (somewhat agreed/ strongly agreed).
2.9% of teachers and 4.2% of planning and development professionals somewhat
disagreed/ strongly disagreed with it. 7.5% of teachers and 8.5% of planning and
development professionals answered “So-so”.
92.3% of teachers and 88.7% of planning and development professionals thought that
the government had a huge responsibility to preserve the biodiversity in Hong Kong
(somewhat agreed/ strongly agreed). 2.7% of teachers and 5.7% of planning and
development professionals somewhat disagreed/ strongly disagreed with it. About 5%
of teachers (5.1%) and planning and development professionals (5.7%) answered
“So-so”.

Centre for Communication and Public Opinion Survey, Agriculture, Fisheries and Conservation Department,
CUHK HKSAR
66
“Baseline Survey on the Attitude and Level of Knowledge of the General Public and Stakeholder Groups
Towards Biodiversity in Hong Kong” Research Report
88.6% of teachers and 86.8% of planning and development professionals somewhat
agreed/ strongly agreed that the business sector had a responsibility to preserve the
biodiversity in Hong Kong. 3.9% of teachers and 5.2% of planning and development
professionals somewhat disagreed/ strongly disagreed with it. 7.5% of teachers and
8.0% of planning and development professionals answered “So-so”.
90.3% of teachers and 92.5% of planning and development professionals somewhat
agreed/ strongly agreed that citizens had a responsibility to change their daily habits
so as to preserve the biodiversity in Hong Kong. 3.6% of teachers and 2.8% of
planning and development professionals somewhat disagreed/ strongly disagreed with
it. 6.0% of teachers and 4.7% of planning and development professionals answered
“So-so”.
By measuring their attitudes in a reversed way, 65.7% of teachers and 68.9% of
planning and development professionals somewhat disagreed/ strongly disagreed that
economic development was more important than preserving biodiversity. 12.8% of
teachers and 13.7% of planning and development professionals somewhat agreed/
strongly agreed with this sentence. 21.5% of teachers and 17.5% of planning and
development professionals answered “So-so”. Their opinions on this statement were
relatively diverse than the other statements.
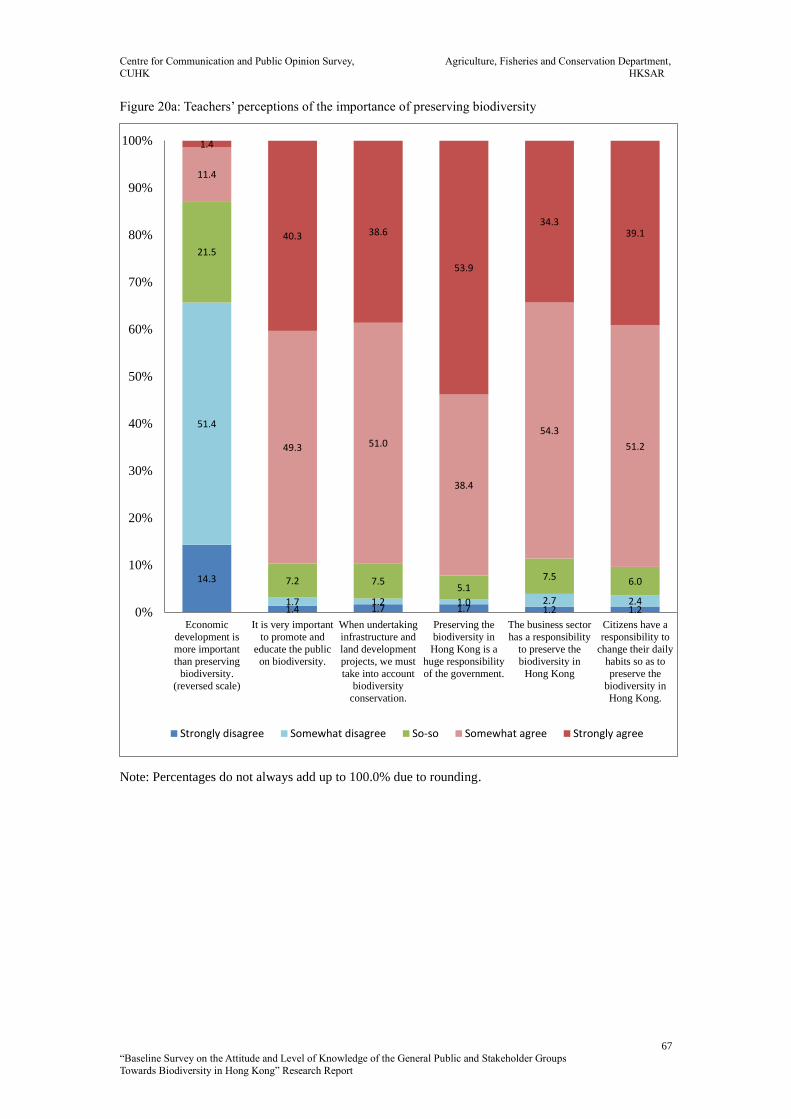
Centre for Communication and Public Opinion Survey, Agriculture, Fisheries and Conservation Department,
CUHK HKSAR
67
“Baseline Survey on the Attitude and Level of Knowledge of the General Public and Stakeholder Groups
Towards Biodiversity in Hong Kong” Research Report
Figure 20a: Teachers’ perceptions of the importance of preserving biodiversity
Note: Percentages do not always add up to 100.0% due to rounding.
14.3
1.4 1.7 1.7 1.2 1.2
51.4
1.7 1.2 1.0 2.7 2.4
21.5
7.2 7.55.1
7.5 6.0
11.4
49.3 51.0
38.4
54.3
51.2
1.4
40.3 38.6
53.9
34.339.1
0%
10%
20%
30%
40%
50%
60%
70%
80%
90%
100%
Economic
development is
more important
than preserving
biodiversity.
(reversed scale)
It is very important
to promote and
educate the public
on biodiversity.
When undertaking
infrastructure and
land development
projects, we must
take into account
biodiversity
conservation.
Preserving the
biodiversity in
Hong Kong is a
huge responsibility
of the government.
The business sector
has a responsibility
to preserve the
biodiversity in
Hong Kong
Citizens have a
responsibility to
change their daily
habits so as to
preserve the
biodiversity in
Hong Kong.
Strongly disagree Somewhat disagree So-so Somewhat agree Strongly agree
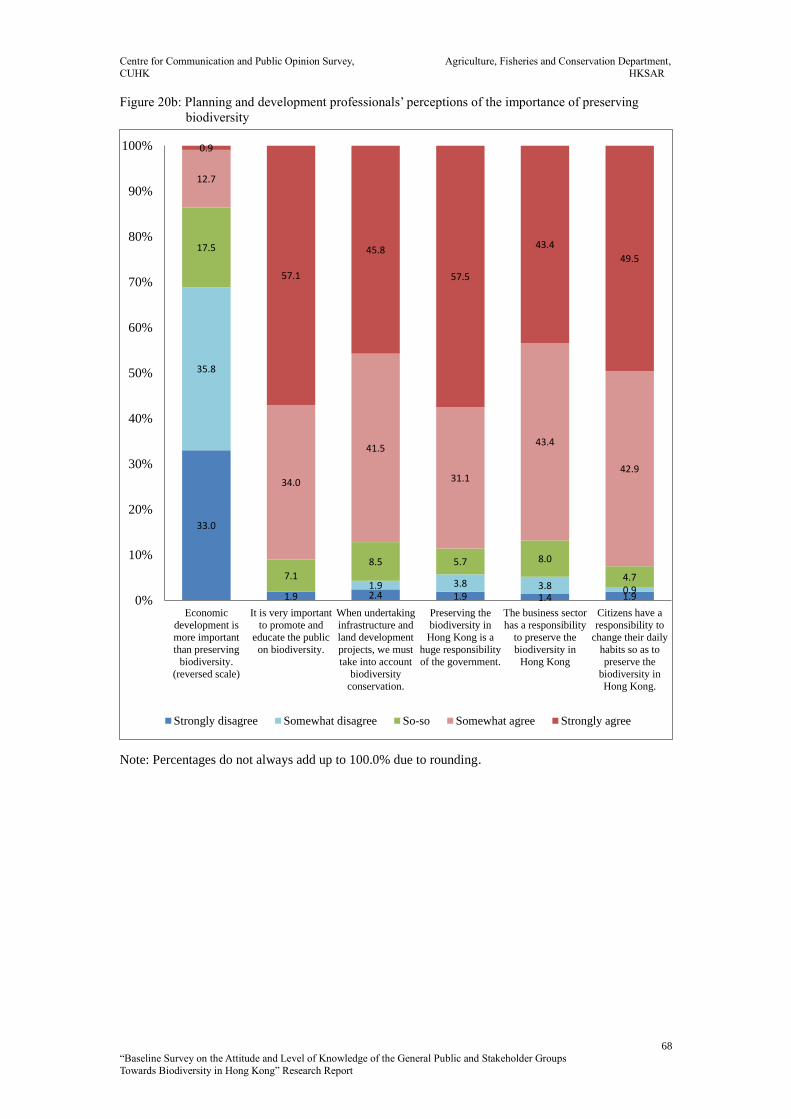
Centre for Communication and Public Opinion Survey, Agriculture, Fisheries and Conservation Department,
CUHK HKSAR
68
“Baseline Survey on the Attitude and Level of Knowledge of the General Public and Stakeholder Groups
Towards Biodiversity in Hong Kong” Research Report
Figure 20b: Planning and development professionals’ perceptions of the importance of preserving
biodiversity
Note: Percentages do not always add up to 100.0% due to rounding.
33.0
1.9 2.4 1.9 1.4 1.9
35.8
1.9 3.8 3.8 0.9
17.5
7.1
8.5 5.7 8.0
4.7
12.7
34.0
41.5
31.1
43.4
42.9
0.9
57.1
45.8
57.5
43.4
49.5
0%
10%
20%
30%
40%
50%
60%
70%
80%
90%
100%
Economic
development is
more important
than preserving
biodiversity.
(reversed scale)
It is very important
to promote and
educate the public
on biodiversity.
When undertaking
infrastructure and
land development
projects, we must
take into account
biodiversity
conservation.
Preserving the
biodiversity in
Hong Kong is a
huge responsibility
of the government.
The business sector
has a responsibility
to preserve the
biodiversity in
Hong Kong
Citizens have a
responsibility to
change their daily
habits so as to
preserve the
biodiversity in
Hong Kong.
Strongly disagree Somewhat disagree So-so Somewhat agree Strongly agree
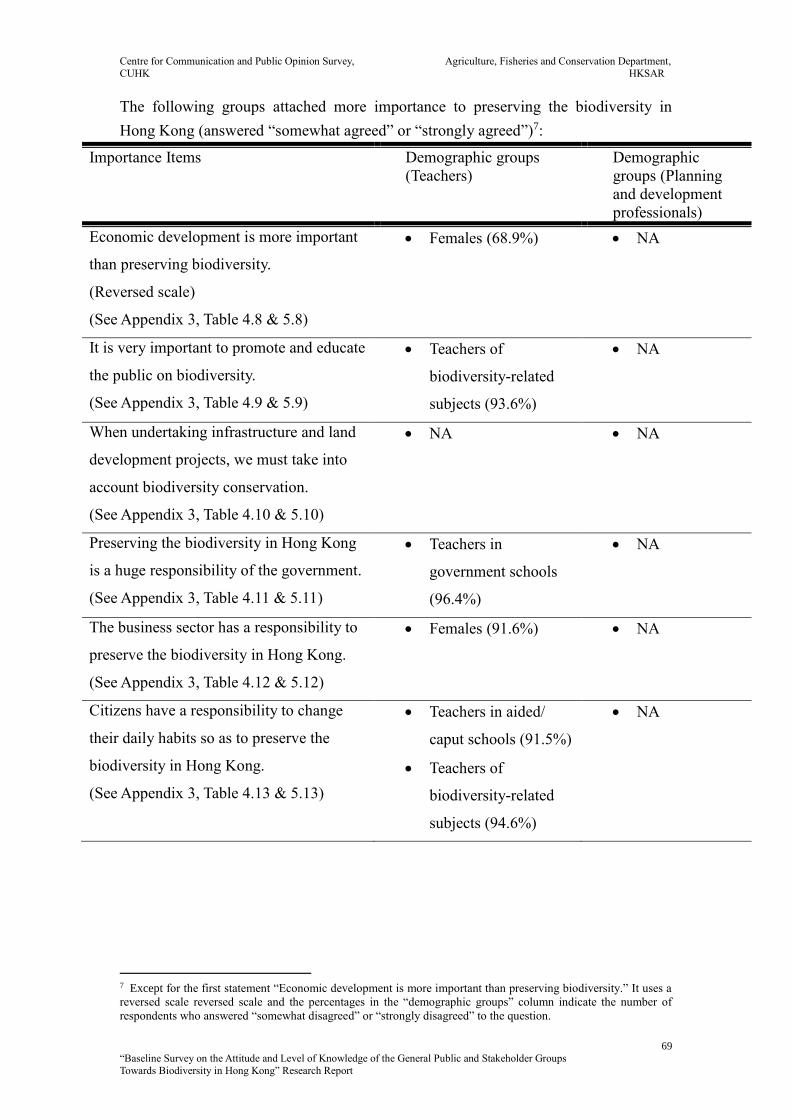
Centre for Communication and Public Opinion Survey, Agriculture, Fisheries and Conservation Department,
CUHK HKSAR
69
“Baseline Survey on the Attitude and Level of Knowledge of the General Public and Stakeholder Groups
Towards Biodiversity in Hong Kong” Research Report
The following groups attached more importance to preserving the biodiversity in
Hong Kong (answered “somewhat agreed” or “strongly agreed”)7:
Importance Items Demographic groups
(Teachers)
Demographic
groups (Planning
and development
professionals)
Economic development is more important
than preserving biodiversity.
(Reversed scale)
(See Appendix 3, Table 4.8 & 5.8)
Females (68.9%) NA
It is very important to promote and educate
the public on biodiversity.
(See Appendix 3, Table 4.9 & 5.9)
Teachers of
biodiversity-related
subjects (93.6%)
NA
When undertaking infrastructure and land
development projects, we must take into
account biodiversity conservation.
(See Appendix 3, Table 4.10 & 5.10)
NA NA
Preserving the biodiversity in Hong Kong
is a huge responsibility of the government.
(See Appendix 3, Table 4.11 & 5.11)
Teachers in
government schools
(96.4%)
NA
The business sector has a responsibility to
preserve the biodiversity in Hong Kong.
(See Appendix 3, Table 4.12 & 5.12)
Females (91.6%) NA
Citizens have a responsibility to change
their daily habits so as to preserve the
biodiversity in Hong Kong.
(See Appendix 3, Table 4.13 & 5.13)
Teachers in aided/
caput schools (91.5%)
Teachers of
biodiversity-related
subjects (94.6%)
NA
7 Except for the first statement “Economic development is more important than preserving biodiversity.” It uses a
reversed scale reversed scale and the percentages in the “demographic groups” column indicate the number of
respondents who answered “somewhat disagreed” or “strongly disagreed” to the question.
Centre for Communication and Public Opinion Survey, Agriculture, Fisheries and Conservation Department,
CUHK HKSAR
70
“Baseline Survey on the Attitude and Level of Knowledge of the General Public and Stakeholder Groups
Towards Biodiversity in Hong Kong” Research Report
3.2.3 Closeness to Biodiversity
For teachers and planning and development professionals, it seemed to be
indisputable that biodiversity must be preserved for future generations. An
overwhelming majority of teachers (92.0%) and planning and development
professionals (90.6%) somewhat agreed/ strongly agreed with this notion. Among
them, 53.4% of teachers and 68.4% of planning and development professionals
strongly agreed with the statement. Merely 1.0% of teachers and 1.9% of planning
and development professionals somewhat disagreed/ strongly disagreed with it. About
7% of teachers (7.0%) and planning and development professionals (7.5%) answered
“So-so”.
A majority of teachers (85.3%) and planning and development professionals (85.4%)
believed that preserving biodiversity could enrich the leisure life of citizens
(somewhat agreed/ strongly agreed). 3.4% of teachers and 2.8% of planning and
development professionals considered the opposite (somewhat disagreed/ strongly
disagreed). About 11% of teachers (11.4%) and planning and development
professionals (11.8%) answered “So-so”.
About three quarters of teachers (74.6%) and planning and development professionals
(77.4%) somewhat agreed/ strongly agreed that the loss of biodiversity would affect
citizens’ living environment. 5.8% of teachers and 8.5% of planning and development
professionals somewhat disagreed/ strongly disagreed with it. 19.6% of teachers and
14.2% of planning and development professionals answered “So-so”.
Some 60% (63.8%) of teachers and some 50% (53.3%) of planning and development
professionals somewhat agreed/ strongly agreed that the loss of biodiversity would
affect citizens’ health. 12.8% of teachers and 14.6% of planning and development
Centre for Communication and Public Opinion Survey, Agriculture, Fisheries and Conservation Department,
CUHK HKSAR
71
“Baseline Survey on the Attitude and Level of Knowledge of the General Public and Stakeholder Groups
Towards Biodiversity in Hong Kong” Research Report
professionals somewhat disagreed/ strongly disagreed with it. 23.4% of teachers and
32.1% of planning and development professionals indicated “So-so”.
Over 60% (61.4%) of teachers and over 55% (55.7%) of planning and development
professionals believed (somewhat agreed/ strong agreed) that preserving biodiversity
could bring economic gains to Hong Kong. 7.5% of teachers and 9.4% of planning
and development professionals suggested the otherwise (somewhat disagreed/
strongly disagreed). And 31.2% of teachers and 34.9% of planning and development
professionals said “So-so”.
Close to 60% (59.2%) of teachers and close to 50% (48.6%) of planning and
development professionals somewhat agreed/ strongly agreed that the loss of
biodiversity would lead to a decrease in food and product choices for citizens. 16.9%
of teachers and 21.2% did not think so (somewhat disagreed/ strongly disagreed). And
23.9% of teachers and 30.2% of planning and development professionals answered
“So-so”

Centre for Communication and Public Opinion Survey, Agriculture, Fisheries and Conservation Department,
CUHK HKSAR
72
“Baseline Survey on the Attitude and Level of Knowledge of the General Public and Stakeholder Groups
Towards Biodiversity in Hong Kong” Research Report
Figure 21a: Teachers’ perceptions of the closeness to biodiversity
Note: Percentages do not always add up to 100.0% due to rounding.
2.4 1.7 1.2 1.0 1.20.5
14.511.1
4.62.4
6.3
0.5
23.9
23.4
19.6
11.4
31.2
7.0
45.449.3
48.6
53.4
46.4
38.6
13.8 14.5
26.131.9
15.0
53.4
0%
10%
20%
30%
40%
50%
60%
70%
80%
90%
100%
The loss of
biodiversity will
lead to a decrease
in food and product
choices for citizens
The loss of
biodiversity will
affect citizens'
health
The loss of
biodiversity will
affect citizens'
living environment
Preserving
biodiversity can
enrich the leisure
life of citizens.
Preserving
biodiversity can
bring economic
gains to Hong
Kong
We must preserve
biodiversity for the
future generations
Strongly disagree Somewhat disagree So-so Somewhat agree Strongly agree
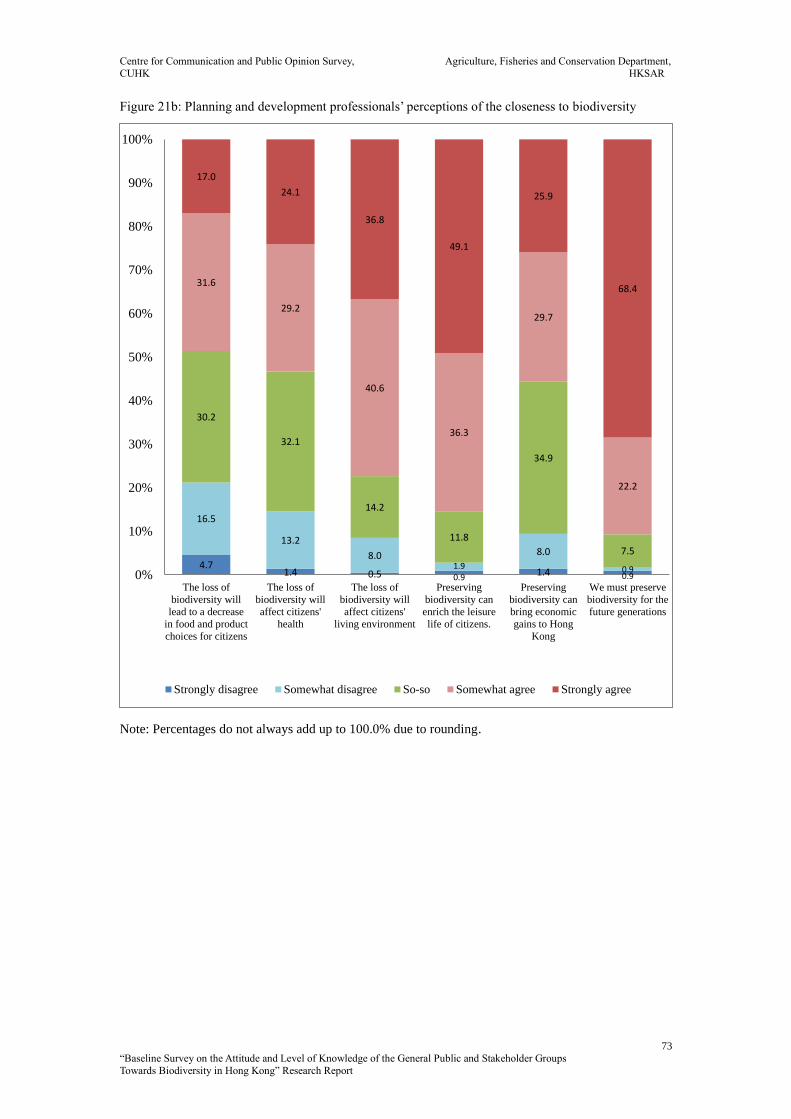
Centre for Communication and Public Opinion Survey, Agriculture, Fisheries and Conservation Department,
CUHK HKSAR
73
“Baseline Survey on the Attitude and Level of Knowledge of the General Public and Stakeholder Groups
Towards Biodiversity in Hong Kong” Research Report
Figure 21b: Planning and development professionals’ perceptions of the closeness to biodiversity
Note: Percentages do not always add up to 100.0% due to rounding.
4.71.4 0.5 0.9
1.4 0.9
16.5
13.2
8.01.9
8.0
0.9
30.2
32.1
14.2
11.8
34.9
7.5
31.6
29.2
40.6
36.3
29.7
22.2
17.0
24.1
36.8
49.1
25.9
68.4
0%
10%
20%
30%
40%
50%
60%
70%
80%
90%
100%
The loss of
biodiversity will
lead to a decrease
in food and product
choices for citizens
The loss of
biodiversity will
affect citizens'
health
The loss of
biodiversity will
affect citizens'
living environment
Preserving
biodiversity can
enrich the leisure
life of citizens.
Preserving
biodiversity can
bring economic
gains to Hong
Kong
We must preserve
biodiversity for the
future generations
Strongly disagree Somewhat disagree So-so Somewhat agree Strongly agree
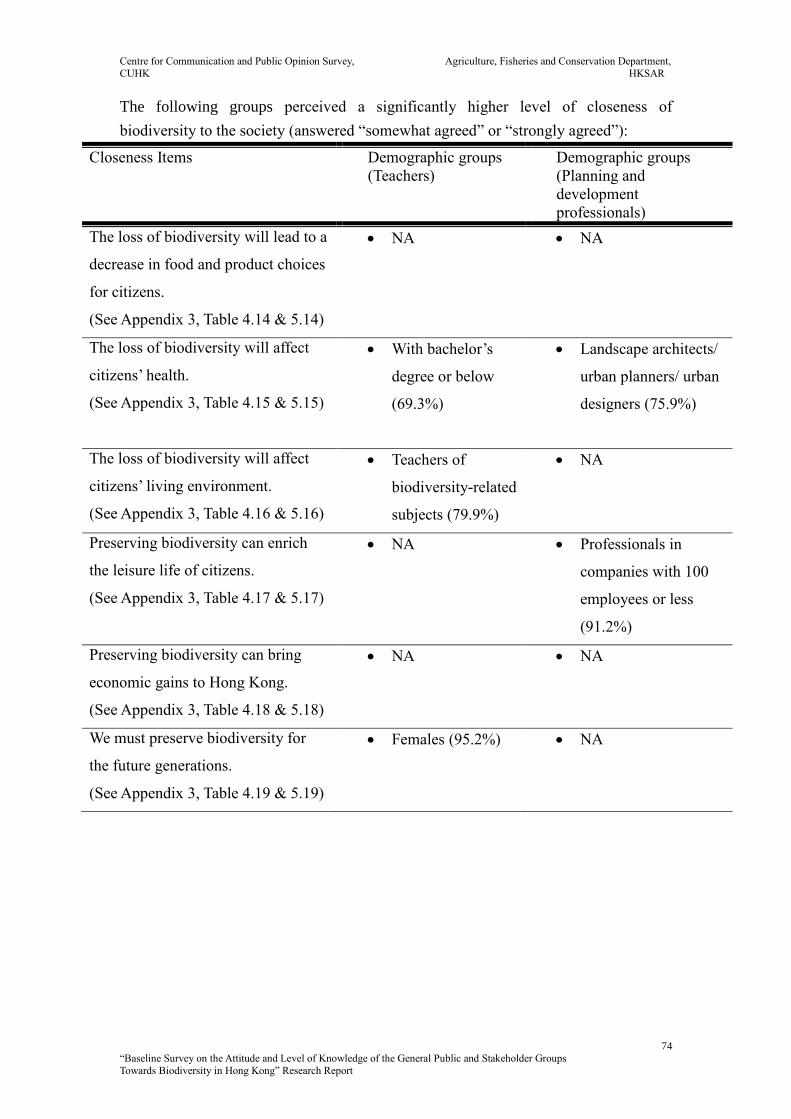
Centre for Communication and Public Opinion Survey, Agriculture, Fisheries and Conservation Department,
CUHK HKSAR
74
“Baseline Survey on the Attitude and Level of Knowledge of the General Public and Stakeholder Groups
Towards Biodiversity in Hong Kong” Research Report
The following groups perceived a significantly higher level of closeness of
biodiversity to the society (answered “somewhat agreed” or “strongly agreed”):
Closeness Items Demographic groups
(Teachers)
Demographic groups
(Planning and
development
professionals)
The loss of biodiversity will lead to a
decrease in food and product choices
for citizens.
(See Appendix 3, Table 4.14 & 5.14)
NA NA
The loss of biodiversity will affect
citizens’ health.
(See Appendix 3, Table 4.15 & 5.15)
With bachelor’s
degree or below
(69.3%)
Landscape architects/
urban planners/ urban
designers (75.9%)
The loss of biodiversity will affect
citizens’ living environment.
(See Appendix 3, Table 4.16 & 5.16)
Teachers of
biodiversity-related
subjects (79.9%)
NA
Preserving biodiversity can enrich
the leisure life of citizens.
(See Appendix 3, Table 4.17 & 5.17)
NA Professionals in
companies with 100
employees or less
(91.2%)
Preserving biodiversity can bring
economic gains to Hong Kong.
(See Appendix 3, Table 4.18 & 5.18)
NA NA
We must preserve biodiversity for
the future generations.
(See Appendix 3, Table 4.19 & 5.19)
Females (95.2%) NA
Centre for Communication and Public Opinion Survey, Agriculture, Fisheries and Conservation Department,
CUHK HKSAR
75
“Baseline Survey on the Attitude and Level of Knowledge of the General Public and Stakeholder Groups
Towards Biodiversity in Hong Kong” Research Report
3.2.4 Willingness to Preserve Biodiversity
Teachers and planning and development professionals were most willing to sign
petitions to support biodiversity conservation and pay attention to information related
to biodiversity. 71.7% of teachers probably would/ definitely would do the former and
68.8% probably would/ definitely would do the latter; while 6.5% and 4.3% of
teachers probably would not/ definitely would not do so. Some 20% (21.7% and
26.8%) of teachers answered “So-so”. For planning and development professionals,
68.9% probably would/ definitely would sign petitions to support biodiversity
conservation and 74.1% probably would/ definitely would pay attention to
information related to biodiversity. 10.4% and 6.1% probably would not/ definitely
would not do so. About 20% (20.8% and 19.8%) answered “So-so”.
Encouraging families or friends to preserve biodiversity was the third action they
were most willing to do. 64.0% of teachers and 67.9% of planning and development
professionals expressed willingness to do so (probably would/ definitely would);
while 7.7% of teachers and 6.6% of planning and development professionals probably
would not/ definitely would not do so. 28.3% of teachers and 25.5% of planning and
development professionals answered “So-so”.
Boycotting products and services that would harm biodiversity came in the fourth
place. 62.3% of teachers and 66.0% of planning and development professionals were
willing to take this action (probably would/ definitely would). 7.2% of teachers and
5.7% of planning and development professionals probably would not/ definitely
would not do so. 30.4% of teachers and 28.3% of planning and development
professionals answered “So-so”.
However, less than half of the teachers probably would/ definitely would participate
Centre for Communication and Public Opinion Survey, Agriculture, Fisheries and Conservation Department,
CUHK HKSAR
76
“Baseline Survey on the Attitude and Level of Knowledge of the General Public and Stakeholder Groups
Towards Biodiversity in Hong Kong” Research Report
in environmental activities related to biodiversity conservation (48.1%) and donate
money to associations dedicated to conserving biodiversity (46.1%). 11.8% and
12.6% of teachers probably would not/ definitely would not take part in the two
actions respectively, while about 40% (40.1% and 41.3%) answered “So-so”.
Similarly, planning and development professionals were least willing to take these
two actions. 51.9% of planning and development professionals indicated that they
probably would/ definitely would participate in environmental activities related to
biodiversity conservation and less than half of them (43.9%) probably would/
definitely would donate money to associations dedicated to conserving biodiversity.
Nearly 20% (18.9% and 19.3%) of them probably would not/ definitely would not
take the two actions respectively. 29.2% and 36.8% of them answered “So-so”. It
seemed that teachers and planning and development professionals tended to be less
willing to take actions that involve a lot of efforts (such as time and money) to
preserve biodiversity.
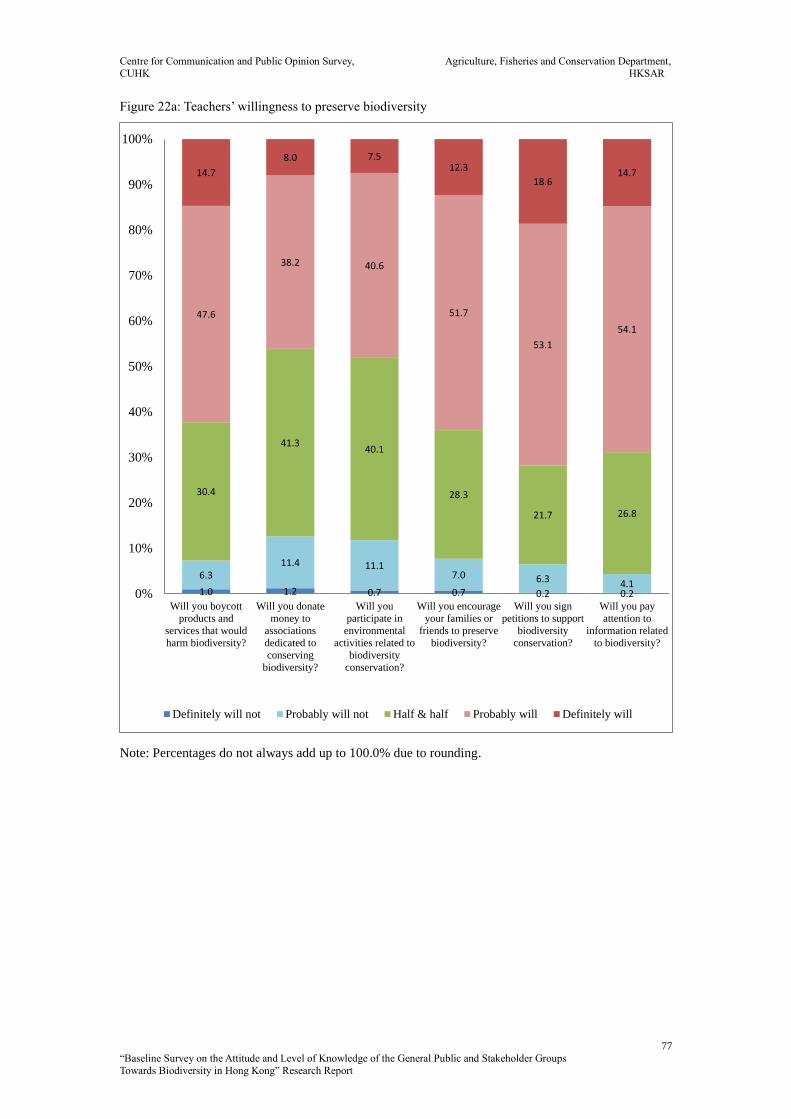
Centre for Communication and Public Opinion Survey, Agriculture, Fisheries and Conservation Department,
CUHK HKSAR
77
“Baseline Survey on the Attitude and Level of Knowledge of the General Public and Stakeholder Groups
Towards Biodiversity in Hong Kong” Research Report
Figure 22a: Teachers’ willingness to preserve biodiversity
Note: Percentages do not always add up to 100.0% due to rounding.
1.0 1.2 0.7 0.7 0.2 0.2
6.311.4 11.1
7.0 6.3 4.1
30.4
41.340.1
28.3
21.7 26.8
47.6
38.2 40.6
51.7
53.1
54.1
14.7
8.0 7.512.3
18.614.7
0%
10%
20%
30%
40%
50%
60%
70%
80%
90%
100%
Will you boycott
products and
services that would
harm biodiversity?
Will you donate
money to
associations
dedicated to
conserving
biodiversity?
Will you
participate in
environmental
activities related to
biodiversity
conservation?
Will you encourage
your families or
friends to preserve
biodiversity?
Will you sign
petitions to support
biodiversity
conservation?
Will you pay
attention to
information related
to biodiversity?
Definitely will not Probably will not Half & half Probably will Definitely will
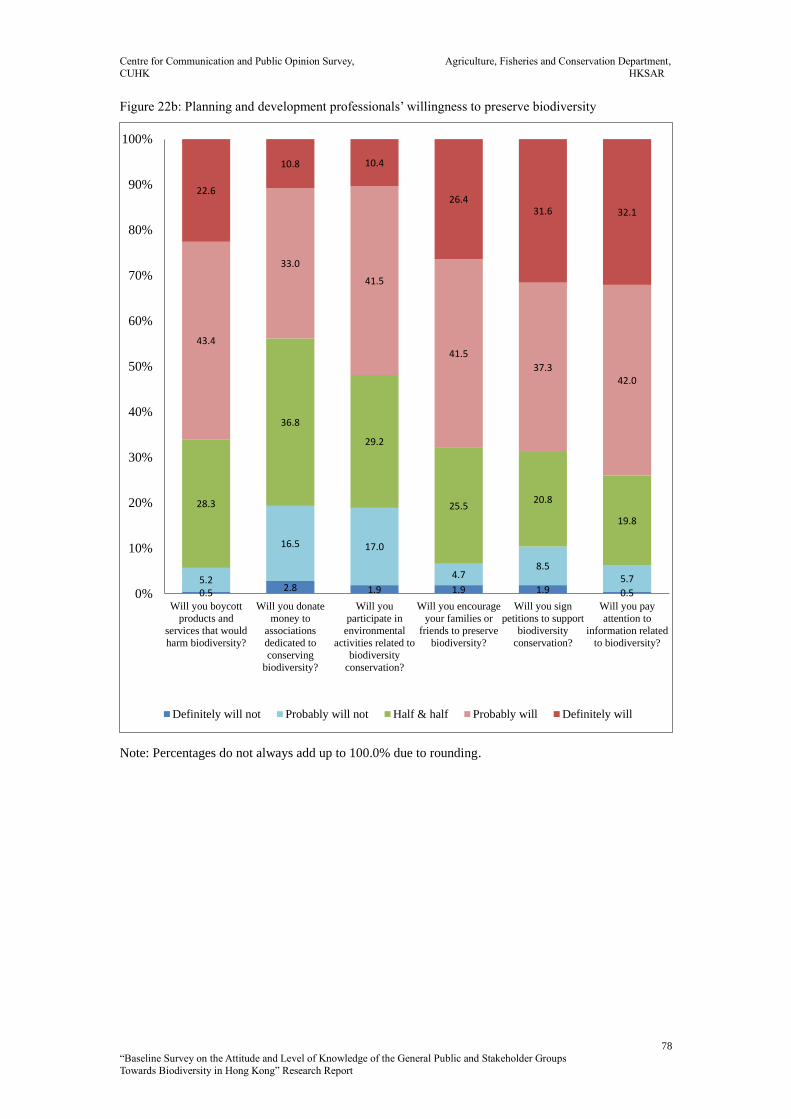
Centre for Communication and Public Opinion Survey, Agriculture, Fisheries and Conservation Department,
CUHK HKSAR
78
“Baseline Survey on the Attitude and Level of Knowledge of the General Public and Stakeholder Groups
Towards Biodiversity in Hong Kong” Research Report
Figure 22b: Planning and development professionals’ willingness to preserve biodiversity
Note: Percentages do not always add up to 100.0% due to rounding.
0.5 2.8 1.9 1.9 1.9 0.55.2
16.5 17.0
4.78.5
5.7
28.3
36.8
29.2
25.520.8
19.8
43.4
33.0
41.5
41.5
37.342.0
22.6
10.8 10.4
26.431.6 32.1
0%
10%
20%
30%
40%
50%
60%
70%
80%
90%
100%
Will you boycott
products and
services that would
harm biodiversity?
Will you donate
money to
associations
dedicated to
conserving
biodiversity?
Will you
participate in
environmental
activities related to
biodiversity
conservation?
Will you encourage
your families or
friends to preserve
biodiversity?
Will you sign
petitions to support
biodiversity
conservation?
Will you pay
attention to
information related
to biodiversity?
Definitely will not Probably will not Half & half Probably will Definitely will
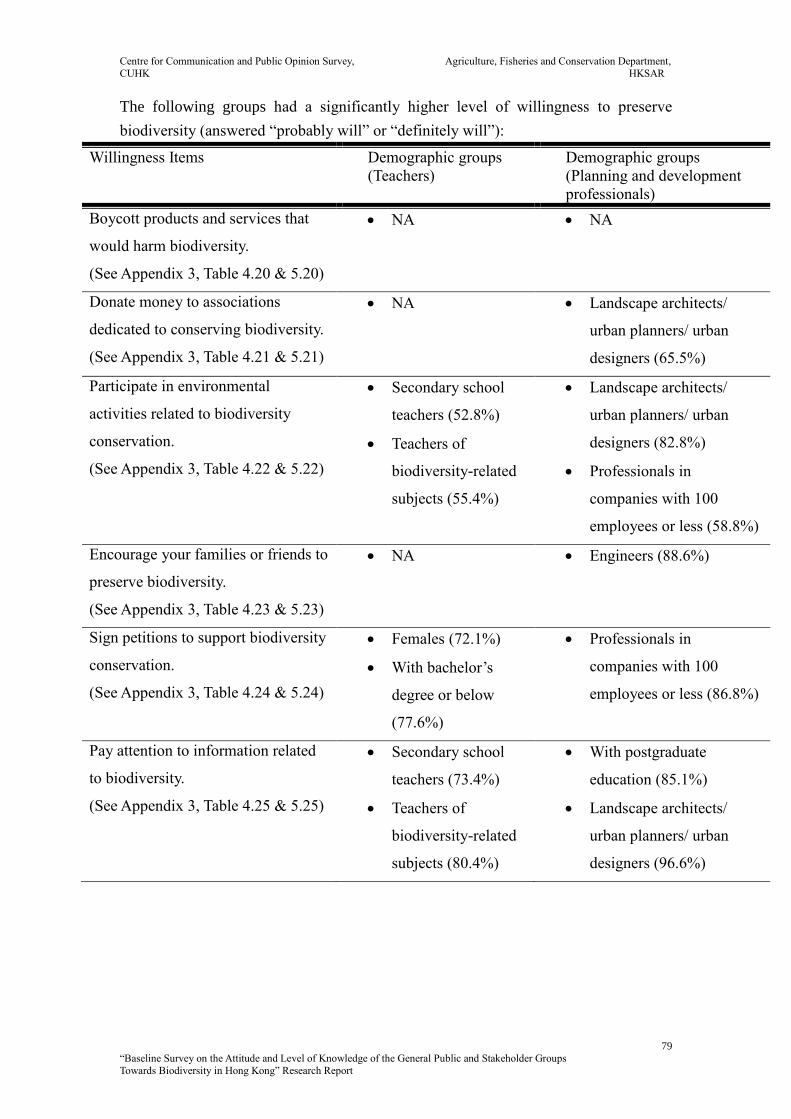
Centre for Communication and Public Opinion Survey, Agriculture, Fisheries and Conservation Department,
CUHK HKSAR
79
“Baseline Survey on the Attitude and Level of Knowledge of the General Public and Stakeholder Groups
Towards Biodiversity in Hong Kong” Research Report
The following groups had a significantly higher level of willingness to preserve
biodiversity (answered “probably will” or “definitely will”):
Willingness Items Demographic groups
(Teachers)
Demographic groups
(Planning and development
professionals)
Boycott products and services that
would harm biodiversity.
(See Appendix 3, Table 4.20 & 5.20)
NA NA
Donate money to associations
dedicated to conserving biodiversity.
(See Appendix 3, Table 4.21 & 5.21)
NA Landscape architects/
urban planners/ urban
designers (65.5%)
Participate in environmental
activities related to biodiversity
conservation.
(See Appendix 3, Table 4.22 & 5.22)
Secondary school
teachers (52.8%)
Teachers of
biodiversity-related
subjects (55.4%)
Landscape architects/
urban planners/ urban
designers (82.8%)
Professionals in
companies with 100
employees or less (58.8%)
Encourage your families or friends to
preserve biodiversity.
(See Appendix 3, Table 4.23 & 5.23)
NA Engineers (88.6%)
Sign petitions to support biodiversity
conservation.
(See Appendix 3, Table 4.24 & 5.24)
Females (72.1%)
With bachelor’s
degree or below
(77.6%)
Professionals in
companies with 100
employees or less (86.8%)
Pay attention to information related
to biodiversity.
(See Appendix 3, Table 4.25 & 5.25)
Secondary school
teachers (73.4%)
Teachers of
biodiversity-related
subjects (80.4%)
With postgraduate
education (85.1%)
Landscape architects/
urban planners/ urban
designers (96.6%)
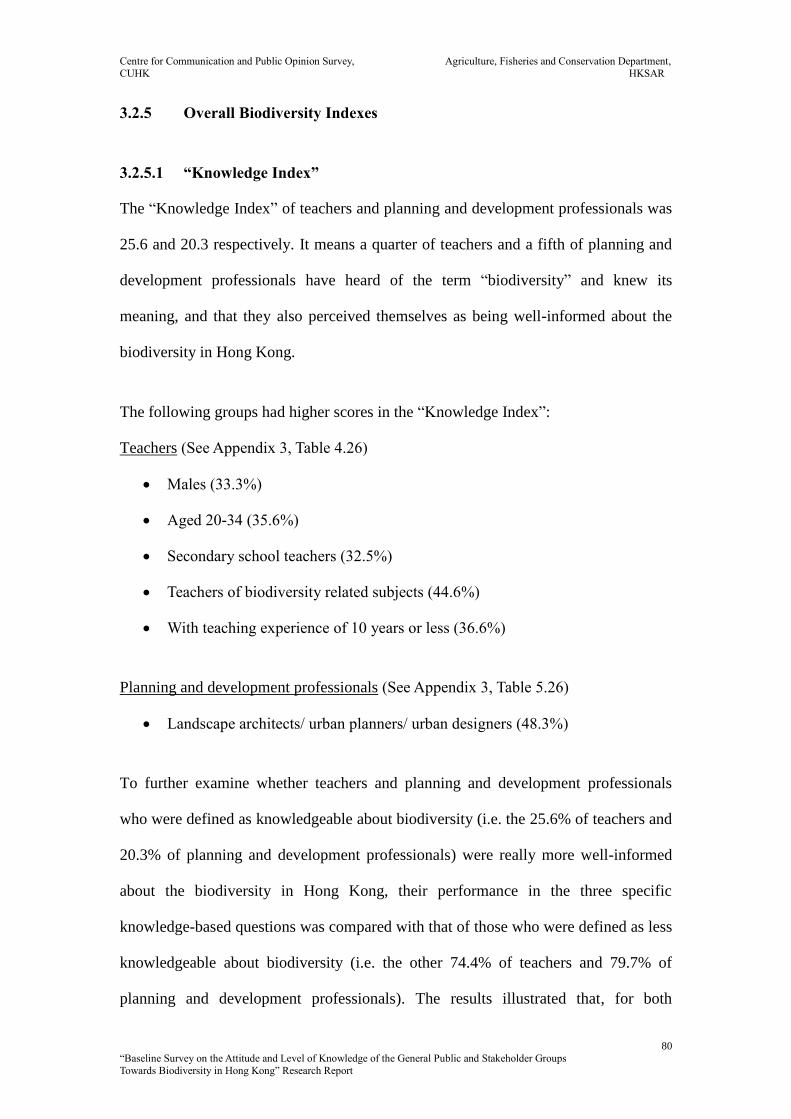
Centre for Communication and Public Opinion Survey, Agriculture, Fisheries and Conservation Department,
CUHK HKSAR
80
“Baseline Survey on the Attitude and Level of Knowledge of the General Public and Stakeholder Groups
Towards Biodiversity in Hong Kong” Research Report
3.2.5 Overall Biodiversity Indexes
3.2.5.1 “Knowledge Index”
The “Knowledge Index” of teachers and planning and development professionals was
25.6 and 20.3 respectively. It means a quarter of teachers and a fifth of planning and
development professionals have heard of the term “biodiversity” and knew its
meaning, and that they also perceived themselves as being well-informed about the
biodiversity in Hong Kong.
The following groups had higher scores in the “Knowledge Index”:
Teachers (See Appendix 3, Table 4.26)
Males (33.3%)
Aged 20-34 (35.6%)
Secondary school teachers (32.5%)
Teachers of biodiversity related subjects (44.6%)
With teaching experience of 10 years or less (36.6%)
Planning and development professionals (See Appendix 3, Table 5.26)
Landscape architects/ urban planners/ urban designers (48.3%)
To further examine whether teachers and planning and development professionals
who were defined as knowledgeable about biodiversity (i.e. the 25.6% of teachers and
20.3% of planning and development professionals) were really more well-informed
about the biodiversity in Hong Kong, their performance in the three specific
knowledge-based questions was compared with that of those who were defined as less
knowledgeable about biodiversity (i.e. the other 74.4% of teachers and 79.7% of
planning and development professionals). The results illustrated that, for both
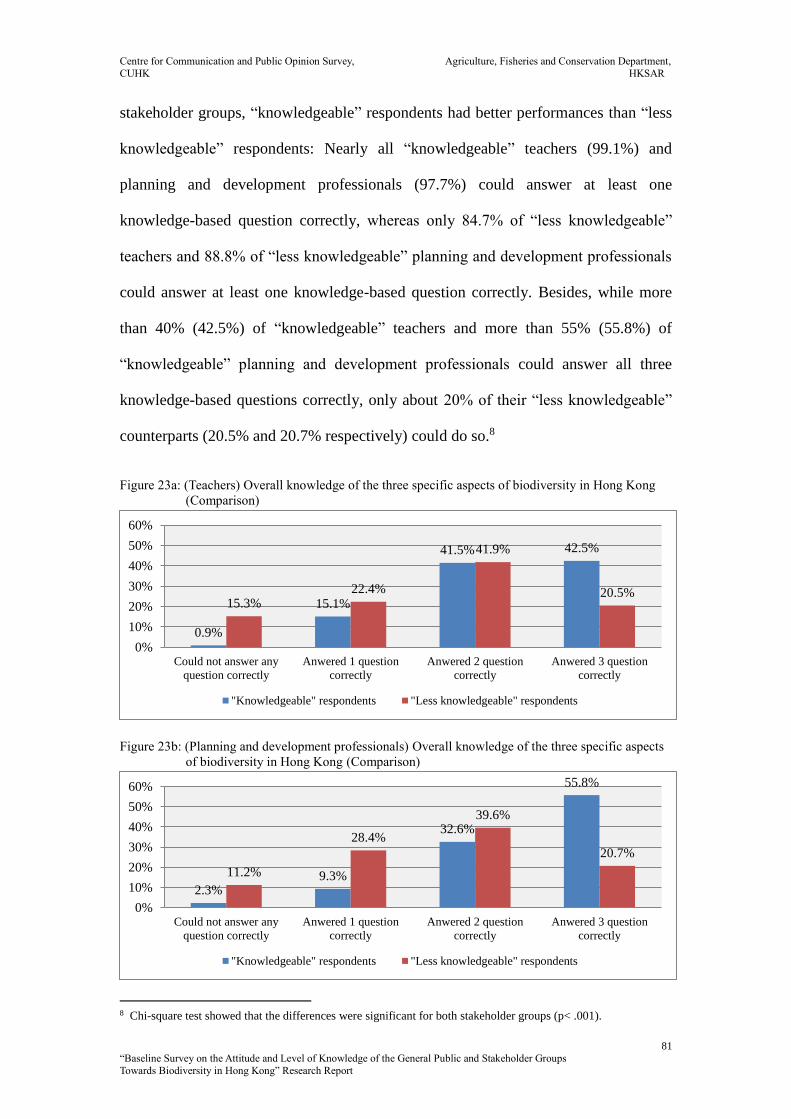
Centre for Communication and Public Opinion Survey, Agriculture, Fisheries and Conservation Department,
CUHK HKSAR
81
“Baseline Survey on the Attitude and Level of Knowledge of the General Public and Stakeholder Groups
Towards Biodiversity in Hong Kong” Research Report
stakeholder groups, “knowledgeable” respondents had better performances than “less
knowledgeable” respondents: Nearly all “knowledgeable” teachers (99.1%) and
planning and development professionals (97.7%) could answer at least one
knowledge-based question correctly, whereas only 84.7% of “less knowledgeable”
teachers and 88.8% of “less knowledgeable” planning and development professionals
could answer at least one knowledge-based question correctly. Besides, while more
than 40% (42.5%) of “knowledgeable” teachers and more than 55% (55.8%) of
“knowledgeable” planning and development professionals could answer all three
knowledge-based questions correctly, only about 20% of their “less knowledgeable”
counterparts (20.5% and 20.7% respectively) could do so.8
Figure 23a: (Teachers) Overall knowledge of the three specific aspects of biodiversity in Hong Kong
(Comparison)
Figure 23b: (Planning and development professionals) Overall knowledge of the three specific aspects
of biodiversity in Hong Kong (Comparison)
8 Chi-square test showed that the differences were significant for both stakeholder groups (p< .001).
0.9%
15.1%
41.5% 42.5%
15.3%22.4%
41.9%
20.5%
0%
10%
20%
30%
40%
50%
60%
Could not answer any
question correctly
Anwered 1 question
correctly
Anwered 2 question
correctly
Anwered 3 question
correctly
"Knowledgeable" respondents "Less knowledgeable" respondents
2.3%9.3%
32.6%
55.8%
11.2%
28.4%
39.6%
20.7%
0%
10%
20%
30%
40%
50%
60%
Could not answer any
question correctly
Anwered 1 question
correctly
Anwered 2 question
correctly
Anwered 3 question
correctly
"Knowledgeable" respondents "Less knowledgeable" respondents

Centre for Communication and Public Opinion Survey, Agriculture, Fisheries and Conservation Department,
CUHK HKSAR
82
“Baseline Survey on the Attitude and Level of Knowledge of the General Public and Stakeholder Groups
Towards Biodiversity in Hong Kong” Research Report
3.2.5.2 “Importance Index”, “Closeness Index” and “Willingness Index”
The respective values of the “Importance Index”, “Closeness Index” and “Willingness
Index” were 4.04, 3.89, and 3.64 for teachers and 4.17, 3.94 and 3.72 for planning and
development professionals. In general, teachers and planning and development
professionals had positive attitude towards biodiversity conservation. They tended to
think that preserving biodiversity is important and agreed that biodiversity was
closely connected to the society in various aspects. They also tended to be willing to
take actions to preserve biodiversity.
Among all three indexes, the two stakeholder groups scored the highest in the
“Importance Index”. This was followed by the “Closeness Index” and both
stakeholder groups scored the lowest in the “Willingness Index”. This suggested that
although members of the two stakeholder groups valued biodiversity conservation,
they were less aware of the connection between biodiversity conservation and the
society. Moreover, although they recognized the importance of biodiversity
conservation and in some point were aware that it was closely connected to the society,
they were less prepared to make personal contributions9.
Figure 24a: (Teachers) The “Importance Index”, “Closeness Index”, and “Willingness Index”
9 The differences among mean scores of the three Indexes were examined using paired-samples t-tests. For the
“teachers” group, it was found that value of “Importance Index” was significantly higher than the values of both
“Closeness Index” (p< .001) and “Willingness Index” (p< .001), and the value of “Closeness Index” was
significantly higher than the value of “Willingness Index” (p< .001). The very same results also apply to the
“planning and development professionals” group.
4.04 3.893.64
0.00
1.00
2.00
3.00
4.00
5.00
Importance Index Closeness Index Willingness Index
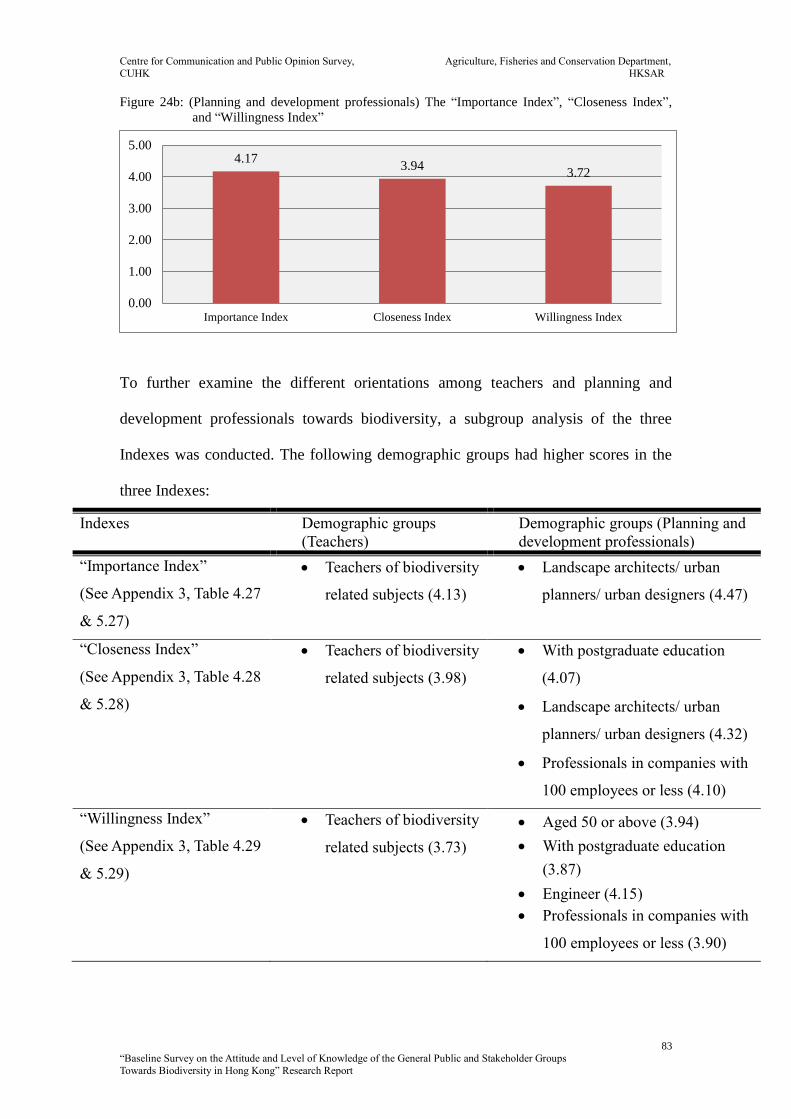
Centre for Communication and Public Opinion Survey, Agriculture, Fisheries and Conservation Department,
CUHK HKSAR
83
“Baseline Survey on the Attitude and Level of Knowledge of the General Public and Stakeholder Groups
Towards Biodiversity in Hong Kong” Research Report
Figure 24b: (Planning and development professionals) The “Importance Index”, “Closeness Index”,
and “Willingness Index”
To further examine the different orientations among teachers and planning and
development professionals towards biodiversity, a subgroup analysis of the three
Indexes was conducted. The following demographic groups had higher scores in the
three Indexes:
Indexes Demographic groups
(Teachers)
Demographic groups (Planning and
development professionals)
“Importance Index”
(See Appendix 3, Table 4.27
& 5.27)
Teachers of biodiversity
related subjects (4.13)
Landscape architects/ urban
planners/ urban designers (4.47)
“Closeness Index”
(See Appendix 3, Table 4.28
& 5.28)
Teachers of biodiversity
related subjects (3.98)
With postgraduate education
(4.07)
Landscape architects/ urban
planners/ urban designers (4.32)
Professionals in companies with
100 employees or less (4.10)
“Willingness Index”
(See Appendix 3, Table 4.29
& 5.29)
Teachers of biodiversity
related subjects (3.73)
Aged 50 or above (3.94)
With postgraduate education
(3.87)
Engineer (4.15)
Professionals in companies with
100 employees or less (3.90)
4.173.94
3.72
0.00
1.00
2.00
3.00
4.00
5.00
Importance Index Closeness Index Willingness Index
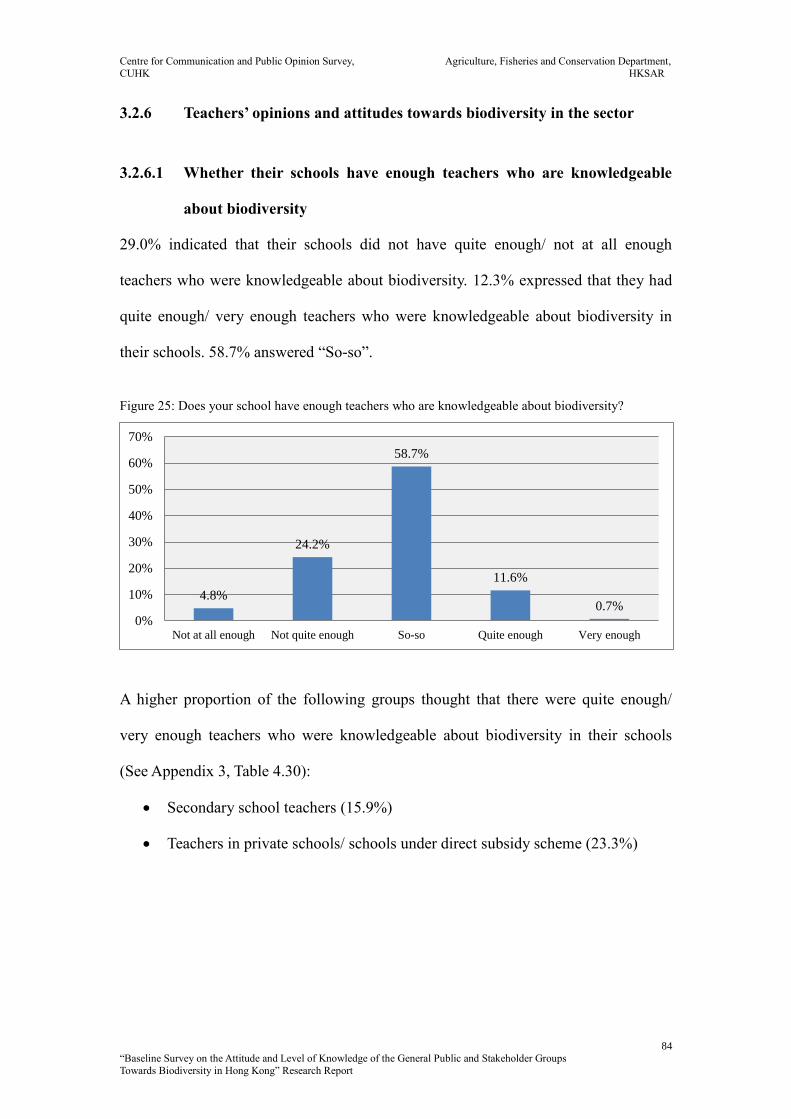
Centre for Communication and Public Opinion Survey, Agriculture, Fisheries and Conservation Department,
CUHK HKSAR
84
“Baseline Survey on the Attitude and Level of Knowledge of the General Public and Stakeholder Groups
Towards Biodiversity in Hong Kong” Research Report
3.2.6 Teachers’ opinions and attitudes towards biodiversity in the sector
3.2.6.1 Whether their schools have enough teachers who are knowledgeable
about biodiversity
29.0% indicated that their schools did not have quite enough/ not at all enough
teachers who were knowledgeable about biodiversity. 12.3% expressed that they had
quite enough/ very enough teachers who were knowledgeable about biodiversity in
their schools. 58.7% answered “So-so”.
Figure 25: Does your school have enough teachers who are knowledgeable about biodiversity?
A higher proportion of the following groups thought that there were quite enough/
very enough teachers who were knowledgeable about biodiversity in their schools
(See Appendix 3, Table 4.30):
Secondary school teachers (15.9%)
Teachers in private schools/ schools under direct subsidy scheme (23.3%)
4.8%
24.2%
58.7%
11.6%
0.7%0%
10%
20%
30%
40%
50%
60%
70%
Not at all enough Not quite enough So-so Quite enough Very enough

Centre for Communication and Public Opinion Survey, Agriculture, Fisheries and Conservation Department,
CUHK HKSAR
85
“Baseline Survey on the Attitude and Level of Knowledge of the General Public and Stakeholder Groups
Towards Biodiversity in Hong Kong” Research Report
3.2.6.2 Whether their schools value teaching students about biodiversity
conservation
22.9% considered their schools did not quite value/ not at all value teaching students
about biodiversity conservation while nearly the same number of teachers (22.2%)
suggested the opposite (quite valued/ very valued). Over half of them (54.8%)
answered “So-so”.
Figure 26: How much does your school value teaching students about biodiversity conservation?
A higher proportion of the following groups thought that their schools quite valued/
very valued biodiversity education (See Appendix 3, Table 4.31):
Teachers of biodiversity-related subjects (25.5%)
With teaching experience of 21 years or more (25.0%)
1.2%
21.7%
54.8%
20.3%
1.9%
0%
10%
20%
30%
40%
50%
60%
70%
Not at all Not quite So-so Quite Very
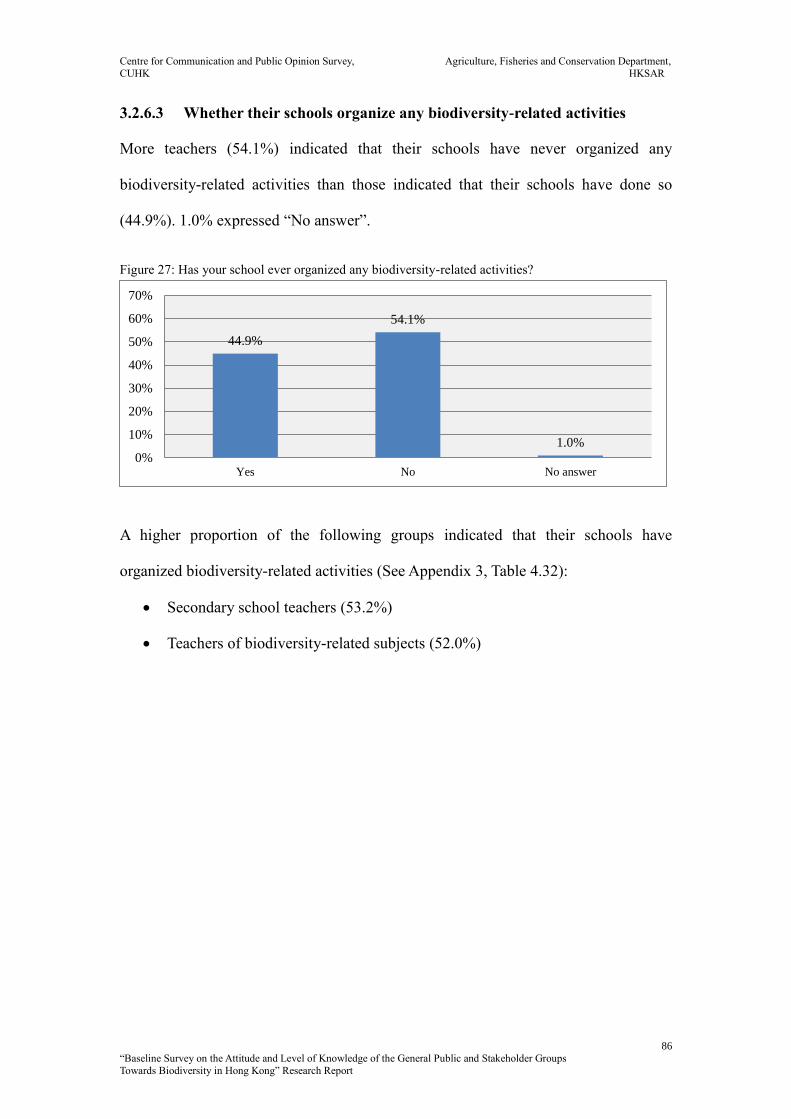
Centre for Communication and Public Opinion Survey, Agriculture, Fisheries and Conservation Department,
CUHK HKSAR
86
“Baseline Survey on the Attitude and Level of Knowledge of the General Public and Stakeholder Groups
Towards Biodiversity in Hong Kong” Research Report
3.2.6.3 Whether their schools organize any biodiversity-related activities
More teachers (54.1%) indicated that their schools have never organized any
biodiversity-related activities than those indicated that their schools have done so
(44.9%). 1.0% expressed “No answer”.
Figure 27: Has your school ever organized any biodiversity-related activities?
A higher proportion of the following groups indicated that their schools have
organized biodiversity-related activities (See Appendix 3, Table 4.32):
Secondary school teachers (53.2%)
Teachers of biodiversity-related subjects (52.0%)
44.9%
54.1%
1.0%
0%
10%
20%
30%
40%
50%
60%
70%
Yes No No answer
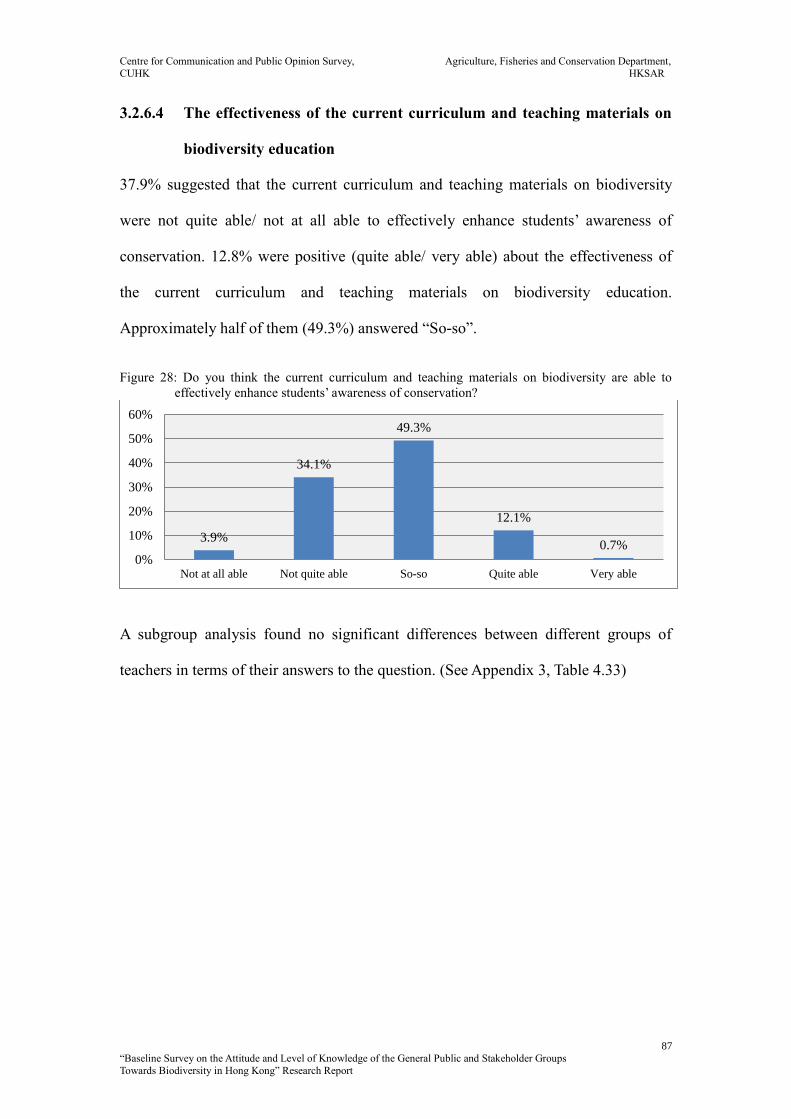
Centre for Communication and Public Opinion Survey, Agriculture, Fisheries and Conservation Department,
CUHK HKSAR
87
“Baseline Survey on the Attitude and Level of Knowledge of the General Public and Stakeholder Groups
Towards Biodiversity in Hong Kong” Research Report
3.2.6.4 The effectiveness of the current curriculum and teaching materials on
biodiversity education
37.9% suggested that the current curriculum and teaching materials on biodiversity
were not quite able/ not at all able to effectively enhance students’ awareness of
conservation. 12.8% were positive (quite able/ very able) about the effectiveness of
the current curriculum and teaching materials on biodiversity education.
Approximately half of them (49.3%) answered “So-so”.
Figure 28: Do you think the current curriculum and teaching materials on biodiversity are able to
effectively enhance students’ awareness of conservation?
A subgroup analysis found no significant differences between different groups of
teachers in terms of their answers to the question. (See Appendix 3, Table 4.33)
3.9%
34.1%
49.3%
12.1%
0.7%0%
10%
20%
30%
40%
50%
60%
Not at all able Not quite able So-so Quite able Very able
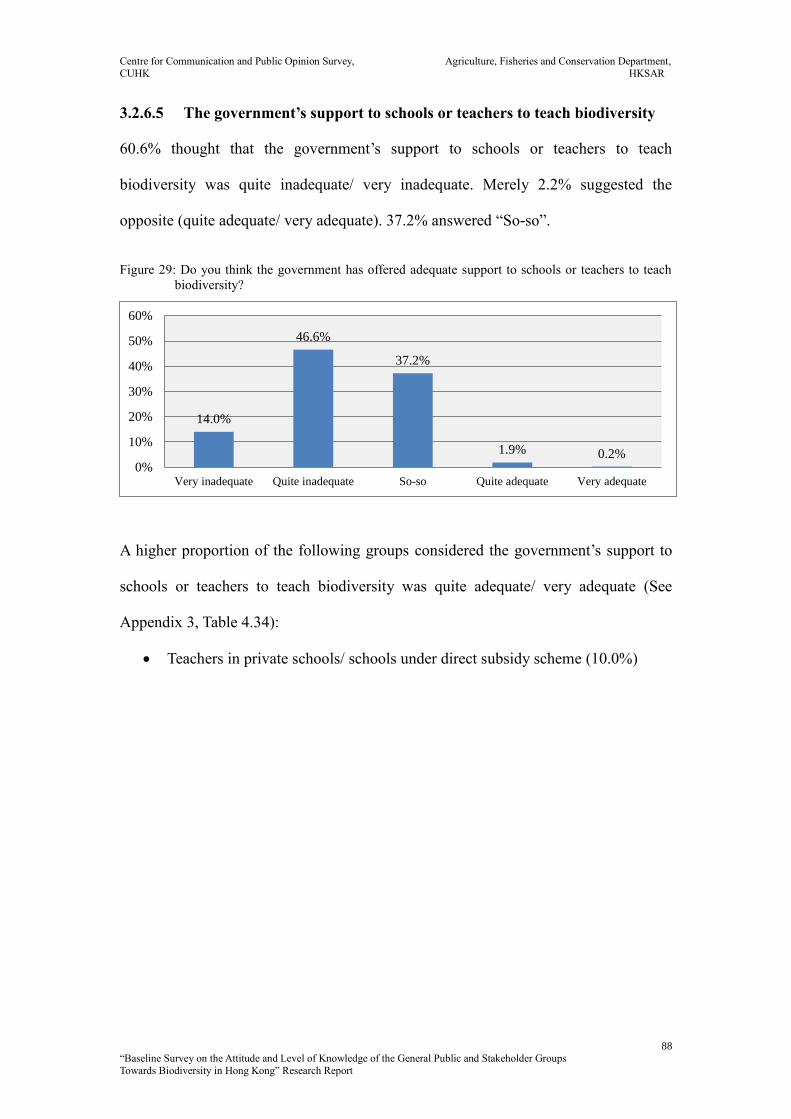
Centre for Communication and Public Opinion Survey, Agriculture, Fisheries and Conservation Department,
CUHK HKSAR
88
“Baseline Survey on the Attitude and Level of Knowledge of the General Public and Stakeholder Groups
Towards Biodiversity in Hong Kong” Research Report
3.2.6.5 The government’s support to schools or teachers to teach biodiversity
60.6% thought that the government’s support to schools or teachers to teach
biodiversity was quite inadequate/ very inadequate. Merely 2.2% suggested the
opposite (quite adequate/ very adequate). 37.2% answered “So-so”.
Figure 29: Do you think the government has offered adequate support to schools or teachers to teach
biodiversity?
A higher proportion of the following groups considered the government’s support to
schools or teachers to teach biodiversity was quite adequate/ very adequate (See
Appendix 3, Table 4.34):
Teachers in private schools/ schools under direct subsidy scheme (10.0%)
14.0%
46.6%
37.2%
1.9% 0.2%0%
10%
20%
30%
40%
50%
60%
Very inadequate Quite inadequate So-so Quite adequate Very adequate

Centre for Communication and Public Opinion Survey, Agriculture, Fisheries and Conservation Department,
CUHK HKSAR
89
“Baseline Survey on the Attitude and Level of Knowledge of the General Public and Stakeholder Groups
Towards Biodiversity in Hong Kong” Research Report
3.2.7 Planning and development professionals’ opinions and attitudes
towards biodiversity in the sector
3.2.7.1 Whether their professional sector is informed about biodiversity
Half (50.5%) of the planning and development professionals considered their
professional sector not quite well-informed/ not at all informed about biodiversity.
12.3% thought that it was quite well-informed/ very well-informed. 37.3% answered
“So-so”.
Figure 30: How informed do you feel your professional sector is about biodiversity?
A higher proportion of the following groups thought that their professional sector was
quite well-informed/ very well-informed about biodiversity (See Appendix 3, Table
5.30):
Aged 50 or above (18.5%)
With postgraduate education (19.5%)
Landscape architects/ urban planners/ urban designers (37.9%)
16.0%
34.4%37.3%
10.4%
1.9%
0%
10%
20%
30%
40%
50%
Not at all informed Not quite well-
informed
So-so Quite well-
informed
Very well-informed
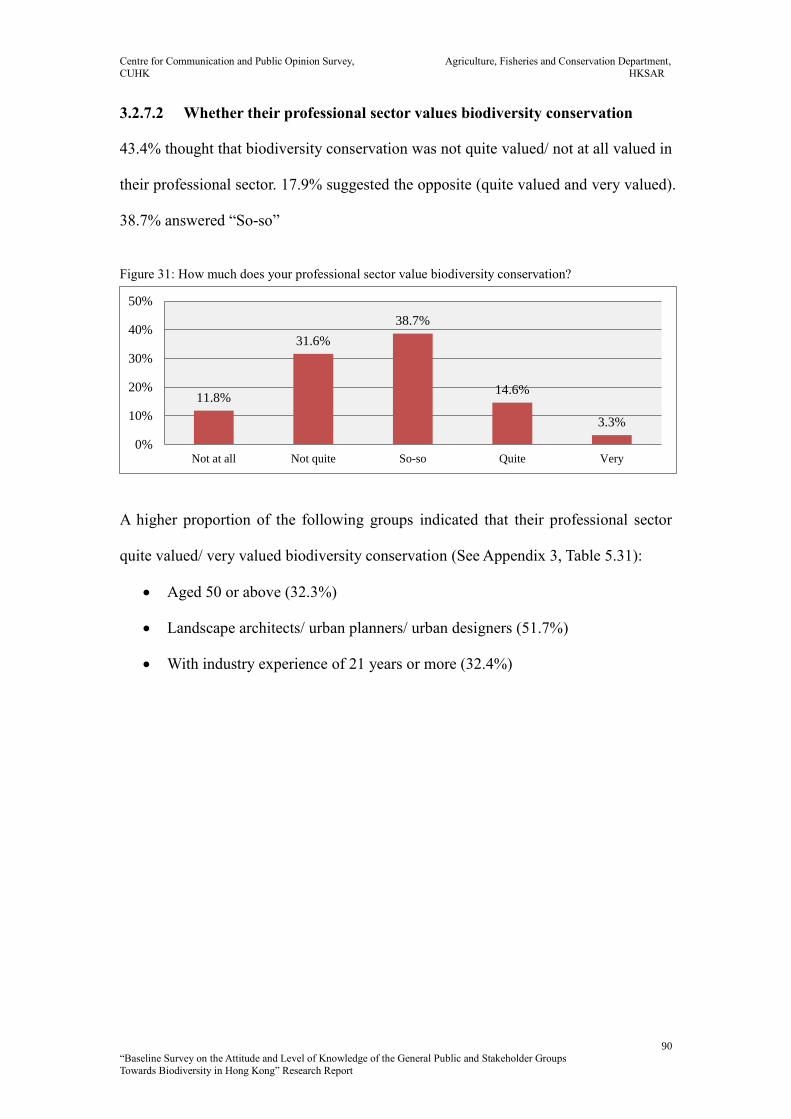
Centre for Communication and Public Opinion Survey, Agriculture, Fisheries and Conservation Department,
CUHK HKSAR
90
“Baseline Survey on the Attitude and Level of Knowledge of the General Public and Stakeholder Groups
Towards Biodiversity in Hong Kong” Research Report
3.2.7.2 Whether their professional sector values biodiversity conservation
43.4% thought that biodiversity conservation was not quite valued/ not at all valued in
their professional sector. 17.9% suggested the opposite (quite valued and very valued).
38.7% answered “So-so”
Figure 31: How much does your professional sector value biodiversity conservation?
A higher proportion of the following groups indicated that their professional sector
quite valued/ very valued biodiversity conservation (See Appendix 3, Table 5.31):
Aged 50 or above (32.3%)
Landscape architects/ urban planners/ urban designers (51.7%)
With industry experience of 21 years or more (32.4%)
11.8%
31.6%
38.7%
14.6%
3.3%
0%
10%
20%
30%
40%
50%
Not at all Not quite So-so Quite Very
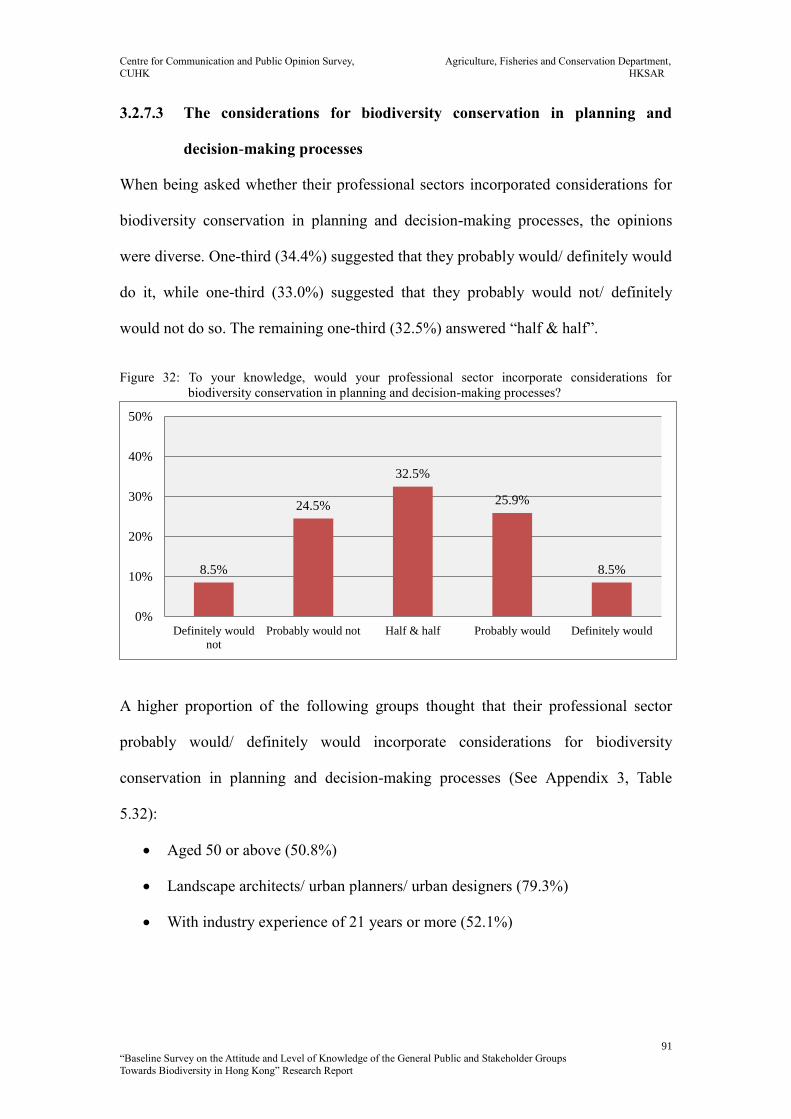
Centre for Communication and Public Opinion Survey, Agriculture, Fisheries and Conservation Department,
CUHK HKSAR
91
“Baseline Survey on the Attitude and Level of Knowledge of the General Public and Stakeholder Groups
Towards Biodiversity in Hong Kong” Research Report
3.2.7.3 The considerations for biodiversity conservation in planning and
decision-making processes
When being asked whether their professional sectors incorporated considerations for
biodiversity conservation in planning and decision-making processes, the opinions
were diverse. One-third (34.4%) suggested that they probably would/ definitely would
do it, while one-third (33.0%) suggested that they probably would not/ definitely
would not do so. The remaining one-third (32.5%) answered “half & half”.
Figure 32: To your knowledge, would your professional sector incorporate considerations for
biodiversity conservation in planning and decision-making processes?
A higher proportion of the following groups thought that their professional sector
probably would/ definitely would incorporate considerations for biodiversity
conservation in planning and decision-making processes (See Appendix 3, Table
5.32):
Aged 50 or above (50.8%)
Landscape architects/ urban planners/ urban designers (79.3%)
With industry experience of 21 years or more (52.1%)
8.5%
24.5%
32.5%
25.9%
8.5%
0%
10%
20%
30%
40%
50%
Definitely would
not
Probably would not Half & half Probably would Definitely would
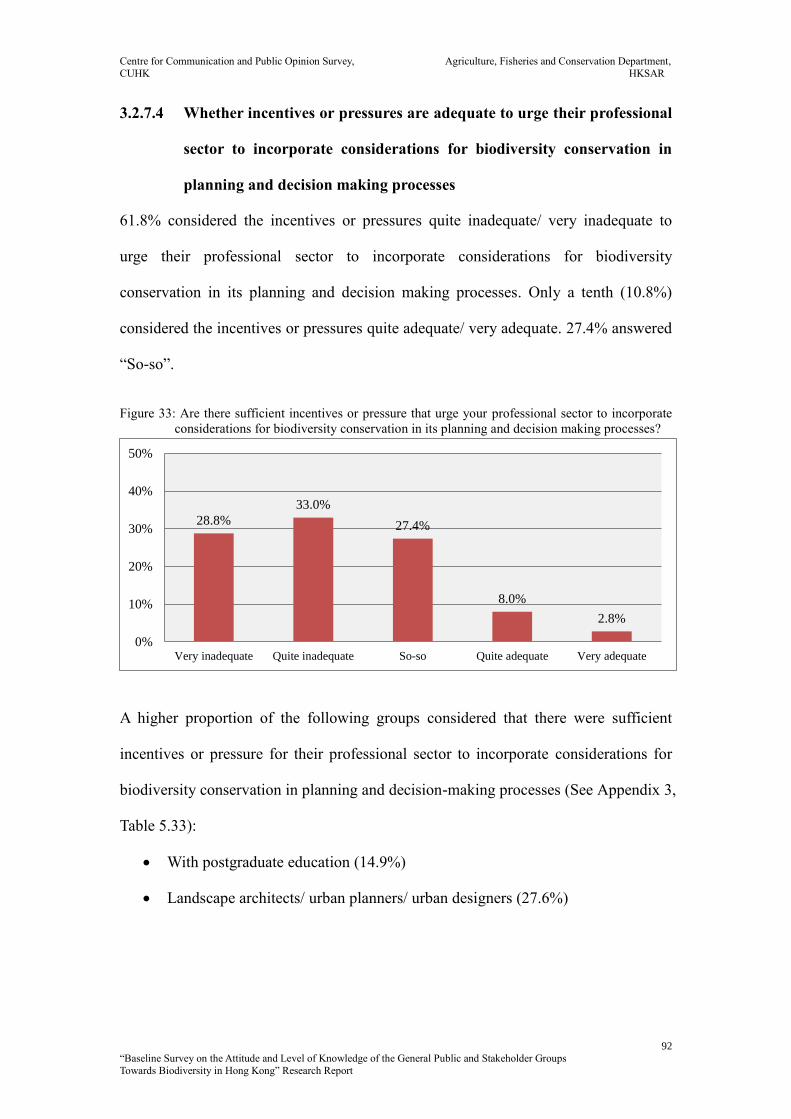
Centre for Communication and Public Opinion Survey, Agriculture, Fisheries and Conservation Department,
CUHK HKSAR
92
“Baseline Survey on the Attitude and Level of Knowledge of the General Public and Stakeholder Groups
Towards Biodiversity in Hong Kong” Research Report
3.2.7.4 Whether incentives or pressures are adequate to urge their professional
sector to incorporate considerations for biodiversity conservation in
planning and decision making processes
61.8% considered the incentives or pressures quite inadequate/ very inadequate to
urge their professional sector to incorporate considerations for biodiversity
conservation in its planning and decision making processes. Only a tenth (10.8%)
considered the incentives or pressures quite adequate/ very adequate. 27.4% answered
“So-so”.
Figure 33: Are there sufficient incentives or pressure that urge your professional sector to incorporate
considerations for biodiversity conservation in its planning and decision making processes?
A higher proportion of the following groups considered that there were sufficient
incentives or pressure for their professional sector to incorporate considerations for
biodiversity conservation in planning and decision-making processes (See Appendix 3,
Table 5.33):
With postgraduate education (14.9%)
Landscape architects/ urban planners/ urban designers (27.6%)
28.8%
33.0%
27.4%
8.0%
2.8%
0%
10%
20%
30%
40%
50%
Very inadequate Quite inadequate So-so Quite adequate Very adequate

Centre for Communication and Public Opinion Survey, Agriculture, Fisheries and Conservation Department,
CUHK HKSAR
93
“Baseline Survey on the Attitude and Level of Knowledge of the General Public and Stakeholder Groups
Towards Biodiversity in Hong Kong” Research Report
3.2.7.5 Views on the government’s job in promoting and educating their
professional sector on biodiversity conservation
70.8% thought that the government did not do an adequate job (very inadequate/ quite
inadequate) to promote and educate their professional sectors on biodiversity
conservation. Only 6.6% thought that the government had done a quite adequate/ very
adequate job. 22.6% answered “So-so”.
Figure 34: Do you think the government has done an adequate job to promote and educate your
professional sector on biodiversity conservation?
A subgroup analysis found no significant differences between different groups of
planning and development professionals in terms of their answers to the question.
(See Appendix 3, Table 5.34)
34.0%36.8%
22.6%
6.1%
0.5%0%
10%
20%
30%
40%
50%
Very inadequate Quite inadequate So-so Quite adequate Very adequate
Centre for Communication and Public Opinion Survey, Agriculture, Fisheries and Conservation Department,
CUHK HKSAR
94
“Baseline Survey on the Attitude and Level of Knowledge of the General Public and Stakeholder Groups
Towards Biodiversity in Hong Kong” Research Report
3.3 Focus Group Discussion (Summary)
(A brief English summary of focus group findings is provided here. The full text in
Chinese is attached in Appendix 4.)
3.3.1 General Public
I. Knowledge towards biodiversity
About half of the focus group participants have heard of the term
“biodiversity” before, mainly through three channels: media, school
education, and participation in activities related to environmental protection
and nature conservation. Most of these participants expressed that they were
not very well-informed about the concept. Among the three aspects of
biodiversity, they were most familiar with species diversity but least
familiar with genetic diversity.
II. Attitude toward biodiversity
Most focus group participants indicated that they cared about biodiversity
for a number of reasons: (1) they cherished the nature; (2) they thought that
biodiversity was closely related to life quality; and (3) they did not wish to
witness the loss or even extinction of species. Some participants were less
concerned about biodiversity because they did not consider it had much to
do with their daily lives. Besides, they did not think that, as ordinary
citizens, they would be able to affect the urban development of the city.
Most focus group participants acknowledged the closeness of biodiversity
to their daily lives. For example, biodiversity would be related to their food
choices, air and water quality, and climate, etc. However, they did not think
that the loss of biodiversity would make many direct and instant impacts on
Centre for Communication and Public Opinion Survey, Agriculture, Fisheries and Conservation Department,
CUHK HKSAR
95
“Baseline Survey on the Attitude and Level of Knowledge of the General Public and Stakeholder Groups
Towards Biodiversity in Hong Kong” Research Report
them, as its negative consequences would only start to surface in a long and
gradual time period. In this regard, they did recognize the long-term
problems of biodiversity loss, and therefore thought that biodiversity should
be conserved for future generations.
Many focus group participants would pay attention to whether their daily
habits would undermine the environment and were willing to take certain
actions (such as reduce household waste, avoid using products that are
harmful to the environment, and educate family members and friends about
environmental protection) to conserve the environment. However, some of
the participants were less willing to do so mainly because they would like to
live a convenient life.
As noted in the methodology section (section 2.3.1), participants of the
“general public” focus groups were categorized into “high”, “medium”, and
“low” groups according to their answers to the “Importance” questions in
the telephone survey. It was found that the three groups exhibited no major
differences in terms of their attitudes towards biodiversity conservation. As
discussed above, most participants were concerned about biodiversity and
thought that it was important to conserve it. However, some nuanced
differences among the three groups could be identified: a very tiny portion
of participants in the “low” group expressed that they actually had not much
concern about biodiversity, whereas no such participants were found in the
other two groups. Besides, participants in the “high” group have expressed
more concern about biodiversity and were more willing to take actions in
their daily lives to conserve biodiversity.
Centre for Communication and Public Opinion Survey, Agriculture, Fisheries and Conservation Department,
CUHK HKSAR
96
“Baseline Survey on the Attitude and Level of Knowledge of the General Public and Stakeholder Groups
Towards Biodiversity in Hong Kong” Research Report
III. Social importance of biodiversity
Focus group participants opined that Hong Kong people generally lacked a
consciousness of environmental protection and a willingness to conserve the
environment. However, they noted that there have been improvements in
recent years, especially among the young people.
Many of them also thought that the Hong Kong government did not value
environmental protection either. In their views, over the years the
government has been placing more emphasis on economic developments at
the expense of nature conservation. Besides, it also lacked determination to
implement environmental protection policies.
Focus group participants held different views towards the relationship
between biodiversity conservation and urban development. Most of them
sensed the seriousness of the housing problem in Hong Kong (i.e., lack of
land supply for housing), but they were divided as to whether solving the
housing problem should come at the expense of biodiversity conservation
(e.g. developing the country parks). While many participants opposed the
development of country parks, some others found it acceptable as it could
mitigate the housing problem. Nevertheless, they all hoped to see the
co-existence of biodiversity conservation and economic development.
Most focus group participants considered that citizens, businesses, and the
government all had the responsibilities of conserving biodiversity. In
particular, the leading role of the government was of utmost importance.
The participants suggested the government to co-operate with businesses to
conserve biodiversity and also make efforts to promote and educate the
public about the issue.
Centre for Communication and Public Opinion Survey, Agriculture, Fisheries and Conservation Department,
CUHK HKSAR
97
“Baseline Survey on the Attitude and Level of Knowledge of the General Public and Stakeholder Groups
Towards Biodiversity in Hong Kong” Research Report
3.3.2 Secondary School Teachers
I. Level of importance of biodiversity education in secondary
schools
Focus group participants opined that, although the current secondary school
curriculum covers biodiversity, generally speaking, secondary schools do
not attach much importance to biodiversity education.
The reasons for this, as explained by the participants, were: (1) there are
limitations in the secondary school curriculum; (2) the school principals
usually prioritize other issues over biodiversity education; and (3) there are
inadequate teachers who were informed about biodiversity.
II. Opinions on teaching materials and the effectiveness of
biodiversity-related curriculum
Focus group participants mainly make use of teaching kits supplied by
publishers and online information as teaching materials.
The opinions of focus group participants were divided as to whether the
current curriculum is able to enhance the students’ consciousness of
environmental protection. While some participants believed that the
students would benefit from the curriculum, others had reservations because
many students only care about exams.
III. Difficulties in organizing biodiversity-related activities in
secondary schools
Focus group participants believed that extra-curricular outdoor activities are
the key to biodiversity education, as it could bring students closer to the
nature.
Centre for Communication and Public Opinion Survey, Agriculture, Fisheries and Conservation Department,
CUHK HKSAR
98
“Baseline Survey on the Attitude and Level of Knowledge of the General Public and Stakeholder Groups
Towards Biodiversity in Hong Kong” Research Report
However, they acknowledged several limitations and difficulties in
organizing such activities: (1) different schools might place different levels
of emphasis on extra-curricular outdoor activities; (2) lack of adequate
manpower and resources; and (3) lack of affordable environmental tours in
the community.
IV. Opinions on government support for biodiversity education in
secondary schools
Focus group participants suggested the government to offer support for
biodiversity education in secondary schools in the following ways: (1) to
strengthen the biodiversity-related curriculum; (2) to set concrete learning
goals; (3) to enhance teacher education and increase teaching resources; (4)
to support biodiversity-related teaching activities in secondary schools; and
(5) to provide incentives for schools, teachers and students.
Centre for Communication and Public Opinion Survey, Agriculture, Fisheries and Conservation Department,
CUHK HKSAR
99
“Baseline Survey on the Attitude and Level of Knowledge of the General Public and Stakeholder Groups
Towards Biodiversity in Hong Kong” Research Report
3.3.3 Planning and Development Professionals
I. Consciousness and level of importance of biodiversity
conservation in the planning and development sector
Focus group participants indicated that the practitioners in the professional
sector are not very conscious of biodiversity conservation and do not attach
much importance to it.
The reasons for this, as explained by the participants, were: (1) the sector
merely acts according to minimum requirements of the law; (2) it prioritizes
economic efficiency over biodiversity conservation; and (3) the sector lacks
adequate understanding of the issue.
II. Incentives and pressures for the planning and development sector
to conserve biodiversity
As mentioned above, the professional sector would only abide by the law
and focus on economic efficiency when undertaking infrastructure projects.
Biodiversity conservation is not their main consideration in the planning
and decision-making process. However, focus group participants noted that
in recent years there has been a growing trend of developers and their
professional sector paying more attention to environmental protection. For
example, they have become increasingly concerned about their
performances in the “Beam Plus”, as this initiative would provide economic
incentives for their infrastructure projects. Besides, they also thought that
developers might value environmental protection as it would be conducive
to corporate branding.
In terms of pressure, focus group participants acknowledged no pressure to
Centre for Communication and Public Opinion Survey, Agriculture, Fisheries and Conservation Department,
CUHK HKSAR
100
“Baseline Survey on the Attitude and Level of Knowledge of the General Public and Stakeholder Groups
Towards Biodiversity in Hong Kong” Research Report
conserve biodiversity. For example, their works would not be swayed by
public opinion.
III. Opinions on government’s efforts in promoting and educating the
planning and development sector on biodiversity
Focus group participants considered that the government had done an
inadequate job to promote and educate the professional sector on
biodiversity.
They advised the government to organize more professional seminars and
make continuous efforts to promote the issue to the practitioners.
IV. Opinions on government support for the implementation of
biodiversity conservation measures in the planning and
development sector
Focus group participants suggested the government support the professional
sector implement biodiversity conservation measures in several ways: (1) to
review the existing environment impact assessment mechanism; (2) to
devise policies to regulate the business sector and the planning and
development sector; (3) to serve as a role model for others to follow; and (4)
to designate the Development Bureau to implement biodiversity
conservation policies.

Centre for Communication and Public Opinion Survey, Agriculture, Fisheries and Conservation Department,
CUHK HKSAR
101
“Baseline Survey on the Attitude and Level of Knowledge of the General Public and Stakeholder Groups
Towards Biodiversity in Hong Kong” Research Report
4 Discussion and Conclusion
Based on the research findings of the telephone survey, online survey and focus group
discussions, this concluding chapter will summarize and discuss the overall findings
of the study.
4.1 Limited Understanding of Biodiversity
First of all, the study has shown a limited understanding of biodiversity among Hong
Kong’s citizens, as indicated by the low value of the “Knowledge Index” (2.4).
Specifically, the telephone survey results demonstrated that over half of Hong Kong
citizens (53.0%) have not heard of the term “biodiversity” (section 3.1.1.1). Besides,
only less than 5% (4.3%) of Hong Kong citizens thought that they were well-informed
about the biodiversity in Hong Kong, whereas more than half of them (53.7%) said
they were not well-informed about the issue (section 3.1.1.2). Likewise, Hong Kong
citizens who participated in focus group discussions also appeared to lack
understanding of the concept of biodiversity. For instance, while some of them knew
that the concept referred to “species diversity”, most of them were not aware of the
other two components of the concept (“genetic diversity” and “ecosystem diversity”).
Compared to the general public, the two stakeholder groups seemed to have a better
understanding of biodiversity. The online survey found that the respective values of
“Knowledge Index” of teachers and planning and development professionals were
25.6 and 20.3 (section 3.2.5.1). However, as noted in the methodology section
(section 2.2.2), due to the self-selection bias of the sampling method of the online
survey, respondents who were more knowledgeable about biodiversity tended to be
over-represented in the sample. Therefore, these results should be interpreted with

Centre for Communication and Public Opinion Survey, Agriculture, Fisheries and Conservation Department,
CUHK HKSAR
102
“Baseline Survey on the Attitude and Level of Knowledge of the General Public and Stakeholder Groups
Towards Biodiversity in Hong Kong” Research Report
caution. Indeed, a closer look at other question items in the online survey and the
focus group findings would reveal a lack of adequate understanding of biodiversity in
the two sectors. Results of the online survey demonstrated that, only about 12%
(12.3%) of teachers thought that their schools had enough teachers who were
knowledgeable about biodiversity (section 3.2.6.1). Similarly, around 12% (12.3%) of
planning and development professionals considered their professional sector
well-informed about biodiversity (section 3.2.7.1). These survey results echoed the
focus group findings. In the focus group discussion with teachers, participants
indicated that most teachers, except those teaching related subjects (e.g. Geography,
Biology, Science, General Studies/ Liberal Studies) were generally were not
well-informed about the issue. Planning and development professionals participating
in the focus groups noted a dearth of understanding of biodiversity among the
practitioners in the field.
4.2 Lack of Societal Concern about Biodiversity
The study has revealed a lack of societal concern about biodiversity in Hong Kong.
Only about 15% (14.8%) of Hong Kong citizens have indicated their concern for the
biodiversity in Hong Kong, as found by the telephone survey (section 3.1.2.1). In the
focus group discussions with the general public, many participants expressed notable
personal concern about biodiversity conservation for various reasons (i.e. cherishing
the nature; maintaining quality of life; and preventing the loss and extinction of
species). However, they perceived a relatively lack of concern about biodiversity
conservation in the society at large. They attributed this phenomenon to the lifestyle
of Hong Kong citizens, who often prioritized convenience and consumerism over
environmental protection.
Centre for Communication and Public Opinion Survey, Agriculture, Fisheries and Conservation Department,
CUHK HKSAR
103
“Baseline Survey on the Attitude and Level of Knowledge of the General Public and Stakeholder Groups
Towards Biodiversity in Hong Kong” Research Report
A general lack of concern about biodiversity could also be discerned in the two
stakeholder groups. While in the online survey a considerable amount of teachers
(37.2%) and planning and development professionals (56.6%) expressed that they
were personally concerned about the biodiversity in Hong Kong (section 3.2.2.1),
they suggested a different scenario in their respective fields at large. In the education
sector, only a small portion (22.2%) of teachers conceived that their schools valued
teaching students about biodiversity conservation (section 3.2.6.2). Besides, over half
of the teachers (54.1%) said that their schools have not organized any
biodiversity-related activities (section 3.2.6.3). In the focus group discussion with
teachers, the participants pointed out various reasons that have hindered biodiversity
education in secondary schools − limitations of biodiversity-related curriculum;
school principals usually prioritized other issues over biodiversity education; and a
lack of teachers who are knowledgeable about biodiversity.
Similarly, there was only a small size (17.9%) of planning and development
professionals who thought that their professional sector valued biodiversity
conservation (section 3.2.7.2). Besides, just more than one-third (34.4%) of them
suggested that their professional sector would incorporate considerations for
biodiversity conservation in planning and decision-making processes (section 3.2.7.3).
In the focus group with planning and development professionals, participants
explained that their professional sector did not attach much importance to biodiversity
conservation because the sector merely acted according to minimum requirements of
the law regarding environmental protection; it prioritized economic efficiency over
biodiversity conservation; and it basically lacked adequate understanding of
biodiversity. All these have undermined the consciousness and willingness of the
professional sector to conserve biodiversity.

Centre for Communication and Public Opinion Survey, Agriculture, Fisheries and Conservation Department,
CUHK HKSAR
104
“Baseline Survey on the Attitude and Level of Knowledge of the General Public and Stakeholder Groups
Towards Biodiversity in Hong Kong” Research Report
4.3 Gap between Knowledge, Attitude and Behavior in Biodiversity
Conservation The study has identified a discrepancy between people’s knowledge and attitude
towards biodiversity. While people lacked knowledge about biodiversity, a large
percentage of them considered biodiversity conservation important to them. A
possible explanation for this is that although people might not regard themselves as
knowledgeable about biodiversity specifically, they might have a general sense that
biodiversity was closely related to environmental protection, which has a widespread
support in Hong Kong. For example, in the focus groups, some members of the public
noted that they would undertake certain pro-environment actions (such as reducing
household waste, recycling, and avoiding non-environmental friendly products) for
the sake of protecting environment in general, but without knowing whether these
actions had anything to do with the conservation of biodiversity.
Besides, the research findings have also revealed a gap between the attitude and
behavior of Hong Kong citizens in biodiversity conservation. This was indicated by
the significant differences between the “Importance Index” (3.84), “Closeness Index”
(3.70) and “Willingness Index” (3.28), as explained in the following paragraphs.
Hong Kong citizens have expressed a high level of recognition of the importance to
preserve biodiversity (section 3.1.2). In the telephone survey, about 70% (71.6%) of
respondents indicated that public promotion and education on biodiversity was
important. Similarly, about 70% (70.6%) of respondents stated that biodiversity
conservation must be taken into account when undertaking infrastructure and land
development projects. Besides, around 70% to 80% of respondents thought that the
government, businesses and Hong Kong citizens had their own responsibilities to
Centre for Communication and Public Opinion Survey, Agriculture, Fisheries and Conservation Department,
CUHK HKSAR
105
“Baseline Survey on the Attitude and Level of Knowledge of the General Public and Stakeholder Groups
Towards Biodiversity in Hong Kong” Research Report
preserve the biodiversity of Hong Kong. All these results suggest a pretty consistent
view of Hong Kong citizens towards various aspects of the importance of biodiversity
preservation.
However, Hong Kong citizens have expressed mixed views about the closeness of
biodiversity to the society (section 3.1.3). In the telephone survey, respondents
evaluated the closeness of biodiversity to different aspects of the society in varying
degrees: most respondents (80.8%) agreed that biodiversity has to be preserved for
future generations; some 60% (64.9%) thought that preserving biodiversity could
enrich the leisure life of citizens; close to half of the respondents suggested that the
loss of biodiversity would affect people’s health (48.4%) and would lead to a decrease
in food and product choices for citizens (47.8%); and the least amount of respondents
indicated that biodiversity conservation could bring economic gains to Hong Kong
(40.8%). In the focus groups, participants explained their discrepancies in evaluating
the closeness of biodiversity. It is found that they generally recognized the long-term
significance of biodiversity conservation for the sustainable development of the city,
and hence the need to conserve biodiversity for future generations. However, many of
them did not acknowledge the loss of biodiversity as an urgent problem for they
believed the loss of biodiversity would not affect their present lives and the society at
large immediately.
Compared to the relatively higher levels of recognitions of the importance of
biodiversity conservation and the closeness of biodiversity to the society, Hong Kong
citizens have expressed a lower level of willingness in making personal efforts to
conserve biodiversity (section 3.1.4). Over half of the respondents in the telephone
survey indicated that they were willing to sign petitions to support biodiversity

Centre for Communication and Public Opinion Survey, Agriculture, Fisheries and Conservation Department,
CUHK HKSAR
106
“Baseline Survey on the Attitude and Level of Knowledge of the General Public and Stakeholder Groups
Towards Biodiversity in Hong Kong” Research Report
conservation (56.2%) and to encourage families and friends to conserve biodiversity
(54.4%). However, less than half of the respondents were willing to boycott products
and services that would harm biodiversity (40.1%), pay attention to information
related to biodiversity (39.3%), donate money to associations dedicated to conserving
biodiversity (27.8%), and participate in environmental activities related to
biodiversity conservation (21.3%). In the focus groups, participants discussed the
attitude-behavior gap of Hong Kong citizens in biodiversity conservation. While
many participants would take certain actions to preserve biodiversity, some of them,
though recognizing the importance of biodiversity conservation, were less willing to
make personal efforts to preserve biodiversity due to laziness and lack of a sense of
efficacy (i.e. do not believe individual actions matter). With regard to the public in
general, as mentioned in earlier sections, participants thought that Hong Kong citizens
generally were quite reluctant to make efforts to conserve biodiversity as they have
attached more importance to convenience and efficiency than environmental
protection.
For the two stakeholder groups, a similar gap between attitude and behavior in
biodiversity conservation also existed, which was demonstrated by the significant
differences between the three Indexes in the online survey (section 3.2.5.2). The
pattern observed was similar to that of the general public.
4.4 Importance of Collaborative Efforts
One major finding of the study is that the general public and the two stakeholder
groups generally thought that collaborative efforts are the key to biodiversity
conservation in Hong Kong. For the general public, the telephone survey found that
about 80% of respondents opined that the Hong Kong government had a huge
Centre for Communication and Public Opinion Survey, Agriculture, Fisheries and Conservation Department,
CUHK HKSAR
107
“Baseline Survey on the Attitude and Level of Knowledge of the General Public and Stakeholder Groups
Towards Biodiversity in Hong Kong” Research Report
responsibility to conserve the biodiversity in Hong Kong (79.3%) and that citizens
had a responsibility to change their daily habits so as to conserve the biodiversity in
Hong Kong (78.8%). Besides, about 70% (70.5%) of respondents indicated that the
business sector also had its share of responsibility (section 3.1.2.2). These data
resonate with the findings identified in focus groups, where many participants
suggested that all three parties had their relevant responsibilities to contribute to
biodiversity conservation.
Overall speaking, the general public demanded the government to assume a leading
role in biodiversity conservation. It was suggested that the government, as the largest
developer in Hong Kong, could create exemplar public infrastructure projects that
implement biodiversity conservation measures at the highest standards. Doing so will
demonstrate the government’s commitment to biodiversity conservation and send out
a clear message to the public that infrastructural developments could be done without
at the expense of biodiversity conservation.
In addition to the government’s own efforts, members of the general public also
envisioned the business sector and the society at large to play important roles in the
collective endeavor of conserving biodiversity in Hong Kong with the support of the
government. For the latter, more efforts have to be paid to public education and
promotion, which would be the key to the enhancement of citizens’ knowledge and
awareness towards biodiversity and to the long-term facilitation of biodiversity
conservation in Hong Kong. As for the business sector, the general public believed
that it also had an unavoidable responsibility to help conserve biodiversity. In focus
groups, some participants attributed the businesses as a main culprit of environmental
degradation. The businesses were accused of prioritizing their vested interests at the
Centre for Communication and Public Opinion Survey, Agriculture, Fisheries and Conservation Department,
CUHK HKSAR
108
“Baseline Survey on the Attitude and Level of Knowledge of the General Public and Stakeholder Groups
Towards Biodiversity in Hong Kong” Research Report
expense of environmental protection for a long time. Hence, they had the obligation to
right the wrongs. In this regard, the government could consider enforcing tougher
environmental regulations on the business sector. At the same time, it could also
provide more incentives to engage the business sector in environmental protection.
The views regarding the importance of collaborative efforts were also shared by the
two stakeholder groups. Similar to the general public, the two stakeholder groups
have also demanded for stronger government leadership to facilitate and support their
respective sectors to engage in the collaborative efforts of biodiversity conservation.
Yet, both stakeholder groups conceived government’s support to them insufficient:
About 60% (60.6%) of teachers thought that inadequate support was provided by the
government to teachers and schools to teach biodiversity (section 3.2.6.5). Besides,
about 70% (70.8%) of planning and development professionals considered an
inadequate job by the government in promoting and educating their professional
sector on biodiversity conservation (section 3.2.7.5).
In view of the lack of adequate understanding of biodiversity in their sectors, both the
teachers and planning and development professionals expressed that they would like
to have more professional training opportunities so as to equip themselves with
necessary knowledge about biodiversity.
To enhance biodiversity education in schools, the teachers suggested strengthening
the biodiversity-related curriculum, stipulating concrete learning goals of biodiversity
education, increasing manpower and resources for teaching biodiversity in schools,
providing support for schools to organize biodiversity-related teaching activities, and
offering incentives to schools, teachers and students to engage in biodiversity
education.
Centre for Communication and Public Opinion Survey, Agriculture, Fisheries and Conservation Department,
CUHK HKSAR
109
“Baseline Survey on the Attitude and Level of Knowledge of the General Public and Stakeholder Groups
Towards Biodiversity in Hong Kong” Research Report
For helping the planning and development sector to better understand biodiversity and
incorporate biodiversity conservation measures in infrastructure projects, the
practitioners advised the government to make continuous efforts to promote the issue
of biodiversity to the sector, such as organizing more professional seminars to educate
practitioners about biodiversity. Besides, the government could also raise the
awareness of biodiversity conservation in the sector through legal and policy means,
such as by strengthening biodiversity-related components in the existing environment
impact assessment mechanism, and devising policies to guide and encourage the
business sector and the planning and development sector to implement biodiversity
conservation measures.
All in all, both the general public and the two stakeholder groups have recognized the
importance of collaborative efforts to biodiversity conservation in Hong Kong. To this
end, the government is expected to be a leader and a facilitator to devise and
implement policies and supportive measures to help and rally different social sectors
to conserve biodiversity together.

Centre for Communication and Public Opinion Survey, Agriculture, Fisheries and Conservation Department,
CUHK HKSAR
110
“Baseline Survey on the Attitude and Level of Knowledge of the General Public and Stakeholder Groups
Towards Biodiversity in Hong Kong” Research Report
Appendix 1
Questionnaires and
Discussion Guides

Centre for Communication and Public Opinion Survey, Agriculture, Fisheries and Conservation Department,
CUHK HKSAR
111
“Baseline Survey on the Attitude and Level of Knowledge of the General Public and Stakeholder Groups
Towards Biodiversity in Hong Kong” Research Report
Questionnaire for Telephone Survey
Centre for Communication and Public Opinion Survey
School of Journalism and Communication
The Chinese University of Hong Kong
Telephone Survey on the Attitude and Knowledge of the General Public towards
Biodiversity in Hong Kong
Part 1 Sampling & Confirmation
Introduction
Good evening. This is the Centre for Communication and Public Opinion Survey at the Chinese
University of Hong Kong. We are conducting an opinion survey on “Hong Kong Society and
Environment”. The survey is commissioned by the Agriculture, Fisheries & Conservation
Department of the HKSAR Government. May I take a moment to ask you a few questions? We
would highly appreciate your assistance.
Sampling
First, we have to randomly select a member in your family for this interview.
Could you please tell us, how many family members are aged between 15 and 64 in your
household, excluding domestic helper?
【If there is only one eligible respondent, interview him/her.】
【If there are more than one eligible respondent:
“In order to randomly select a respondent, we would like to interview the family member
whose birthday will come the soonest.”】
Confirmation
Just as a confirmation, are you currently a Hong Kong resident aged between 15 and 64,
Sir/Madam?
1. Yes
2. No【“Sorry, but we only interview Hong Kong residents aged between 15 and 64.” -
Back to ‘Sampling’】
DM1. Gender: 【No need to ask】
1. Male
2. Female
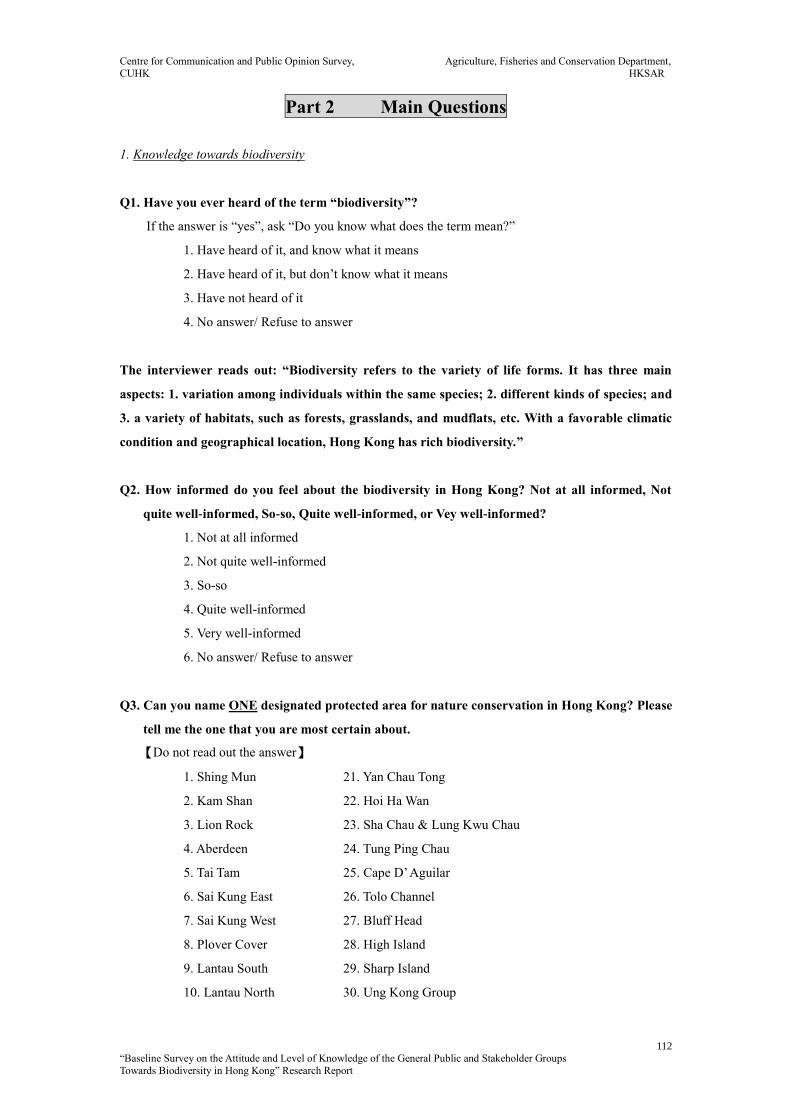
Centre for Communication and Public Opinion Survey, Agriculture, Fisheries and Conservation Department,
CUHK HKSAR
112
“Baseline Survey on the Attitude and Level of Knowledge of the General Public and Stakeholder Groups
Towards Biodiversity in Hong Kong” Research Report
Part 2 Main Questions
1. Knowledge towards biodiversity
Q1. Have you ever heard of the term “biodiversity”?
If the answer is “yes”, ask “Do you know what does the term mean?”
1. Have heard of it, and know what it means
2. Have heard of it, but don’t know what it means
3. Have not heard of it
4. No answer/ Refuse to answer
The interviewer reads out: “Biodiversity refers to the variety of life forms. It has three main
aspects: 1. variation among individuals within the same species; 2. different kinds of species; and
3. a variety of habitats, such as forests, grasslands, and mudflats, etc. With a favorable climatic
condition and geographical location, Hong Kong has rich biodiversity.”
Q2. How informed do you feel about the biodiversity in Hong Kong? Not at all informed, Not
quite well-informed, So-so, Quite well-informed, or Vey well-informed?
1. Not at all informed
2. Not quite well-informed
3. So-so
4. Quite well-informed
5. Very well-informed
6. No answer/ Refuse to answer
Q3. Can you name ONE designated protected area for nature conservation in Hong Kong? Please
tell me the one that you are most certain about.
【Do not read out the answer】
1. Shing Mun 21. Yan Chau Tong
2. Kam Shan 22. Hoi Ha Wan
3. Lion Rock 23. Sha Chau & Lung Kwu Chau
4. Aberdeen 24. Tung Ping Chau
5. Tai Tam 25. Cape D’ Aguilar
6. Sai Kung East 26. Tolo Channel
7. Sai Kung West 27. Bluff Head
8. Plover Cover 28. High Island
9. Lantau South 29. Sharp Island
10. Lantau North 30. Ung Kong Group
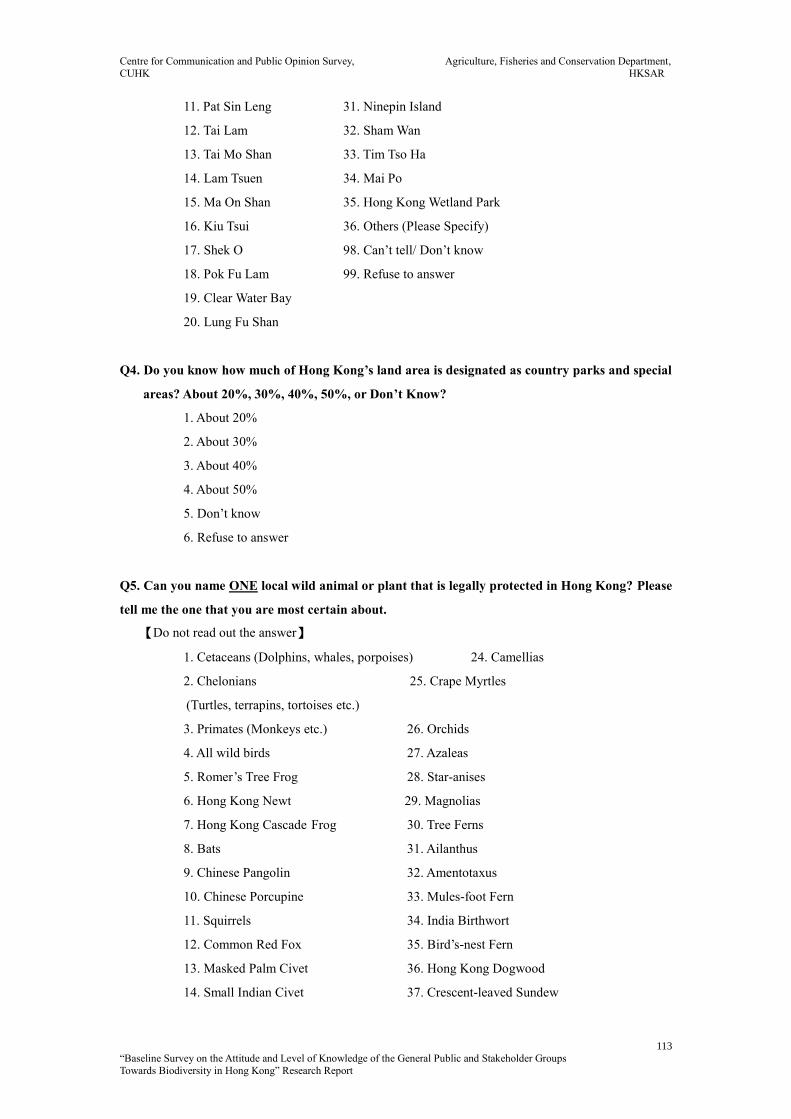
Centre for Communication and Public Opinion Survey, Agriculture, Fisheries and Conservation Department,
CUHK HKSAR
113
“Baseline Survey on the Attitude and Level of Knowledge of the General Public and Stakeholder Groups
Towards Biodiversity in Hong Kong” Research Report
11. Pat Sin Leng 31. Ninepin Island
12. Tai Lam 32. Sham Wan
13. Tai Mo Shan 33. Tim Tso Ha
14. Lam Tsuen 34. Mai Po
15. Ma On Shan 35. Hong Kong Wetland Park
16. Kiu Tsui 36. Others (Please Specify)
17. Shek O 98. Can’t tell/ Don’t know
18. Pok Fu Lam 99. Refuse to answer
19. Clear Water Bay
20. Lung Fu Shan
Q4. Do you know how much of Hong Kong’s land area is designated as country parks and special
areas? About 20%, 30%, 40%, 50%, or Don’t Know?
1. About 20%
2. About 30%
3. About 40%
4. About 50%
5. Don’t know
6. Refuse to answer
Q5. Can you name ONE local wild animal or plant that is legally protected in Hong Kong? Please
tell me the one that you are most certain about.
【Do not read out the answer】
1. Cetaceans (Dolphins, whales, porpoises) 24. Camellias
2. Chelonians 25. Crape Myrtles
(Turtles, terrapins, tortoises etc.)
3. Primates (Monkeys etc.) 26. Orchids
4. All wild birds 27. Azaleas
5. Romer’s Tree Frog 28. Star-anises
6. Hong Kong Newt 29. Magnolias
7. Hong Kong Cascade Frog 30. Tree Ferns
8. Bats 31. Ailanthus
9. Chinese Pangolin 32. Amentotaxus
10. Chinese Porcupine 33. Mules-foot Fern
11. Squirrels 34. India Birthwort
12. Common Red Fox 35. Bird’s-nest Fern
13. Masked Palm Civet 36. Hong Kong Dogwood
14. Small Indian Civet 37. Crescent-leaved Sundew
Centre for Communication and Public Opinion Survey, Agriculture, Fisheries and Conservation Department,
CUHK HKSAR
114
“Baseline Survey on the Attitude and Level of Knowledge of the General Public and Stakeholder Groups
Towards Biodiversity in Hong Kong” Research Report
15. Large Indian Civet 38. Chinese New Year Flower
16. Otter 39. Illigera
17. Chinese Ferret Badger 40. Hong Kong Balsam
18. Leopard Cat 41. Hong Kong Iris
19. Dugongs 42. Keteleeria
20. Reeves’ Muntjac/ Barking Deer 43. Chinese Lily
21. Burmese Python 44. Pitcher-plants
22. Water Monitor 45. Pavetta
23. Birdwing Butterfly 46. Balloon Flower
47. Kwangtung Rehdertree
48. Rhodoleia
49. Tutcheria
50. Schoepfia
51. Others (Please specify)
98. Can’t tell /Don’t know
99. Refuse to answer
2. Attitude towards HK’s biodiversity
I. Importance of preserving biodiversity
Q6. How concerned are you about the biodiversity in Hong Kong? Not at all concerned, Not quite
concerned, So-so, Quite concerned or Very concerned?
1. Not at all concerned
2. Not quite concerned
3. So-so
4. Quite concerned
5. Very concerned
6. No answer/ Refuse to answer
The following are several statements about biodiversity. Please tell me to what extent do you
agree with them.
Q7. “Economic development is more important than preserving biodiversity.” Strongly disagree,
Somewhat disagree, So-so, Somewhat agree, or Strongly agree?
Q8. “It is very important to promote and educate the public on biodiversity.” Strongly disagree,
Somewhat disagree, So-so, Somewhat agree, or Strongly agree?
Centre for Communication and Public Opinion Survey, Agriculture, Fisheries and Conservation Department,
CUHK HKSAR
115
“Baseline Survey on the Attitude and Level of Knowledge of the General Public and Stakeholder Groups
Towards Biodiversity in Hong Kong” Research Report
Q9. “When undertaking infrastructure and land development projects, we must take into
account biodiversity conservation.” Strongly disagree, Somewhat disagree, So-so,
Somewhat agree, or Strongly agree?
Q10. “Preserving the biodiversity in Hong Kong is a huge responsibility of the government.”
Strongly disagree, Somewhat disagree, So-so, Somewhat agree, or Strongly agree?
Q11. “The business sector has a responsibility to preserve the biodiversity in Hong Kong.”
Strongly disagree, Somewhat disagree, So-so, Somewhat agree, or Strongly agree?
Q12. “Citizens have a responsibility to change their daily habits so as to preserve the biodiversity
in Hong Kong.” Strongly disagree, Somewhat disagree, So-so, Somewhat agree, or Strongly
agree?
1. Strongly disagree
2. Somewhat disagree
3. So-so
4. Somewhat agree
5. Strongly agree
6. No answer/ Refuse to answer
II. Closeness to biodiversity
Q13. “The loss of biodiversity will lead to a decrease in food and product choices for citizens.”
Strongly disagree, Somewhat disagree, So-so, Somewhat agree, or Strongly agree?
Q14. “The loss of biodiversity will affect citizens’ health.” Strongly disagree, Somewhat disagree,
So-so, Somewhat agree, or Strongly agree?
Q15. “The loss of biodiversity will affect citizens’ living environment.” Strongly disagree,
Somewhat disagree, So-so, Somewhat agree, or Strongly agree?
Q16. “Preserving biodiversity can enrich the leisure life of citizens.” Strongly disagree, Somewhat
disagree, So-so, Somewhat agree, or Strongly agree?
Q17. “Preserving biodiversity can bring economic gains to Hong Kong.” Strongly disagree,
Somewhat disagree, So-so, Somewhat agree, or Strongly agree?

Centre for Communication and Public Opinion Survey, Agriculture, Fisheries and Conservation Department,
CUHK HKSAR
116
“Baseline Survey on the Attitude and Level of Knowledge of the General Public and Stakeholder Groups
Towards Biodiversity in Hong Kong” Research Report
Q18. “We must preserve biodiversity for the future generations.” Strongly disagree, Somewhat
disagree, So-so, Somewhat agree, or Strongly agree?
1. Strong disagree
2. Somewhat disagree
3. So-so
4. Somewhat agree
5. Strongly agree
6. No answer/ Refuse to answer
III. Willingness to preserve biodiversity
Please tell me whether you will do the following things to preserve biodiversity.
Q19. Will you boycott products and services that would harm biodiversity? Definitely will not,
Probably will not, Half & half, Probably will, or Definitely will?
Q20. Will you donate money to associations dedicated to conserving biodiversity? Definitely will
not, Probably will not, Half & half, Probably will, or Definitely will?
Q21. Will you participate in environmental activities related to biodiversity conservation?
Definitely will not, Probably will not, Half & half, Probably will, or Definitely will?
Q22. Will you encourage your families or friends to preserve biodiversity? Definitely will not,
Probably will not, Half & half, Probably will, or Definitely will?
Q23. Will you sign petitions to support biodiversity conservation? Definitely will not, Probably
will not, Half & half, Probably will, or Definitely will?
Q24. Will you pay attention to information related to biodiversity? Definitely will not, Probably
will not, Half & half, Probably will, or Definitely will?
1. Definitely will not
2. Probably will not
3. Half& half
4. Probably will
5. Definitely will
6. No answer/ Refuse to answer
Centre for Communication and Public Opinion Survey, Agriculture, Fisheries and Conservation Department,
CUHK HKSAR
117
“Baseline Survey on the Attitude and Level of Knowledge of the General Public and Stakeholder Groups
Towards Biodiversity in Hong Kong” Research Report
Part 3 Demographics
Finally, we would like to ask you some basic information for statistics analysis.
DM2. What is your age?
1. 15-19
2. 20-24
3. 25-29
4. 30-34
5. 35-39
6. 40-44
7. 45-49
8. 50-54
9. 55-59
10. 60-64
11. Refuse to answer
DM3. What is your educational level?
1. No formal schooling/ Kindergarten
2. Primary
3. Secondary (F.1 – F.3)
4. Secondary (F.4 – F.5)
5. Secondary (F.6 – F.7)
6. Tertiary (non-degree)
7. Tertiary (Bachelor degree)
8. Postgraduate (Such as Master or PhD degree)
9. Refuse to answer
DM4. What is your occupation?
If the answer is “not working”, ask “Are you a student, a home-maker, retired or
unemployed?”
1. Managers and administers
2. Professionals
3. Associate professionals
4. Clerks
5. Service workers and shop sales workers
6. Blue-collar workers
7. Students
8. Housewives/ Home-makers
9. Retired
10. Unemployed
11. Others 【Please specify】
Centre for Communication and Public Opinion Survey, Agriculture, Fisheries and Conservation Department,
CUHK HKSAR
118
“Baseline Survey on the Attitude and Level of Knowledge of the General Public and Stakeholder Groups
Towards Biodiversity in Hong Kong” Research Report
12. Refuse to answer
DM5. Which district do you live in? Hong Kong Island, Kowloon East, Kowloon West, New
Territories East, or New Territories West?
1. Hong Kong Island
2. Kowloon East
3. Kowloon West
4. New Territories East
5. New Territories West
6. Refuse to answer
DM6. What is your monthly household income?
【Include all kinds of income: salary, profits or interests from business/investments, social
security etc.】
1. $9,999 or below
2. $10,000 - $19,999
3. $20,000 - $29,999
4. $30,000 - $39,999
5. $40,000 - $49,999
6. $50,000 – $59,999
7. $60,000- $99,999
8. $100,000 or above
9. Don’t know/ Refuse to answer
** This is the end of the interview. Thanks a lot, goodbye!**
Centre for Communication and Public Opinion Survey, Agriculture, Fisheries and Conservation Department,
CUHK HKSAR
119
“Baseline Survey on the Attitude and Level of Knowledge of the General Public and Stakeholder Groups
Towards Biodiversity in Hong Kong” Research Report
Questionnaire for Online Survey – Teachers
Centre for Communication and Public Opinion Survey
School of Journalism and Communication
The Chinese University of Hong Kong
Online Survey on the Attitude and Knowledge of Primary and Secondary School
Teachers towards Biodiversity in Hong Kong
Hello. In order to understand the attitude and knowledge of primary and secondary school teachers
towards the biodiversity in Hong Kong, the Agriculture, Fisheries & Conservation Department of the
HKSAR Government has commissioned the Centre for Communication and Public Opinion Survey at
the Chinese University of Hong Kong to conduct an online survey.
We would like to invite you to participate in this survey, the results of which shall greatly contribute to
the policy formulation of the government in the future.
The survey is very simple, which would take you around 5 minutes. The information you provide will
be kept strictly confidential and used for statistical and research purposes only.
_____________________________________________________________________
Part 1: Knowledge towards biodiversity
Q1. Have you ever heard of the term “biodiversity”?
If the answer is “yes”, Do you know what does the term mean?
1. Have heard of it, and know what it means
2. Have heard of it, but don’t know what it means
3. Have not heard of it
Biodiversity refers to the variety of life forms. It has three main aspects: 1. variation among
individuals within the same species; 2. different kinds of species; and 3. a variety of habitats, such
as forests, grasslands, and mudflats, etc. With a favorable climatic condition and geographical
location, Hong Kong has rich biodiversity.
Q2. How informed do you feel about the biodiversity in Hong Kong?
1. Not at all informed
2. Not quite well-informed
3. So-so
4. Quite well-informed
5. Very well-informed
Centre for Communication and Public Opinion Survey, Agriculture, Fisheries and Conservation Department,
CUHK HKSAR
120
“Baseline Survey on the Attitude and Level of Knowledge of the General Public and Stakeholder Groups
Towards Biodiversity in Hong Kong” Research Report
Q3. To your knowledge, please write down ONE designated protected area for nature
conservation in Hong Kong, the one that you are most certain about.
1. Please write down: _________________________________________________
2. Don’t know
Q4. Do you know how much of Hong Kong’s land area is designated as country parks and special
areas?
1. About 20%
2. About 30%
3. About 40%
4. About 50%
5. Don’t know
Q5. To your knowledge, please write down ONE local wild animal or plant that is legally
protected in Hong Kong, the one that you are most certain about.
1. Please write down: _________________________________________________
2. Don’t know
Part 2: Attitude towards HK’s biodiversity
I. Importance of preserving biodiversity
Q6. How concerned are you about the biodiversity in Hong Kong?
1. Not at all concerned
2. Not quite concerned
3. So-so
4. Quite concerned
5. Very concerned

Centre for Communication and Public Opinion Survey, Agriculture, Fisheries and Conservation Department,
CUHK HKSAR
121
“Baseline Survey on the Attitude and Level of Knowledge of the General Public and Stakeholder Groups
Towards Biodiversity in Hong Kong” Research Report
To what extent do you agree with the following statements about preserving biodiversity?
Strongly
disagree
Somewhat
disagree
So-so Somewhat
agree
Strongly
agree
Q7. Economic development is more important
than preserving biodiversity.
Q8. It is very important to promote and
educate the public on biodiversity.
Q9. When undertaking infrastructure and land
development projects, we must take into
account biodiversity conservation.
Q10. Preserving the biodiversity in Hong Kong
is a huge responsibility of the
government.
Q11. The business sector has a responsibility to
preserve the biodiversity in Hong Kong
Q12. Citizens have a responsibility to change
their daily habits so as to preserve the
biodiversity in Hong Kong.
II. Closeness to biodiversity
To what extent do you agree with the following statements about the impacts of biodiversity on
citizens?
Strongly
disagree
Somewhat
disagree
So-so Somewhat
agree
Strongly
agree
Q13. The loss of biodiversity will lead to a
decrease in food and product choices for
citizens.
Q14. The loss of biodiversity will affect citizens’
health.
Q15. The loss of biodiversity will affect
citizens’ living environment.
Q16. Preserving biodiversity can enrich the
leisure life of citizens.
Q17. Preserving biodiversity can bring
economic gains to Hong Kong.
Q18. We must preserve biodiversity for the
future generations.

Centre for Communication and Public Opinion Survey, Agriculture, Fisheries and Conservation Department,
CUHK HKSAR
122
“Baseline Survey on the Attitude and Level of Knowledge of the General Public and Stakeholder Groups
Towards Biodiversity in Hong Kong” Research Report
III. Willingness to preserve biodiversity
Will you do the following things to preserve biodiversity?
Definitely
will not
Probably
will not
Half &
half
Probably
will
Definitely
will
Q19. Will you boycott products and services
that would harm biodiversity?
Q20. Will you donate money to associations
dedicated to conserving biodiversity?
Q21. Will you participate in environmental
activities related to biodiversity
conservation?
Q22. Will you encourage your families or
friends to preserve biodiversity?
Q23. Will you sign petitions to support
biodiversity conservation?
Q24. Will you pay attention to information
related to biodiversity?
Part 3: Opinion and Attitude towards biodiversity in the education sector
Q25. Does your school have enough teachers who are knowledgeable about biodiversity?
1. Not at all enough
2. Not quite enough
3. So-so
4. Quite enough
5. Very enough
Q26. How much does your school value teaching students about biodiversity conservation?
1. Not at all
2. Not quite
3. So-so
4. Quite
5. Very
Centre for Communication and Public Opinion Survey, Agriculture, Fisheries and Conservation Department,
CUHK HKSAR
123
“Baseline Survey on the Attitude and Level of Knowledge of the General Public and Stakeholder Groups
Towards Biodiversity in Hong Kong” Research Report
Q27. Has your school ever organized any biodiversity-related activities?
1. Yes
2. No
Q28. Do you think the current curriculum and teaching materials on biodiversity are able to
effectively enhance students’ awareness of conservation?
1. Not at all able
2. Not quite able
3. So-so
4. Quite able
5. Very able
Q29. Do you think the government has offered adequate support to schools or teachers to teach
biodiversity?
1. Very inadequate
2. Quite inadequate
3. So-so
4. Quite adequate
5. Very adequate
Part 4: Demographics
DM1. Gender:
1. Male
2. Female
DM2. Age:
1. 20-24
2. 25-29
3. 30-34
4. 35-39
5. 40-44
6. 45-49
7. 50-54
8. 55-59
9. 60 or above
Centre for Communication and Public Opinion Survey, Agriculture, Fisheries and Conservation Department,
CUHK HKSAR
124
“Baseline Survey on the Attitude and Level of Knowledge of the General Public and Stakeholder Groups
Towards Biodiversity in Hong Kong” Research Report
DM3. Educational level:
1. Secondary
2. Tertiary (non-degree)
3. Tertiary (Bachelor degree)
4. Postgraduate (Such as Master or PhD degree)
DM4a. Current teaching school:
1. Primary
2. Secondary
DM4b. Type of your current teaching school:
1. Government school
2. Aided school
3. Private school
4. School under direct subsidy scheme
5. Caput school
DM5. Current teaching subjects:
【Can choose multiple items】
1. Chinese
2. English
3. Mathematics
4. Liberal studies/ General studies
5. Geography
6. Biology
7. Chemistry/ Physics
8. Science
9. Accountancy/ Economics
10. Chinese history/ History
11. Music/ Visual arts/ Physical education
12. Other (please specify): ________________
DM6. Years of teaching experience:
_________________ Year(s)
This is the end of the survey. Thank you for your time to complete the survey.
Centre for Communication and Public Opinion Survey, Agriculture, Fisheries and Conservation Department,
CUHK HKSAR
125
“Baseline Survey on the Attitude and Level of Knowledge of the General Public and Stakeholder Groups
Towards Biodiversity in Hong Kong” Research Report
Questionnaire for Online Survey – Planning and Development
Professionals
Centre for Communication and Public Opinion Survey
School of Journalism and Communication
The Chinese University of Hong Kong
Online Survey on the Attitude and Knowledge of Planning and Development
Professionals towards Biodiversity in Hong Kong
Hello. In order to understand the attitude and knowledge of planning and development professionals
towards the biodiversity in Hong Kong, the Agriculture, Fisheries & Conservation Department of the
HKSAR Government has commissioned the Centre for Communication and Public Opinion Survey at
the Chinese University of Hong Kong to conduct an online survey.
We would like to invite you to participate in this survey, the results of which shall greatly contribute to
the policy formulation of the government in the future.
The survey is very simple, which would take you around 5 minutes. The information you provide will
be kept strictly confidential and used for statistical and research purposes only.
_____________________________________________________________________
Part 1: Knowledge towards biodiversity
Q1. Have you ever heard of the term “biodiversity”?
If the answer is “yes”, Do you know what does the term mean?
1. Have heard of it, and know what it means
2. Have heard of it, but don’t know what it means
3. Have not heard of it
Biodiversity refers to the variety of life forms. It has three main aspects: 1. variation among
individuals within the same species; 2. different kinds of species; and 3. a variety of habitats, such
as forests, grasslands, and mudflats, etc. With a favorable climatic condition and geographical
location, Hong Kong has rich biodiversity.
Q2. How informed do you feel about the biodiversity in Hong Kong?
1. Not at all informed
2. Not quite well-informed
3. So-so
4. Quite well-informed
5. Very well-informed

Centre for Communication and Public Opinion Survey, Agriculture, Fisheries and Conservation Department,
CUHK HKSAR
126
“Baseline Survey on the Attitude and Level of Knowledge of the General Public and Stakeholder Groups
Towards Biodiversity in Hong Kong” Research Report
Q3. To your knowledge, please write down ONE designated protected area for nature
conservation in Hong Kong, the one that you are most certain about.
1. Please write down: _________________________________________________
2. Don’t know
Q4. Do you know how much of Hong Kong’s land area is designated as country parks and special
areas?
1. About 20%
2. About 30%
3. About 40%
4. About 50%
5. Don’t know
Q5. To your knowledge, please write down ONE local wild animal or plant that is legally
protected in Hong Kong, the one that you are most certain about.
1. Please write down: _________________________________________________
2. Don’t know
Part 2: Attitude towards HK’s biodiversity
I. Importance of preserving biodiversity
Q6. How concerned are you about the biodiversity in Hong Kong?
1. Not at all concerned
2. Not quite concerned
3. So-so
4. Quite concerned
5. Very concerned
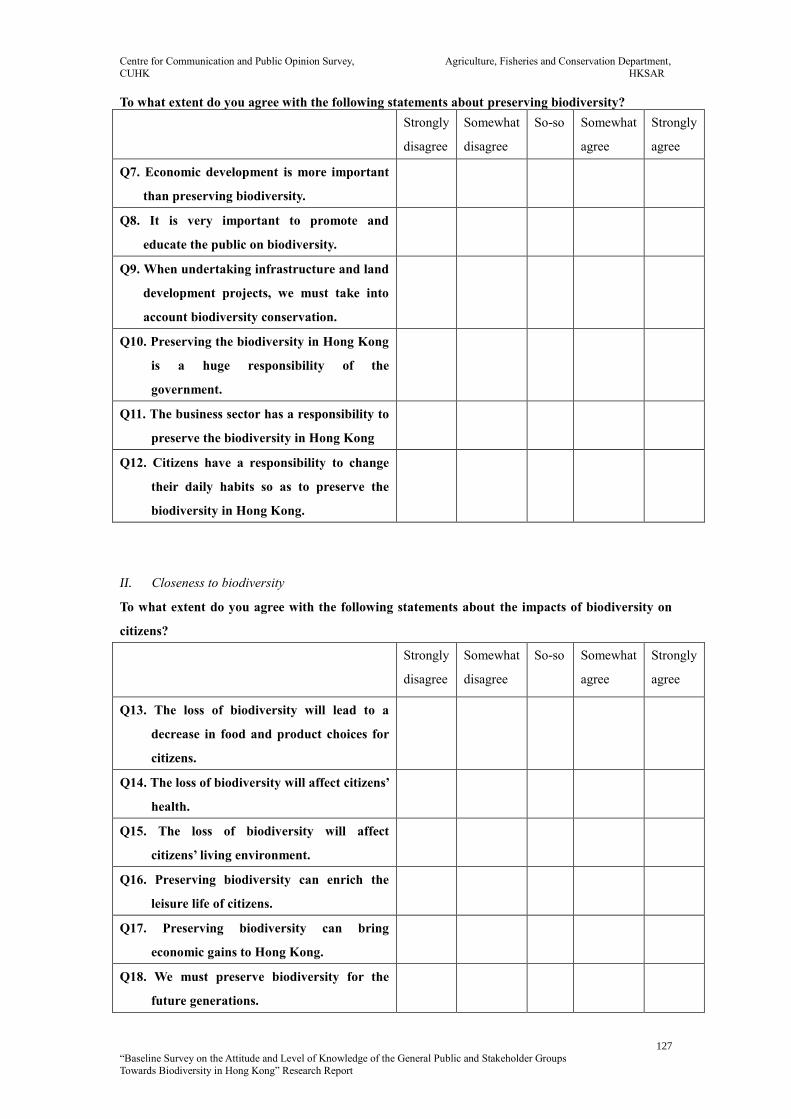
Centre for Communication and Public Opinion Survey, Agriculture, Fisheries and Conservation Department,
CUHK HKSAR
127
“Baseline Survey on the Attitude and Level of Knowledge of the General Public and Stakeholder Groups
Towards Biodiversity in Hong Kong” Research Report
To what extent do you agree with the following statements about preserving biodiversity?
Strongly
disagree
Somewhat
disagree
So-so Somewhat
agree
Strongly
agree
Q7. Economic development is more important
than preserving biodiversity.
Q8. It is very important to promote and
educate the public on biodiversity.
Q9. When undertaking infrastructure and land
development projects, we must take into
account biodiversity conservation.
Q10. Preserving the biodiversity in Hong Kong
is a huge responsibility of the
government.
Q11. The business sector has a responsibility to
preserve the biodiversity in Hong Kong
Q12. Citizens have a responsibility to change
their daily habits so as to preserve the
biodiversity in Hong Kong.
II. Closeness to biodiversity
To what extent do you agree with the following statements about the impacts of biodiversity on
citizens?
Strongly
disagree
Somewhat
disagree
So-so Somewhat
agree
Strongly
agree
Q13. The loss of biodiversity will lead to a
decrease in food and product choices for
citizens.
Q14. The loss of biodiversity will affect citizens’
health.
Q15. The loss of biodiversity will affect
citizens’ living environment.
Q16. Preserving biodiversity can enrich the
leisure life of citizens.
Q17. Preserving biodiversity can bring
economic gains to Hong Kong.
Q18. We must preserve biodiversity for the
future generations.

Centre for Communication and Public Opinion Survey, Agriculture, Fisheries and Conservation Department,
CUHK HKSAR
128
“Baseline Survey on the Attitude and Level of Knowledge of the General Public and Stakeholder Groups
Towards Biodiversity in Hong Kong” Research Report
III. Willingness to preserve biodiversity
Will you do the following things to preserve biodiversity?
Definitely
will not
Probably
will not
Half &
half
Probably
will
Definitely
will
Q19. Will you boycott products and services
that would harm biodiversity?
Q20. Will you donate money to associations
dedicated to conserving biodiversity?
Q21. Will you participate in environmental
activities related to biodiversity
conservation?
Q22. Will you encourage your families or
friends to preserve biodiversity?
Q23. Will you sign petitions to support
biodiversity conservation?
Q24. Will you pay attention to information
related to biodiversity?
Part 3: Opinion and Attitude towards biodiversity in the planning and development sector
Q25. How informed do you feel your professional sector is about biodiversity?
1. Not at all informed
2. Not quite well-informed
3. So-so
4. Quite well-informed
5. Very well-informed
Q26. How much does your professional sector value biodiversity conservation?
1. Not at all
2. Not quite
3. So-so
4. Quite
5. Very

Centre for Communication and Public Opinion Survey, Agriculture, Fisheries and Conservation Department,
CUHK HKSAR
129
“Baseline Survey on the Attitude and Level of Knowledge of the General Public and Stakeholder Groups
Towards Biodiversity in Hong Kong” Research Report
Q27. To your knowledge, would your professional sector incorporate considerations for
biodiversity conservation in planning and decision-making processes?
1. Definitely would not
2. Probably would not
3. Half & half
4. Probably would
5. Definitely would
Q28. Are there sufficient incentives or pressure that urge your professional sector to incorporate
considerations for biodiversity conservation in its planning and decision making processes?
1. Very inadequate
2. Quite inadequate
3. So-so
4. Quite adequate
5. Very adequate
Q29. Do you think the government has done an adequate job to promote and educate your
professional sector on biodiversity conservation?
1. Very inadequate
2. Quite inadequate
3. So-so
4. Quite adequate
5. Very adequate
Part 4: Demographics
DM1. Gender:
1. Male
2. Female
DM2. Age:
1. 20-24
2. 25-29
3. 30-34
4. 35-39
5. 40-44
6. 45-49
7. 50-54
Centre for Communication and Public Opinion Survey, Agriculture, Fisheries and Conservation Department,
CUHK HKSAR
130
“Baseline Survey on the Attitude and Level of Knowledge of the General Public and Stakeholder Groups
Towards Biodiversity in Hong Kong” Research Report
8. 55-59
9. 60 or above
DM3. Educational level:
1. Secondary
2. Tertiary (non-degree)
3. Tertiary (Bachelor degree)
4. Postgraduate (Such as Master or PhD degree)
DM4. Occupation:
1. Architect
2. Engineer
3. Landscape architect
4. Surveyor
5. Urban planner
6. Other (Please specify)
DM5. Years of industry experience:
_________________ Year(s)
DM6. The size of your company in Hong Kong:
About ___________________ employees
This is the end of the survey. Thank you for your time to complete the survey.
Centre for Communication and Public Opinion Survey, Agriculture, Fisheries and Conservation Department,
CUHK HKSAR
131
“Baseline Survey on the Attitude and Level of Knowledge of the General Public and Stakeholder Groups
Towards Biodiversity in Hong Kong” Research Report
Discussion Guide for Focus group discussion – General Public
Centre for Communication and Public Opinion Survey
The Chinese University of Hong Kong
Focus Group Discussion on the
“Attitude and Knowledge of the General Public Towards Biodiversity
in Hong Kong”
Discussion Guide
1. Knowledge towards biodiversity
To participants who have already heard of biodiversity before participating
in this research:
Where did you learn about biodiversity?
The host would briefly introduce the three aspects of biodiversity:
1. Variation of genes; 2. Variation of species; 3. Variation of habitats
Without this introduction, is there any concept you have not
heard of before?
2. Attitude towards biodiversity
I. Personal importance of preserving biodiversity
How concerned are you about biodiversity? Why?
If there is a loss of biodiversity, will it affect your daily life? In what
aspects will your daily life be affected?
II. Willingness to preserve biodiversity
Are you aware of the potential impacts of your daily life habits to
biodiversity? And have you actively changed your habits in order to
preserve biodiversity?
III. Social importance of preserving biodiversity
Overall speaking, do you think the society is concerned about biodiversity?
How do you think about the relationship between economic development
and biodiversity conservation?
Do you think citizens, the business sector and the government have
responsibilities to preserve biodiversity?
Centre for Communication and Public Opinion Survey, Agriculture, Fisheries and Conservation Department,
CUHK HKSAR
132
“Baseline Survey on the Attitude and Level of Knowledge of the General Public and Stakeholder Groups
Towards Biodiversity in Hong Kong” Research Report
3. Other opinions
Do you think the government has done an adequate job to promote
biodiversity?
Recommendations on how the government can promote biodiversity more
efficiently.
-THE END-
Centre for Communication and Public Opinion Survey, Agriculture, Fisheries and Conservation Department,
CUHK HKSAR
133
“Baseline Survey on the Attitude and Level of Knowledge of the General Public and Stakeholder Groups
Towards Biodiversity in Hong Kong” Research Report
Discussion Guide for Focus group discussion – Secondary School
Teachers
Centre for Communication and Public Opinion Survey
The Chinese University of Hong Kong
Focus Group Discussion on the
“Attitude and Knowledge of the Education Sector Towards
Biodiversity in Hong Kong”
Discussion Guide
1. Overall opinion on biodiversity education in secondary schools
To your knowledge, do secondary schools value teaching students about
biodiversity?
What are the reasons for that?
Do you think there are enough secondary school teachers who are informed
about biodiversity?
If no, can you think of any ways that can increase the number of teachers
who are informed about biodiversity?
2. Opinions on biodiversity-related curriculum and activities
Where do you acquire the teaching materials about biodiversity?
Do you think the current curriculum and teaching materials about biodiversity
are able to effectively enhance the students’ consciousness of environmental
conservation? Why are the reasons for that? Do you have any suggestions?
To your knowledge, do secondary schools organize activities related to
biodiversity?
What is the nature of these activities?
How frequent does your school hold these activities?
Are they effective?
Are there any suggestions?
Have you encountered any difficulties when teaching biodiversity or organizing
Centre for Communication and Public Opinion Survey, Agriculture, Fisheries and Conservation Department,
CUHK HKSAR
134
“Baseline Survey on the Attitude and Level of Knowledge of the General Public and Stakeholder Groups
Towards Biodiversity in Hong Kong” Research Report
activities related to biodiversity?
3. Opinions on government’s support
Do you think the government has offered adequate support to schools and
teachers to teach biodiversity, such as providing teaching materials, and offering
training and other assistance?
Are there any suggestions?
-THE END-
Centre for Communication and Public Opinion Survey, Agriculture, Fisheries and Conservation Department,
CUHK HKSAR
135
“Baseline Survey on the Attitude and Level of Knowledge of the General Public and Stakeholder Groups
Towards Biodiversity in Hong Kong” Research Report
Discussion Guide for Focus group discussion – Planning and
Development Professionals
Centre for Communication and Public Opinion Survey
The Chinese University of Hong Kong
Focus Group Discussion on the
“Attitude and Knowledge of the Planning and Development Sector
Towards Biodiversity in Hong Kong”
Discussion Guide
1. Overall opinion on the professional sector’s attitude and knowledge towards
biodiversity
Does your professional sector have the consciousness that development projects
may affect biodiversity?
Does your professional sector value biodiversity conservation? Does it
incorporate biodiversity considerations into planning and decision-making
processes?
What are the reasons for that?
If “no”, why?
If “yes”, what are the concrete actions or initiatives? Are they effective?
2. The factors affecting the professional sector’s implementation of biodiversity
conservation measures
Are there any incentives for your professional sector to preserve biodiversity?
What kinds of incentives?
How strong are the incentives?
Is there any pressure for your professional sector to preserve biodiversity? What
kind of pressure?
How strong is the pressure?
Do you have any suggestions on how to encourage your professional sector to
implement more biodiversity conservation measures in its works?
Centre for Communication and Public Opinion Survey, Agriculture, Fisheries and Conservation Department,
CUHK HKSAR
136
“Baseline Survey on the Attitude and Level of Knowledge of the General Public and Stakeholder Groups
Towards Biodiversity in Hong Kong” Research Report
3. Opinions on government’s effort
Do you think the government has done an adequate job to promote and educate
your professional sector on biodiversity conservation?
Are there any suggestions for better promotion and education?
How can the government support your professional sector to better implement
biodiversity conservation measures in its works?
-THE END-
Centre for Communication and Public Opinion Survey, Agriculture, Fisheries and Conservation Department,
CUHK HKSAR
137
“Baseline Survey on the Attitude and Level of Knowledge of the General Public and Stakeholder Groups
Towards Biodiversity in Hong Kong” Research Report
Appendix 2
Demographics of Survey Respondents and
Focus Group Participants10
10 Percentages do not always add up to 100.0% due to rounding.

Centre for Communication and Public Opinion Survey, Agriculture, Fisheries and Conservation Department,
CUHK HKSAR
138
“Baseline Survey on the Attitude and Level of Knowledge of the General Public and Stakeholder Groups
Towards Biodiversity in Hong Kong” Research Report
Demographics of Respondents – Telephone Survey
Table 1 Sex
Frequency Percentage
Male 486 47.8
Female 530 52.2
Total 1 016 100.0
Table 2 Age
Frequency Percentage
15-19 68 6.7
20-24 106 10.4
25-29 74 7.3
30-34 78 7.7
35-39 119 11.7
40-44 100 9.8
45-49 112 11.1
50-54 138 13.6
55-59 111 10.9
60-64 99 9.7
Refuse to answer 10 1.0
Total 1 016 100.0
Table 3 Educational Level
Frequency Percentage
No formal schooling / Kindergarten 8 0.8
Primary 79 7.8
Secondary (F.1 – F.3) 172 17.0
Secondary (F.4 – F.5) 265 26.0
Matriculation (F.6 – F.7) 106 10.4
Tertiary (non-degree) 73 7.2
Tertiary (degree) 238 23.4
Postgraduate (Such as Master or
PhD degree)
71 7.0
Refuse to answer 5 0.5
Total 1016 100.0

Centre for Communication and Public Opinion Survey, Agriculture, Fisheries and Conservation Department,
CUHK HKSAR
139
“Baseline Survey on the Attitude and Level of Knowledge of the General Public and Stakeholder Groups
Towards Biodiversity in Hong Kong” Research Report
Table 4 Occupation
Frequency Percentage
Managers and administrators 102 10.0
Professionals 59 5.9
Associate professionals 107 10.5
Clerks 136 13.4
Service workers and shop sales workers 62 6.1
Blue-collar workers 139 13.7
Students 120 11.8
Housewives/ Home-makers 158 15.6
Retired 70 6.9
Unemployed 38 3.7
Refuse to answer 25 2.5
Total 1016 100.0
Table 5 Living District
Frequency Percentage
Hong Kong Island 161 15.9
Kowloon East 212 20.9
Kowloon West 112 11.0
New Territories East 273 26.8
New Territories West 249 24.5
Refuse to answer 9 0.9
Total 1 016 100.0
Table 6 Monthly Personal Income
Frequency Percentage
$9,999 or below 65 6.4
$10,000 - $19,999 143 14.1
$20,000 - $29,999 183 18.0
$30,000 - $39,999 160 15.8
$40,000 - $49,999 89 8.7
$50,000 - $59,999 91 9.0
$60,000 - $69,999 85 8.4
$100,000 or above 78 7.7
Refuse to answer 123 12.1
Total 1016 100.0

Centre for Communication and Public Opinion Survey, Agriculture, Fisheries and Conservation Department,
CUHK HKSAR
140
“Baseline Survey on the Attitude and Level of Knowledge of the General Public and Stakeholder Groups
Towards Biodiversity in Hong Kong” Research Report
Demographics of Respondents – Online Survey (Teachers)
Table 1 Sex
Frequency Percentage
Male 162 39.1
Female 251 60.6
Refuse to answer 1 0.2
Total 414 100.0
Table 2 Age
Frequency Percentage
20-24 7 1.7
25-29 44 10.6
30-34 53 12.8
35-39 59 14.3
40-44 93 22.5
45-49 72 17.4
50-54 56 13.5
55-59 26 6.3
60 or above 1 0.2
Refuse to answer 3 0.7
Total 414 100.0
Table 3 Educational Level
Frequency Percentage
Tertiary (non-degree) 5 1.2
Tertiary (degree) 187 45.2
Postgraduate (Such as Master or PhD degree) 218 52.7
Refuse to answer 4 1.0
Total 414 100.0
Table 4 Current Teaching School
Frequency Percentage
Primary 162 39.1
Secondary 252 60.9
Total 414 100.0

Centre for Communication and Public Opinion Survey, Agriculture, Fisheries and Conservation Department,
CUHK HKSAR
141
“Baseline Survey on the Attitude and Level of Knowledge of the General Public and Stakeholder Groups
Towards Biodiversity in Hong Kong” Research Report
Table 5 Type of Current Teaching School
Frequency Percentage
Government school 55 13.3
Aided school 323 78.0
Private school 6 1.4
School under direct subsidy scheme 24 5.8
Caput school 6 1.4
Total 414 100.0
Table 6 Current Teaching Subjects
Frequency Percentage
Chinese 76 18.4
English 77 18.6
Mathematics 103 24.9
Liberal studies/ General studies 117 28.3
Geography 32 7.7
Biology 41 9.9
Chemistry/ Physics 26 6.3
Science 35 8.5
Accountancy/ Economics 5 1.2
Chinese history/ History 7 1.7
Music/ Visual arts/ Physical education 56 13.5
Other 23 5.6
Note: The summation of figures may exceed the total as respondents can choose
more than one answer.
Table 7 Years of Teaching Experience
Frequency Percentage
5 years or below 44 10.6
6-10 years 68 16.4
11-15 years 53 12.8
16-20 years 97 23.4
21-25 years 75 18.1
26-30 years 41 9.9
30 years or above 16 3.9
Refuse to answer 20 4.8
Total 414 100.0

Centre for Communication and Public Opinion Survey, Agriculture, Fisheries and Conservation Department,
CUHK HKSAR
142
“Baseline Survey on the Attitude and Level of Knowledge of the General Public and Stakeholder Groups
Towards Biodiversity in Hong Kong” Research Report
Demographics of Respondents – Online Survey (Planning and
Development Professionals)
Table 1 Sex
Frequency Percentage
Male 156 73.6
Female 56 26.4
Total 212 100.0
Table 2 Age
Frequency Percentage
20-24 9 4.2
25-29 30 14.2
30-34 49 23.1
35-39 21 9.9
40-44 16 7.5
45-49 22 10.4
50-54 24 11.3
55-59 18 8.5
60 or above 23 10.8
Total 212 100.0
Table 3 Educational Level
Frequency Percentage
Secondary 1 0.5
Tertiary (non-degree) 13 6.1
Tertiary (degree) 111 52.4
Postgraduate (Such as Master or
PhD degree)
87 41.0
Total 212 100.0

Centre for Communication and Public Opinion Survey, Agriculture, Fisheries and Conservation Department,
CUHK HKSAR
143
“Baseline Survey on the Attitude and Level of Knowledge of the General Public and Stakeholder Groups
Towards Biodiversity in Hong Kong” Research Report
Table 4 Occupation
Frequency Percentage
Architect 22 10.4
Engineer 35 16.5
Landscape architect 17 8.0
Surveyor 123 58.0
Urban planner 10 4.7
Urban designer 2 0.9
Other (Arborist, Project Planning Officer, Consultant) 3 1.4
Total 212 100.0
Table 5 Years of Industry Experience
Frequency Percentage
5 years or below 32 15.1
6-10 years 48 22.6
11-15 years 19 9.0
16-20 years 28 13.2
21-25 years 19 9.0
26-30 years 25 11.8
30 years or above 27 12.7
Refuse to answer 14 6.6
Total 212 100.0
Table 6 The Size of Company in Hong Kong
Frequency Percentage
100 employees or below 68 32.1
101 – 300 employees 28 13.2
301 – 500 employees 19 9.0
501 – 1,000 employees 19 9.0
1,001 employees or above 45 21.2
Refuse to answer 33 15.6
Total 212 100.0
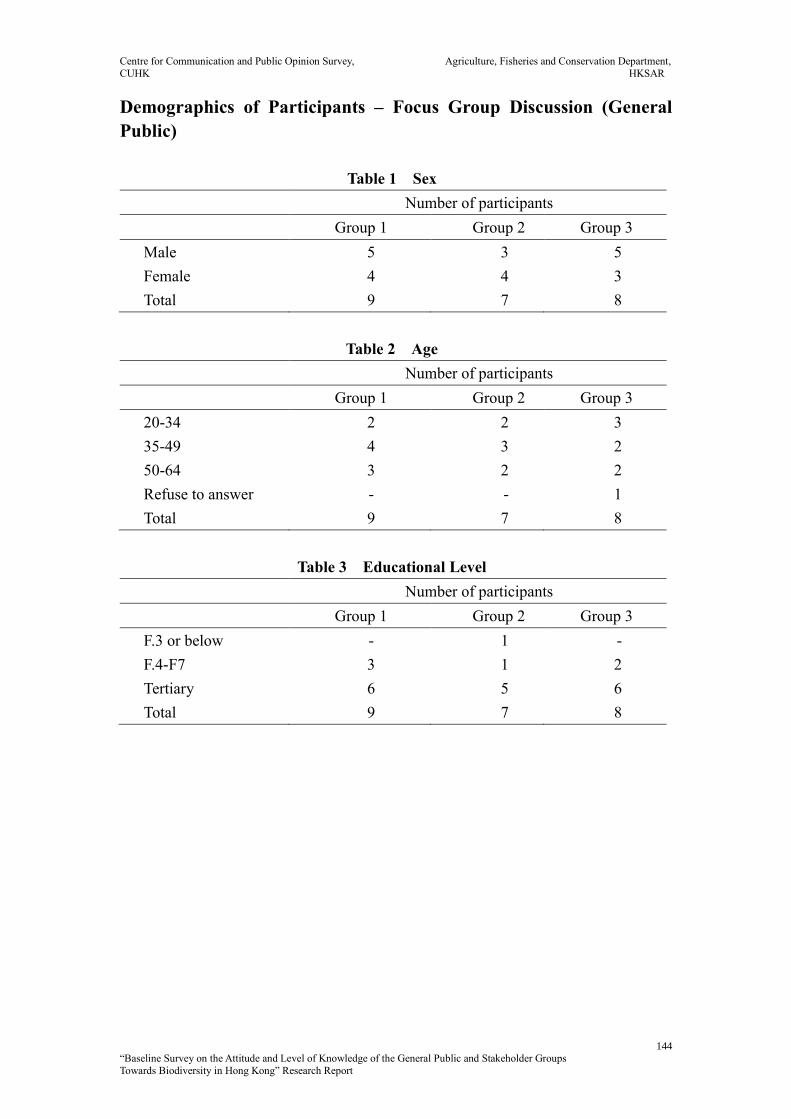
Centre for Communication and Public Opinion Survey, Agriculture, Fisheries and Conservation Department,
CUHK HKSAR
144
“Baseline Survey on the Attitude and Level of Knowledge of the General Public and Stakeholder Groups
Towards Biodiversity in Hong Kong” Research Report
Demographics of Participants – Focus Group Discussion (General
Public)
Table 1 Sex
Number of participants
Group 1 Group 2 Group 3
Male 5 3 5
Female 4 4 3
Total 9 7 8
Table 2 Age
Number of participants
Group 1 Group 2 Group 3
20-34 2 2 3
35-49 4 3 2
50-64 3 2 2
Refuse to answer - - 1
Total 9 7 8
Table 3 Educational Level
Number of participants
Group 1 Group 2 Group 3
F.3 or below - 1 -
F.4-F7 3 1 2
Tertiary 6 5 6
Total 9 7 8
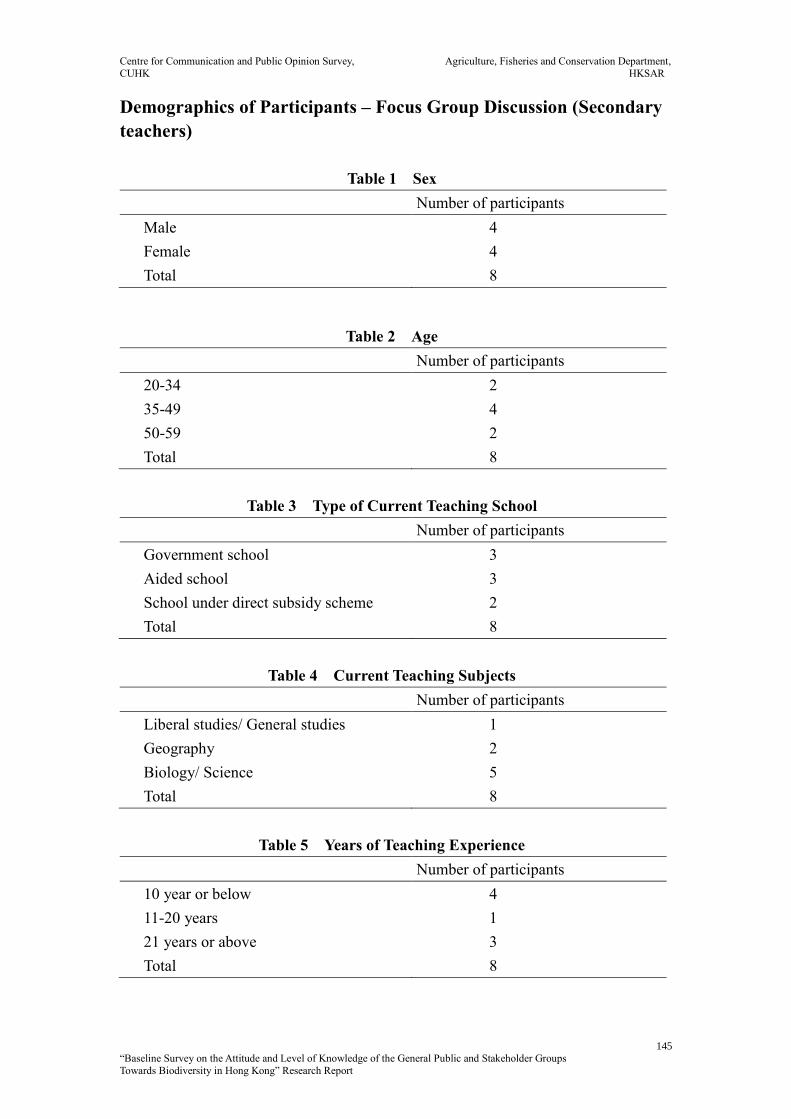
Centre for Communication and Public Opinion Survey, Agriculture, Fisheries and Conservation Department,
CUHK HKSAR
145
“Baseline Survey on the Attitude and Level of Knowledge of the General Public and Stakeholder Groups
Towards Biodiversity in Hong Kong” Research Report
Demographics of Participants – Focus Group Discussion (Secondary
teachers)
Table 1 Sex
Number of participants
Male 4
Female 4
Total 8
Table 2 Age
Number of participants
20-34 2
35-49 4
50-59 2
Total 8
Table 3 Type of Current Teaching School
Number of participants
Government school 3
Aided school 3
School under direct subsidy scheme 2
Total 8
Table 4 Current Teaching Subjects
Number of participants
Liberal studies/ General studies 1
Geography 2
Biology/ Science 5
Total 8
Table 5 Years of Teaching Experience
Number of participants
10 year or below 4
11-20 years 1
21 years or above 3
Total 8
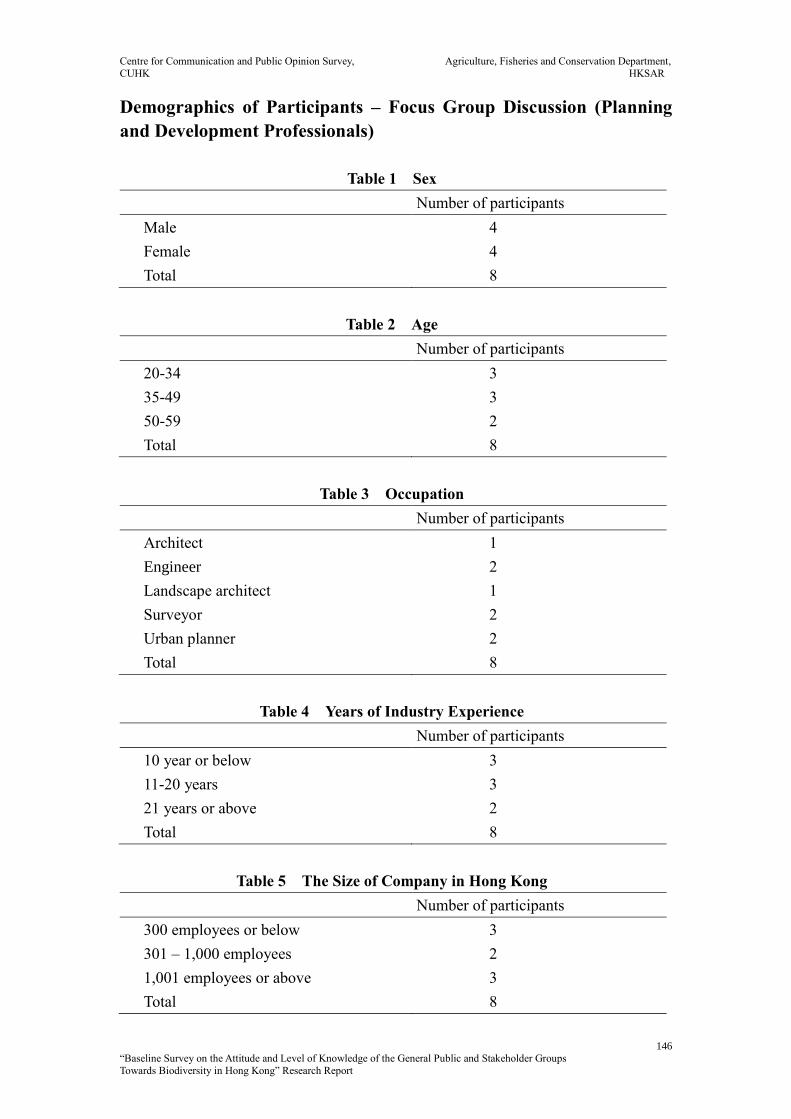
Centre for Communication and Public Opinion Survey, Agriculture, Fisheries and Conservation Department,
CUHK HKSAR
146
“Baseline Survey on the Attitude and Level of Knowledge of the General Public and Stakeholder Groups
Towards Biodiversity in Hong Kong” Research Report
Demographics of Participants – Focus Group Discussion (Planning
and Development Professionals)
Table 1 Sex
Number of participants
Male 4
Female 4
Total 8
Table 2 Age
Number of participants
20-34 3
35-49 3
50-59 2
Total 8
Table 3 Occupation
Number of participants
Architect 1
Engineer 2
Landscape architect 1
Surveyor 2
Urban planner 2
Total 8
Table 4 Years of Industry Experience
Number of participants
10 year or below 3
11-20 years 3
21 years or above 2
Total 8
Table 5 The Size of Company in Hong Kong
Number of participants
300 employees or below 3
301 – 1,000 employees 2
1,001 employees or above 3
Total 8

Centre for Communication and Public Opinion Survey, Agriculture, Fisheries and Conservation Department,
CUHK HKSAR
147
“Baseline Survey on the Attitude and Level of Knowledge of the General Public and Stakeholder Groups
Towards Biodiversity in Hong Kong” Research Report
Appendix 3
Statistical Tables
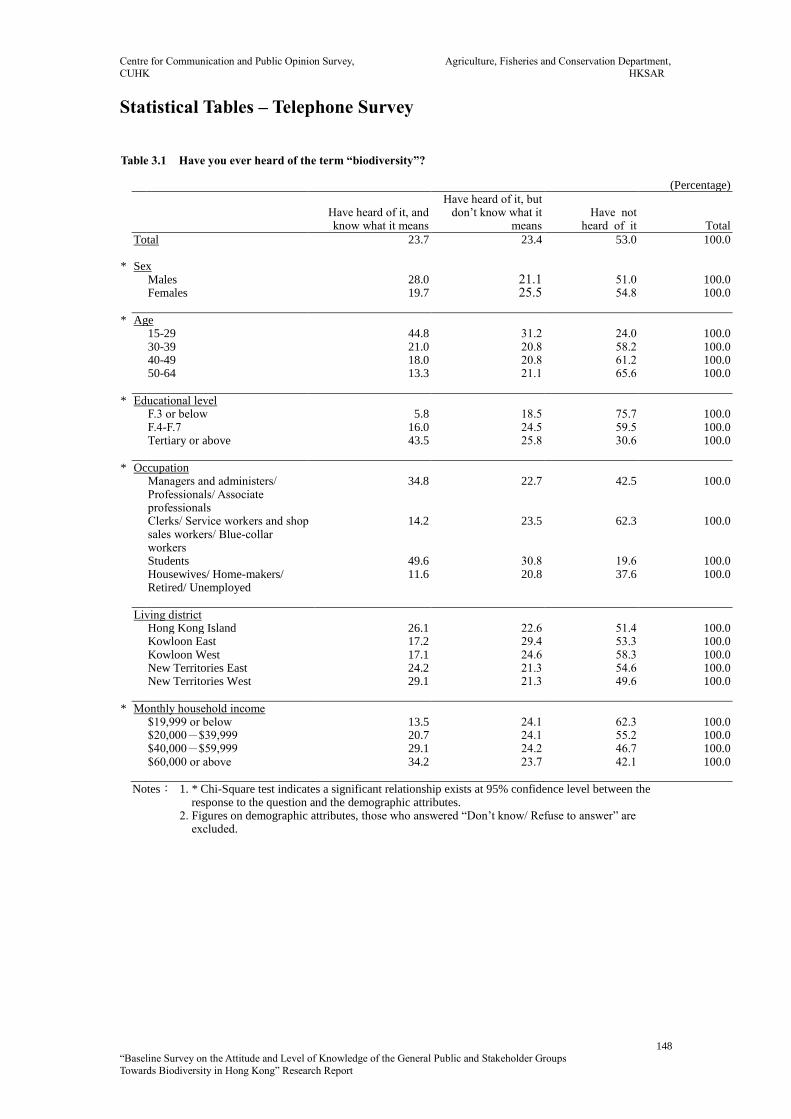
Centre for Communication and Public Opinion Survey, Agriculture, Fisheries and Conservation Department,
CUHK HKSAR
148
“Baseline Survey on the Attitude and Level of Knowledge of the General Public and Stakeholder Groups
Towards Biodiversity in Hong Kong” Research Report
Statistical Tables – Telephone Survey
Table 3.1 Have you ever heard of the term “biodiversity”?
(Percentage)
Have heard of it, and know what it means
Have heard of it, but don’t know what it
means Have not
heard of it Total
Total 23.7 23.4 53.0 100.0 * Sex Males 28.0 21.1 51.0 100.0 Females 19.7 25.5 54.8 100.0
* Age 15-29 44.8 31.2 24.0 100.0 30-39 21.0 20.8 58.2 100.0 40-49 18.0 20.8 61.2 100.0 50-64 13.3 21.1 65.6 100.0
* Educational level F.3 or below 5.8 18.5 75.7 100.0 F.4-F.7 16.0 24.5 59.5 100.0 Tertiary or above 43.5 25.8 30.6 100.0
* Occupation Managers and administers/
Professionals/ Associate professionals
34.8 22.7 42.5 100.0
Clerks/ Service workers and shop sales workers/ Blue-collar workers
14.2 23.5 62.3 100.0
Students 49.6 30.8 19.6 100.0 Housewives/ Home-makers/
Retired/ Unemployed 11.6 20.8 37.6 100.0
Living district Hong Kong Island 26.1 22.6 51.4 100.0 Kowloon East 17.2 29.4 53.3 100.0 Kowloon West 17.1 24.6 58.3 100.0 New Territories East 24.2 21.3 54.6 100.0 New Territories West 29.1 21.3 49.6 100.0
* Monthly household income $19,999 or below 13.5 24.1 62.3 100.0 $20,000-$39,999 20.7 24.1 55.2 100.0 $40,000-$59,999 29.1 24.2 46.7 100.0 $60,000 or above 34.2 23.7 42.1 100.0
Notes: 1. * Chi-Square test indicates a significant relationship exists at 95% confidence level between the response to the question and the demographic attributes.
2. Figures on demographic attributes, those who answered “Don’t know/ Refuse to answer” are excluded.

Centre for Communication and Public Opinion Survey, Agriculture, Fisheries and Conservation Department,
CUHK HKSAR
149
“Baseline Survey on the Attitude and Level of Knowledge of the General Public and Stakeholder Groups
Towards Biodiversity in Hong Kong” Research Report
Table 3.2 How informed do you feel about the biodiversity in Hong Kong?
(Percentage)
Not informed So-so Well-informed
No answer/ Refuse
to answer Total
Total 53.7 42.0 4.3 0.1 100.0 * Sex Males 48.4 46.7 4.9 0.0 100.0 Females 58.5 37.6 3.8 0.1 100.0
* Age 15-29 39.4 54.1 6.5 0.0 100.0 30-39 54.3 40.5 5.1 0.0 100.0 40-49 63.1 33.8 3.1 0.0 100.0 50-64 57.7 39.0 3.2 0.2 100.0
Educational level F.3 or below 55.3 40.7 4.0 0.0 100.0 F.4-F.7 58.4 38.3 3.3 0.0 100.0 Tertiary or above 48.2 46.0 5.7 0.1 100.0
* Occupation Managers and administers/
Professionals/ Associate professionals
52.6 42.6 4.8 0.0 100.0
Clerks/ Service workers and shop sales workers/ Blue-collar workers
51.9 43.7 4.2 0.2 100.0
Students 31.7 61.3 7.1 0.0 100.0 Housewives/ Home-makers/
Retired/ Unemployed 68.9 28.0 3.1 0.0 100.0
Living district Hong Kong Island 51.0 43.8 5.2 0.0 100.0 Kowloon East 57.3 38.3 4.4 0.0 100.0 Kowloon West 57.9 40.5 1.2 0.5 100.0 New Territories East 55.9 40.7 3.4 0.0 100.0 New Territories West 48.7 44.9 6.3 0.0 100.0
Monthly household income $19,999 or below 55.1 38.3 6.3 0.3 100.0 $20,000-$39,999 57.4 39.1 3.5 0.0 100.0 $40,000-$59,999 51.0 46.3 2.6 0.0 100.0 $60,000 or above 53.0 42.0 4.9 0.0 100.0
Notes: 1. * Chi-Square test indicates a significant relationship exists at 95% confidence level between the response to the question and the demographic attributes.
2. Figures on demographic attributes, those who answered “Don’t know/ Refuse to answer” are excluded.

Centre for Communication and Public Opinion Survey, Agriculture, Fisheries and Conservation Department,
CUHK HKSAR
150
“Baseline Survey on the Attitude and Level of Knowledge of the General Public and Stakeholder Groups
Towards Biodiversity in Hong Kong” Research Report
Table 3.3 Can you name ONE designated protected area for nature conservation in Hong Kong? Please tell me the
one that you are most certain about.
(Percentage)
Answered Correctly Answered Wrongly/
Don't know Total
Total 63.1 36.9 100.0 Sex Males 65.6 34.4 100.0 Females 60.8 39.2 100.0
* Age 15-29 68.9 31.1 100.0 30-39 69.1 30.9 100.0 40-49 69.9 30.1 100.0 50-64 51.1 48.9 100.0
* Educational level F.3 or below 40.2 59.8 100.0 F.4-F.7 65.3 34.7 100.0 Tertiary or above 76.7 23.3 100.0
* Occupation Managers and administers/
Professionals/ Associate professionals
76.2 23.8 100.0
Clerks/ Service workers and shop sales workers/ Blue-collar workers
61.5 38.5 100.0
Students 64.9 35.1 100.0 Housewives/ Home-makers/
Retired/ Unemployed 49.5 50.5 100.0
Living district Hong Kong Island 70.6 29.4 100.0 Kowloon East 58.1 41.9 100.0 Kowloon West 60.5 39.5 100.0 New Territories East 60.1 39.9 100.0 New Territories West 66.6 33.4 100.0
* Monthly household income $19,999 or below 48.9 51.1 100.0 $20,000-$39,999 61.3 38.7 100.0 $40,000-$59,999 71.4 28.6 100.0 $60,000 or above 80.3 19.7 100.0
Notes: 1. * Chi-Square test indicates a significant relationship exists at 95% confidence level between the response to the question and the demographic attributes.
2. Figures on demographic attributes, those who answered “Don’t know/ Refuse to answer” are excluded.

Centre for Communication and Public Opinion Survey, Agriculture, Fisheries and Conservation Department,
CUHK HKSAR
151
“Baseline Survey on the Attitude and Level of Knowledge of the General Public and Stakeholder Groups
Towards Biodiversity in Hong Kong” Research Report
Table 3.4 Do you know how much of Hong Kong’s land area is designated as country parks and special areas?
(Percentage)
About 40 (correct answer) Wrong answers
Don't know Total
Total 15.4 36.3 48.3 100.0 Sex Males 17.8 35.2 47.0 100.0 Females 13.3 37.3 49.5 100.0
* Age 15-29 20.7 32.3 47.0 100.0 30-39 17.3 42.6 40.1 100.0 40-49 15.4 31.8 52.8 100.0 50-64 10.8 38.0 51.2 100.0
* Educational level F.3 or below 9.2 34.2 56.7 100.0 F.4-F.7 12.7 35.1 52.2 100.0 Tertiary or above 22.6 38.8 38.7 100.0
* Occupation Managers and administers/
Professionals/ Associate professionals
16.4 42.1 41.4 100.0
Clerks/ Service workers and shop sales workers/ Blue-collar workers
13.4 32.4 54.2 100.0
Students 28.0 34.9 37.1 100.0 Housewives/ Home-makers/
Retired/ Unemployed 11.4 34.9 53.7 100.0
* Living district Hong Kong Island 18.0 35.0 47.0 100.0 Kowloon East 11.9 32.9 55.2 100.0 Kowloon West 10.4 46.6 43.0 100.0 New Territories East 13.7 33.4 52.9 100.0 New Territories West 20.0 38.6 41.4 100.0
* Monthly household income $19,999 or below 8.0 34.5 57.5 100.0 $20,000-$39,999 15.0 35.2 49.8 100.0 $40,000-$59,999 14.8 39.1 46.2 100.0 $60,000 or above 20.1 42.8 37.1 100.0
Notes: 1. * Chi-Square test indicates a significant relationship exists at 95% confidence level between the response to the question and the demographic attributes.
2. Figures on demographic attributes, those who answered “Don’t know/ Refuse to answer” are excluded.
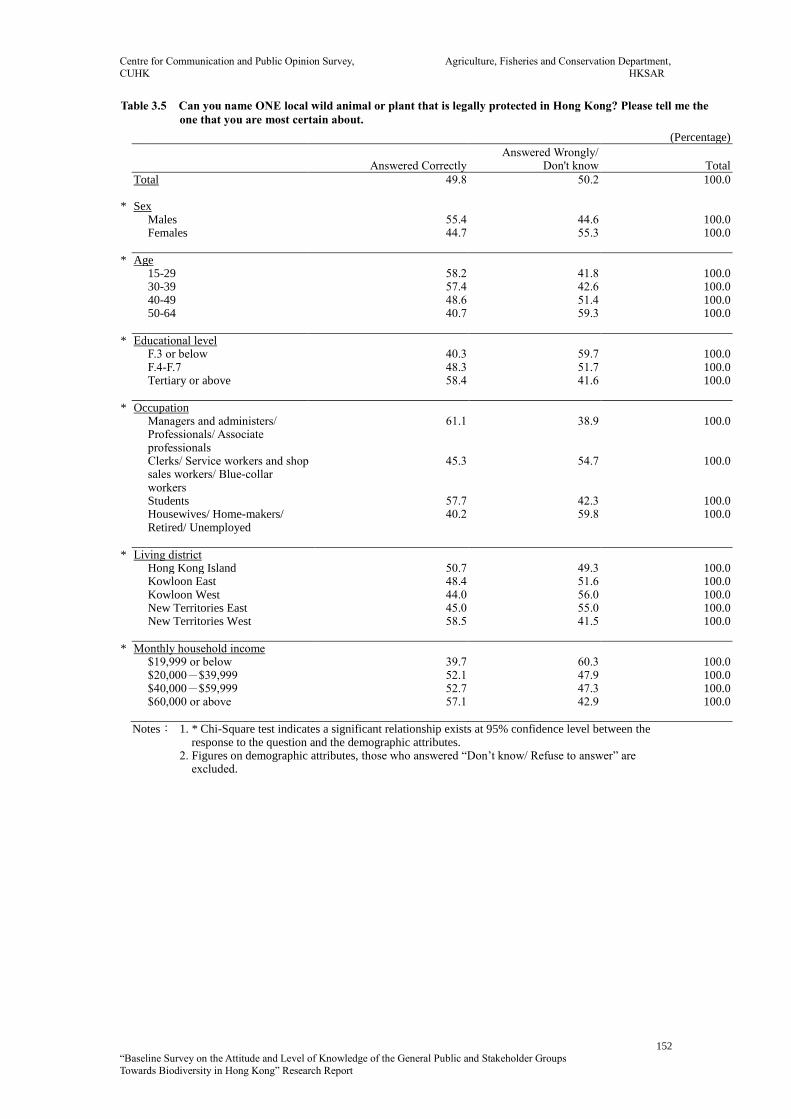
Centre for Communication and Public Opinion Survey, Agriculture, Fisheries and Conservation Department,
CUHK HKSAR
152
“Baseline Survey on the Attitude and Level of Knowledge of the General Public and Stakeholder Groups
Towards Biodiversity in Hong Kong” Research Report
Table 3.5 Can you name ONE local wild animal or plant that is legally protected in Hong Kong? Please tell me the
one that you are most certain about.
(Percentage)
Answered Correctly Answered Wrongly/
Don't know Total
Total 49.8 50.2 100.0 * Sex Males 55.4 44.6 100.0 Females 44.7 55.3 100.0
* Age 15-29 58.2 41.8 100.0 30-39 57.4 42.6 100.0 40-49 48.6 51.4 100.0 50-64 40.7 59.3 100.0
* Educational level F.3 or below 40.3 59.7 100.0 F.4-F.7 48.3 51.7 100.0 Tertiary or above 58.4 41.6 100.0
* Occupation Managers and administers/
Professionals/ Associate professionals
61.1 38.9 100.0
Clerks/ Service workers and shop sales workers/ Blue-collar workers
45.3 54.7 100.0
Students 57.7 42.3 100.0 Housewives/ Home-makers/
Retired/ Unemployed 40.2 59.8 100.0
* Living district Hong Kong Island 50.7 49.3 100.0 Kowloon East 48.4 51.6 100.0 Kowloon West 44.0 56.0 100.0 New Territories East 45.0 55.0 100.0 New Territories West 58.5 41.5 100.0
* Monthly household income $19,999 or below 39.7 60.3 100.0 $20,000-$39,999 52.1 47.9 100.0 $40,000-$59,999 52.7 47.3 100.0 $60,000 or above 57.1 42.9 100.0
Notes: 1. * Chi-Square test indicates a significant relationship exists at 95% confidence level between the response to the question and the demographic attributes.
2. Figures on demographic attributes, those who answered “Don’t know/ Refuse to answer” are excluded.
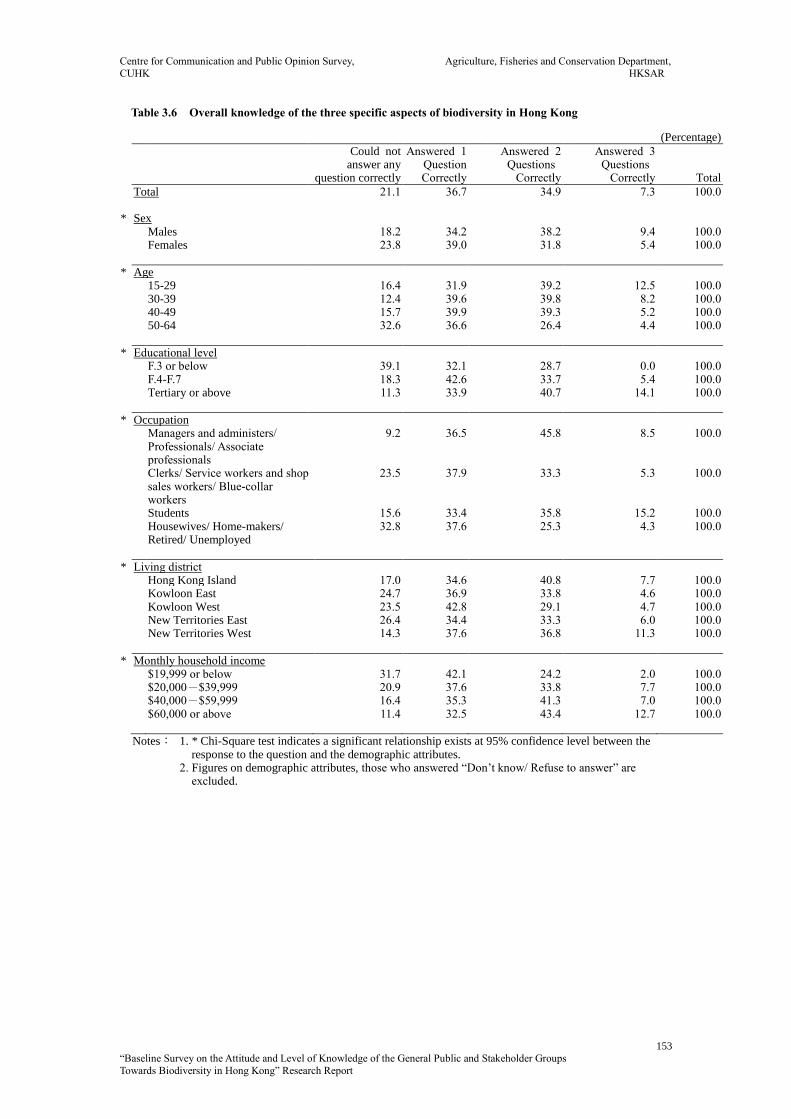
Centre for Communication and Public Opinion Survey, Agriculture, Fisheries and Conservation Department,
CUHK HKSAR
153
“Baseline Survey on the Attitude and Level of Knowledge of the General Public and Stakeholder Groups
Towards Biodiversity in Hong Kong” Research Report
Table 3.6 Overall knowledge of the three specific aspects of biodiversity in Hong Kong
(Percentage)
Could not answer any
question correctly
Answered 1 Question Correctly
Answered 2 Questions
Correctly
Answered 3 Questions
Correctly Total
Total 21.1 36.7 34.9 7.3 100.0 * Sex Males 18.2 34.2 38.2 9.4 100.0 Females 23.8 39.0 31.8 5.4 100.0
* Age 15-29 16.4 31.9 39.2 12.5 100.0 30-39 12.4 39.6 39.8 8.2 100.0 40-49 15.7 39.9 39.3 5.2 100.0 50-64 32.6 36.6 26.4 4.4 100.0
* Educational level F.3 or below 39.1 32.1 28.7 0.0 100.0 F.4-F.7 18.3 42.6 33.7 5.4 100.0 Tertiary or above 11.3 33.9 40.7 14.1 100.0
* Occupation Managers and administers/
Professionals/ Associate professionals
9.2 36.5 45.8 8.5 100.0
Clerks/ Service workers and shop sales workers/ Blue-collar workers
23.5 37.9 33.3 5.3 100.0
Students 15.6 33.4 35.8 15.2 100.0 Housewives/ Home-makers/
Retired/ Unemployed 32.8 37.6 25.3 4.3 100.0
* Living district Hong Kong Island 17.0 34.6 40.8 7.7 100.0 Kowloon East 24.7 36.9 33.8 4.6 100.0 Kowloon West 23.5 42.8 29.1 4.7 100.0 New Territories East 26.4 34.4 33.3 6.0 100.0 New Territories West 14.3 37.6 36.8 11.3 100.0
* Monthly household income $19,999 or below 31.7 42.1 24.2 2.0 100.0 $20,000-$39,999 20.9 37.6 33.8 7.7 100.0 $40,000-$59,999 16.4 35.3 41.3 7.0 100.0 $60,000 or above 11.4 32.5 43.4 12.7 100.0
Notes: 1. * Chi-Square test indicates a significant relationship exists at 95% confidence level between the response to the question and the demographic attributes.
2. Figures on demographic attributes, those who answered “Don’t know/ Refuse to answer” are excluded.

Centre for Communication and Public Opinion Survey, Agriculture, Fisheries and Conservation Department,
CUHK HKSAR
154
“Baseline Survey on the Attitude and Level of Knowledge of the General Public and Stakeholder Groups
Towards Biodiversity in Hong Kong” Research Report
Table 3.7 How concerned are you about the biodiversity in Hong Kong?
(Percentage)
Not concerned So-so
Concerned
No answer/ Refuse
to answer Total
Total 33.7 50.9 14.8 0.6 100.0 Sex Males 31.8 51.4 16.2 0.7 100.0 Females 35.4 50.5 13.5 0.6 100.0
Age 15-29 34.6 52.1 13.3 0.0 100.0 30-39 39.0 44.7 15.8 0.5 100.0 40-49 33.0 50.9 16.1 0.0 100.0 50-64 29.9 54.3 14.3 1.6 100.0
* Educational level F.3 or below 30.2 55.0 13.0 1.8 100.0 F.4-F.7 39.8 47.3 12.6 0.3 100.0 Tertiary or above 30.2 51.8 17.8 0.3 100.0
Occupation Managers and administers/
Professionals/ Associate professionals
27.1 54.8 17.8 0.4 100.0
Clerks/ Service workers and shop sales workers/ Blue-collar workers
34.3 51.4 13.4 0.9 100.0
Students 33.6 52.4 14.0 0.0 100.0 Housewives/ Home-makers/
Retired/ Unemployed 40.0 46.7 12.6 0.7 100.0
Living district Hong Kong Island 35.0 49.9 15.1 0.0 100.0 Kowloon East 38.3 49.6 11.6 0.5 100.0 Kowloon West 32.4 51.9 13.2 2.5 100.0 New Territories East 31.4 53.7 14.2 0.7 100.0 New Territories West 32.9 48.9 17.9 0.3 100.0
* Monthly household income $19,999 or below 39.3 44.2 14.3 2.2 100.0 $20,000-$39,999 36.3 50.2 13.0 0.5 100.0 $40,000-$59,999 27.4 58.0 14.6 0.0 100.0 $60,000 or above 30.1 52.4 17.5 0.0 100.0
Notes: 1. * Chi-Square test indicates a significant relationship exists at 95% confidence level between the response to the question and the demographic attributes.
2. Figures on demographic attributes, those who answered “Don’t know/ Refuse to answer” are excluded.

Centre for Communication and Public Opinion Survey, Agriculture, Fisheries and Conservation Department,
CUHK HKSAR
155
“Baseline Survey on the Attitude and Level of Knowledge of the General Public and Stakeholder Groups
Towards Biodiversity in Hong Kong” Research Report
Table 3.8 “Economic development is more important than preserving biodiversity.”
(Percentage)
Disagree So-so
Agree
No answer/ Refuse
to answer Total
Total 49.7 34.0 14.8 1.6 100.0 Sex Males 49.2 33.1 16.5 1.1 100.0 Females 50.1 34.8 13.1 2.0 100.0
* Age 15-29 66.8 22.1 11.1 0.0 100.0 30-39 57.1 27.0 13.1 2.8 100.0 40-49 45.6 42.0 10.9 1.5 100.0 50-64 36.3 40.9 20.8 2.1 100.0
* Educational level F.3 or below 32.7 46.1 18.2 3.0 100.0 F.4-F.7 47.3 34.9 15.8 2.0 100.0 Tertiary or above 63.8 24.8 11.4 0.0 100.0
* Occupation Managers and administers/
Professionals/ Associate professionals
60.2 28.1 11.7 0.0 100.0
Clerks/ Service workers and shop sales workers/ Blue-collar workers
43.7 39.4 15.8 1.2 100.0
Students 70.7 20.3 9.0 0.0 100.0 Housewives/ Home-makers/
Retired/ Unemployed 38.1 37.9 19.9 4.2 100.0
Living district Hong Kong Island 53.6 30.7 15.2 0.5 100.0 Kowloon East 44.8 37.9 14.2 3.1 100.0 Kowloon West 47.7 37.9 13.2 1.2 100.0 New Territories East 52.8 31.0 14.3 2.0 100.0 New Territories West 49.3 33.2 16.7 0.8 100.0
* Monthly household income $19,999 or below 39.2 41.6 15.1 4.1 100.0 $20,000-$39,999 49.9 34.1 14.4 1.6 100.0 $40,000-$59,999 59.9 25.9 13.6 0.6 100.0 $60,000 or above 56.3 29.8 13.4 0.5 100.0
Notes: 1. * Chi-Square test indicates a significant relationship exists at 95% confidence level between the response to the question and the demographic attributes.
2. Figures on demographic attributes, those who answered “Don’t know/ Refuse to answer” are excluded.

Centre for Communication and Public Opinion Survey, Agriculture, Fisheries and Conservation Department,
CUHK HKSAR
156
“Baseline Survey on the Attitude and Level of Knowledge of the General Public and Stakeholder Groups
Towards Biodiversity in Hong Kong” Research Report
Table 3.9 “It is very important to promote and educate the public on biodiversity.”
(Percentage)
Disagree So-so
Agree
No answer/ Refuse
to answer Total
Total 2.5 25.3 71.6 0.7 100.0 Sex Males 2.1 25.8 70.9 1.2 100.0 Females 2.8 24.8 72.1 0.3 100.0
* Age 15-29 0.5 14.4 85.1 0.0 100.0 30-39 3.6 21.0 73.6 1.9 100.0 40-49 3.1 29.2 67.7 0.0 100.0 50-64 2.9 32.5 63.5 1.0 100.0
* Educational level F.3 or below 2.0 40.8 54.7 2.5 100.0 F.4-F.7 3.9 23.3 72.6 0.2 100.0 Tertiary or above 1.5 16.3 82.2 0.0 100.0
* Occupation Managers and administers/
Professionals/ Associate professionals
1.9 20.4 77.7 0.0 100.0
Clerks/ Service workers and shop sales workers/ Blue-collar workers
4.0 28.5 67.2 0.3 100.0
Students 0.0 11.0 89.0 0.0 100.0 Housewives/ Home-makers/
Retired/ Unemployed 2.3 32.7 62.5 2.4 100.0
Living district Hong Kong Island 0.9 26.2 72.9 0.0 100.0 Kowloon East 2.7 24.7 70.8 1.8 100.0 Kowloon West 0.0 25.5 74.5 0.0 100.0 New Territories East 3.4 24.0 71.9 0.7 100.0 New Territories West 3.4 25.9 70.0 0.7 100.0
* Monthly household income $19,999 or below 2.2 31.3 64.3 2.2 100.0 $20,000-$39,999 2.2 27.9 69.9 0.0 100.0 $40,000-$59,999 3.3 18.0 78.3 0.5 100.0 $60,000 or above 2.4 19.9 77.6 0.0 100.0
Notes: 1. * Chi-Square test indicates a significant relationship exists at 95% confidence level between the response to the question and the demographic attributes.
2. Figures on demographic attributes, those who answered “Don’t know/ Refuse to answer” are excluded.
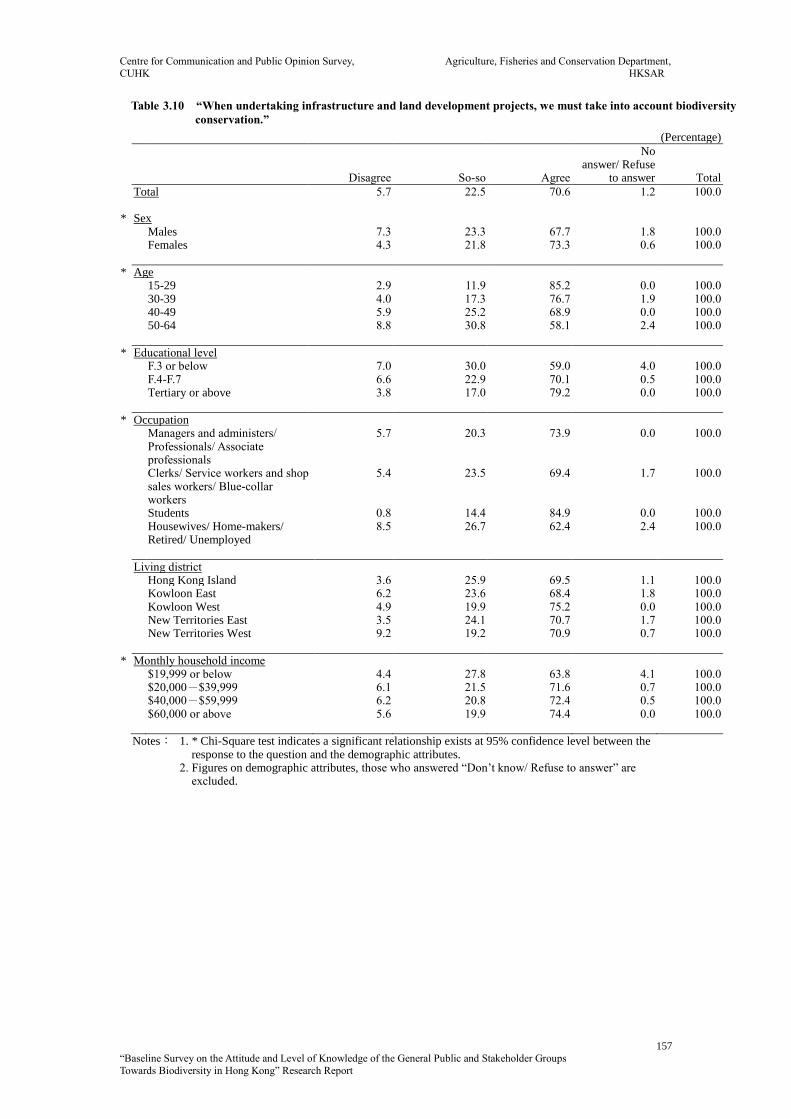
Centre for Communication and Public Opinion Survey, Agriculture, Fisheries and Conservation Department,
CUHK HKSAR
157
“Baseline Survey on the Attitude and Level of Knowledge of the General Public and Stakeholder Groups
Towards Biodiversity in Hong Kong” Research Report
Table 3.10 “When undertaking infrastructure and land development projects, we must take into account biodiversity
conservation.”
(Percentage)
Disagree So-so
Agree
No answer/ Refuse
to answer Total
Total 5.7 22.5 70.6 1.2 100.0 * Sex Males 7.3 23.3 67.7 1.8 100.0 Females 4.3 21.8 73.3 0.6 100.0
* Age 15-29 2.9 11.9 85.2 0.0 100.0 30-39 4.0 17.3 76.7 1.9 100.0 40-49 5.9 25.2 68.9 0.0 100.0 50-64 8.8 30.8 58.1 2.4 100.0
* Educational level F.3 or below 7.0 30.0 59.0 4.0 100.0 F.4-F.7 6.6 22.9 70.1 0.5 100.0 Tertiary or above 3.8 17.0 79.2 0.0 100.0
* Occupation Managers and administers/
Professionals/ Associate professionals
5.7 20.3 73.9 0.0 100.0
Clerks/ Service workers and shop sales workers/ Blue-collar workers
5.4 23.5 69.4 1.7 100.0
Students 0.8 14.4 84.9 0.0 100.0 Housewives/ Home-makers/
Retired/ Unemployed 8.5 26.7 62.4 2.4 100.0
Living district Hong Kong Island 3.6 25.9 69.5 1.1 100.0 Kowloon East 6.2 23.6 68.4 1.8 100.0 Kowloon West 4.9 19.9 75.2 0.0 100.0 New Territories East 3.5 24.1 70.7 1.7 100.0 New Territories West 9.2 19.2 70.9 0.7 100.0
* Monthly household income $19,999 or below 4.4 27.8 63.8 4.1 100.0 $20,000-$39,999 6.1 21.5 71.6 0.7 100.0 $40,000-$59,999 6.2 20.8 72.4 0.5 100.0 $60,000 or above 5.6 19.9 74.4 0.0 100.0
Notes: 1. * Chi-Square test indicates a significant relationship exists at 95% confidence level between the response to the question and the demographic attributes.
2. Figures on demographic attributes, those who answered “Don’t know/ Refuse to answer” are excluded.

Centre for Communication and Public Opinion Survey, Agriculture, Fisheries and Conservation Department,
CUHK HKSAR
158
“Baseline Survey on the Attitude and Level of Knowledge of the General Public and Stakeholder Groups
Towards Biodiversity in Hong Kong” Research Report
Table 3.11 “Preserving the biodiversity in Hong Kong is a huge responsibility of the government.”
(Percentage)
Disagree So-so
Agree
No answer/ Refuse
to answer Total
Total 2.7 17.4 79.3 0.6 100.0 Sex Males 3.4 19.3 76.7 0.6 100.0 Females 2.1 15.6 81.7 0.6 100.0
* Age 15-29 0.8 11.1 87.8 0.2 100.0 30-39 2.9 13.9 83.3 0.0 100.0 40-49 3.9 18.3 76.5 1.2 100.0 50-64 3.4 22.4 73.4 0.8 100.0
* Educational level F.3 or below 1.7 27.8 68.7 1.9 100.0 F.4-F.7 4.2 18.0 77.7 0.0 100.0 Tertiary or above 1.7 9.6 88.5 0.3 100.0
Occupation Managers and administers/
Professionals/ Associate professionals
2.8 13.8 83.3 0.2 100.0
Clerks/ Service workers and shop sales workers/ Blue-collar workers
2.9 17.9 78.9 0.3 100.0
Students 0.4 14.2 85.0 0.4 100.0 Housewives/ Home-makers/
Retired/ Unemployed 3.5 22.6 72.5 1.5 100.0
* Living district Hong Kong Island 2.4 17.4 80.2 0.0 100.0 Kowloon East 3.1 19.2 77.7 0.0 100.0 Kowloon West 0.7 13.7 85.5 0.0 100.0 New Territories East 0.7 15.3 82.9 1.1 100.0 New Territories West 5.5 19.8 73.5 1.2 100.0
* Monthly household income $19,999 or below 2.3 25.1 71.6 0.9 100.0 $20,000-$39,999 3.6 16.3 80.1 0.0 100.0 $40,000-$59,999 2.5 14.4 82.5 0.5 100.0 $60,000 or above 2.0 13.8 84.2 0.0 100.0
Notes: 1. * Chi-Square test indicates a significant relationship exists at 95% confidence level between the response to the question and the demographic attributes.
2. Figures on demographic attributes, those who answered “Don’t know/ Refuse to answer” are excluded.
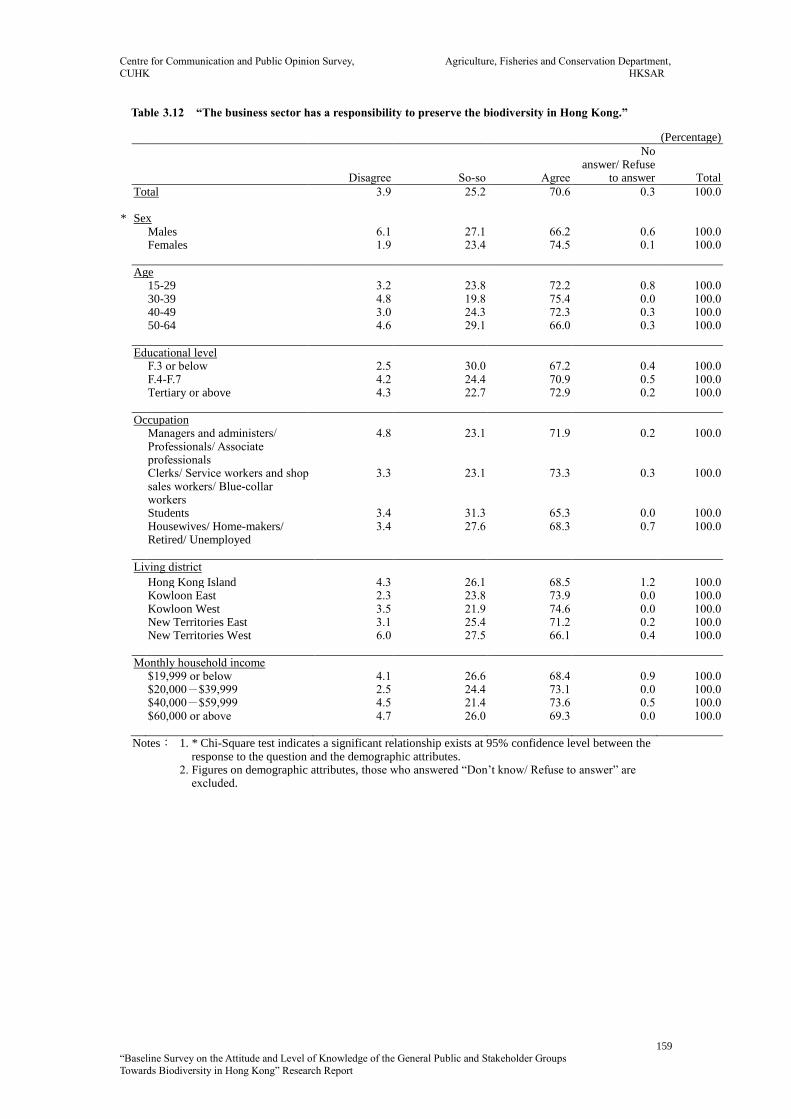
Centre for Communication and Public Opinion Survey, Agriculture, Fisheries and Conservation Department,
CUHK HKSAR
159
“Baseline Survey on the Attitude and Level of Knowledge of the General Public and Stakeholder Groups
Towards Biodiversity in Hong Kong” Research Report
Table 3.12 “The business sector has a responsibility to preserve the biodiversity in Hong Kong.”
(Percentage)
Disagree So-so
Agree
No answer/ Refuse
to answer Total
Total 3.9 25.2 70.6 0.3 100.0 * Sex Males 6.1 27.1 66.2 0.6 100.0 Females 1.9 23.4 74.5 0.1 100.0
Age 15-29 3.2 23.8 72.2 0.8 100.0 30-39 4.8 19.8 75.4 0.0 100.0 40-49 3.0 24.3 72.3 0.3 100.0 50-64 4.6 29.1 66.0 0.3 100.0
Educational level F.3 or below 2.5 30.0 67.2 0.4 100.0 F.4-F.7 4.2 24.4 70.9 0.5 100.0 Tertiary or above 4.3 22.7 72.9 0.2 100.0
Occupation Managers and administers/
Professionals/ Associate professionals
4.8 23.1 71.9 0.2 100.0
Clerks/ Service workers and shop sales workers/ Blue-collar workers
3.3 23.1 73.3 0.3 100.0
Students 3.4 31.3 65.3 0.0 100.0 Housewives/ Home-makers/
Retired/ Unemployed 3.4 27.6 68.3 0.7 100.0
Living district
Hong Kong Island 4.3 26.1 68.5 1.2 100.0 Kowloon East 2.3 23.8 73.9 0.0 100.0 Kowloon West 3.5 21.9 74.6 0.0 100.0 New Territories East 3.1 25.4 71.2 0.2 100.0 New Territories West 6.0 27.5 66.1 0.4 100.0
Monthly household income $19,999 or below 4.1 26.6 68.4 0.9 100.0 $20,000-$39,999 2.5 24.4 73.1 0.0 100.0 $40,000-$59,999 4.5 21.4 73.6 0.5 100.0 $60,000 or above 4.7 26.0 69.3 0.0 100.0
Notes: 1. * Chi-Square test indicates a significant relationship exists at 95% confidence level between the response to the question and the demographic attributes.
2. Figures on demographic attributes, those who answered “Don’t know/ Refuse to answer” are excluded.
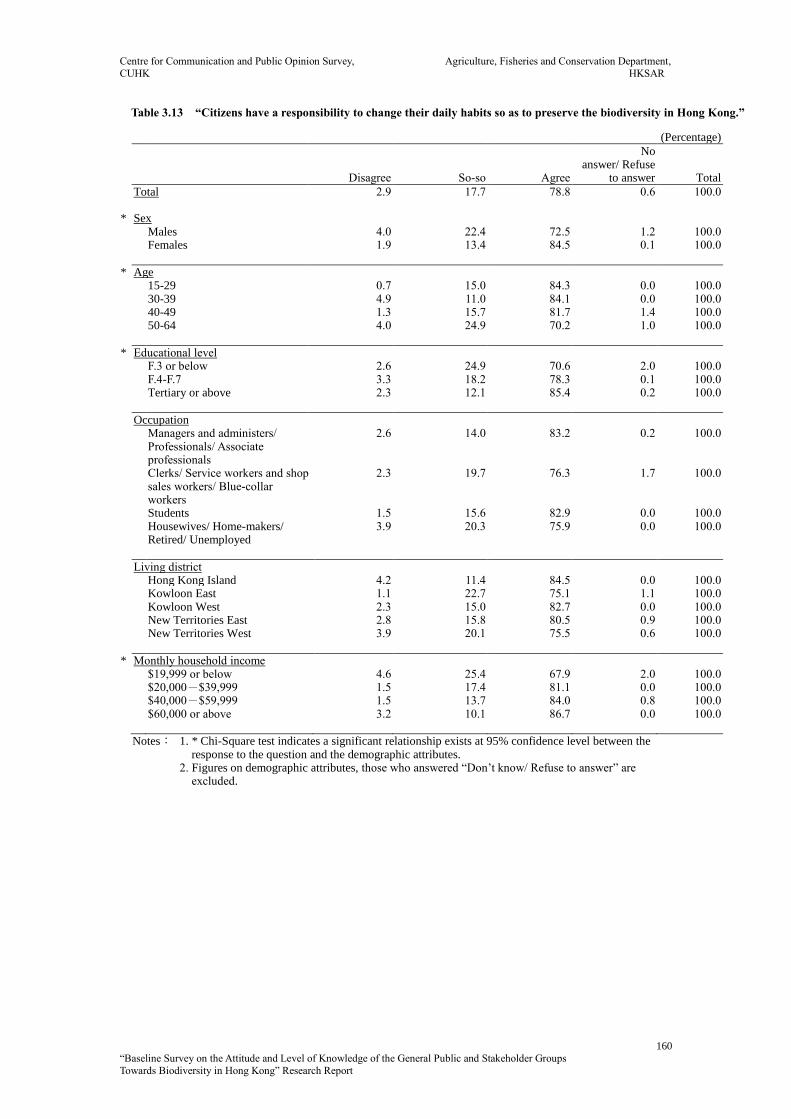
Centre for Communication and Public Opinion Survey, Agriculture, Fisheries and Conservation Department,
CUHK HKSAR
160
“Baseline Survey on the Attitude and Level of Knowledge of the General Public and Stakeholder Groups
Towards Biodiversity in Hong Kong” Research Report
Table 3.13 “Citizens have a responsibility to change their daily habits so as to preserve the biodiversity in Hong Kong.”
(Percentage)
Disagree So-so
Agree
No answer/ Refuse
to answer Total
Total 2.9 17.7 78.8 0.6 100.0 * Sex Males 4.0 22.4 72.5 1.2 100.0 Females 1.9 13.4 84.5 0.1 100.0
* Age 15-29 0.7 15.0 84.3 0.0 100.0 30-39 4.9 11.0 84.1 0.0 100.0 40-49 1.3 15.7 81.7 1.4 100.0 50-64 4.0 24.9 70.2 1.0 100.0
* Educational level F.3 or below 2.6 24.9 70.6 2.0 100.0 F.4-F.7 3.3 18.2 78.3 0.1 100.0 Tertiary or above 2.3 12.1 85.4 0.2 100.0
Occupation Managers and administers/
Professionals/ Associate professionals
2.6 14.0 83.2 0.2 100.0
Clerks/ Service workers and shop sales workers/ Blue-collar workers
2.3 19.7 76.3 1.7 100.0
Students 1.5 15.6 82.9 0.0 100.0 Housewives/ Home-makers/
Retired/ Unemployed 3.9 20.3 75.9 0.0 100.0
Living district Hong Kong Island 4.2 11.4 84.5 0.0 100.0 Kowloon East 1.1 22.7 75.1 1.1 100.0 Kowloon West 2.3 15.0 82.7 0.0 100.0 New Territories East 2.8 15.8 80.5 0.9 100.0 New Territories West 3.9 20.1 75.5 0.6 100.0
* Monthly household income $19,999 or below 4.6 25.4 67.9 2.0 100.0 $20,000-$39,999 1.5 17.4 81.1 0.0 100.0 $40,000-$59,999 1.5 13.7 84.0 0.8 100.0 $60,000 or above 3.2 10.1 86.7 0.0 100.0
Notes: 1. * Chi-Square test indicates a significant relationship exists at 95% confidence level between the response to the question and the demographic attributes.
2. Figures on demographic attributes, those who answered “Don’t know/ Refuse to answer” are excluded.
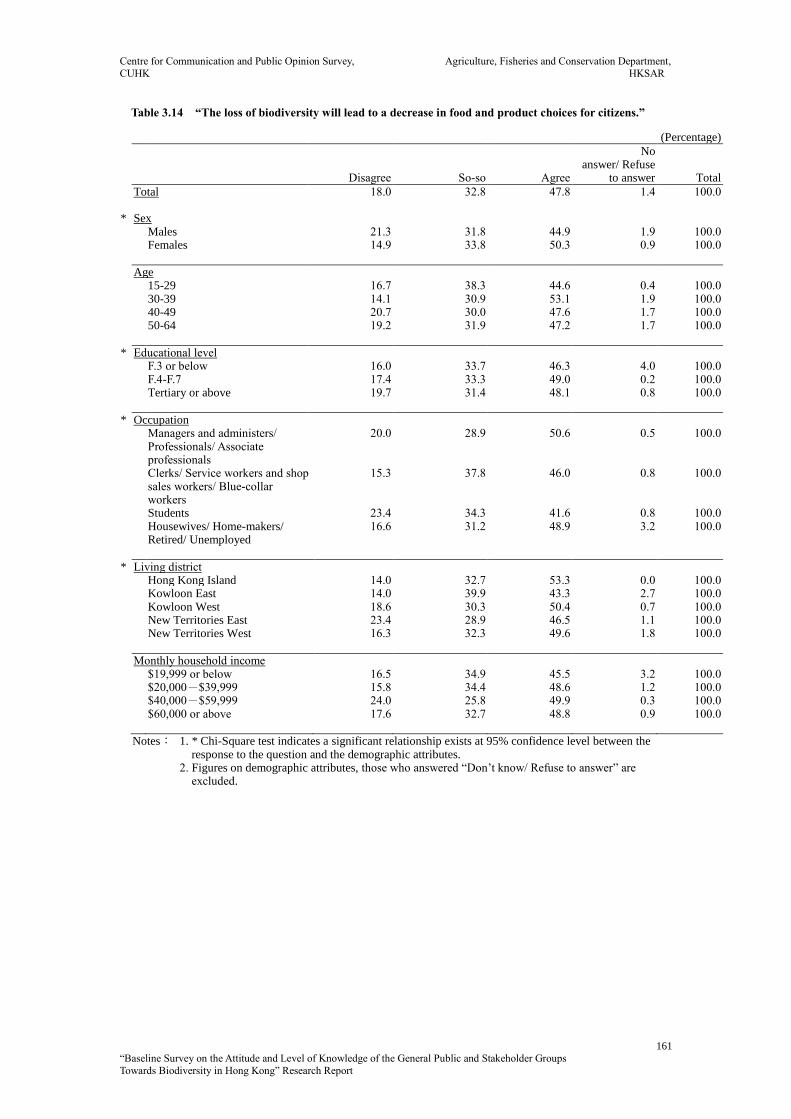
Centre for Communication and Public Opinion Survey, Agriculture, Fisheries and Conservation Department,
CUHK HKSAR
161
“Baseline Survey on the Attitude and Level of Knowledge of the General Public and Stakeholder Groups
Towards Biodiversity in Hong Kong” Research Report
Table 3.14 “The loss of biodiversity will lead to a decrease in food and product choices for citizens.”
(Percentage)
Disagree So-so
Agree
No answer/ Refuse
to answer Total
Total 18.0 32.8 47.8 1.4 100.0 * Sex Males 21.3 31.8 44.9 1.9 100.0 Females 14.9 33.8 50.3 0.9 100.0
Age 15-29 16.7 38.3 44.6 0.4 100.0 30-39 14.1 30.9 53.1 1.9 100.0 40-49 20.7 30.0 47.6 1.7 100.0 50-64 19.2 31.9 47.2 1.7 100.0
* Educational level F.3 or below 16.0 33.7 46.3 4.0 100.0 F.4-F.7 17.4 33.3 49.0 0.2 100.0 Tertiary or above 19.7 31.4 48.1 0.8 100.0
* Occupation Managers and administers/
Professionals/ Associate professionals
20.0 28.9 50.6 0.5 100.0
Clerks/ Service workers and shop sales workers/ Blue-collar workers
15.3 37.8 46.0 0.8 100.0
Students 23.4 34.3 41.6 0.8 100.0 Housewives/ Home-makers/
Retired/ Unemployed 16.6 31.2 48.9 3.2 100.0
* Living district Hong Kong Island 14.0 32.7 53.3 0.0 100.0 Kowloon East 14.0 39.9 43.3 2.7 100.0 Kowloon West 18.6 30.3 50.4 0.7 100.0 New Territories East 23.4 28.9 46.5 1.1 100.0 New Territories West 16.3 32.3 49.6 1.8 100.0
Monthly household income $19,999 or below 16.5 34.9 45.5 3.2 100.0 $20,000-$39,999 15.8 34.4 48.6 1.2 100.0 $40,000-$59,999 24.0 25.8 49.9 0.3 100.0 $60,000 or above 17.6 32.7 48.8 0.9 100.0
Notes: 1. * Chi-Square test indicates a significant relationship exists at 95% confidence level between the response to the question and the demographic attributes.
2. Figures on demographic attributes, those who answered “Don’t know/ Refuse to answer” are excluded.

Centre for Communication and Public Opinion Survey, Agriculture, Fisheries and Conservation Department,
CUHK HKSAR
162
“Baseline Survey on the Attitude and Level of Knowledge of the General Public and Stakeholder Groups
Towards Biodiversity in Hong Kong” Research Report
Table 3.15 “The loss of biodiversity will affect citizens’ health.”
(Percentage)
Disagree So-so
Agree
No answer/ Refuse
to answer Total
Total 16.1 34.7 48.4 0.9 100.0 * Sex Males 18.7 35.3 45.8 0.3 100.0 Females 13.6 34.1 50.8 1.5 100.0
* Age 15-29 14.0 43.9 42.1 0.0 100.0 30-39 15.3 35.1 49.6 0.0 100.0 40-49 18.0 27.1 53.2 1.7 100.0 50-64 17.3 32.1 49.2 1.5 100.0
Educational level F.3 or below 18.7 36.8 43.1 1.4 100.0 F.4-F.7 16.7 37.3 45.3 0.7 100.0 Tertiary or above 13.6 30.4 55.2 0.8 100.0
Occupation Managers and administers/
Professionals/ Associate professionals
14.9 31.9 52.6 0.6 100.0
Clerks/ Service workers and shop sales workers/ Blue-collar workers
16.7 35.6 47.6 0.2 100.0
Students 16.7 41.6 41.8 0.0 100.0 Housewives/ Home-makers/
Retired/ Unemployed 16.6 32.9 48.3 2.3 100.0
Living district Hong Kong Island 11.2 38.3 49.1 1.4 100.0 Kowloon East 19.5 32.8 45.3 2.3 100.0 Kowloon West 10.3 35.6 53.4 0.8 100.0 New Territories East 19.6 31.8 48.2 0.5 100.0 New Territories West 14.9 35.7 49.3 0.0 100.0
Monthly household income $19,999 or below 19.7 36.5 42.9 0.9 100.0 $20,000-$39,999 17.1 31.7 50.2 0.9 100.0 $40,000-$59,999 14.1 29.8 55.0 1.1 100.0 $60,000 or above 13.7 35.1 50.8 0.4 100.0
Notes: 1. * Chi-Square test indicates a significant relationship exists at 95% confidence level between the response to the question and the demographic attributes.
2. Figures on demographic attributes, those who answered “Don’t know/ Refuse to answer” are excluded.

Centre for Communication and Public Opinion Survey, Agriculture, Fisheries and Conservation Department,
CUHK HKSAR
163
“Baseline Survey on the Attitude and Level of Knowledge of the General Public and Stakeholder Groups
Towards Biodiversity in Hong Kong” Research Report
Table 3.16 “The loss of biodiversity will affect citizens’ living environment.”
(Percentage)
Disagree So-so
Agree
No answer/ Refuse
to answer Total
Total 13.4 29.2 56.9 0.5 100.0 * Sex Males 18.0 31.0 50.8 0.3 100.0 Females 9.3 27.4 62.6 0.7 100.0
* Age 15-29 9.8 31.0 59.2 0.0 100.0 30-39 13.4 29.3 57.3 0.0 100.0 40-49 14.9 21.2 62.1 1.7 100.0 50-64 15.6 33.0 51.1 0.4 100.0
* Educational level F.3 or below 16.1 33.4 49.7 0.8 100.0 F.4-F.7 14.8 31.2 53.7 0.3 100.0 Tertiary or above 10.2 24.2 65.1 0.5 100.0
Occupation Managers and administers/
Professionals/ Associate professionals
15.8 25.6 58.4 0.2 100.0
Clerks/ Service workers and shop sales workers/ Blue-collar workers
13.9 31.1 54.3 0.8 100.0
Students 7.1 28.4 64.4 0.0 100.0 Housewives/ Home-makers/
Retired/ Unemployed 13.4 30.7 55.5 0.4 100.0
Living district Hong Kong Island 10.3 31.5 57.1 1.0 100.0 Kowloon East 13.6 29.3 57.1 0.0 100.0 Kowloon West 11.6 25.4 63.0 0.0 100.0 New Territories East 14.8 27.7 56.4 1.2 100.0 New Territories West 14.8 30.4 54.8 0.0 100.0
Monthly household income $19,999 or below 13.4 36.6 48.6 1.4 100.0 $20,000-$39,999 15.4 28.7 55.7 0.2 100.0 $40,000-$59,999 12.9 24.5 62.6 0.0 100.0 $60,000 or above 12.3 26.5 60.8 0.4 100.0
Notes: 1. * Chi-Square test indicates a significant relationship exists at 95% confidence level between the response to the question and the demographic attributes.
2. Figures on demographic attributes, those who answered “Don’t know/ Refuse to answer” are excluded.

Centre for Communication and Public Opinion Survey, Agriculture, Fisheries and Conservation Department,
CUHK HKSAR
164
“Baseline Survey on the Attitude and Level of Knowledge of the General Public and Stakeholder Groups
Towards Biodiversity in Hong Kong” Research Report
Table 3.17 “Preserving biodiversity can enrich the leisure life of citizens.”
(Percentage)
Disagree So-so
Agree
No answer/ Refuse
to answer Total
Total 4.6 30.0 64.9 0.5 100.0 Sex Males 6.0 28.4 65.2 0.5 100.0 Females 3.3 31.5 64.6 0.6 100.0
* Age 15-29 1.5 34.6 63.5 0.4 100.0 30-39 3.4 30.0 66.6 0.0 100.0 40-49 7.7 25.2 66.0 1.1 100.0 50-64 5.8 30.1 63.6 0.5 100.0
* Educational level F.3 or below 4.8 33.5 61.4 0.3 100.0 F.4-F.7 7.0 32.7 59.7 0.6 100.0 Tertiary or above 2.2 24.7 72.5 0.5 100.0
* Occupation Managers and administers/
Professionals/ Associate professionals
4.0 20.8 74.7 0.5 100.0
Clerks/ Service workers and shop sales workers/ Blue-collar workers
4.8 33.9 60.9 0.3 100.0
Students 1.3 38.4 59.6 0.8 100.0 Housewives/ Home-makers/
Retired/ Unemployed 5.3 31.8 62.1 0.7 100.0
Living district Hong Kong Island 2.1 31.8 65.1 1.0 100.0 Kowloon East 4.6 33.5 61.5 0.4 100.0 Kowloon West 8.0 25.2 66.5 0.4 100.0 New Territories East 2.9 26.5 70.1 0.5 100.0 New Territories West 6.8 31.6 61.3 0.3 100.0
Monthly household income $19,999 or below 6.2 33.7 59.6 0.5 100.0 $20,000-$39,999 5.2 31.1 63.3 0.4 100.0 $40,000-$59,999 3.4 25.0 71.6 0.0 100.0 $60,000 or above 3.3 25.9 70.3 0.6 100.0
Notes: 1. * Chi-Square test indicates a significant relationship exists at 95% confidence level between the response to the question and the demographic attributes.
2. Figures on demographic attributes, those who answered “Don’t know/ Refuse to answer” are excluded.

Centre for Communication and Public Opinion Survey, Agriculture, Fisheries and Conservation Department,
CUHK HKSAR
165
“Baseline Survey on the Attitude and Level of Knowledge of the General Public and Stakeholder Groups
Towards Biodiversity in Hong Kong” Research Report
Table 3.18 “Preserving biodiversity can bring economic gains to Hong Kong.”
(Percentage)
Disagree So-so
Agree
No answer/ Refuse
to answer Total
Total 12.3 45.2 40.8 1.6 100.0 Sex Males 14.9 43.5 39.7 2.0 100.0 Females 10.0 46.8 41.9 1.3 100.0
* Age 15-29 8.4 46.4 44.7 0.5 100.0 30-39 7.3 45.6 47.1 0.0 100.0 40-49 12.6 45.2 39.5 2.8 100.0 50-64 17.9 44.3 35.3 2.5 100.0
* Educational level F.3 or below 13.1 38.7 44.9 3.3 100.0 F.4-F.7 12.5 50.8 35.9 0.8 100.0 Tertiary or above 11.4 44.5 42.8 1.3 100.0
* Occupation Managers and administers/
Professionals/ Associate professionals
15.8 35.1 47.7 1.4 100.0
Clerks/ Service workers and shop sales workers/ Blue-collar workers
9.5 52.0 37.5 1.0 100.0
Students 8.3 52.5 39.3 0.0 100.0 Housewives/ Home-makers/
Retired/ Unemployed 14.4 43.3 39.8 2.6 100.0
Living district Hong Kong Island 10.2 44.8 43.2 1.8 100.0 Kowloon East 13.4 47.8 35.9 2.9 100.0 Kowloon West 15.8 37.9 45.2 1.1 100.0 New Territories East 10.7 43.0 44.9 1.5 100.0 New Territories West 13.2 48.6 37.3 0.9 100.0
Monthly household income $19,999 or below 11.5 42.6 43.7 2.2 100.0 $20,000-$39,999 9.3 49.6 39.0 2.1 100.0 $40,000-$59,999 15.5 42.3 41.7 0.5 100.0 $60,000 or above 13.0 45.2 41.4 0.4 100.0
Notes: 1. * Chi-Square test indicates a significant relationship exists at 95% confidence level between the response to the question and the demographic attributes.
2. Figures on demographic attributes, those who answered “Don’t know/ Refuse to answer” are excluded.
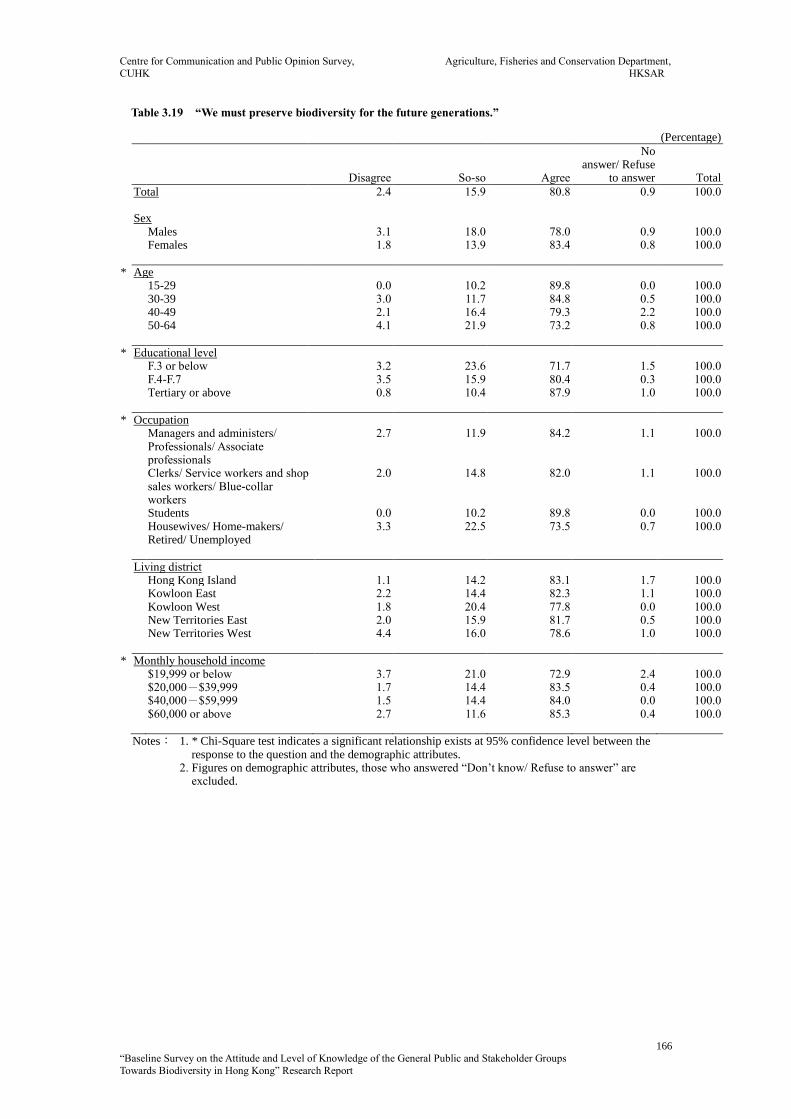
Centre for Communication and Public Opinion Survey, Agriculture, Fisheries and Conservation Department,
CUHK HKSAR
166
“Baseline Survey on the Attitude and Level of Knowledge of the General Public and Stakeholder Groups
Towards Biodiversity in Hong Kong” Research Report
Table 3.19 “We must preserve biodiversity for the future generations.”
(Percentage)
Disagree So-so
Agree
No answer/ Refuse
to answer Total
Total 2.4 15.9 80.8 0.9 100.0 Sex Males 3.1 18.0 78.0 0.9 100.0 Females 1.8 13.9 83.4 0.8 100.0
* Age 15-29 0.0 10.2 89.8 0.0 100.0 30-39 3.0 11.7 84.8 0.5 100.0 40-49 2.1 16.4 79.3 2.2 100.0 50-64 4.1 21.9 73.2 0.8 100.0
* Educational level F.3 or below 3.2 23.6 71.7 1.5 100.0 F.4-F.7 3.5 15.9 80.4 0.3 100.0 Tertiary or above 0.8 10.4 87.9 1.0 100.0
* Occupation Managers and administers/
Professionals/ Associate professionals
2.7 11.9 84.2 1.1 100.0
Clerks/ Service workers and shop sales workers/ Blue-collar workers
2.0 14.8 82.0 1.1 100.0
Students 0.0 10.2 89.8 0.0 100.0 Housewives/ Home-makers/
Retired/ Unemployed 3.3 22.5 73.5 0.7 100.0
Living district Hong Kong Island 1.1 14.2 83.1 1.7 100.0 Kowloon East 2.2 14.4 82.3 1.1 100.0 Kowloon West 1.8 20.4 77.8 0.0 100.0 New Territories East 2.0 15.9 81.7 0.5 100.0 New Territories West 4.4 16.0 78.6 1.0 100.0
* Monthly household income $19,999 or below 3.7 21.0 72.9 2.4 100.0 $20,000-$39,999 1.7 14.4 83.5 0.4 100.0 $40,000-$59,999 1.5 14.4 84.0 0.0 100.0 $60,000 or above 2.7 11.6 85.3 0.4 100.0
Notes: 1. * Chi-Square test indicates a significant relationship exists at 95% confidence level between the response to the question and the demographic attributes.
2. Figures on demographic attributes, those who answered “Don’t know/ Refuse to answer” are excluded.

Centre for Communication and Public Opinion Survey, Agriculture, Fisheries and Conservation Department,
CUHK HKSAR
167
“Baseline Survey on the Attitude and Level of Knowledge of the General Public and Stakeholder Groups
Towards Biodiversity in Hong Kong” Research Report
Table 3.20 Will you boycott products and services that would harm biodiversity?
(Percentage)
Will not Half& half
Will
No answer/ Refuse
to answer Total
Total 20.5 39.1 40.1 0.3 100.0 Sex Males 22.7 36.1 40.8 0.4 100.0 Females 18.5 41.8 39.5 0.3 100.0
Age 15-29 19.5 38.8 41.6 0.0 100.0 30-39 16.0 42.2 41.8 0.0 100.0 40-49 22.7 34.2 41.7 1.4 100.0 50-64 22.7 40.0 37.2 0.2 100.0
* Educational level F.3 or below 25.4 44.9 29.7 0.0 100.0 F.4-F.7 22.5 37.7 39.3 0.6 100.0 Tertiary or above 15.2 36.5 47.9 0.3 100.0
* Occupation Managers and administers/
Professionals/ Associate professionals
17.1 32.8 49.6 0.5 100.0
Clerks/ Service workers and shop sales workers/ Blue-collar workers
21.2 40.1 38.4 0.4 100.0
Students 22.7 39.7 37.6 0.0 100.0 Housewives/ Home-makers/
Retired/ Unemployed 22.2 44.8 32.6 0.4 100.0
Living district Hong Kong Island 20.4 34.3 45.3 0.0 100.0 Kowloon East 20.4 39.7 38.9 1.1 100.0 Kowloon West 21.7 33.9 44.4 0.0 100.0 New Territories East 18.1 42.3 39.4 0.2 100.0 New Territories West 22.1 40.9 36.7 0.2 100.0
* Monthly household income $19,999 or below 22.7 44.6 32.7 0.0 100.0 $20,000-$39,999 23.1 38.3 37.9 0.7 100.0 $40,000-$59,999 15.4 36.0 48.2 0.3 100.0 $60,000 or above 18.2 32.6 49.2 0.0 100.0
Notes: 1. * Chi-Square test indicates a significant relationship exists at 95% confidence level between the response to the question and the demographic attributes.
2. Figures on demographic attributes, those who answered “Don’t know/ Refuse to answer” are excluded.
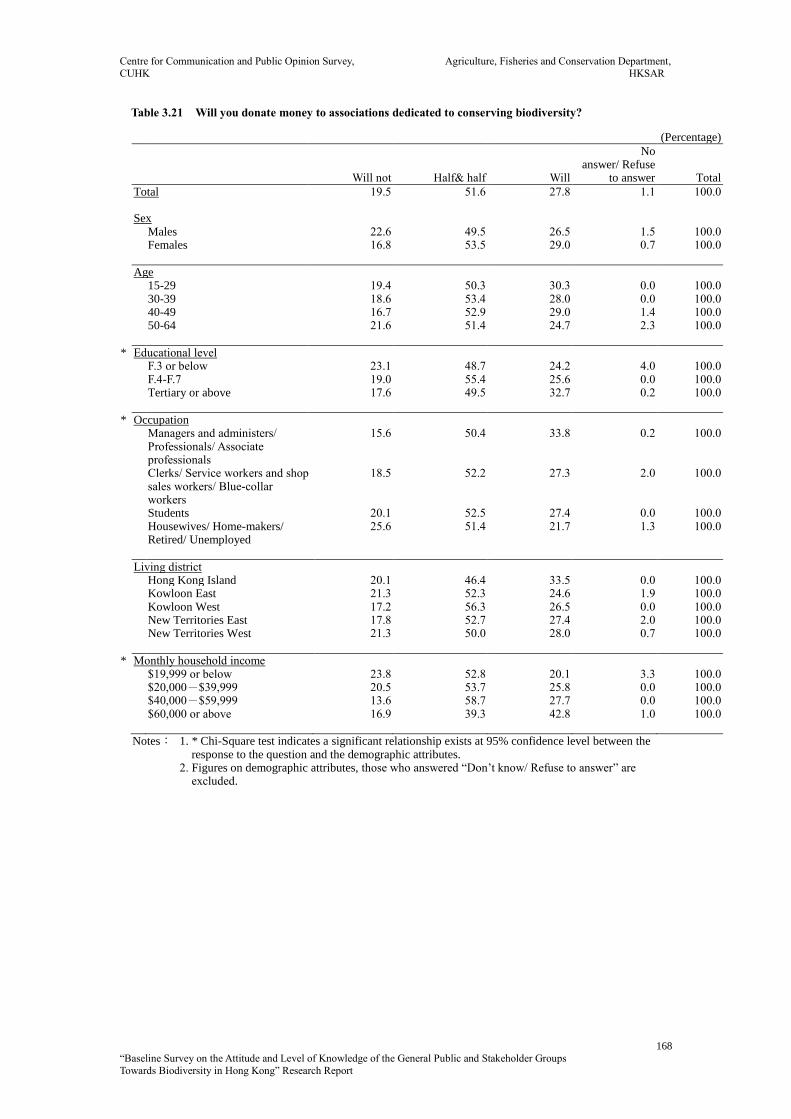
Centre for Communication and Public Opinion Survey, Agriculture, Fisheries and Conservation Department,
CUHK HKSAR
168
“Baseline Survey on the Attitude and Level of Knowledge of the General Public and Stakeholder Groups
Towards Biodiversity in Hong Kong” Research Report
Table 3.21 Will you donate money to associations dedicated to conserving biodiversity?
(Percentage)
Will not Half& half
Will
No answer/ Refuse
to answer Total
Total 19.5 51.6 27.8 1.1 100.0 Sex Males 22.6 49.5 26.5 1.5 100.0 Females 16.8 53.5 29.0 0.7 100.0
Age 15-29 19.4 50.3 30.3 0.0 100.0 30-39 18.6 53.4 28.0 0.0 100.0 40-49 16.7 52.9 29.0 1.4 100.0 50-64 21.6 51.4 24.7 2.3 100.0
* Educational level F.3 or below 23.1 48.7 24.2 4.0 100.0 F.4-F.7 19.0 55.4 25.6 0.0 100.0 Tertiary or above 17.6 49.5 32.7 0.2 100.0
* Occupation Managers and administers/
Professionals/ Associate professionals
15.6 50.4 33.8 0.2 100.0
Clerks/ Service workers and shop sales workers/ Blue-collar workers
18.5 52.2 27.3 2.0 100.0
Students 20.1 52.5 27.4 0.0 100.0 Housewives/ Home-makers/
Retired/ Unemployed 25.6 51.4 21.7 1.3 100.0
Living district Hong Kong Island 20.1 46.4 33.5 0.0 100.0 Kowloon East 21.3 52.3 24.6 1.9 100.0 Kowloon West 17.2 56.3 26.5 0.0 100.0 New Territories East 17.8 52.7 27.4 2.0 100.0 New Territories West 21.3 50.0 28.0 0.7 100.0
* Monthly household income $19,999 or below 23.8 52.8 20.1 3.3 100.0 $20,000-$39,999 20.5 53.7 25.8 0.0 100.0 $40,000-$59,999 13.6 58.7 27.7 0.0 100.0 $60,000 or above 16.9 39.3 42.8 1.0 100.0
Notes: 1. * Chi-Square test indicates a significant relationship exists at 95% confidence level between the response to the question and the demographic attributes.
2. Figures on demographic attributes, those who answered “Don’t know/ Refuse to answer” are excluded.

Centre for Communication and Public Opinion Survey, Agriculture, Fisheries and Conservation Department,
CUHK HKSAR
169
“Baseline Survey on the Attitude and Level of Knowledge of the General Public and Stakeholder Groups
Towards Biodiversity in Hong Kong” Research Report
Table 3.22 Will you participate in environmental activities related to biodiversity conservation?
(Percentage)
Will not Half& half
Will
No answer/ Refuse
to answer Total
Total 30.0 48.3 21.3 0.4 100.0 * Sex Males 34.3 43.5 21.5 0.6 100.0 Females 26.1 52.7 21.1 0.1 100.0
* Age 15-29 25.9 52.5 21.5 0.0 100.0 30-39 19.9 50.8 29.2 0.0 100.0 40-49 29.9 49.4 20.4 0.3 100.0 50-64 38.8 43.6 16.7 0.9 100.0
* Educational level F.3 or below 38.4 44.7 16.2 0.7 100.0 F.4-F.7 29.3 50.0 20.7 0.0 100.0 Tertiary or above 24.4 49.8 25.3 0.5 100.0
* Occupation Managers and administers/
Professionals/ Associate professionals
28.2 46.1 25.4 0.2 100.0
Clerks/ Service workers and shop sales workers/ Blue-collar workers
26.6 53.4 19.8 0.2 100.0
Students 25.5 48.7 25.8 0.0 100.0 Housewives/ Home-makers/
Retired/ Unemployed 38.7 44.6 16.7 0.0 100.0
Living district Hong Kong Island 27.7 51.6 20.3 0.4 100.0 Kowloon East 36.9 44.4 17.8 0.9 100.0 Kowloon West 24.4 55.3 20.3 0.0 100.0 New Territories East 28.0 46.6 25.0 0.5 100.0 New Territories West 31.2 48.6 20.2 0.0 100.0
Monthly household income $19,999 or below 35.6 45.3 18.2 0.9 100.0 $20,000-$39,999 29.2 49.6 21.0 0.2 100.0 $40,000-$59,999 27.0 54.0 19.0 0.0 100.0 $60,000 or above 25.7 44.9 29.0 0.4 100.0
Notes: 1. * Chi-Square test indicates a significant relationship exists at 95% confidence level between the response to the question and the demographic attributes.
2. Figures on demographic attributes, those who answered “Don’t know/ Refuse to answer” are excluded.

Centre for Communication and Public Opinion Survey, Agriculture, Fisheries and Conservation Department,
CUHK HKSAR
170
“Baseline Survey on the Attitude and Level of Knowledge of the General Public and Stakeholder Groups
Towards Biodiversity in Hong Kong” Research Report
Table 3.23 Will you encourage your families or friends to preserve biodiversity?
(Percentage)
Will not Half& half
Will
No answer/ Refuse
to answer Total
Total 12.9 32.5 54.4 0.2 100.0 * Sex Males 18.1 33.1 48.4 0.4 100.0 Females 8.1 31.9 59.8 0.1 100.0
Age 15-29 12.1 30.9 57.0 0.0 100.0 30-39 12.0 30.9 57.1 0.0 100.0 40-49 11.9 29.5 58.4 0.3 100.0 50-64 14.3 36.6 48.5 0.5 100.0
Educational level F.3 or below 11.7 37.0 51.3 0.0 100.0 F.4-F.7 15.6 31.8 52.5 0.1 100.0 Tertiary or above 11.1 30.1 58.2 0.5 100.0
Occupation Managers and administers/
Professionals/ Associate professionals
13.6 24.1 61.8 0.4 100.0
Clerks/ Service workers and shop sales workers/ Blue-collar workers
11.4 36.5 51.9 0.2 100.0
Students 13.7 29.7 56.6 0.0 100.0 Housewives/ Home-makers/
Retired/ Unemployed 13.3 37.6 49.1 0.0 100.0
Living district Hong Kong Island 8.9 32.8 57.9 0.4 100.0 Kowloon East 13.4 38.3 48.0 0.2 100.0 Kowloon West 12.2 31.5 56.2 0.0 100.0 New Territories East 12.0 29.3 58.3 0.5 100.0 New Territories West 16.6 32.0 51.4 0.0 100.0
Monthly household income $19,999 or below 13.3 36.6 49.8 0.3 100.0 $20,000-$39,999 12.2 33.8 53.8 0.2 100.0 $40,000-$59,999 12.6 29.8 57.6 0.0 100.0 $60,000 or above 12.8 29.2 57.6 0.4 100.0
Notes: 1. * Chi-Square test indicates a significant relationship exists at 95% confidence level between the response to the question and the demographic attributes.
2. Figures on demographic attributes, those who answered “Don’t know/ Refuse to answer” are excluded.

Centre for Communication and Public Opinion Survey, Agriculture, Fisheries and Conservation Department,
CUHK HKSAR
171
“Baseline Survey on the Attitude and Level of Knowledge of the General Public and Stakeholder Groups
Towards Biodiversity in Hong Kong” Research Report
Table 3.24 Will you sign petitions to support biodiversity conservation?
(Percentage)
Will not Half& half
Will
No answer/ Refuse
to answer Total
Total 14.0 29.4 56.2 0.4 100.0 * Sex Males 18.1 26.8 54.6 0.5 100.0 Females 10.3 31.8 57.7 0.3 100.0
* Age 15-29 8.4 27.1 64.4 0.0 100.0 30-39 11.6 30.8 57.5 0.0 100.0 40-49 16.3 28.3 55.1 0.3 100.0 50-64 18.1 30.3 50.6 1.0 100.0
* Educational level F.3 or below 14.6 36.7 48.0 0.7 100.0 F.4-F.7 16.3 29.7 53.7 0.2 100.0 Tertiary or above 11.3 24.3 64.1 0.3 100.0
* Occupation Managers and administers/
Professionals/ Associate professionals
12.8 22.6 64.3 0.2 100.0
Clerks/ Service workers and shop sales workers/ Blue-collar workers
14.8 29.6 55.2 0.4 100.0
Students 11.8 27.2 61.0 0.0 100.0 Housewives/ Home-makers/
Retired/ Unemployed 15.2 36.7 48.1 0.0 100.0
Living district Hong Kong Island 10.7 29.3 59.1 0.9 100.0 Kowloon East 15.4 28.9 54.8 0.9 100.0 Kowloon West 18.8 24.2 57.0 0.0 100.0 New Territories East 12.2 31.4 56.2 0.2 100.0 New Territories West 15.3 29.6 55.1 0.0 100.0
* Monthly household income $19,999 or below 13.4 40.8 44.9 0.9 100.0 $20,000-$39,999 14.5 28.7 56.4 0.4 100.0 $40,000-$59,999 14.1 22.9 63.0 0.0 100.0 $60,000 or above 9.6 22.8 67.6 0.0 100.0
Notes: 1. * Chi-Square test indicates a significant relationship exists at 95% confidence level between the response to the question and the demographic attributes.
2. Figures on demographic attributes, those who answered “Don’t know/ Refuse to answer” are excluded.
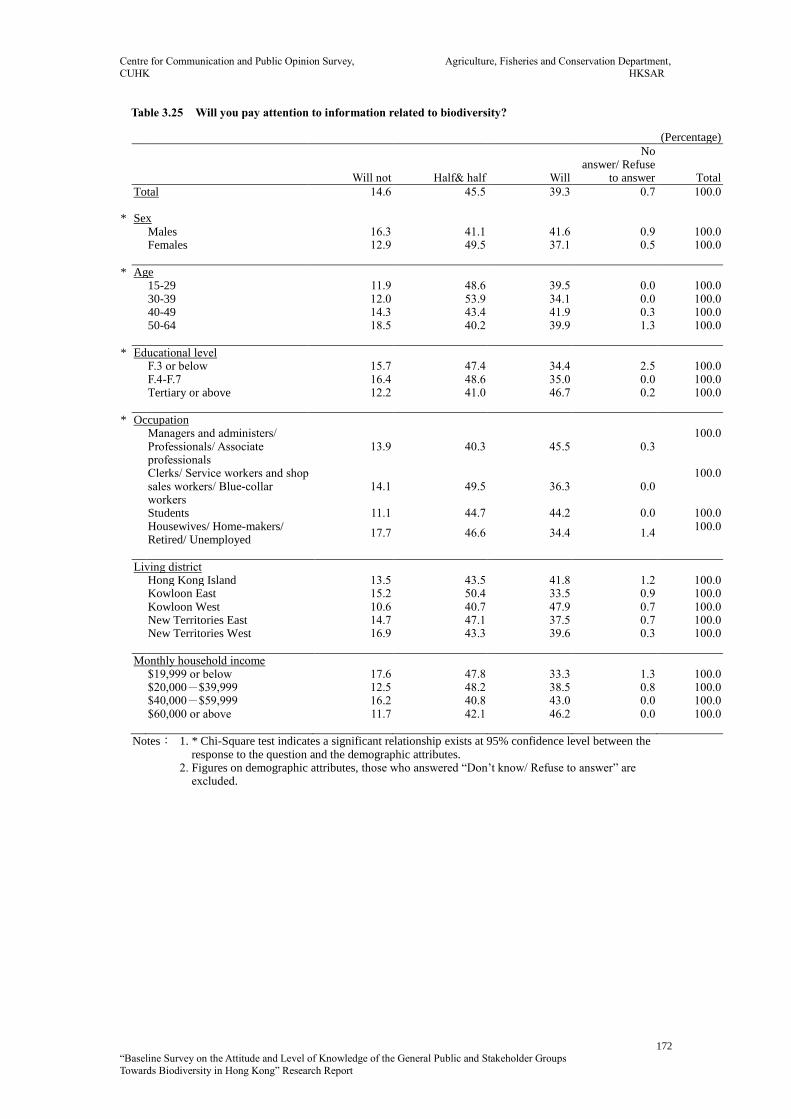
Centre for Communication and Public Opinion Survey, Agriculture, Fisheries and Conservation Department,
CUHK HKSAR
172
“Baseline Survey on the Attitude and Level of Knowledge of the General Public and Stakeholder Groups
Towards Biodiversity in Hong Kong” Research Report
Table 3.25 Will you pay attention to information related to biodiversity?
(Percentage)
Will not Half& half
Will
No answer/ Refuse
to answer Total
Total 14.6 45.5 39.3 0.7 100.0 * Sex Males 16.3 41.1 41.6 0.9 100.0 Females 12.9 49.5 37.1 0.5 100.0
* Age 15-29 11.9 48.6 39.5 0.0 100.0 30-39 12.0 53.9 34.1 0.0 100.0 40-49 14.3 43.4 41.9 0.3 100.0 50-64 18.5 40.2 39.9 1.3 100.0
* Educational level F.3 or below 15.7 47.4 34.4 2.5 100.0 F.4-F.7 16.4 48.6 35.0 0.0 100.0 Tertiary or above 12.2 41.0 46.7 0.2 100.0
* Occupation Managers and administers/
Professionals/ Associate professionals
13.9 40.3 45.5 0.3 100.0
Clerks/ Service workers and shop sales workers/ Blue-collar workers
14.1 49.5 36.3 0.0 100.0
Students 11.1 44.7 44.2 0.0 100.0 Housewives/ Home-makers/
Retired/ Unemployed 17.7 46.6 34.4 1.4
100.0
Living district Hong Kong Island 13.5 43.5 41.8 1.2 100.0 Kowloon East 15.2 50.4 33.5 0.9 100.0 Kowloon West 10.6 40.7 47.9 0.7 100.0 New Territories East 14.7 47.1 37.5 0.7 100.0 New Territories West 16.9 43.3 39.6 0.3 100.0
Monthly household income $19,999 or below 17.6 47.8 33.3 1.3 100.0 $20,000-$39,999 12.5 48.2 38.5 0.8 100.0 $40,000-$59,999 16.2 40.8 43.0 0.0 100.0 $60,000 or above 11.7 42.1 46.2 0.0 100.0
Notes: 1. * Chi-Square test indicates a significant relationship exists at 95% confidence level between the response to the question and the demographic attributes.
2. Figures on demographic attributes, those who answered “Don’t know/ Refuse to answer” are excluded.
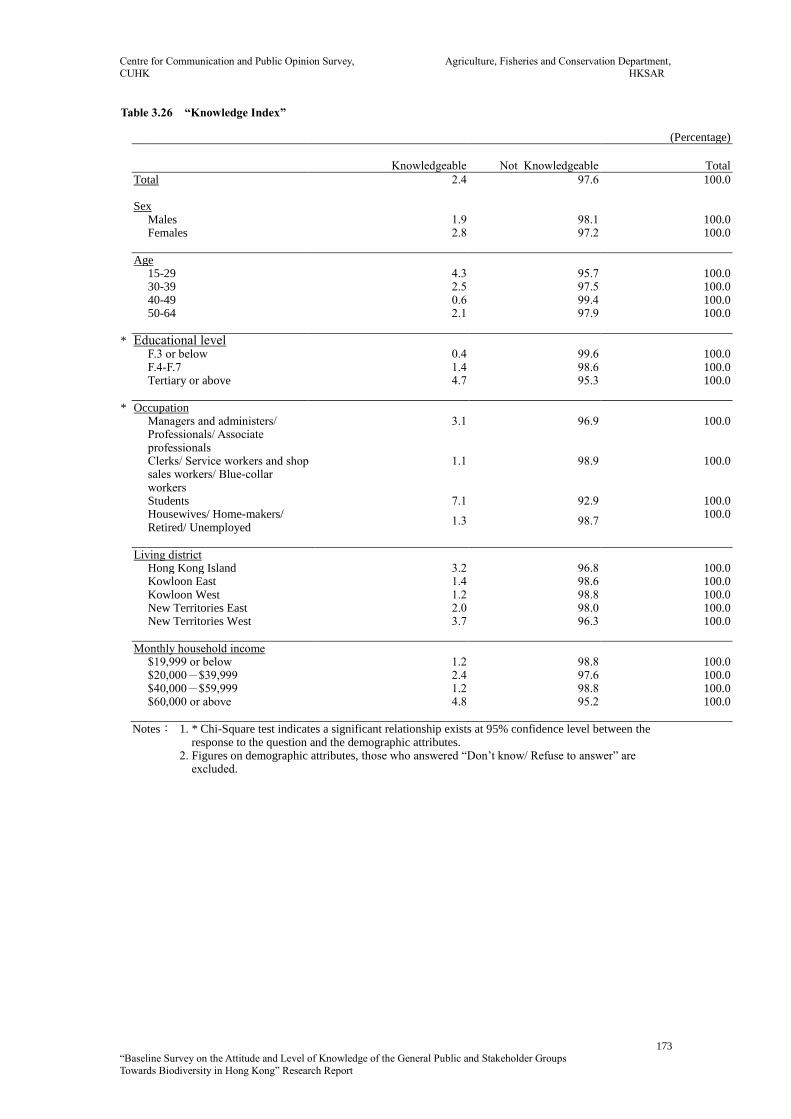
Centre for Communication and Public Opinion Survey, Agriculture, Fisheries and Conservation Department,
CUHK HKSAR
173
“Baseline Survey on the Attitude and Level of Knowledge of the General Public and Stakeholder Groups
Towards Biodiversity in Hong Kong” Research Report
Table 3.26 “Knowledge Index”
(Percentage)
Knowledgeable Not Knowledgeable Total
Total 2.4 97.6 100.0 Sex Males 1.9 98.1 100.0 Females 2.8 97.2 100.0
Age 15-29 4.3 95.7 100.0 30-39 2.5 97.5 100.0 40-49 0.6 99.4 100.0 50-64 2.1 97.9 100.0
* Educational level F.3 or below 0.4 99.6 100.0 F.4-F.7 1.4 98.6 100.0 Tertiary or above 4.7 95.3 100.0
* Occupation Managers and administers/
Professionals/ Associate professionals
3.1 96.9 100.0
Clerks/ Service workers and shop sales workers/ Blue-collar workers
1.1
98.9
100.0
Students 7.1 92.9 100.0 Housewives/ Home-makers/
Retired/ Unemployed 1.3 98.7
100.0
Living district Hong Kong Island 3.2 96.8 100.0 Kowloon East 1.4 98.6 100.0 Kowloon West 1.2 98.8 100.0 New Territories East 2.0 98.0 100.0 New Territories West 3.7 96.3 100.0
Monthly household income $19,999 or below 1.2 98.8 100.0 $20,000-$39,999 2.4 97.6 100.0 $40,000-$59,999 1.2 98.8 100.0 $60,000 or above 4.8 95.2 100.0
Notes: 1. * Chi-Square test indicates a significant relationship exists at 95% confidence level between the response to the question and the demographic attributes.
2. Figures on demographic attributes, those who answered “Don’t know/ Refuse to answer” are excluded.

Centre for Communication and Public Opinion Survey, Agriculture, Fisheries and Conservation Department,
CUHK HKSAR
174
“Baseline Survey on the Attitude and Level of Knowledge of the General Public and Stakeholder Groups
Towards Biodiversity in Hong Kong” Research Report
Table 3.27 “Importance Index”
Mean Sample Size
Total 3.84 980 Sex Males 3.80 468 Females 3.87 512
* Age 15-29 3.95 246 30-39 3.93 191 40-49 3.84 204 50-64 3.70 329
* Educational level F.3 or below 3.68 239 F.4-F.7 3.80 357 Tertiary or above 3.97 380
* Occupation Managers and administers/ Professionals/ Associate professionals 3.94 266
Clerks/ Service workers and shop sales workers/ Blue-collar workers
3.79 323
Students 3.93 119 Housewives/ Home-makers/
Retired/ Unemployed 3.74 247
Living district Hong Kong Island 3.89 157 Kowloon East 3.82 202 Kowloon West 3.86 109 New Territories East 3.88 259 New Territories West 3.76 243
* Monthly household income $19,999 or below 3.79 188 $20,000-$39,999 3.79 333 $40,000-$59,999 3.93 177 $60,000 or above 3.93 162
Notes: 1. * T-test / ANOVA test indicates a significant relationship exists at 95% confidence level between the response to the question and the demographic attributes.
2. Figures on demographic attributes, those who answered “Don’t know/ Refuse to answer” are excluded.
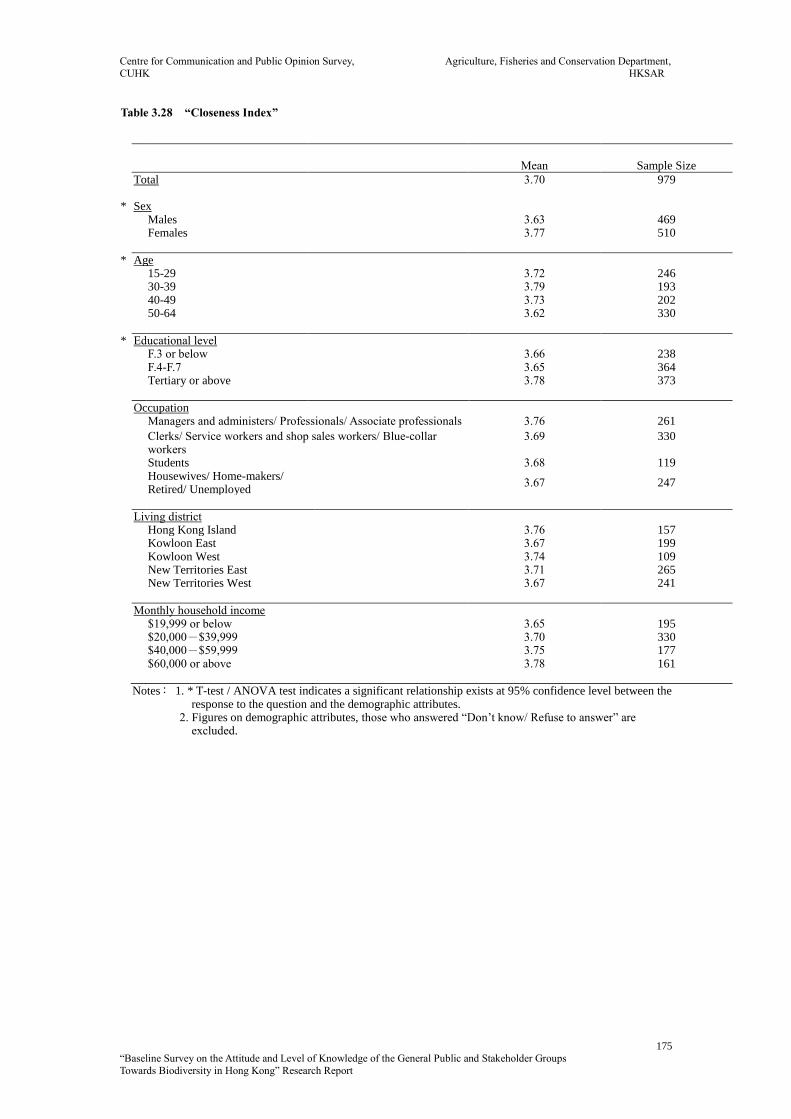
Centre for Communication and Public Opinion Survey, Agriculture, Fisheries and Conservation Department,
CUHK HKSAR
175
“Baseline Survey on the Attitude and Level of Knowledge of the General Public and Stakeholder Groups
Towards Biodiversity in Hong Kong” Research Report
Table 3.28 “Closeness Index”
Mean Sample Size
Total 3.70 979 * Sex Males 3.63 469 Females 3.77 510
* Age 15-29 3.72 246 30-39 3.79 193 40-49 3.73 202 50-64 3.62 330
* Educational level F.3 or below 3.66 238 F.4-F.7 3.65 364 Tertiary or above 3.78 373
Occupation Managers and administers/ Professionals/ Associate professionals 3.76 261
Clerks/ Service workers and shop sales workers/ Blue-collar workers
3.69 330
Students 3.68 119 Housewives/ Home-makers/
Retired/ Unemployed 3.67 247
Living district Hong Kong Island 3.76 157 Kowloon East 3.67 199 Kowloon West 3.74 109 New Territories East 3.71 265 New Territories West 3.67 241
Monthly household income $19,999 or below 3.65 195 $20,000-$39,999 3.70 330 $40,000-$59,999 3.75 177 $60,000 or above 3.78 161
Notes: 1. * T-test / ANOVA test indicates a significant relationship exists at 95% confidence level between the response to the question and the demographic attributes.
2. Figures on demographic attributes, those who answered “Don’t know/ Refuse to answer” are excluded.
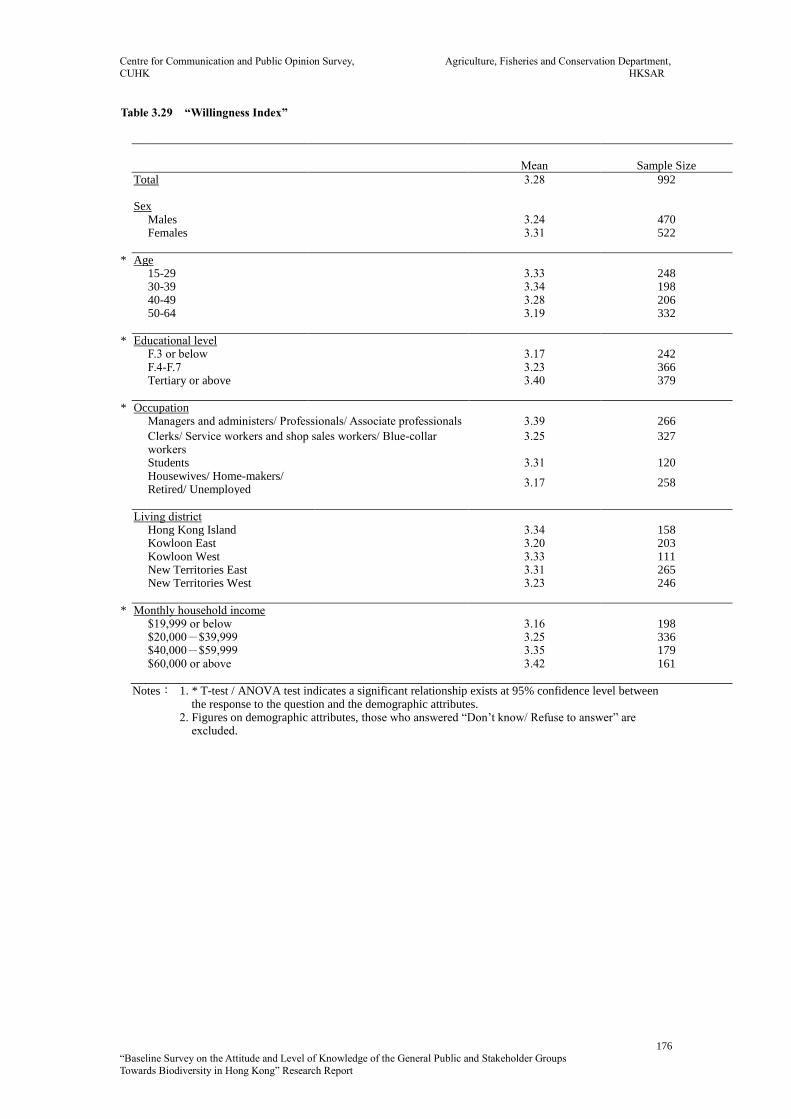
Centre for Communication and Public Opinion Survey, Agriculture, Fisheries and Conservation Department,
CUHK HKSAR
176
“Baseline Survey on the Attitude and Level of Knowledge of the General Public and Stakeholder Groups
Towards Biodiversity in Hong Kong” Research Report
Table 3.29 “Willingness Index”
Mean Sample Size
Total 3.28 992 Sex Males 3.24 470 Females 3.31 522
* Age 15-29 3.33 248 30-39 3.34 198 40-49 3.28 206 50-64 3.19 332
* Educational level F.3 or below 3.17 242 F.4-F.7 3.23 366 Tertiary or above 3.40 379
* Occupation Managers and administers/ Professionals/ Associate professionals 3.39 266
Clerks/ Service workers and shop sales workers/ Blue-collar workers
3.25 327
Students 3.31 120 Housewives/ Home-makers/
Retired/ Unemployed 3.17 258
Living district Hong Kong Island 3.34 158 Kowloon East 3.20 203 Kowloon West 3.33 111 New Territories East 3.31 265 New Territories West 3.23 246
* Monthly household income $19,999 or below 3.16 198 $20,000-$39,999 3.25 336 $40,000-$59,999 3.35 179 $60,000 or above 3.42 161
Notes: 1. * T-test / ANOVA test indicates a significant relationship exists at 95% confidence level between the response to the question and the demographic attributes.
2. Figures on demographic attributes, those who answered “Don’t know/ Refuse to answer” are excluded.

Centre for Communication and Public Opinion Survey, Agriculture, Fisheries and Conservation Department,
CUHK HKSAR
177
“Baseline Survey on the Attitude and Level of Knowledge of the General Public and Stakeholder Groups
Towards Biodiversity in Hong Kong” Research Report
Statistical Tables – Online Survey (Teachers)
Table 4.1 Have you ever heard of the term “biodiversity”?
(Percentage)
Have heard of it, and know what it means
Have heard of it, but don’t know what it
means
Have not heard
of it Total
Total 70.8 21.3 8.0 100.0
Sex Male 75.9 16.7 7.4 100.0
Female 67.7 23.9 8.4 100.0
* Age 20-34 84.6 12.5 2.9 100.0
35-49 67.4 24.1 8.5 100.0
50 or above 62.7 25.3 12.0 100.0
Educational level Tertiary (non-degree & degree) 69.3 23.4 7.3 100.0
Postgraduate 71.6 19.7 8.7 100.0
* Current Teaching School Primary 60.5 29.0 10.5 100.0
Secondary 77.4 16.3 6.3 100.0
Type of Current Teaching School Government school 72.7 16.4% 10.9 100.0
Aided school / Caput school 69.9 22.8% 7.3 100.0
Private school / School under direct subsidy scheme
76.7 13.3% 10.0 100.0
* Current Teaching Subjects Teaching related subjects 87.7 10.3 2.0 100.0 Teaching non-related subjects 54.3 31.9 13.8 100.0
* Years of Teaching Experience 10 years or below 82.1 15.2 2.7 100.0 11-20 years 65.3 25.3 9.3 100.0 21 years or above 68.2 22.0 9.8 100.0
Notes: 1. * Chi-Square test indicates a significant relationship exists at 95% confidence level between the response to the question and the demographic attributes.
2. Figures on demographic attributes, those who answered “Don’t know/ Refuse to answer” are excluded.

Centre for Communication and Public Opinion Survey, Agriculture, Fisheries and Conservation Department,
CUHK HKSAR
178
“Baseline Survey on the Attitude and Level of Knowledge of the General Public and Stakeholder Groups
Towards Biodiversity in Hong Kong” Research Report
Table 4.2 How informed do you feel about the biodiversity in Hong Kong?
(Percentage)
Not informed So-so Well-informed Total
Total 27.3 46.4 26.3 100.0
* Sex Male 22.8 42.6 34.6 100.0 Female 29.9 49.0 21.1 100.0
* Age 20-34 16.3 47.1 36.5 100.0 35-49 29.5 47.8 22.8 100.0 50 or above 34.9 43.4 21.7 100.0
Educational level Tertiary (non-degree & degree) 27.6 44.3 28.1 100.0 Postgraduate 27.1 49.1 23.9 100.0
* Current Teaching School
Primary 32.1 52.5 15.4 100.0
Secondary 24.2 42.5 33.3 100.0
Type of Current Teaching School
Government school 29.1 45.5 25.5 100.0
Aided school / Caput school 27.1 48.0 24.9 100.0
Private school / School under direct subsidy scheme
26.7 30.0 43.3 100.0
* Current Teaching Subjects
Teaching related subjects 12.3 43.1 44.6 100.0
Teaching non-related subjects 41.9 49.5 8.6 100.0
* Years of Teaching Experience
10 years or below 18.8 43.8 37.5 100.0
11-20 years 29.3 50.7 20.0 100.0
21 years or above 31.1 44.7 24.2 100.0
Notes: 1. * Chi-Square test indicates a significant relationship exists at 95% confidence level between the response to the question and the demographic attributes.
2. Figures on demographic attributes, those who answered “Don’t know/ Refuse to answer” are excluded.

Centre for Communication and Public Opinion Survey, Agriculture, Fisheries and Conservation Department,
CUHK HKSAR
179
“Baseline Survey on the Attitude and Level of Knowledge of the General Public and Stakeholder Groups
Towards Biodiversity in Hong Kong” Research Report
Table 4.3 To your knowledge, please write down ONE designated protected area for nature conservation in Hong
Kong, the one that you are most certain about.
(Percentage)
Answered Correctly Answered Wrongly/Don't
know/Refuse to answer Total
Total 80.9 19.1 100.0 Sex Male 79.6 20.4 100.0 Female 81.7 18.3 100.0
Age 20-34 83.7 16.3 100.0 35-49 80.8 19.2 100.0 50 or above 78.3 21.7 100.0
Educational level Tertiary (non-degree & degree) 83.9 16.1 100.0 Postgraduate 78.0 22.0 100.0
Current Teaching School Primary 79.0 21.0 100.0
Secondary 82.1 17.9 100.0
Type of Current Teaching School Government school 80.0 20.0 100.0 Aided school / Caput school 81.2 18.8 100.0 Private school / School under
direct subsidy scheme 80.0 20.0 100.0
* Current Teaching Subjects Teaching related subjects 89.2 10.8 100.0 Teaching non-related subjects 72.9 27.1 100.0
Years of Teaching Experience 10 years or below 83.9 16.1 100.0 11-20 years 79.3 20.7 100.0 21 years or above 81.8 18.2 100.0
Notes: 1. * Chi-Square test indicates a significant relationship exists at 95% confidence level between the response to the question and the demographic attributes.
2. Figures on demographic attributes, those who answered “Don’t know/ Refuse to answer” are excluded.
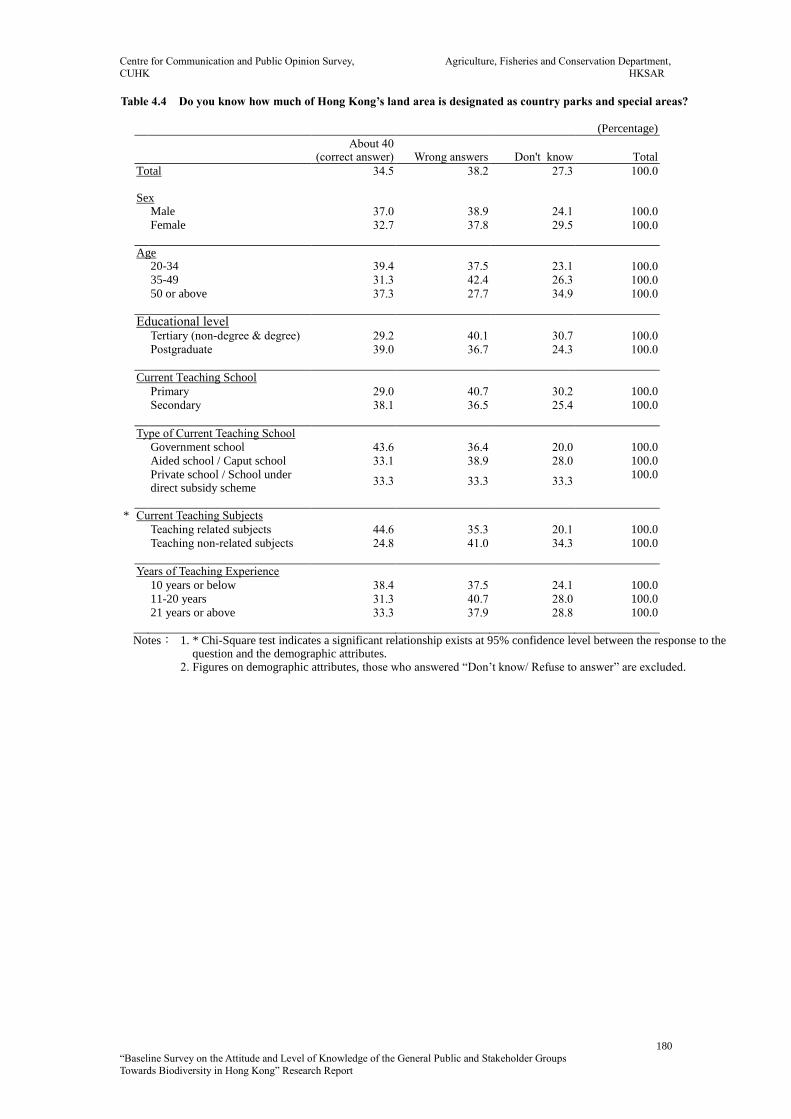
Centre for Communication and Public Opinion Survey, Agriculture, Fisheries and Conservation Department,
CUHK HKSAR
180
“Baseline Survey on the Attitude and Level of Knowledge of the General Public and Stakeholder Groups
Towards Biodiversity in Hong Kong” Research Report
Table 4.4 Do you know how much of Hong Kong’s land area is designated as country parks and special areas?
(Percentage)
About 40 (correct answer) Wrong answers
Don't know Total
Total 34.5 38.2 27.3 100.0
Sex Male 37.0 38.9 24.1 100.0 Female 32.7 37.8 29.5 100.0
Age 20-34 39.4 37.5 23.1 100.0 35-49 31.3 42.4 26.3 100.0 50 or above 37.3 27.7 34.9 100.0
Educational level Tertiary (non-degree & degree) 29.2 40.1 30.7 100.0 Postgraduate 39.0 36.7 24.3 100.0
Current Teaching School
Primary 29.0 40.7 30.2 100.0
Secondary 38.1 36.5 25.4 100.0
Type of Current Teaching School
Government school 43.6 36.4 20.0 100.0
Aided school / Caput school 33.1 38.9 28.0 100.0
Private school / School under direct subsidy scheme
33.3 33.3 33.3 100.0
* Current Teaching Subjects
Teaching related subjects 44.6 35.3 20.1 100.0
Teaching non-related subjects 24.8 41.0 34.3 100.0
Years of Teaching Experience
10 years or below 38.4 37.5 24.1 100.0
11-20 years 31.3 40.7 28.0 100.0
21 years or above 33.3 37.9 28.8 100.0
Notes: 1. * Chi-Square test indicates a significant relationship exists at 95% confidence level between the response to the question and the demographic attributes.
2. Figures on demographic attributes, those who answered “Don’t know/ Refuse to answer” are excluded.
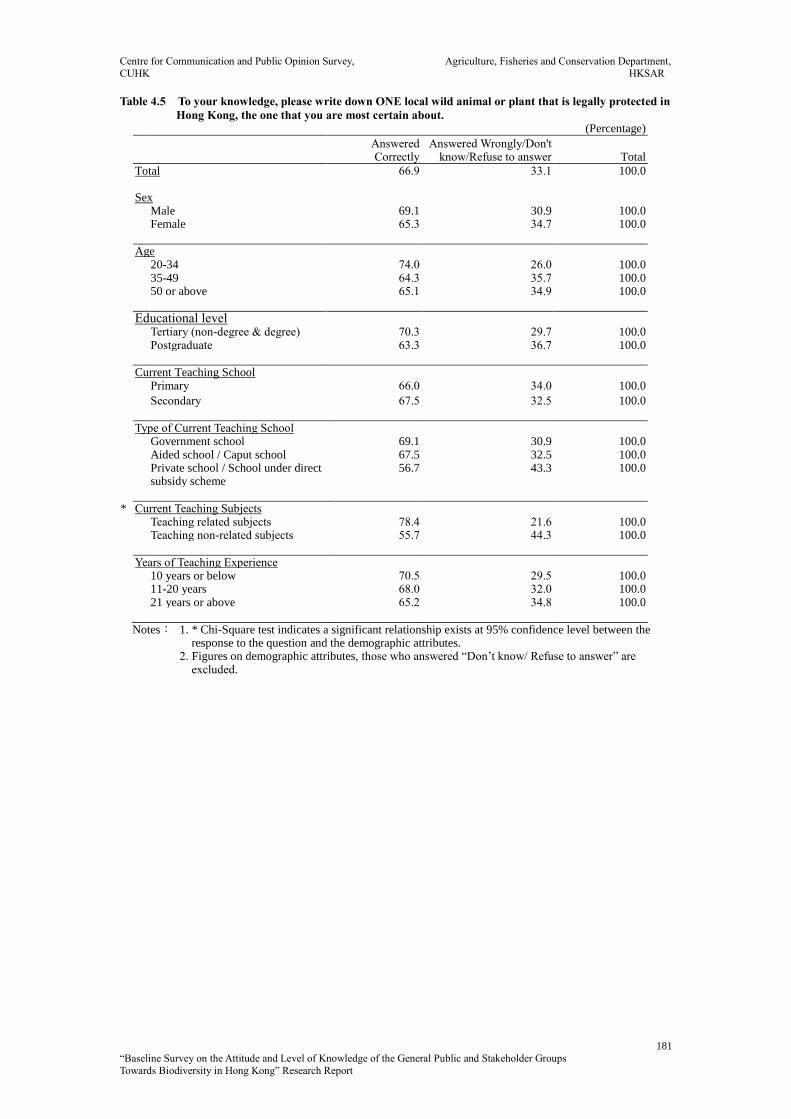
Centre for Communication and Public Opinion Survey, Agriculture, Fisheries and Conservation Department,
CUHK HKSAR
181
“Baseline Survey on the Attitude and Level of Knowledge of the General Public and Stakeholder Groups
Towards Biodiversity in Hong Kong” Research Report
Table 4.5 To your knowledge, please write down ONE local wild animal or plant that is legally protected in
Hong Kong, the one that you are most certain about. (Percentage)
Answered Correctly
Answered Wrongly/Don't know/Refuse to answer Total
Total 66.9 33.1 100.0 Sex Male 69.1 30.9 100.0 Female 65.3 34.7 100.0
Age 20-34 74.0 26.0 100.0 35-49 64.3 35.7 100.0 50 or above 65.1 34.9 100.0
Educational level Tertiary (non-degree & degree) 70.3 29.7 100.0 Postgraduate 63.3 36.7 100.0
Current Teaching School Primary 66.0 34.0 100.0
Secondary 67.5 32.5 100.0
Type of Current Teaching School Government school 69.1 30.9 100.0 Aided school / Caput school 67.5 32.5 100.0 Private school / School under direct
subsidy scheme 56.7 43.3 100.0
* Current Teaching Subjects Teaching related subjects 78.4 21.6 100.0 Teaching non-related subjects 55.7 44.3 100.0
Years of Teaching Experience 10 years or below 70.5 29.5 100.0 11-20 years 68.0 32.0 100.0 21 years or above 65.2 34.8 100.0
Notes: 1. * Chi-Square test indicates a significant relationship exists at 95% confidence level between the response to the question and the demographic attributes.
2. Figures on demographic attributes, those who answered “Don’t know/ Refuse to answer” are excluded.
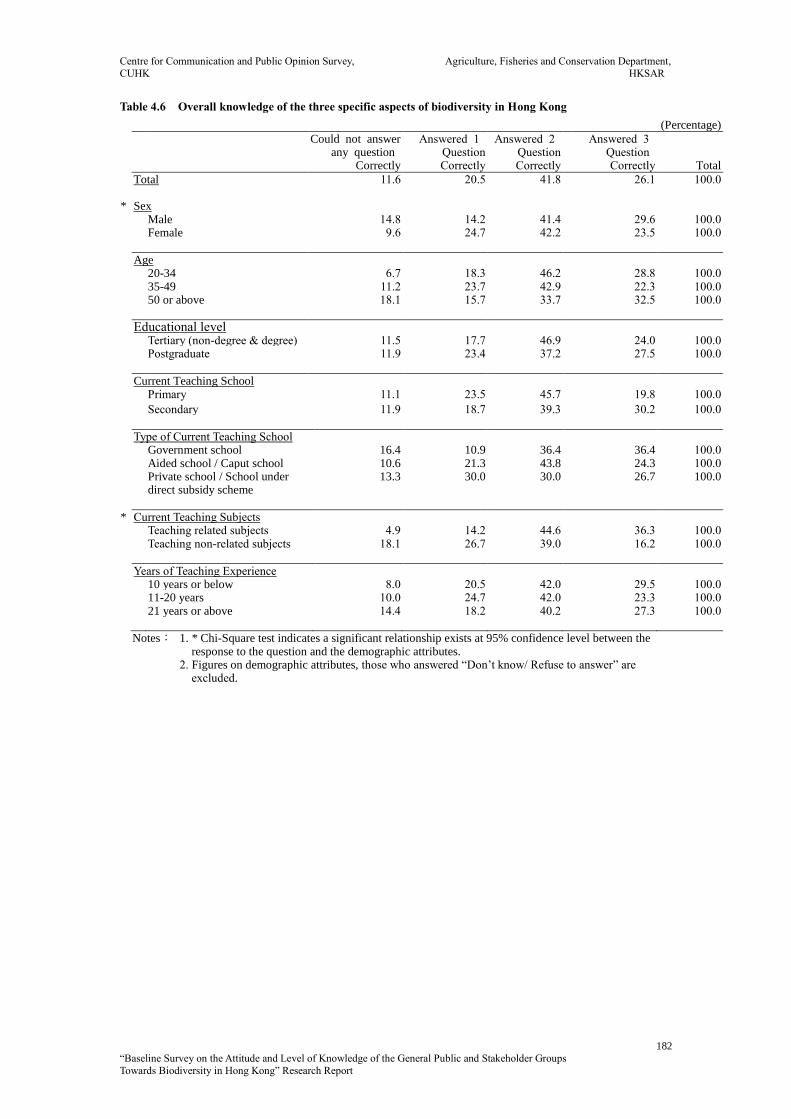
Centre for Communication and Public Opinion Survey, Agriculture, Fisheries and Conservation Department,
CUHK HKSAR
182
“Baseline Survey on the Attitude and Level of Knowledge of the General Public and Stakeholder Groups
Towards Biodiversity in Hong Kong” Research Report
Table 4.6 Overall knowledge of the three specific aspects of biodiversity in Hong Kong
(Percentage)
Could not answer any question
Correctly
Answered 1 Question Correctly
Answered 2 Question Correctly
Answered 3 Question Correctly Total
Total 11.6 20.5 41.8 26.1 100.0 * Sex Male 14.8 14.2 41.4 29.6 100.0 Female 9.6 24.7 42.2 23.5 100.0
Age 20-34 6.7 18.3 46.2 28.8 100.0 35-49 11.2 23.7 42.9 22.3 100.0 50 or above 18.1 15.7 33.7 32.5 100.0
Educational level Tertiary (non-degree & degree) 11.5 17.7 46.9 24.0 100.0 Postgraduate 11.9 23.4 37.2 27.5 100.0
Current Teaching School Primary 11.1 23.5 45.7 19.8 100.0
Secondary 11.9 18.7 39.3 30.2 100.0
Type of Current Teaching School Government school 16.4 10.9 36.4 36.4 100.0 Aided school / Caput school 10.6 21.3 43.8 24.3 100.0 Private school / School under
direct subsidy scheme 13.3 30.0 30.0 26.7 100.0
* Current Teaching Subjects Teaching related subjects 4.9 14.2 44.6 36.3 100.0 Teaching non-related subjects 18.1 26.7 39.0 16.2 100.0
Years of Teaching Experience 10 years or below 8.0 20.5 42.0 29.5 100.0 11-20 years 10.0 24.7 42.0 23.3 100.0 21 years or above 14.4 18.2 40.2 27.3 100.0
Notes: 1. * Chi-Square test indicates a significant relationship exists at 95% confidence level between the response to the question and the demographic attributes.
2. Figures on demographic attributes, those who answered “Don’t know/ Refuse to answer” are excluded.

Centre for Communication and Public Opinion Survey, Agriculture, Fisheries and Conservation Department,
CUHK HKSAR
183
“Baseline Survey on the Attitude and Level of Knowledge of the General Public and Stakeholder Groups
Towards Biodiversity in Hong Kong” Research Report
Table 4.7 How concerned are you about the biodiversity in Hong Kong?
(Percentage)
Not concerned So-so
Concerned
Total
Total 12.3 50.5 37.2 100.0 Sex Male 11.1 45.1 43.8 100.0 Female 12.7 54.2 33.1 100.0
Age 20-34 9.6 47.1 43.3 100.0 35-49 14.3 52.7 33.0 100.0 50 or above 9.6 50.6 39.8 100.0
Educational level Tertiary (non-degree & degree) 10.9 52.1 37.0 100.0 Postgraduate 13.8 49.5 36.7 100.0
Current Teaching School Primary 14.8 54.9 30.2 100.0
Secondary 10.7 47.6 41.7 100.0
Type of Current Teaching School Government school 16.4 50.9 32.7 100.0 Aided school / Caput school 12.2 51.1 36.8 100.0 Private school / School under
direct subsidy scheme 6.7 43.3 50.0 100.0
* Current Teaching Subjects Teaching related subjects 4.9 43.6 51.5 100.0 Teaching non-related subjects 19.5 57.1 23.3 100.0
Years of Teaching Experience 10 years or below 8.9 48.2 42.9 100.0 11-20 years 11.3 55.3 33.3 100.0 21 years or above 13.6 49.2 37.1 100.0
Notes: 1. * Chi-Square test indicates a significant relationship exists at 95% confidence level between the response to the question and the demographic attributes.
2. Figures on demographic attributes, those who answered “Don’t know/ Refuse to answer” are excluded.

Centre for Communication and Public Opinion Survey, Agriculture, Fisheries and Conservation Department,
CUHK HKSAR
184
“Baseline Survey on the Attitude and Level of Knowledge of the General Public and Stakeholder Groups
Towards Biodiversity in Hong Kong” Research Report
Table 4.8 “Economic development is more important than preserving biodiversity.”
(Percentage)
Disagree So-so
Agree
Total
Total 65.7 21.5 12.8 100.0 * Sex Male 60.5 20.4 19.1 100.0 Female 68.9 22.3 8.8 100.0
Age 20-34 73.1 18.3 8.7 100.0 35-49 65.6 20.5 13.8 100.0 50 or above 57.8 27.7 14.5 100.0
Educational level Tertiary (non-degree & degree) 69.3 21.4 9.4 100.0 Postgraduate 62.8 21.1 16.1 100.0
Current Teaching School Primary 70.4 20.4 9.3 100.0
Secondary 62.7 22.2 15.1 100.0
Type of Current Teaching School Government school 63.6 21.8 14.5 100.0 Aided school / Caput school 66.6 20.7 12.8 100.0 Private school / School under
direct subsidy scheme 60.0 30.0 10.0 100.0
Current Teaching Subjects Teaching related subjects 69.1 18.1 12.7 100.0 Teaching non-related subjects 62.4 24.8 12.9 100.0
Years of Teaching Experience 10 years or below 70.5 22.3 7.1 100.0 11-20 years 68.7 18.0 13.3 100.0 21 years or above 59.1 25.8 15.2 100.0
Notes: 1. * Chi-Square test indicates a significant relationship exists at 95% confidence level between the response to the question and the demographic attributes.
2. Figures on demographic attributes, those who answered “Don’t know/ Refuse to answer” are excluded.

Centre for Communication and Public Opinion Survey, Agriculture, Fisheries and Conservation Department,
CUHK HKSAR
185
“Baseline Survey on the Attitude and Level of Knowledge of the General Public and Stakeholder Groups
Towards Biodiversity in Hong Kong” Research Report
Table 4.9 “It is very important to promote and educate the public on biodiversity.”
(Percentage)
Disagree So-so
Agree
Total
Total 3.1 7.2 89.6 100.0 Sex Male 4.3 9.9 85.8 100.0 Female 2.4 5.6 92.0 100.0
Age 20-34 1.9 5.8 92.3 100.0 35-49 3.6 6.7 89.7 100.0 50 or above 3.6 10.8 85.5 100.0
Educational level Tertiary (non-degree & degree) 2.6 6.8 90.6 100.0 Postgraduate 3.7 7.8 88.5 100.0
Current Teaching School Primary 2.5 5.6 92.0 100.0
Secondary 3.6 8.3 88.1 100.0
Type of Current Teaching School Government school 1.8 14.5 83.6 100.0 Aided school / Caput school 3.6 5.5 90.9 100.0 Private school / School under
direct subsidy scheme 0.0 13.3 86.7 100.0
* Current Teaching Subjects Teaching related subjects 2.5 3.9 93.6 100.0 Teaching non-related subjects 3.8 10.5 85.7 100.0
Years of Teaching Experience 10 years or below 1.8 8.0 90.2 100.0 11-20 years 2.0 6.7 91.3 100.0 21 years or above 3.8 8.3 87.9 100.0
Notes: 1. * Chi-Square test indicates a significant relationship exists at 95% confidence level between the response to the question and the demographic attributes.
2. Figures on demographic attributes, those who answered “Don’t know/ Refuse to answer” are excluded.
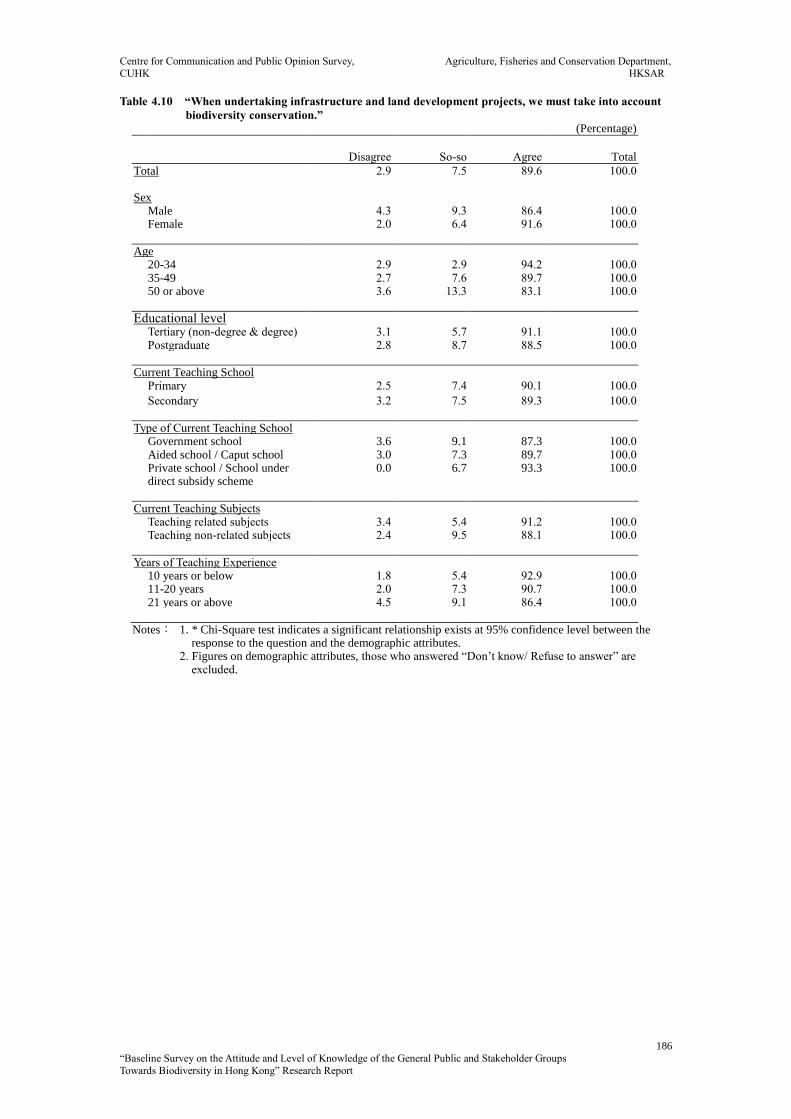
Centre for Communication and Public Opinion Survey, Agriculture, Fisheries and Conservation Department,
CUHK HKSAR
186
“Baseline Survey on the Attitude and Level of Knowledge of the General Public and Stakeholder Groups
Towards Biodiversity in Hong Kong” Research Report
Table 4.10 “When undertaking infrastructure and land development projects, we must take into account
biodiversity conservation.” (Percentage)
Disagree So-so
Agree
Total
Total 2.9 7.5 89.6 100.0 Sex Male 4.3 9.3 86.4 100.0 Female 2.0 6.4 91.6 100.0
Age 20-34 2.9 2.9 94.2 100.0 35-49 2.7 7.6 89.7 100.0 50 or above 3.6 13.3 83.1 100.0
Educational level Tertiary (non-degree & degree) 3.1 5.7 91.1 100.0 Postgraduate 2.8 8.7 88.5 100.0
Current Teaching School Primary 2.5 7.4 90.1 100.0
Secondary 3.2 7.5 89.3 100.0
Type of Current Teaching School Government school 3.6 9.1 87.3 100.0 Aided school / Caput school 3.0 7.3 89.7 100.0 Private school / School under
direct subsidy scheme 0.0 6.7 93.3 100.0
Current Teaching Subjects Teaching related subjects 3.4 5.4 91.2 100.0 Teaching non-related subjects 2.4 9.5 88.1 100.0
Years of Teaching Experience 10 years or below 1.8 5.4 92.9 100.0 11-20 years 2.0 7.3 90.7 100.0 21 years or above 4.5 9.1 86.4 100.0
Notes: 1. * Chi-Square test indicates a significant relationship exists at 95% confidence level between the response to the question and the demographic attributes.
2. Figures on demographic attributes, those who answered “Don’t know/ Refuse to answer” are excluded.

Centre for Communication and Public Opinion Survey, Agriculture, Fisheries and Conservation Department,
CUHK HKSAR
187
“Baseline Survey on the Attitude and Level of Knowledge of the General Public and Stakeholder Groups
Towards Biodiversity in Hong Kong” Research Report
Table 4.11 “Preserving the biodiversity in Hong Kong is a huge responsibility of the government.”
(Percentage)
Disagree So-so
Agree
Total
Total 2.7 5.1 92.3 100.0 Sex Male 3.1 5.6 91.4 100.0 Female 2.4 4.8 92.8 100.0
Age 20-34 1.0 5.8 93.3 100.0 35-49 2.7 4.9 92.4 100.0 50 or above 4.8 4.8 90.4 100.0
Educational level Tertiary (non-degree & degree) 2.6 4.7 92.7 100.0 Postgraduate 2.8 5.5 91.7 100.0
Current Teaching School Primary 1.9 2.5 95.7 100.0
Secondary 3.2 6.7 90.1 100.0
* Type of Current Teaching School Government school 1.8 1.8 96.4 100.0 Aided school / Caput school 2.7 4.6 92.7 100.0 Private school / School under
direct subsidy scheme 3.3 16.7 80.0 100.0
Current Teaching Subjects Teaching related subjects 2.5 2.5 95.1 100.0 Teaching non-related subjects 2.9 7.6 89.5 100.0
Years of Teaching Experience 10 years or below 0.0 4.5 95.5 100.0 11-20 years 2.7 2.7 94.7 100.0 21 years or above 4.5 6.1 89.4 100.0
Notes: 1. * Chi-Square test indicates a significant relationship exists at 95% confidence level between the response to the question and the demographic attributes.
2. Figures on demographic attributes, those who answered “Don’t know/ Refuse to answer” are excluded.
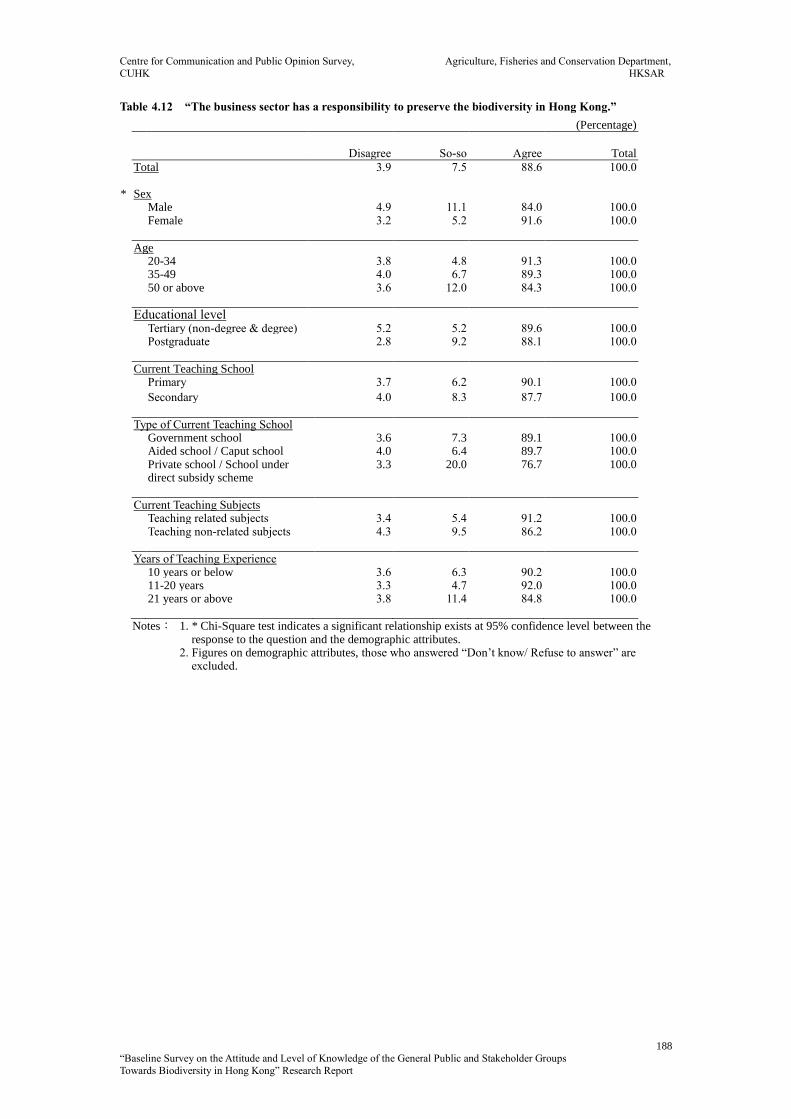
Centre for Communication and Public Opinion Survey, Agriculture, Fisheries and Conservation Department,
CUHK HKSAR
188
“Baseline Survey on the Attitude and Level of Knowledge of the General Public and Stakeholder Groups
Towards Biodiversity in Hong Kong” Research Report
Table 4.12 “The business sector has a responsibility to preserve the biodiversity in Hong Kong.”
(Percentage)
Disagree So-so
Agree
Total
Total 3.9 7.5 88.6 100.0 * Sex Male 4.9 11.1 84.0 100.0 Female 3.2 5.2 91.6 100.0
Age 20-34 3.8 4.8 91.3 100.0 35-49 4.0 6.7 89.3 100.0 50 or above 3.6 12.0 84.3 100.0
Educational level Tertiary (non-degree & degree) 5.2 5.2 89.6 100.0 Postgraduate 2.8 9.2 88.1 100.0
Current Teaching School Primary 3.7 6.2 90.1 100.0
Secondary 4.0 8.3 87.7 100.0
Type of Current Teaching School Government school 3.6 7.3 89.1 100.0 Aided school / Caput school 4.0 6.4 89.7 100.0 Private school / School under
direct subsidy scheme 3.3 20.0 76.7 100.0
Current Teaching Subjects Teaching related subjects 3.4 5.4 91.2 100.0 Teaching non-related subjects 4.3 9.5 86.2 100.0
Years of Teaching Experience 10 years or below 3.6 6.3 90.2 100.0 11-20 years 3.3 4.7 92.0 100.0 21 years or above 3.8 11.4 84.8 100.0
Notes: 1. * Chi-Square test indicates a significant relationship exists at 95% confidence level between the response to the question and the demographic attributes.
2. Figures on demographic attributes, those who answered “Don’t know/ Refuse to answer” are excluded.

Centre for Communication and Public Opinion Survey, Agriculture, Fisheries and Conservation Department,
CUHK HKSAR
189
“Baseline Survey on the Attitude and Level of Knowledge of the General Public and Stakeholder Groups
Towards Biodiversity in Hong Kong” Research Report
Table 4.13 “Citizens have a responsibility to change their daily habits so as to preserve the biodiversity in
Hong Kong.” (Percentage)
Disagree So-so
Agree
Total
Total 3.6 6.0 90.3 100.0 Sex Male 5.6 5.6 88.9 100.0 Female 2.4 6.4 91.2 100.0
Age 20-34 2.9 3.8 93.3 100.0 35-49 3.6 6.3 90.2 100.0 50 or above 4.8 8.4 86.7 100.0
Educational level Tertiary (non-degree & degree) 4.2 5.2 90.6 100.0 Postgraduate 3.2 6.9 89.9 100.0
Current Teaching School Primary 2.5 6.2 91.4 100.0
Secondary 4.4 6.0 89.7 100.0
* Type of Current Teaching School Government school 5.5 5.5 89.1 100.0 Aided school / Caput school 3.6 4.9 91.5 100.0 Private school / School under
direct subsidy scheme 0.0 20.0 80.0 100.0
* Current Teaching Subjects Teaching related subjects 2.9 2.5 94.6 100.0 Teaching non-related subjects 4.3 9.5 86.2 100.0
Years of Teaching Experience 10 years or below 1.8 5.4 92.9 100.0 11-20 years 2.0 4.7 93.3 100.0 21 years or above 5.3 7.6 87.1 100.0
Notes: 1. * Chi-Square test indicates a significant relationship exists at 95% confidence level between the response to the question and the demographic attributes.
2. Figures on demographic attributes, those who answered “Don’t know/ Refuse to answer” are excluded.

Centre for Communication and Public Opinion Survey, Agriculture, Fisheries and Conservation Department,
CUHK HKSAR
190
“Baseline Survey on the Attitude and Level of Knowledge of the General Public and Stakeholder Groups
Towards Biodiversity in Hong Kong” Research Report
Table 4.14 “The loss of biodiversity will lead to a decrease in food and product choices for citizens.”
(Percentage)
Disagree So-so
Agree
Total
Total 16.9 23.9 59.2 100.0 Sex Male 17.9 29.0 53.1 100.0 Female 15.9 20.7 63.3 100.0
Age 20-34 12.5 25.0 62.5 100.0 35-49 16.1 22.8 61.2 100.0 50 or above 22.9 26.5 50.6 100.0
Educational level Tertiary (non-degree & degree) 18.8 20.8 60.4 100.0 Postgraduate 15.6 27.1 57.3 100.0
Current Teaching School5 Primary 17.3 23.5 59.3 100.0
Secondary 16.7 24.2 59.1 100.0
Type of Current Teaching School Government school 18.2 29.1 52.7 100.0 Aided school / Caput school 17.9 22.8 59.3 100.0 Private school / School under
direct subsidy scheme 3.3 26.7 70.0 100.0
Current Teaching Subjects Teaching related subjects 15.2 20.6 64.2 100.0 Teaching non-related subjects 18.6 27.1 54.3 100.0
Years of Teaching Experience 10 years or below 13.4 21.4 65.2 100.0 11-20 years 14.7 23.3 62.0 100.0 21 years or above 22.7 26.5 50.8 100.0
Notes: 1. * Chi-Square test indicates a significant relationship exists at 95% confidence level between the response to the question and the demographic attributes.
2. Figures on demographic attributes, those who answered “Don’t know/ Refuse to answer” are excluded.
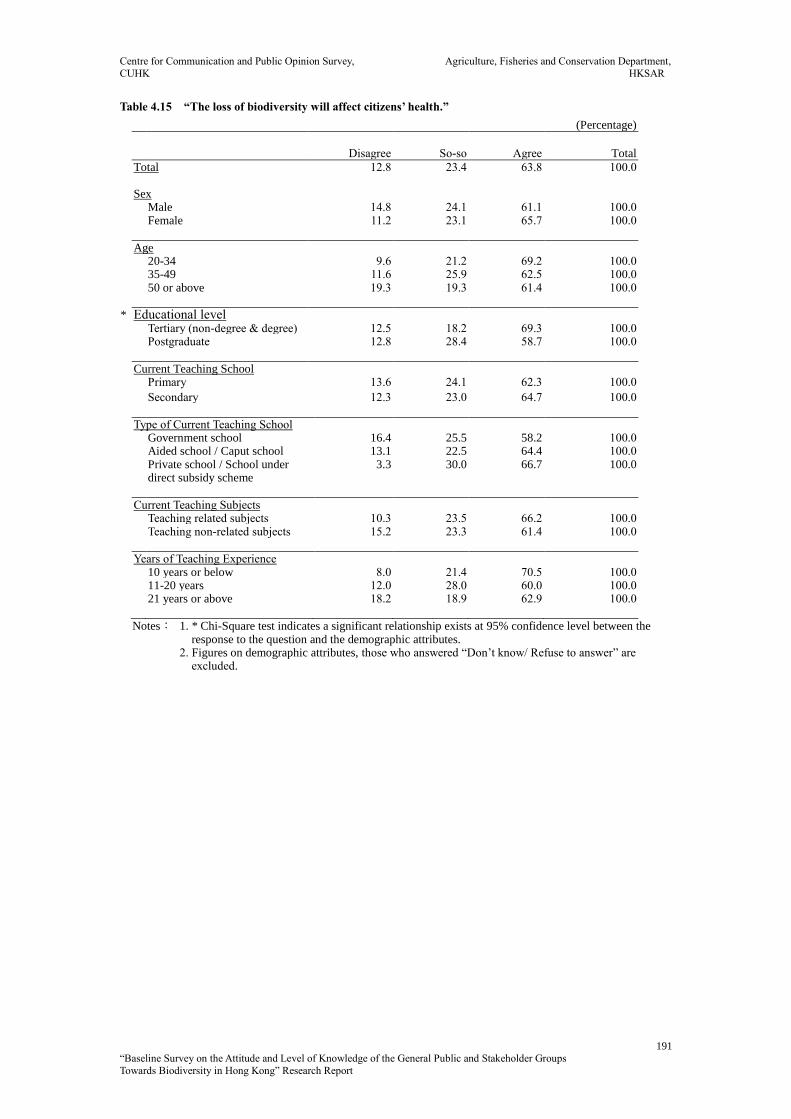
Centre for Communication and Public Opinion Survey, Agriculture, Fisheries and Conservation Department,
CUHK HKSAR
191
“Baseline Survey on the Attitude and Level of Knowledge of the General Public and Stakeholder Groups
Towards Biodiversity in Hong Kong” Research Report
Table 4.15 “The loss of biodiversity will affect citizens’ health.”
(Percentage)
Disagree So-so
Agree
Total
Total 12.8 23.4 63.8 100.0 Sex Male 14.8 24.1 61.1 100.0 Female 11.2 23.1 65.7 100.0
Age 20-34 9.6 21.2 69.2 100.0 35-49 11.6 25.9 62.5 100.0 50 or above 19.3 19.3 61.4 100.0
* Educational level Tertiary (non-degree & degree) 12.5 18.2 69.3 100.0 Postgraduate 12.8 28.4 58.7 100.0
Current Teaching School Primary 13.6 24.1 62.3 100.0
Secondary 12.3 23.0 64.7 100.0
Type of Current Teaching School Government school 16.4 25.5 58.2 100.0 Aided school / Caput school 13.1 22.5 64.4 100.0 Private school / School under
direct subsidy scheme 3.3 30.0 66.7 100.0
Current Teaching Subjects Teaching related subjects 10.3 23.5 66.2 100.0 Teaching non-related subjects 15.2 23.3 61.4 100.0
Years of Teaching Experience 10 years or below 8.0 21.4 70.5 100.0 11-20 years 12.0 28.0 60.0 100.0 21 years or above 18.2 18.9 62.9 100.0
Notes: 1. * Chi-Square test indicates a significant relationship exists at 95% confidence level between the response to the question and the demographic attributes.
2. Figures on demographic attributes, those who answered “Don’t know/ Refuse to answer” are excluded.

Centre for Communication and Public Opinion Survey, Agriculture, Fisheries and Conservation Department,
CUHK HKSAR
192
“Baseline Survey on the Attitude and Level of Knowledge of the General Public and Stakeholder Groups
Towards Biodiversity in Hong Kong” Research Report
Table 4.16 “The loss of biodiversity will affect citizens’ living environment.”
(Percentage)
Disagree So-so
Agree
Total
Total 5.8 19.6 74.6 100.0 Sex Male 5.6 21.6 72.8 100.0 Female 6.0 18.3 75.7 100.0
Age 20-34 4.8 14.4 80.8 100.0 35-49 5.4 21.9 72.8 100.0 50 or above 7.2 20.5 72.3 100.0
Educational level Tertiary (non-degree & degree) 4.7 17.2 78.1 100.0 Postgraduate 6.9 21.6 71.6 100.0
Current Teaching School Primary 7.4 17.9 74.7 100.0
Secondary 4.8 20.6 74.6 100.0
Type of Current Teaching School Government school 9.1 18.2 72.7 100.0 Aided school / Caput school 5.8 19.1 75.1 100.0 Private school / School under
direct subsidy scheme 0.0 26.7 73.3 100.0
* Current Teaching Subjects Teaching related subjects 3.9 16.2 79.9 100.0 Teaching non-related subjects 7.6 22.9 69.5 100.0
Years of Teaching Experience 10 years or below 4.5 15.2 80.4 100.0 11-20 years 6.0 20.7 73.3 100.0 21 years or above 6.1 21.2 72.7 100.0
Notes: 1. * Chi-Square test indicates a significant relationship exists at 95% confidence level between the response to the question and the demographic attributes.
2. Figures on demographic attributes, those who answered “Don’t know/ Refuse to answer” are excluded.

Centre for Communication and Public Opinion Survey, Agriculture, Fisheries and Conservation Department,
CUHK HKSAR
193
“Baseline Survey on the Attitude and Level of Knowledge of the General Public and Stakeholder Groups
Towards Biodiversity in Hong Kong” Research Report
Table 4.17 “Preserving biodiversity can enrich the leisure life of citizens.”
(Percentage)
Disagree So-so
Agree
Total
Total 3.4 11.4 85.3 100.0 Sex Male 4.3 15.4 80.2 100.0 Female 2.8 8.8 88.4 100.0
Age 20-34 1.0 11.5 87.5 100.0 35-49 4.0 12.5 83.5 100.0 50 or above 4.8 8.4 86.7 100.0
Educational level Tertiary (non-degree & degree) 2.1 9.9 88.0 100.0 Postgraduate 4.6 12.8 82.6 100.0
Current Teaching School Primary 4.3 9.9 85.8 100.0
Secondary 2.8 12.3 84.9 100.0
Type of Current Teaching School Government school 3.6 10.9 85.5 100.0 Aided school / Caput school 3.3 10.6 86.0 100.0 Private school / School under
direct subsidy scheme 3.3 20.0 76.7 100.0
Current Teaching Subjects Teaching related subjects 3.9 9.8 86.3 100.0 Teaching non-related subjects 2.9 12.9 84.3 100.0
Years of Teaching Experience 10 years or below 0.9 13.4 85.7 100.0 11-20 years 5.3 10.7 84.0 100.0 21 years or above 3.8 9.8 86.4 100.0
Notes: 1. * Chi-Square test indicates a significant relationship exists at 95% confidence level between the response to the question and the demographic attributes.
2. Figures on demographic attributes, those who answered “Don’t know/ Refuse to answer” are excluded.

Centre for Communication and Public Opinion Survey, Agriculture, Fisheries and Conservation Department,
CUHK HKSAR
194
“Baseline Survey on the Attitude and Level of Knowledge of the General Public and Stakeholder Groups
Towards Biodiversity in Hong Kong” Research Report
Table 4.18 “Preserving biodiversity can bring economic gains to Hong Kong.”
(Percentage)
Disagree So-so
Agree
Total
Total 7.5 31.2 61.4 100.0 Sex Male 9.3 33.3 57.4 100.0 Female 6.0 29.9 64.1 100.0
Age 20-34 10.6 22.1 67.3 100.0 35-49 6.3 33.0 60.7 100.0 50 or above 7.2 36.1 56.6 100.0
Educational level Tertiary (non-degree & degree) 5.2 27.6 67.2 100.0 Postgraduate 9.2 33.9 56.9 100.0
Current Teaching School Primary 5.6 33.3 61.1 100.0
Secondary 8.7 29.8 61.5 100.0
Type of Current Teaching School Government school 12.7 30.9 56.4 100.0 Aided school / Caput school 7.0 31.6 61.4 100.0 Private school / School under
direct subsidy scheme 3.3 26.7 70.0 100.0
Current Teaching Subjects Teaching related subjects 4.9 29.9 65.2 100.0 Teaching non-related subjects 10.0 32.4 57.6 100.0
Years of Teaching Experience 10 years or below 8.9 24.1 67.0 100.0 11-20 years 5.3 30.7 64.0 100.0 21 years or above 8.3 36.4 55.3 100.0
Notes: 1. * Chi-Square test indicates a significant relationship exists at 95% confidence level between the response to the question and the demographic attributes.
2. Figures on demographic attributes, those who answered “Don’t know/ Refuse to answer” are excluded.
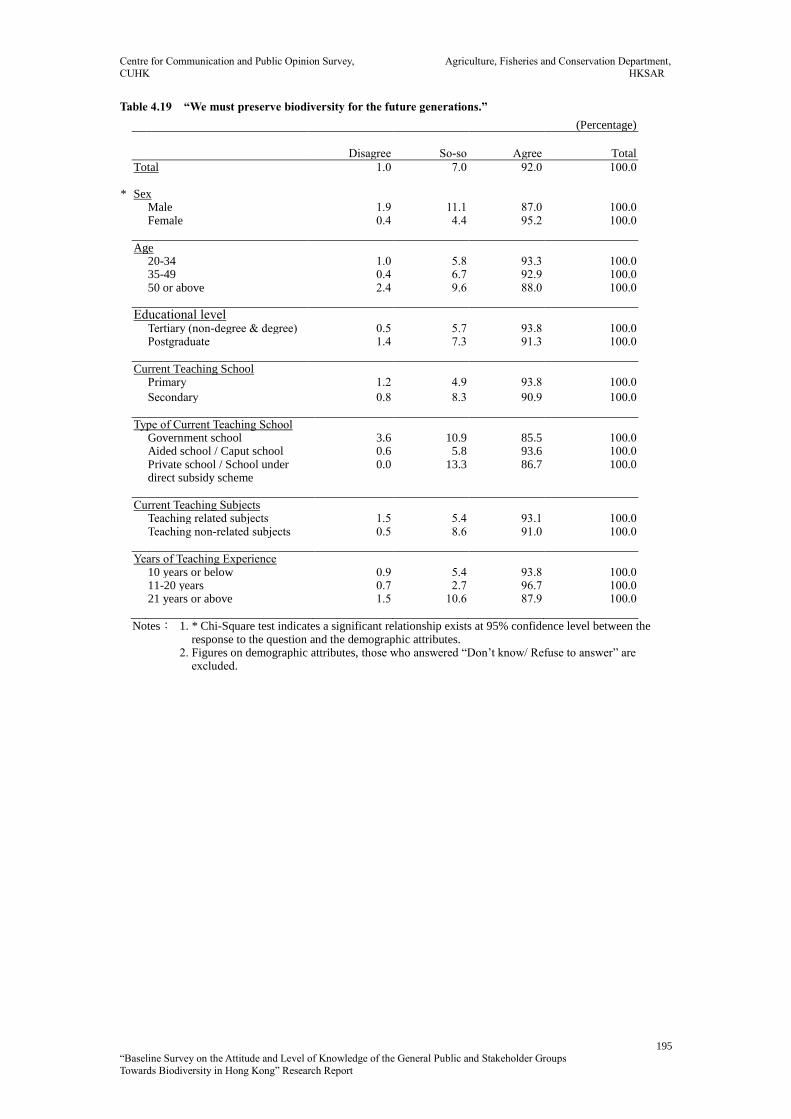
Centre for Communication and Public Opinion Survey, Agriculture, Fisheries and Conservation Department,
CUHK HKSAR
195
“Baseline Survey on the Attitude and Level of Knowledge of the General Public and Stakeholder Groups
Towards Biodiversity in Hong Kong” Research Report
Table 4.19 “We must preserve biodiversity for the future generations.”
(Percentage)
Disagree So-so
Agree
Total
Total 1.0 7.0 92.0 100.0 * Sex Male 1.9 11.1 87.0 100.0 Female 0.4 4.4 95.2 100.0
Age 20-34 1.0 5.8 93.3 100.0 35-49 0.4 6.7 92.9 100.0 50 or above 2.4 9.6 88.0 100.0
Educational level Tertiary (non-degree & degree) 0.5 5.7 93.8 100.0 Postgraduate 1.4 7.3 91.3 100.0
Current Teaching School Primary 1.2 4.9 93.8 100.0
Secondary 0.8 8.3 90.9 100.0
Type of Current Teaching School Government school 3.6 10.9 85.5 100.0 Aided school / Caput school 0.6 5.8 93.6 100.0 Private school / School under
direct subsidy scheme 0.0 13.3 86.7 100.0
Current Teaching Subjects Teaching related subjects 1.5 5.4 93.1 100.0 Teaching non-related subjects 0.5 8.6 91.0 100.0
Years of Teaching Experience 10 years or below 0.9 5.4 93.8 100.0 11-20 years 0.7 2.7 96.7 100.0 21 years or above 1.5 10.6 87.9 100.0
Notes: 1. * Chi-Square test indicates a significant relationship exists at 95% confidence level between the response to the question and the demographic attributes.
2. Figures on demographic attributes, those who answered “Don’t know/ Refuse to answer” are excluded.

Centre for Communication and Public Opinion Survey, Agriculture, Fisheries and Conservation Department,
CUHK HKSAR
196
“Baseline Survey on the Attitude and Level of Knowledge of the General Public and Stakeholder Groups
Towards Biodiversity in Hong Kong” Research Report
Table 4.20 Will you boycott products and services that would harm biodiversity?
(Percentage)
Will not Half& half
Will
Total
Total 7.2 30.4 62.3 100.0 Sex Male 9.9 29.0 61.1 100.0 Female 5.6 31.5 62.9 100.0
Age 20-34 9.6 29.8 60.6 100.0 35-49 4.9 32.6 62.5 100.0 50 or above 10.8 25.3 63.9 100.0
Educational level Tertiary (non-degree & degree) 6.3 30.2 63.5 100.0 Postgraduate 8.3 30.3 61.5 100.0
Current Teaching School Primary 7.4 32.7 59.9 100.0
Secondary 7.1 29.0 63.9 100.0
Type of Current Teaching School Government school 10.9 30.9 58.2 100.0 Aided school / Caput school 7.0 29.8 63.2 100.0 Private school / School under
direct subsidy scheme 3.3 36.7 60.0 100.0
Current Teaching Subjects Teaching related subjects 5.9 31.9 62.3 100.0 Teaching non-related subjects 8.6 29.0 62.4 100.0
Years of Teaching Experience 10 years or below 8.9 33.0 58.0 100.0 11-20 years 2.7 34.7 62.7 100.0 21 years or above 9.1 24.2 66.7 100.0
Notes: 1. * Chi-Square test indicates a significant relationship exists at 95% confidence level between the response to the question and the demographic attributes.
2. Figures on demographic attributes, those who answered “Don’t know/ Refuse to answer” are excluded.

Centre for Communication and Public Opinion Survey, Agriculture, Fisheries and Conservation Department,
CUHK HKSAR
197
“Baseline Survey on the Attitude and Level of Knowledge of the General Public and Stakeholder Groups
Towards Biodiversity in Hong Kong” Research Report
Table 4.21 Will you donate money to associations dedicated to conserving biodiversity?
(Percentage)
Will not Half& half
Will
Total
Total 12.6 41.3 46.1 100.0 Sex Male 16.0 36.4 47.5 100.0 Female 10.0 44.6 45.4 100.0
Age 20-34 15.4 48.1 36.5 100.0 35-49 10.7 38.8 50.4 100.0 50 or above 14.5 41.0 44.6 100.0
Educational level Tertiary (non-degree & degree) 13.5 45.8 40.6 100.0 Postgraduate 11.0 38.1 50.9 100.0
Current Teaching School Primary 12.3 45.7 42.0 100.0
Secondary 12.7 38.5 48.8 100.0
Type of Current Teaching School Government school 16.4 34.5 49.1 100.0 Aided school / Caput school 12.2 42.9 45.0 100.0 Private school / School under
direct subsidy scheme 10.0 36.7 53.3 100.0
Current Teaching Subjects Teaching related subjects 12.3 38.2 49.5 100.0 Teaching non-related subjects 12.9 44.3 42.9 100.0
Years of Teaching Experience 10 years or below 15.2 49.1 35.7 100.0 11-20 years 10.7 36.0 53.3 100.0 21 years or above 12.1 40.9 47.0 100.0
Notes: 1. * Chi-Square test indicates a significant relationship exists at 95% confidence level between the response to the question and the demographic attributes.
2. Figures on demographic attributes, those who answered “Don’t know/ Refuse to answer” are excluded.

Centre for Communication and Public Opinion Survey, Agriculture, Fisheries and Conservation Department,
CUHK HKSAR
198
“Baseline Survey on the Attitude and Level of Knowledge of the General Public and Stakeholder Groups
Towards Biodiversity in Hong Kong” Research Report
Table 4.22 Will you participate in environmental activities related to biodiversity conservation?
(Percentage)
Will not Half& half
Will
Total
Total 11.8 40.1 48.1 100.0 Sex Male 13.6 36.4 50.0 100.0 Female 10.4 42.6 47.0 100.0
Age 20-34 14.4 40.4 45.2 100.0 35-49 9.8 41.5 48.7 100.0 50 or above 14.5 36.1 49.4 100.0
Educational level Tertiary (non-degree & degree) 12.0 41.1 46.9 100.0 Postgraduate 11.9 39.0 49.1 100.0
* Current Teaching School Primary 11.1 48.1 40.7 100.0
Secondary 12.3 34.9 52.8 100.0
Type of Current Teaching School Government school 10.9 36.4 52.7 100.0 Aided school / Caput school 12.2 40.7 47.1 100.0 Private school / School under
direct subsidy scheme 10.0 40.0 50.0 100.0
* Current Teaching Subjects Teaching related subjects 6.4 38.2 55.4 100.0 Teaching non-related subjects 17.1 41.9 41.0 100.0
Years of Teaching Experience 10 years or below 12.5 43.8 43.8 100.0 11-20 years 7.3 40.7 52.0 100.0 21 years or above 15.9 38.6 45.5 100.0
Notes: 1. * Chi-Square test indicates a significant relationship exists at 95% confidence level between the response to the question and the demographic attributes.
2. Figures on demographic attributes, those who answered “Don’t know/ Refuse to answer” are excluded.

Centre for Communication and Public Opinion Survey, Agriculture, Fisheries and Conservation Department,
CUHK HKSAR
199
“Baseline Survey on the Attitude and Level of Knowledge of the General Public and Stakeholder Groups
Towards Biodiversity in Hong Kong” Research Report
Table 4.23 Will you encourage your families or friends to preserve biodiversity?
(Percentage)
Will not Half& half
Will
Total
Total 7.7 28.3 64.0 100.0 Sex Male 9.3 26.5 64.2 100.0 Female 6.8 29.1 64.1 100.0
Age 20-34 9.6 24.0 66.3 100.0 35-49 7.1 31.7 61.2 100.0 50 or above 7.2 25.3 67.5 100.0
Educational level Tertiary (non-degree & degree) 7.8 25.0 67.2 100.0 Postgraduate 7.3 31.2 61.5 100.0
Current Teaching School Primary 6.2 33.3 60.5 100.0
Secondary 8.7 25.0 66.3 100.0
Type of Current Teaching School Government school 9.1 25.5 65.5 100.0 Aided school / Caput school 7.6 28.9 63.5 100.0 Private school / School under
direct subsidy scheme 6.7 26.7 66.7 100.0
Current Teaching Subjects Teaching related subjects 5.4 26.5 68.1 100.0 Teaching non-related subjects 10.0 30.0 60.0 100.0
Years of Teaching Experience 10 years or below 8.9 26.8 64.3 100.0 11-20 years 8.0 28.7 63.3 100.0 21 years or above 5.3 31.1 63.6 100.0
Notes: 1. * Chi-Square test indicates a significant relationship exists at 95% confidence level between the response to the question and the demographic attributes.
2. Figures on demographic attributes, those who answered “Don’t know/ Refuse to answer” are excluded.

Centre for Communication and Public Opinion Survey, Agriculture, Fisheries and Conservation Department,
CUHK HKSAR
200
“Baseline Survey on the Attitude and Level of Knowledge of the General Public and Stakeholder Groups
Towards Biodiversity in Hong Kong” Research Report
Table 4.24 Will you sign petitions to support biodiversity conservation?
(Percentage)
Will not Half& half
Will
Total
Total 6.5 21.7 71.7 100.0 * Sex Male 10.5 17.9 71.6 100.0 Female 3.6 24.3 72.1 100.0
Age 20-34 3.8 21.2 75.0 100.0 35-49 5.8 21.0 73.2 100.0 50 or above 12.0 25.3 62.7 100.0
* Educational level Tertiary (non-degree & degree) 3.6 18.8 77.6 100.0 Postgraduate 9.2 23.9 67.0 100.0
Current Teaching School Primary 3.7 21.6 74.7 100.0
Secondary 8.3 21.8 69.8 100.0
Type of Current Teaching School Government school 7.3 21.8 70.9 100.0 Aided school / Caput school 7.0 20.1 72.9 100.0 Private school / School under
direct subsidy scheme 0.0 40.0 60.0 100.0
Current Teaching Subjects Teaching related subjects 4.4 19.1 76.5 100.0 Teaching non-related subjects 8.6 24.3 67.1 100.0
Years of Teaching Experience 10 years or below 3.6 19.6 76.8 100.0 11-20 years 6.0 21.3 72.7 100.0 21 years or above 8.3 23.5 68.2 100.0
Notes: 1. * Chi-Square test indicates a significant relationship exists at 95% confidence level between the response to the question and the demographic attributes.
2. Figures on demographic attributes, those who answered “Don’t know/ Refuse to answer” are excluded.

Centre for Communication and Public Opinion Survey, Agriculture, Fisheries and Conservation Department,
CUHK HKSAR
201
“Baseline Survey on the Attitude and Level of Knowledge of the General Public and Stakeholder Groups
Towards Biodiversity in Hong Kong” Research Report
Table 4.25 Will you pay attention to information related to biodiversity?
(Percentage)
Will not Half& half
Will
Total
Total 4.3 26.8 68.8 100.0 Sex Male 6.8 23.5 69.8 100.0 Female 2.8 29.1 68.1 100.0
Age 20-34 3.8 21.2 75.0 100.0 35-49 4.5 29.0 66.5 100.0 50 or above 4.8 27.7 67.5 100.0
Educational level Tertiary (non-degree & degree) 4.7 26.6 68.8 100.0 Postgraduate 4.1 27.5 68.3 100.0
* Current Teaching School Primary 5.6 32.7 61.7 100.0
Secondary 3.6 23.0 73.4 100.0
Type of Current Teaching School Government school 9.1 27.3 63.6 100.0 Aided school / Caput school 3.3 27.4 69.3 100.0 Private school / School under
direct subsidy scheme 6.7 20.0 73.3 100.0
* Current Teaching Subjects Teaching related subjects 2.5 17.2 80.4 100.0 Teaching non-related subjects 6.2 36.2 57.6 100.0
Years of Teaching Experience 10 years or below 3.6 22.3 74.1 100.0 11-20 years 2.7 32.7 64.7 100.0 21 years or above 5.3 24.2 70.5 100.0
Notes: 1. * Chi-Square test indicates a significant relationship exists at 95% confidence level between the response to the question and the demographic attributes.
2. Figures on demographic attributes, those who answered “Don’t know/ Refuse to answer” are excluded.
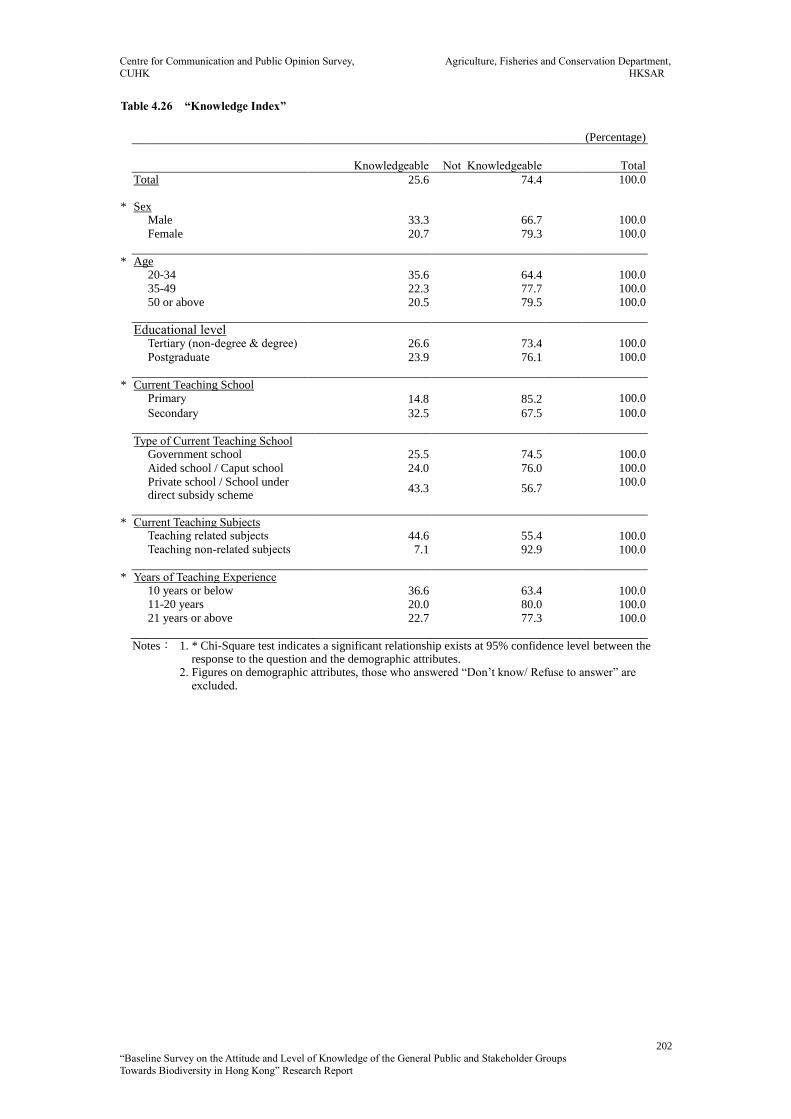
Centre for Communication and Public Opinion Survey, Agriculture, Fisheries and Conservation Department,
CUHK HKSAR
202
“Baseline Survey on the Attitude and Level of Knowledge of the General Public and Stakeholder Groups
Towards Biodiversity in Hong Kong” Research Report
Table 4.26 “Knowledge Index”
(Percentage)
Knowledgeable Not Knowledgeable Total
Total 25.6 74.4 100.0
* Sex Male 33.3 66.7 100.0
Female 20.7 79.3 100.0
* Age 20-34 35.6 64.4 100.0
35-49 22.3 77.7 100.0
50 or above 20.5 79.5 100.0
Educational level Tertiary (non-degree & degree) 26.6 73.4 100.0
Postgraduate 23.9 76.1 100.0
* Current Teaching School Primary 14.8 85.2 100.0
Secondary 32.5 67.5 100.0
Type of Current Teaching School Government school 25.5 74.5 100.0
Aided school / Caput school 24.0 76.0 100.0
Private school / School under direct subsidy scheme
43.3 56.7 100.0
* Current Teaching Subjects Teaching related subjects 44.6 55.4 100.0 Teaching non-related subjects 7.1 92.9 100.0
* Years of Teaching Experience 10 years or below 36.6 63.4 100.0 11-20 years 20.0 80.0 100.0 21 years or above 22.7 77.3 100.0
Notes: 1. * Chi-Square test indicates a significant relationship exists at 95% confidence level between the response to the question and the demographic attributes.
2. Figures on demographic attributes, those who answered “Don’t know/ Refuse to answer” are excluded.

Centre for Communication and Public Opinion Survey, Agriculture, Fisheries and Conservation Department,
CUHK HKSAR
203
“Baseline Survey on the Attitude and Level of Knowledge of the General Public and Stakeholder Groups
Towards Biodiversity in Hong Kong” Research Report
Table 4.27 “Importance Index”
Mean Sample Size
Total 4.04 414 Sex Males 3.99 162 Females 4.07 251
Age 20-34 4.10 104 35-49 4.03 224 50 or above 3.98 83
Educational level Tertiary (non-degree & degree) 4.05 192 Postgraduate 4.03 218
Current Teaching School Primary 4.04 162 Secondary 4.04 252
Type of Current Teaching School Government school 4.01 55
Aided school / Caput school 4.04 329 Private school / School under
direct subsidy scheme 4.06 30
* Current Teaching Subjects Teaching related subjects 4.13 204 Teaching non-related subjects 3.95 210
Years of Teaching Experience 10 years or below 4.09 112 11-20 years 4.08 150 21 years or above 3.99 132
Notes: 1. * T-test / ANOVA test indicates a significant relationship exists at 95% confidence level between the response to the question and the demographic attributes.
2. Figures on demographic attributes, those who answered “Don’t know/ Refuse to answer” are excluded.
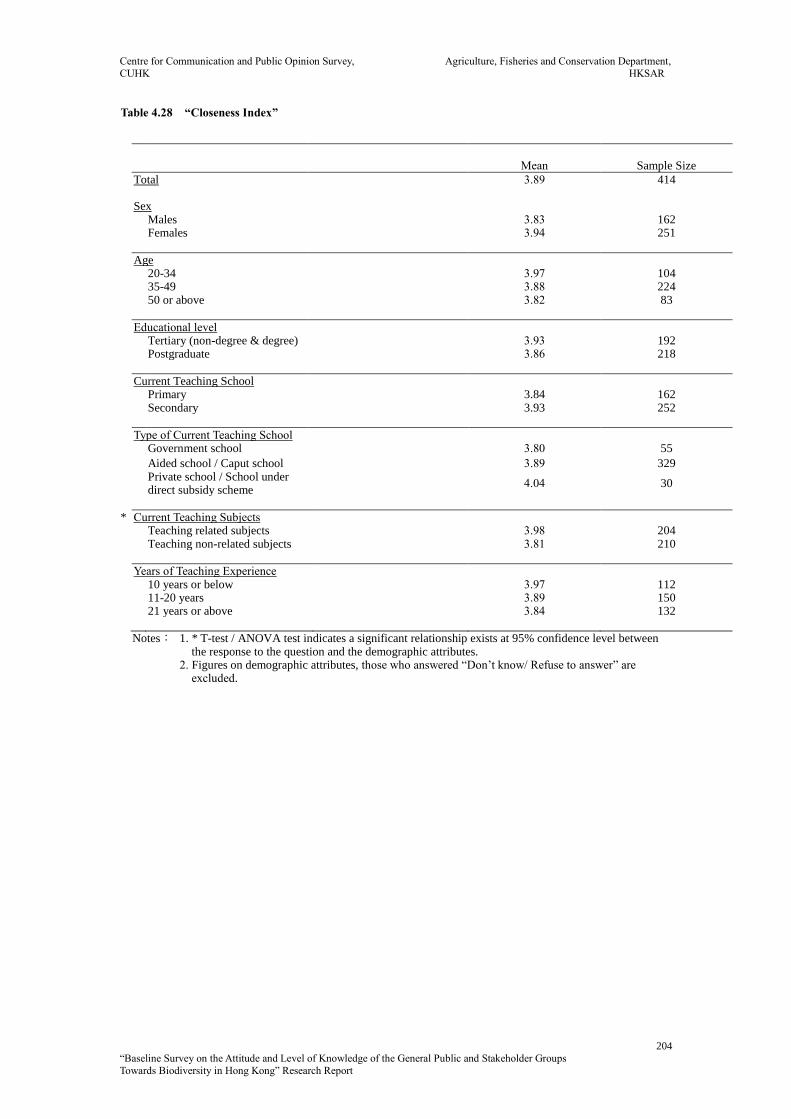
Centre for Communication and Public Opinion Survey, Agriculture, Fisheries and Conservation Department,
CUHK HKSAR
204
“Baseline Survey on the Attitude and Level of Knowledge of the General Public and Stakeholder Groups
Towards Biodiversity in Hong Kong” Research Report
Table 4.28 “Closeness Index”
Mean Sample Size
Total 3.89 414 Sex Males 3.83 162 Females 3.94 251
Age 20-34 3.97 104 35-49 3.88 224 50 or above 3.82 83
Educational level Tertiary (non-degree & degree) 3.93 192 Postgraduate 3.86 218
Current Teaching School Primary 3.84 162 Secondary 3.93 252
Type of Current Teaching School Government school 3.80 55
Aided school / Caput school 3.89 329 Private school / School under
direct subsidy scheme 4.04 30
* Current Teaching Subjects Teaching related subjects 3.98 204 Teaching non-related subjects 3.81 210
Years of Teaching Experience 10 years or below 3.97 112 11-20 years 3.89 150 21 years or above 3.84 132
Notes: 1. * T-test / ANOVA test indicates a significant relationship exists at 95% confidence level between the response to the question and the demographic attributes.
2. Figures on demographic attributes, those who answered “Don’t know/ Refuse to answer” are excluded.
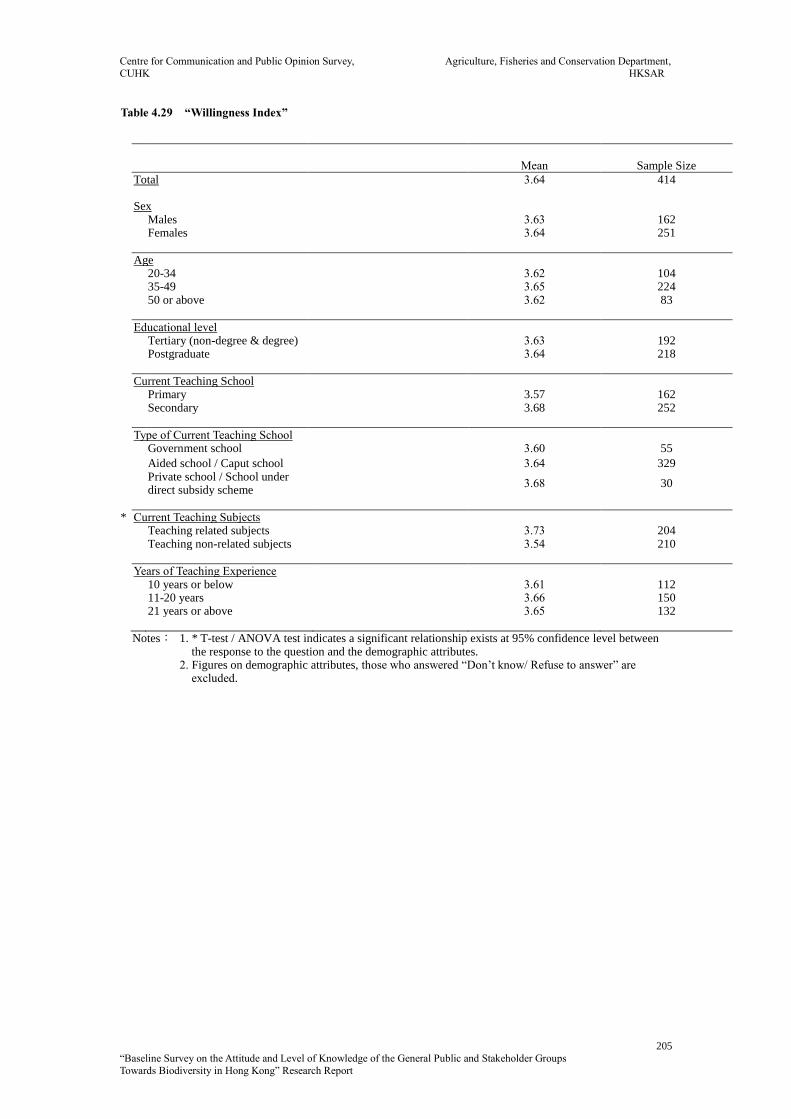
Centre for Communication and Public Opinion Survey, Agriculture, Fisheries and Conservation Department,
CUHK HKSAR
205
“Baseline Survey on the Attitude and Level of Knowledge of the General Public and Stakeholder Groups
Towards Biodiversity in Hong Kong” Research Report
Table 4.29 “Willingness Index”
Mean Sample Size
Total 3.64 414 Sex Males 3.63 162 Females 3.64 251
Age 20-34 3.62 104 35-49 3.65 224 50 or above 3.62 83
Educational level Tertiary (non-degree & degree) 3.63 192 Postgraduate 3.64 218
Current Teaching School Primary 3.57 162 Secondary 3.68 252
Type of Current Teaching School Government school 3.60 55
Aided school / Caput school 3.64 329 Private school / School under
direct subsidy scheme 3.68 30
* Current Teaching Subjects Teaching related subjects 3.73 204 Teaching non-related subjects 3.54 210
Years of Teaching Experience 10 years or below 3.61 112 11-20 years 3.66 150 21 years or above 3.65 132
Notes: 1. * T-test / ANOVA test indicates a significant relationship exists at 95% confidence level between the response to the question and the demographic attributes.
2. Figures on demographic attributes, those who answered “Don’t know/ Refuse to answer” are excluded.

Centre for Communication and Public Opinion Survey, Agriculture, Fisheries and Conservation Department,
CUHK HKSAR
206
“Baseline Survey on the Attitude and Level of Knowledge of the General Public and Stakeholder Groups
Towards Biodiversity in Hong Kong” Research Report
Table 4.30 Does your school have enough teachers who are knowledgeable about biodiversity?
(Percentage)
Not enough So-so
Enough
Total
Total 29.0 58.7 12.3 100.0 Sex Male 28.4 59.3 12.3 100.0 Female 29.1 58.6 12.4 100.0
Age 20-34 22.1 62.5 15.4 100.0 35-49 33.0 55.4 11.6 100.0 50 or above 27.7 62.7 9.6 100.0
Educational level Tertiary (non-degree & degree) 31.3 59.4 9.4 100.0 Postgraduate 27.1 58.3 14.7 100.0
* Current Teaching School Primary 34.6 58.6 6.8 100.0
Secondary 25.4 58.7 15.9 100.0
* Type of Current Teaching School Government school 25.5 56.4 18.2 100.0 Aided school / Caput school 31.3 58.4 10.3 100.0 Private school / School under
direct subsidy scheme 10.0
66.7 23.3 100.0
Current Teaching Subjects Teaching related subjects 26.5 59.8 13.7 100.0 Teaching non-related subjects 31.4 57.6 11.0 100.0
Years of Teaching Experience 10 years or below 23.2 62.5 14.3 100.0 11-20 years 29.3 57.3 13.3 100.0 21 years or above 34.1 55.3 10.6 100.0
Notes: 1. * Chi-Square test indicates a significant relationship exists at 95% confidence level between the response to the question and the demographic attributes.
2. Figures on demographic attributes, those who answered “Don’t know/ Refuse to answer” are excluded.
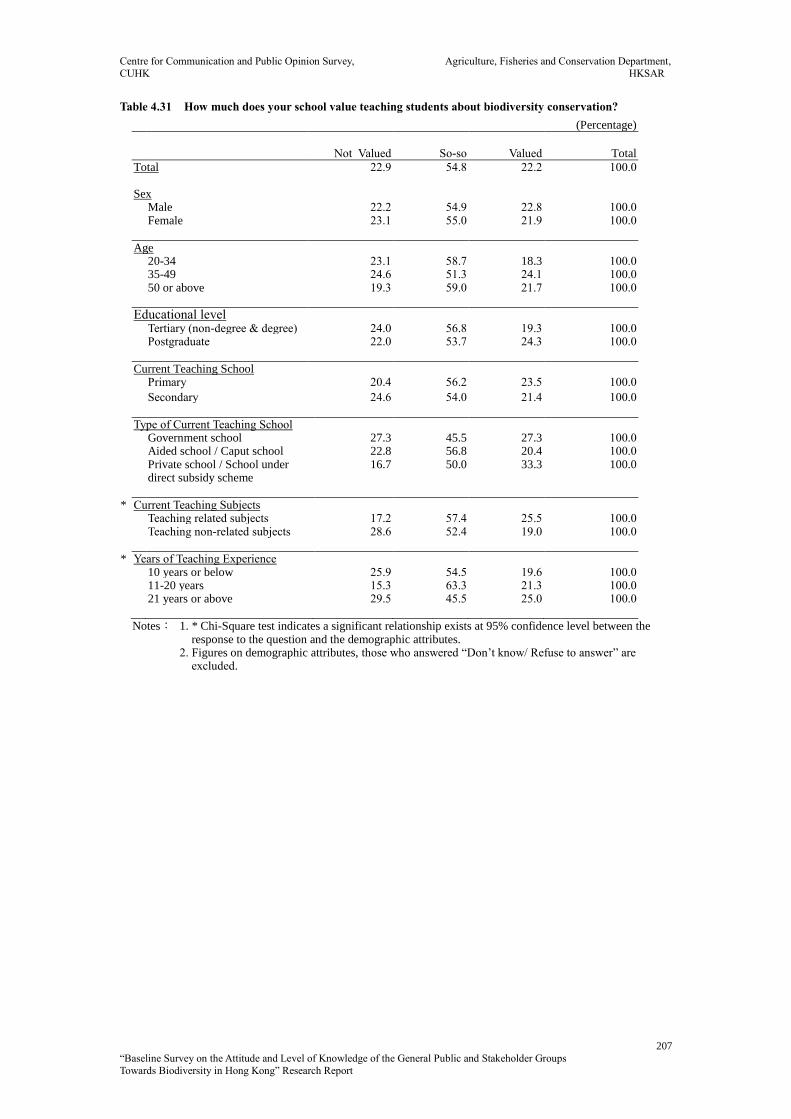
Centre for Communication and Public Opinion Survey, Agriculture, Fisheries and Conservation Department,
CUHK HKSAR
207
“Baseline Survey on the Attitude and Level of Knowledge of the General Public and Stakeholder Groups
Towards Biodiversity in Hong Kong” Research Report
Table 4.31 How much does your school value teaching students about biodiversity conservation?
(Percentage)
Not Valued So-so
Valued
Total
Total 22.9 54.8 22.2 100.0 Sex Male 22.2 54.9 22.8 100.0 Female 23.1 55.0 21.9 100.0
Age 20-34 23.1 58.7 18.3 100.0 35-49 24.6 51.3 24.1 100.0 50 or above 19.3 59.0 21.7 100.0
Educational level Tertiary (non-degree & degree) 24.0 56.8 19.3 100.0 Postgraduate 22.0 53.7 24.3 100.0
Current Teaching School Primary 20.4 56.2 23.5 100.0
Secondary 24.6 54.0 21.4 100.0
Type of Current Teaching School Government school 27.3 45.5 27.3 100.0 Aided school / Caput school 22.8 56.8 20.4 100.0 Private school / School under
direct subsidy scheme 16.7 50.0 33.3 100.0
* Current Teaching Subjects Teaching related subjects 17.2 57.4 25.5 100.0 Teaching non-related subjects 28.6 52.4 19.0 100.0
* Years of Teaching Experience 10 years or below 25.9 54.5 19.6 100.0 11-20 years 15.3 63.3 21.3 100.0 21 years or above 29.5 45.5 25.0 100.0
Notes: 1. * Chi-Square test indicates a significant relationship exists at 95% confidence level between the response to the question and the demographic attributes.
2. Figures on demographic attributes, those who answered “Don’t know/ Refuse to answer” are excluded.

Centre for Communication and Public Opinion Survey, Agriculture, Fisheries and Conservation Department,
CUHK HKSAR
208
“Baseline Survey on the Attitude and Level of Knowledge of the General Public and Stakeholder Groups
Towards Biodiversity in Hong Kong” Research Report
Table 4.32 Has your school ever organized any biodiversity-related activities?
(Percentage)
Yes No
No answer
Total
Total 44.9 54.1 1.0 100.0 Sex Male 50.0 50.0 0.0 100.0 Female 41.8 56.6 1.6 100.0
Age 20-34 48.1 51.0 1.0 100.0 35-49 43.8 55.8 0.4 100.0 50 or above 43.4 54.2 2.4 100.0
Educational level Tertiary (non-degree & degree) 40.6 57.8 1.6 100.0 Postgraduate 49.1 50.5 0.5 100.0
* Current Teaching School Primary 32.1 67.3 0.6 100.0
Secondary 53.2 45.6 1.2 100.0
Type of Current Teaching School Government school 43.6 54.5 1.8 100.0 Aided school / Caput school 43.8 55.3 0.9 100.0 Private school / School under
direct subsidy scheme 60.0 40.0 0.0 100.0
* Current Teaching Subjects Teaching related subjects 52.0 47.1 1.0 100.0 Teaching non-related subjects 38.1 61.0 1.0 100.0
Years of Teaching Experience 10 years or below 46.4 52.7 0.9 100.0 11-20 years 43.3 56.7 0.0 100.0 21 years or above 47.0 51.5 1.5 100.0
Notes: 1. * Chi-Square test indicates a significant relationship exists at 95% confidence level between the response to the question and the demographic attributes.
2. Figures on demographic attributes, those who answered “Don’t know/ Refuse to answer” are excluded.

Centre for Communication and Public Opinion Survey, Agriculture, Fisheries and Conservation Department,
CUHK HKSAR
209
“Baseline Survey on the Attitude and Level of Knowledge of the General Public and Stakeholder Groups
Towards Biodiversity in Hong Kong” Research Report
Table 4.33 Do you think the current curriculum and teaching materials on biodiversity are able to
effectively enhance students’ awareness of conservation? (Percentage)
Not able So-so
Able
Total
Total 37.9 49.3 12.8 100.0 Sex Male 35.2 52.5 12.3 100.0 Female 39.4 47.4 13.1 100.0
Age 20-34 36.5 53.8 9.6 100.0 35-49 38.8 47.8 13.4 100.0 50 or above 37.3 48.2 14.5 100.0
Educational level Tertiary (non-degree & degree) 37.5 49.0 13.5 100.0 Postgraduate 38.5 49.5 11.9 100.0
Current Teaching School Primary 37.0 48.8 14.2 100.0
Secondary 38.5 49.6 11.9 100.0
Type of Current Teaching School Government school 43.6 41.8 14.5 100.0 Aided school / Caput school 37.4 50.5 12.2 100.0 Private school / School under
direct subsidy scheme 33.3 50.0 16.7 100.0
Current Teaching Subjects Teaching related subjects 36.3 49.0 14.7 100.0 Teaching non-related subjects 39.5 49.5 11.0 100.0
Years of Teaching Experience 10 years or below 34.8 55.4 9.8 100.0 11-20 years 34.7 52.0 13.3 100.0 21 years or above 43.9 42.4 13.6 100.0
Notes: 1. * Chi-Square test indicates a significant relationship exists at 95% confidence level between the response to the question and the demographic attributes.
2. Figures on demographic attributes, those who answered “Don’t know/ Refuse to answer” are excluded.

Centre for Communication and Public Opinion Survey, Agriculture, Fisheries and Conservation Department,
CUHK HKSAR
210
“Baseline Survey on the Attitude and Level of Knowledge of the General Public and Stakeholder Groups
Towards Biodiversity in Hong Kong” Research Report
Table 4.34 Do you think the government has offered adequate support to schools or teachers to teach
biodiversity? (Percentage)
Inadequate So-so
Adequate
Total
Total 60.6 37.2 2.2 100.0 Sex Male 59.3 38.3 2.5 100.0 Female 61.4 36.7 2.0 100.0
Age 20-34 62.5 35.6 1.9 100.0 35-49 59.8 38.8 1.3 100.0 50 or above 60.2 34.9 4.8 100.0
Educational level Tertiary (non-degree & degree) 60.4 37.5 2.1 100.0 Postgraduate 60.6 37.2 2.3 100.0
Current Teaching School Primary 59.3 39.5 1.2 100.0
Secondary 61.5 35.7 2.8 100.0
* Type of Current Teaching School Government school 58.2 38.2 3.6 100.0 Aided school / Caput school 62.0 36.8 1.2 100.0 Private school / School under
direct subsidy scheme 50.0 40.0 10.0 100.0
Current Teaching Subjects Teaching related subjects 55.9 41.2 2.9 100.0 Teaching non-related subjects 65.2 33.3 1.4 100.0
Years of Teaching Experience 10 years or below 63.4 34.8 1.8 100.0 11-20 years 53.3 44.7 2.0 100.0 21 years or above 65.9 31.1 3.0 100.0
Notes: 1. * Chi-Square test indicates a significant relationship exists at 95% confidence level between the response to the question and the demographic attributes.
2. Figures on demographic attributes, those who answered “Don’t know/ Refuse to answer” are excluded.

Centre for Communication and Public Opinion Survey, Agriculture, Fisheries and Conservation Department,
CUHK HKSAR
211
“Baseline Survey on the Attitude and Level of Knowledge of the General Public and Stakeholder Groups
Towards Biodiversity in Hong Kong” Research Report
Statistical Tables – Online Survey (Planning and Development
Professionals)
Table 5.1 Have you ever heard of the term “biodiversity”?
(Percentage)
Have heard of it, and know what it means
Have heard of it, but don’t know what it
means
Have not heard
of it Total
Total 72.2 21.7 6.1 100.0
Sex Male 73.7 20.5 5.8 100.0
Female 67.9 25.0 7.1 100.0
* Age 20-34 77.3 18.2 4.5 100.0
35-49 55.9 33.9 10.2 100.0
50 or above 80.0 15.4 4.6 100.0
Educational level Tertiary (non-degree & degree) 68.0 24.8 7.2 100.0
Postgraduate 78.2 17.2 4.6 100.0
* Occupation Architect 72.7 27.3 0.0 100.0
Engineer 80.0 11.4 8.6 100.0
Landscape architect/urban planner/urban designer
96.6 3.4 0.0 100.0
Surveyor 63.4 28.5 8.1 100.0
Years of Industry Experience 10 years or below 75.0 18.8 6.3 100.0
11-20 years 57.4 31.9 10.6 100.0
21 years or above 76.1 19.7 4.2 100.0
Size of Company in Hong Kong 100 employees or below 73.5 22.1 4.4 100.0 101-1000 employees 63.6 25.8 10.6 100.0 1001 employees or above 73.3 20.0 6.7 100.0
Notes: 1. * Chi-Square test indicates a significant relationship exists at 95% confidence level between the response to the question and the demographic attributes.
2. Figures on demographic attributes, those who answered “Other” and “Don’t know/ Refuse to answer” are excluded.
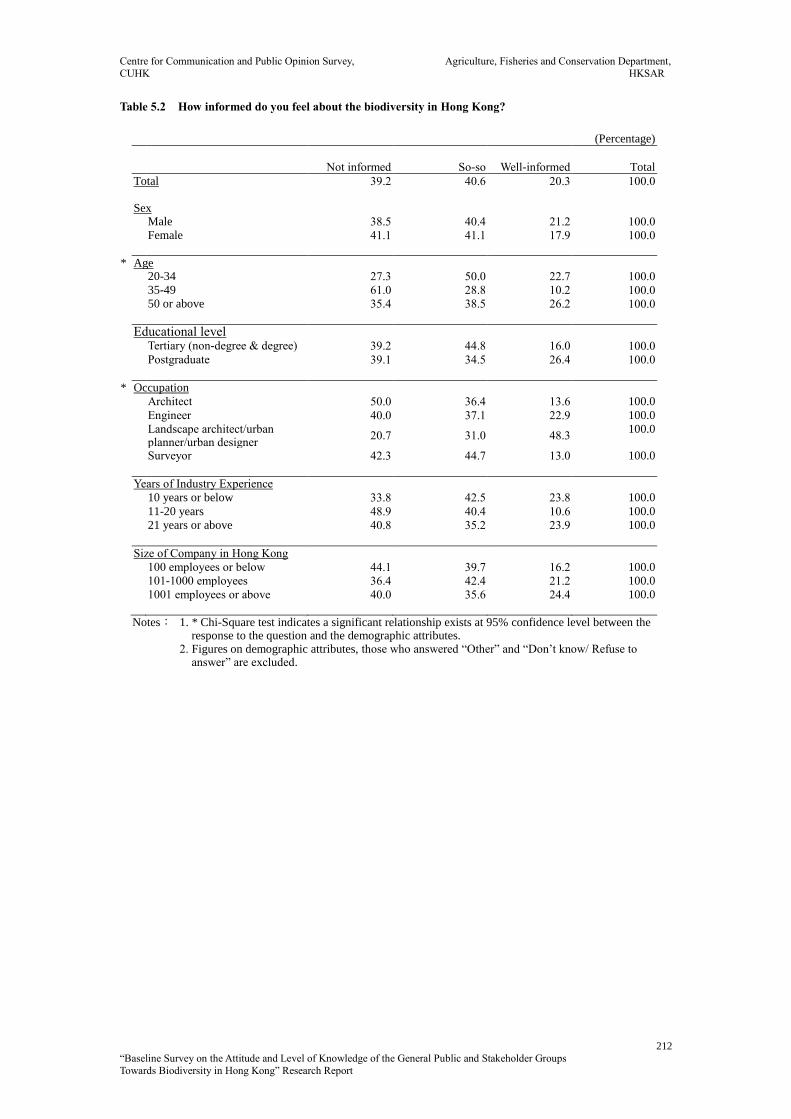
Centre for Communication and Public Opinion Survey, Agriculture, Fisheries and Conservation Department,
CUHK HKSAR
212
“Baseline Survey on the Attitude and Level of Knowledge of the General Public and Stakeholder Groups
Towards Biodiversity in Hong Kong” Research Report
Table 5.2 How informed do you feel about the biodiversity in Hong Kong?
(Percentage)
Not informed So-so Well-informed Total
Total 39.2 40.6 20.3 100.0
Sex Male 38.5 40.4 21.2 100.0 Female 41.1 41.1 17.9 100.0
* Age 20-34 27.3 50.0 22.7 100.0 35-49 61.0 28.8 10.2 100.0 50 or above 35.4 38.5 26.2 100.0
Educational level Tertiary (non-degree & degree) 39.2 44.8 16.0 100.0 Postgraduate 39.1 34.5 26.4 100.0
* Occupation
Architect 50.0 36.4 13.6 100.0
Engineer 40.0 37.1 22.9 100.0
Landscape architect/urban planner/urban designer
20.7 31.0 48.3 100.0
Surveyor 42.3 44.7 13.0 100.0
Years of Industry Experience
10 years or below 33.8 42.5 23.8 100.0
11-20 years 48.9 40.4 10.6 100.0
21 years or above 40.8 35.2 23.9 100.0
Size of Company in Hong Kong
100 employees or below 44.1 39.7 16.2 100.0
101-1000 employees 36.4 42.4 21.2 100.0
1001 employees or above 40.0 35.6 24.4 100.0
Notes: 1. * Chi-Square test indicates a significant relationship exists at 95% confidence level between the response to the question and the demographic attributes.
2. Figures on demographic attributes, those who answered “Other” and “Don’t know/ Refuse to answer” are excluded.

Centre for Communication and Public Opinion Survey, Agriculture, Fisheries and Conservation Department,
CUHK HKSAR
213
“Baseline Survey on the Attitude and Level of Knowledge of the General Public and Stakeholder Groups
Towards Biodiversity in Hong Kong” Research Report
Table 5.3 To your knowledge, please write down ONE designated protected area for nature conservation in Hong
Kong, the one that you are most certain about.
(Percentage)
Answered Correctly Answered Wrongly /
Don't know Total
Total 80.7 19.3 100.0 Sex Male 78.8 21.2 100.0 Female 85.7 14.3 100.0
Age 20-34 78.4 21.6 100.0 35-49 78.0 22.0 100.0 50 or above 86.2 13.8 100.0
Educational level Tertiary (non-degree & degree) 78.4 21.6 100.0 Postgraduate 83.9 16.1 100.0
* Occupation Architect 77.3 22.7 100.0 Engineer 88.6 11.4 100.0 Landscape architect/urban
planner/urban designer 96.6 3.4 100.0
Surveyor 74.8 25.2 100.0
Years of Industry Experience 10 years or below 81.3 18.8 100.0 11-20 years 80.9 19.1 100.0 21 years or above 84.5 15.5 100.0
Size of Company in Hong Kong 100 employees or below 80.9 19.1 100.0 101-1000 employees 80.3 19.7 100.0 1001 employees or above 82.2 17.8 100.0
Notes: 1. * Chi-Square test indicates a significant relationship exists at 95% confidence level between the response to the question and the demographic attributes.
2. Figures on demographic attributes, those who answered “Other” and “Don’t know/ Refuse to answer” are excluded.
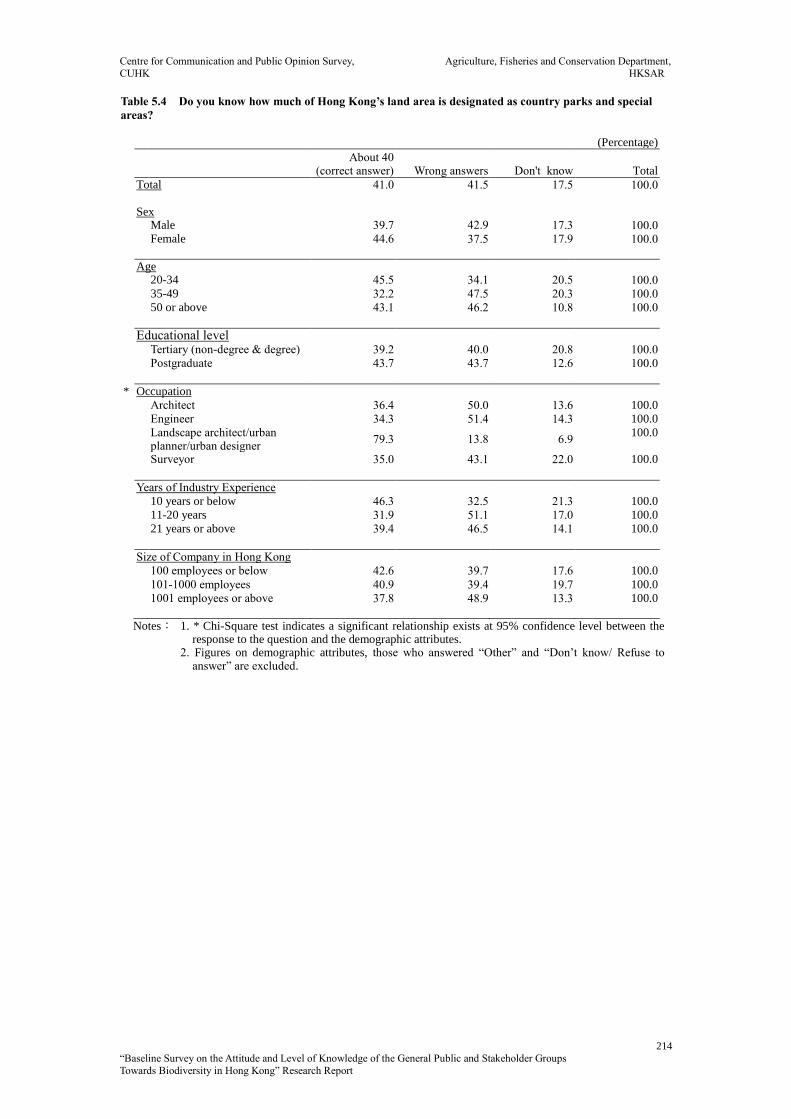
Centre for Communication and Public Opinion Survey, Agriculture, Fisheries and Conservation Department,
CUHK HKSAR
214
“Baseline Survey on the Attitude and Level of Knowledge of the General Public and Stakeholder Groups
Towards Biodiversity in Hong Kong” Research Report
Table 5.4 Do you know how much of Hong Kong’s land area is designated as country parks and special
areas?
(Percentage)
About 40 (correct answer) Wrong answers
Don't know Total
Total 41.0 41.5 17.5 100.0
Sex Male 39.7 42.9 17.3 100.0 Female 44.6 37.5 17.9 100.0
Age 20-34 45.5 34.1 20.5 100.0 35-49 32.2 47.5 20.3 100.0 50 or above 43.1 46.2 10.8 100.0
Educational level Tertiary (non-degree & degree) 39.2 40.0 20.8 100.0 Postgraduate 43.7 43.7 12.6 100.0
* Occupation
Architect 36.4 50.0 13.6 100.0
Engineer 34.3 51.4 14.3 100.0
Landscape architect/urban planner/urban designer
79.3 13.8 6.9 100.0
Surveyor 35.0 43.1 22.0 100.0
Years of Industry Experience
10 years or below 46.3 32.5 21.3 100.0
11-20 years 31.9 51.1 17.0 100.0
21 years or above 39.4 46.5 14.1 100.0
Size of Company in Hong Kong
100 employees or below 42.6 39.7 17.6 100.0
101-1000 employees 40.9 39.4 19.7 100.0
1001 employees or above 37.8 48.9 13.3 100.0
Notes: 1. * Chi-Square test indicates a significant relationship exists at 95% confidence level between the response to the question and the demographic attributes.
2. Figures on demographic attributes, those who answered “Other” and “Don’t know/ Refuse to answer” are excluded.

Centre for Communication and Public Opinion Survey, Agriculture, Fisheries and Conservation Department,
CUHK HKSAR
215
“Baseline Survey on the Attitude and Level of Knowledge of the General Public and Stakeholder Groups
Towards Biodiversity in Hong Kong” Research Report
Table 5.5 To your knowledge, please write down ONE local wild animal or plant that is legally protected in
Hong Kong, the one that you are most certain about. (Percentage)
Answered Correctly
Answered Wrongly / Don't know Total
Total 62.3 37.7 100.0 * Sex Male 57.7 42.3 100.0 Female 75.0 25.0 100.0
Age 20-34 68.2 31.8 100.0 35-49 52.5 47.5 100.0 50 or above 63.1 36.9 100.0
Educational level Tertiary (non-degree & degree) 59.2 40.8 100.0 Postgraduate 66.7 33.3 100.0
* Occupation Architect 50.0 50.0 100.0 Engineer 60.0 40.0 100.0 Landscape architect/urban
planner/urban designer 93.1 6.9 100.0
Surveyor 56.9 43.1 100.0
Years of Industry Experience 10 years or below 71.3 28.8 100.0 11-20 years 53.2 46.8 100.0 21 years or above 59.2 40.8 100.0
Size of Company in Hong Kong 100 employees or below 66.2 33.8 100.0 101-1000 employees 62.1 37.9 100.0 1001 employees or above 66.7 33.3 100.0
Notes: 1. * Chi-Square test indicates a significant relationship exists at 95% confidence level between the response to the question and the demographic attributes.
2. Figures on demographic attributes, those who answered “Other” and “Don’t know/ Refuse to answer” are excluded.
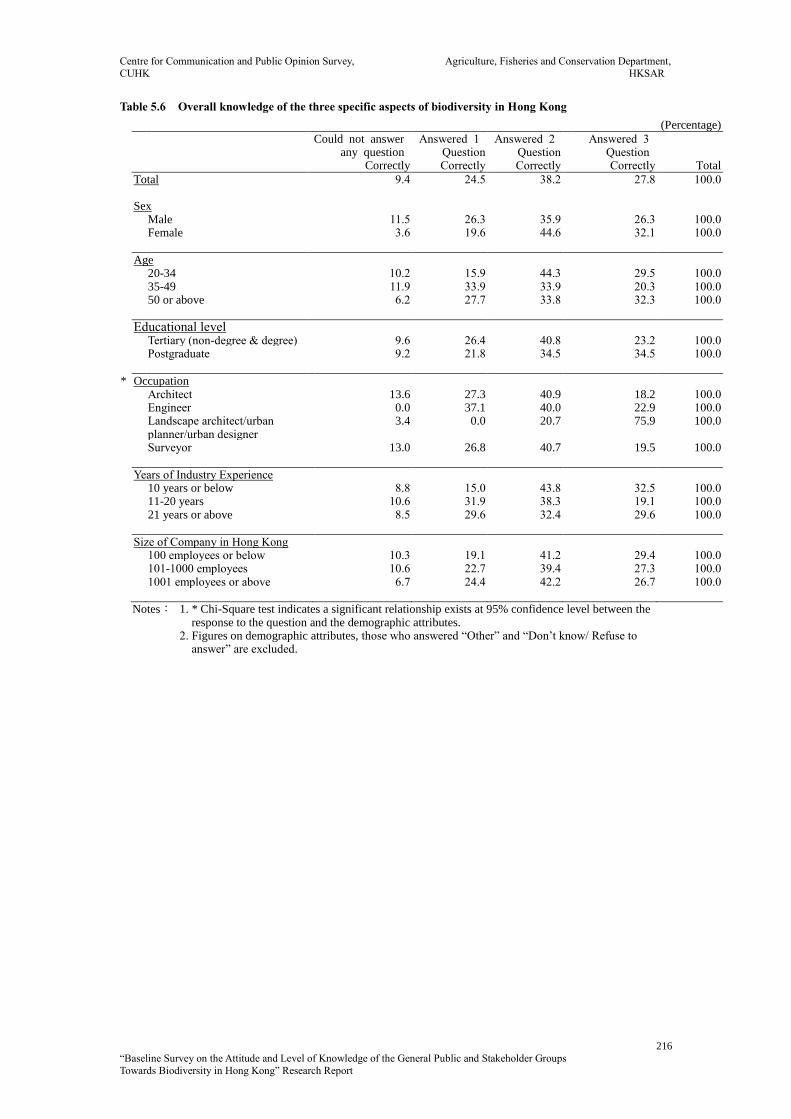
Centre for Communication and Public Opinion Survey, Agriculture, Fisheries and Conservation Department,
CUHK HKSAR
216
“Baseline Survey on the Attitude and Level of Knowledge of the General Public and Stakeholder Groups
Towards Biodiversity in Hong Kong” Research Report
Table 5.6 Overall knowledge of the three specific aspects of biodiversity in Hong Kong
(Percentage)
Could not answer any question
Correctly
Answered 1 Question Correctly
Answered 2 Question Correctly
Answered 3 Question Correctly Total
Total 9.4 24.5 38.2 27.8 100.0 Sex Male 11.5 26.3 35.9 26.3 100.0 Female 3.6 19.6 44.6 32.1 100.0
Age 20-34 10.2 15.9 44.3 29.5 100.0 35-49 11.9 33.9 33.9 20.3 100.0 50 or above 6.2 27.7 33.8 32.3 100.0
Educational level Tertiary (non-degree & degree) 9.6 26.4 40.8 23.2 100.0 Postgraduate 9.2 21.8 34.5 34.5 100.0
* Occupation Architect 13.6 27.3 40.9 18.2 100.0 Engineer 0.0 37.1 40.0 22.9 100.0 Landscape architect/urban
planner/urban designer 3.4 0.0 20.7 75.9 100.0
Surveyor 13.0 26.8 40.7 19.5 100.0
Years of Industry Experience 10 years or below 8.8 15.0 43.8 32.5 100.0 11-20 years 10.6 31.9 38.3 19.1 100.0 21 years or above 8.5 29.6 32.4 29.6 100.0
Size of Company in Hong Kong 100 employees or below 10.3 19.1 41.2 29.4 100.0 101-1000 employees 10.6 22.7 39.4 27.3 100.0 1001 employees or above 6.7 24.4 42.2 26.7 100.0
Notes: 1. * Chi-Square test indicates a significant relationship exists at 95% confidence level between the response to the question and the demographic attributes.
2. Figures on demographic attributes, those who answered “Other” and “Don’t know/ Refuse to answer” are excluded.

Centre for Communication and Public Opinion Survey, Agriculture, Fisheries and Conservation Department,
CUHK HKSAR
217
“Baseline Survey on the Attitude and Level of Knowledge of the General Public and Stakeholder Groups
Towards Biodiversity in Hong Kong” Research Report
Table 5.7 How concerned are you about the biodiversity in Hong Kong?
(Percentage)
Not concerned So-so
Concerned
Total
Total 11.8 31.6 56.6 100.0 Sex Male 13.5 32.7 53.8 100.0 Female 7.1 28.6 64.3 100.0
* Age 20-34 15.9 30.7 53.4 100.0 35-49 15.3 42.4 42.4 100.0 50 or above 3.1 23.1 73.8 100.0
Educational level Tertiary (non-degree & degree) 12.0 36.0 52.0 100.0 Postgraduate 11.5 25.3 63.2 100.0
* Occupation Architect 4.5 27.3 68.2 100.0 Engineer 11.4 14.3 74.3 100.0 Landscape architect/urban
planner/urban designer 0.0 17.2 82.8 100.0
Surveyor 16.3 40.7 43.1 100.0
Years of Industry Experience 10 years or below 13.8 30.0 56.3 100.0 11-20 years 14.9 36.2 48.9 100.0 21 years or above 2.8 28.2 69.0 100.0
Size of Company in Hong Kong 100 employees or below 10.3 27.9 61.8 100.0 101-1000 employees 15.2 39.4 45.5 100.0 1001 employees or above 6.7 28.9 64.4 100.0
Notes: 1. * Chi-Square test indicates a significant relationship exists at 95% confidence level between the response to the question and the demographic attributes.
2. Figures on demographic attributes, those who answered “Other” and “Don’t know/ Refuse to answer” are excluded.

Centre for Communication and Public Opinion Survey, Agriculture, Fisheries and Conservation Department,
CUHK HKSAR
218
“Baseline Survey on the Attitude and Level of Knowledge of the General Public and Stakeholder Groups
Towards Biodiversity in Hong Kong” Research Report
Table 5.8 “Economic development is more important than preserving biodiversity.”
(Percentage)
Disagree So-so
Agree
Total
Total 68.9 17.5 13.7 100.0 Sex Male 66.7 17.3 16.0 100.0 Female 75.0 17.9 7.1 100.0
Age 20-34 68.2 20.5 11.4 100.0 35-49 76.3 13.6 10.2 100.0 50 or above 63.1 16.9 20.0 100.0
Educational level Tertiary (non-degree & degree) 70.4 14.4 15.2 100.0 Postgraduate 66.7 21.8 11.5 100.0
Occupation Architect 72.7 13.6 13.6 100.0 Engineer 74.3 11.4 14.3 100.0 Landscape architect/urban
planner/urban designer 82.8 13.8 3.4 100.0
Surveyor 63.4 20.3 16.3 100.0
Years of Industry Experience 10 years or below 77.5 16.3 6.3 100.0 11-20 years 74.5 12.8 12.8 100.0 21 years or above 66.2 16.9 16.9 100.0
Size of Company in Hong Kong 100 employees or below 77.9 16.2 5.9 100.0 101-1000 employees 71.2 15.2 13.6 100.0 1001 employees or above 64.4 20.0 15.6 100.0
Notes: 1. * Chi-Square test indicates a significant relationship exists at 95% confidence level between the response to the question and the demographic attributes.
2. Figures on demographic attributes, those who answered “Other” and “Don’t know/ Refuse to answer” are excluded.
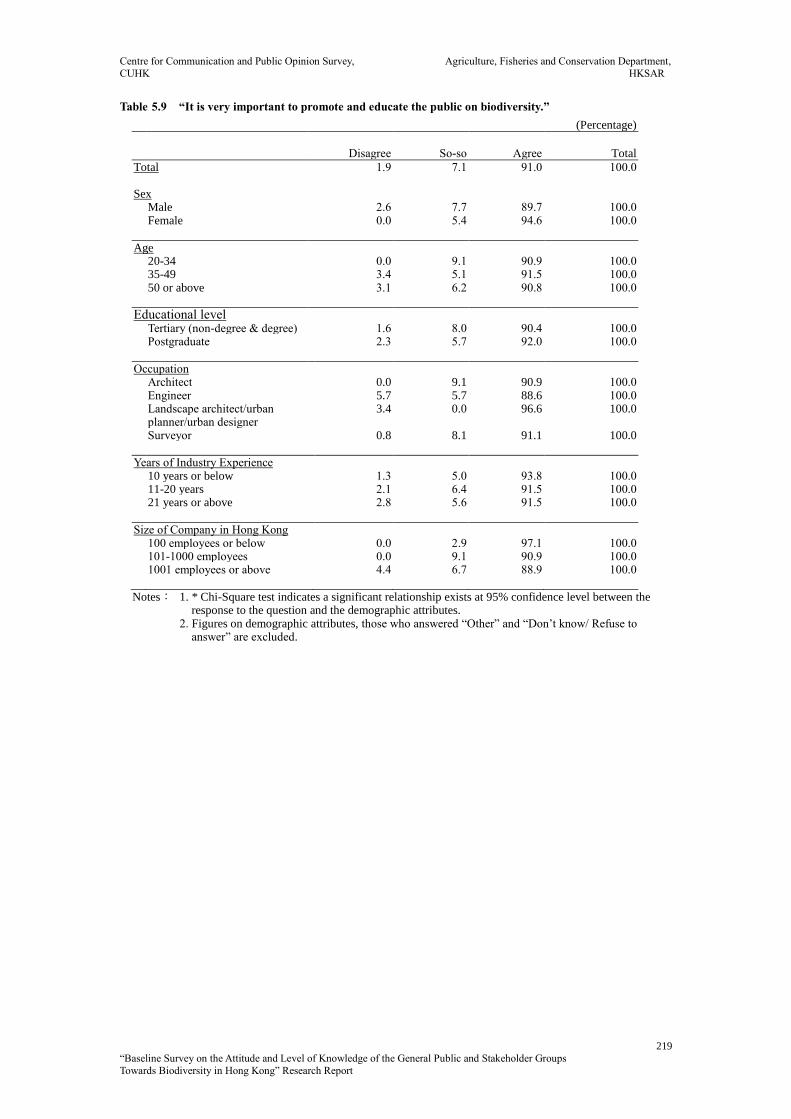
Centre for Communication and Public Opinion Survey, Agriculture, Fisheries and Conservation Department,
CUHK HKSAR
219
“Baseline Survey on the Attitude and Level of Knowledge of the General Public and Stakeholder Groups
Towards Biodiversity in Hong Kong” Research Report
Table 5.9 “It is very important to promote and educate the public on biodiversity.”
(Percentage)
Disagree So-so
Agree
Total
Total 1.9 7.1 91.0 100.0 Sex Male 2.6 7.7 89.7 100.0 Female 0.0 5.4 94.6 100.0
Age 20-34 0.0 9.1 90.9 100.0 35-49 3.4 5.1 91.5 100.0 50 or above 3.1 6.2 90.8 100.0
Educational level Tertiary (non-degree & degree) 1.6 8.0 90.4 100.0 Postgraduate 2.3 5.7 92.0 100.0
Occupation Architect 0.0 9.1 90.9 100.0 Engineer 5.7 5.7 88.6 100.0 Landscape architect/urban
planner/urban designer 3.4 0.0 96.6 100.0
Surveyor 0.8 8.1 91.1 100.0
Years of Industry Experience 10 years or below 1.3 5.0 93.8 100.0 11-20 years 2.1 6.4 91.5 100.0 21 years or above 2.8 5.6 91.5 100.0
Size of Company in Hong Kong 100 employees or below 0.0 2.9 97.1 100.0 101-1000 employees 0.0 9.1 90.9 100.0 1001 employees or above 4.4 6.7 88.9 100.0
Notes: 1. * Chi-Square test indicates a significant relationship exists at 95% confidence level between the response to the question and the demographic attributes.
2. Figures on demographic attributes, those who answered “Other” and “Don’t know/ Refuse to answer” are excluded.
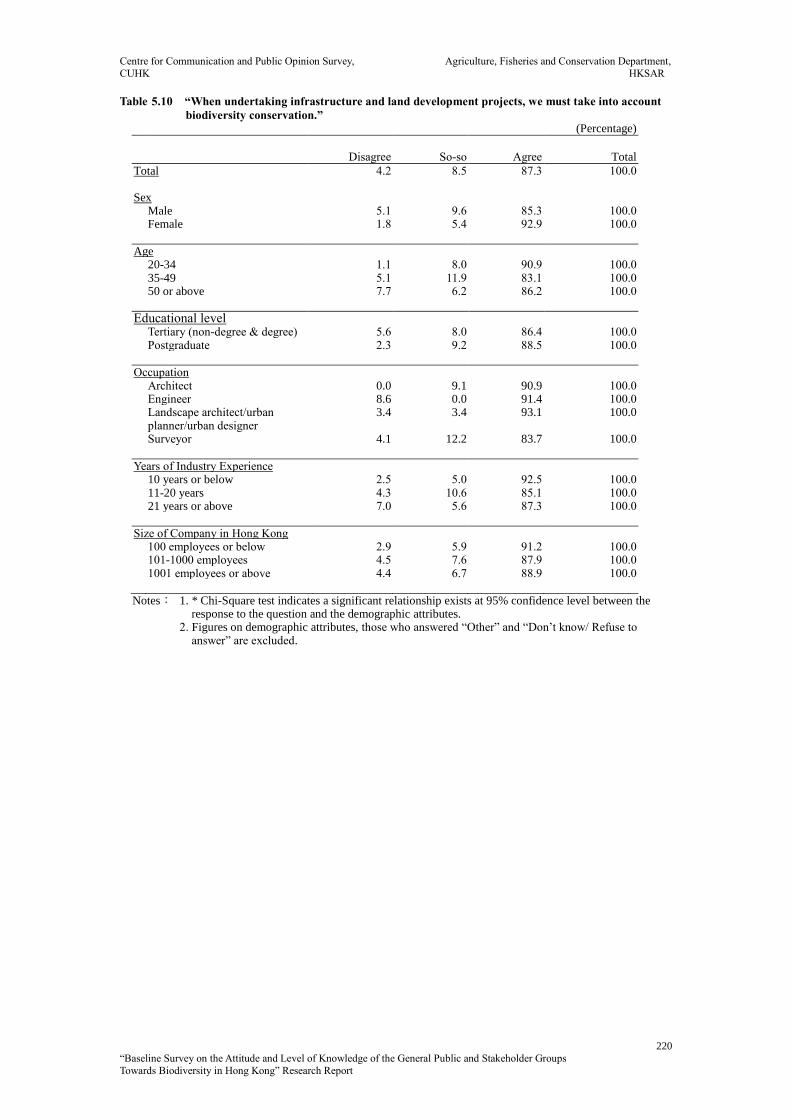
Centre for Communication and Public Opinion Survey, Agriculture, Fisheries and Conservation Department,
CUHK HKSAR
220
“Baseline Survey on the Attitude and Level of Knowledge of the General Public and Stakeholder Groups
Towards Biodiversity in Hong Kong” Research Report
Table 5.10 “When undertaking infrastructure and land development projects, we must take into account
biodiversity conservation.” (Percentage)
Disagree So-so
Agree
Total
Total 4.2 8.5 87.3 100.0 Sex Male 5.1 9.6 85.3 100.0 Female 1.8 5.4 92.9 100.0
Age 20-34 1.1 8.0 90.9 100.0 35-49 5.1 11.9 83.1 100.0 50 or above 7.7 6.2 86.2 100.0
Educational level Tertiary (non-degree & degree) 5.6 8.0 86.4 100.0 Postgraduate 2.3 9.2 88.5 100.0
Occupation Architect 0.0 9.1 90.9 100.0 Engineer 8.6 0.0 91.4 100.0 Landscape architect/urban
planner/urban designer 3.4 3.4 93.1 100.0
Surveyor 4.1 12.2 83.7 100.0
Years of Industry Experience 10 years or below 2.5 5.0 92.5 100.0 11-20 years 4.3 10.6 85.1 100.0 21 years or above 7.0 5.6 87.3 100.0
Size of Company in Hong Kong 100 employees or below 2.9 5.9 91.2 100.0 101-1000 employees 4.5 7.6 87.9 100.0 1001 employees or above 4.4 6.7 88.9 100.0
Notes: 1. * Chi-Square test indicates a significant relationship exists at 95% confidence level between the response to the question and the demographic attributes.
2. Figures on demographic attributes, those who answered “Other” and “Don’t know/ Refuse to answer” are excluded.
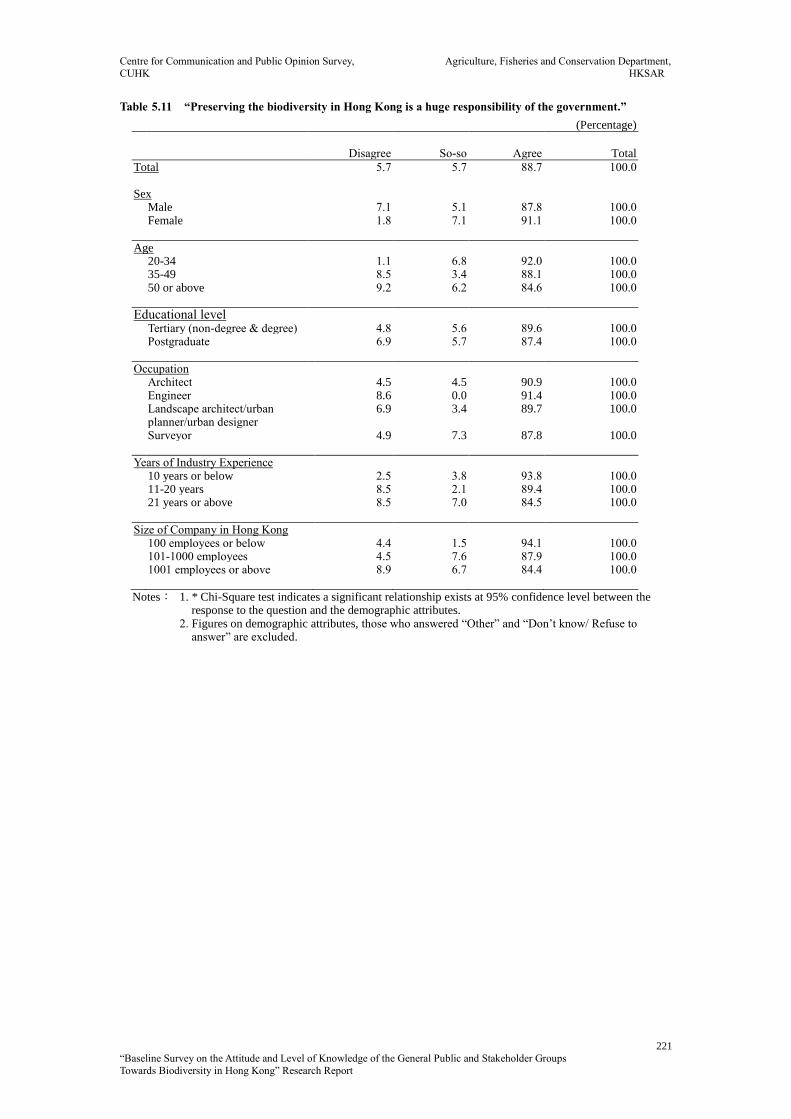
Centre for Communication and Public Opinion Survey, Agriculture, Fisheries and Conservation Department,
CUHK HKSAR
221
“Baseline Survey on the Attitude and Level of Knowledge of the General Public and Stakeholder Groups
Towards Biodiversity in Hong Kong” Research Report
Table 5.11 “Preserving the biodiversity in Hong Kong is a huge responsibility of the government.”
(Percentage)
Disagree So-so
Agree
Total
Total 5.7 5.7 88.7 100.0 Sex Male 7.1 5.1 87.8 100.0 Female 1.8 7.1 91.1 100.0
Age 20-34 1.1 6.8 92.0 100.0 35-49 8.5 3.4 88.1 100.0 50 or above 9.2 6.2 84.6 100.0
Educational level Tertiary (non-degree & degree) 4.8 5.6 89.6 100.0 Postgraduate 6.9 5.7 87.4 100.0
Occupation Architect 4.5 4.5 90.9 100.0 Engineer 8.6 0.0 91.4 100.0 Landscape architect/urban
planner/urban designer 6.9 3.4 89.7 100.0
Surveyor 4.9 7.3 87.8 100.0
Years of Industry Experience 10 years or below 2.5 3.8 93.8 100.0 11-20 years 8.5 2.1 89.4 100.0 21 years or above 8.5 7.0 84.5 100.0
Size of Company in Hong Kong 100 employees or below 4.4 1.5 94.1 100.0 101-1000 employees 4.5 7.6 87.9 100.0 1001 employees or above 8.9 6.7 84.4 100.0
Notes: 1. * Chi-Square test indicates a significant relationship exists at 95% confidence level between the response to the question and the demographic attributes.
2. Figures on demographic attributes, those who answered “Other” and “Don’t know/ Refuse to answer” are excluded.

Centre for Communication and Public Opinion Survey, Agriculture, Fisheries and Conservation Department,
CUHK HKSAR
222
“Baseline Survey on the Attitude and Level of Knowledge of the General Public and Stakeholder Groups
Towards Biodiversity in Hong Kong” Research Report
Table 5.12 “The business sector has a responsibility to preserve the biodiversity in Hong Kong.”
(Percentage)
Disagree So-so
Agree
Total
Total 5.2 8.0 86.8 100.0 Sex Male 5.8 9.0 85.3 100.0 Female 3.6 5.4 91.1 100.0
Age 20-34 2.3 10.2 87.5 100.0 35-49 6.8 5.1 88.1 100.0 50 or above 7.7 7.7 84.6 100.0
Educational level Tertiary (non-degree & degree) 5.6 6.4 88.0 100.0 Postgraduate 4.6 10.3 85.1 100.0
Occupation Architect 0.0 9.1 90.9 100.0 Engineer 11.4 0.0 88.6 100.0 Landscape architect/urban
planner/urban designer 3.4 3.4 93.1 100.0
Surveyor 4.9 10.6 84.6 100.0
Years of Industry Experience 10 years or below 2.5 7.5 90.0 100.0 11-20 years 6.4 8.5 85.1 100.0 21 years or above 7.0 7.0 85.9 100.0
Size of Company in Hong Kong 100 employees or below 2.9 7.4 89.7 100.0 101-1000 employees 4.5 6.1 89.4 100.0 1001 employees or above 6.7 13.3 80.0 100.0
Notes: 1. * Chi-Square test indicates a significant relationship exists at 95% confidence level between the response to the question and the demographic attributes.
2. Figures on demographic attributes, those who answered “Other” and “Don’t know/ Refuse to answer” are excluded.

Centre for Communication and Public Opinion Survey, Agriculture, Fisheries and Conservation Department,
CUHK HKSAR
223
“Baseline Survey on the Attitude and Level of Knowledge of the General Public and Stakeholder Groups
Towards Biodiversity in Hong Kong” Research Report
Table 5.13 “Citizens have a responsibility to change their daily habits so as to preserve the biodiversity in
Hong Kong.” (Percentage)
Disagree So-so
Agree
Total
Total 2.8 4.7 92.5 100.0 Sex Male 3.8 5.1 91.0 100.0 Female 0.0 3.6 96.4 100.0
Age 20-34 0.0 4.5 95.5 100.0 35-49 5.1 6.8 88.1 100.0 50 or above 4.6 3.1 92.3 100.0
Educational level Tertiary (non-degree & degree) 2.4 4.0 93.6 100.0 Postgraduate 3.4 5.7 90.8 100.0
Occupation Architect 0.0 9.1 90.9 100.0 Engineer 5.7 0.0 94.3 100.0 Landscape architect/urban
planner/urban designer 3.4 0.0 96.6 100.0
Surveyor 2.4 5.7 91.9 100.0
Years of Industry Experience 10 years or below 1.3 1.3 97.5 100.0 11-20 years 4.3 8.5 87.2 100.0 21 years or above 4.2 2.8 93.0 100.0
Size of Company in Hong Kong 100 employees or below 0.0 2.9 97.1 100.0 101-1000 employees 1.5 3.0 95.5 100.0 1001 employees or above 6.7 6.7 86.7 100.0
Notes: 1. * Chi-Square test indicates a significant relationship exists at 95% confidence level between the response to the question and the demographic attributes.
2. Figures on demographic attributes, those who answered “Other” and “Don’t know/ Refuse to answer” are excluded.

Centre for Communication and Public Opinion Survey, Agriculture, Fisheries and Conservation Department,
CUHK HKSAR
224
“Baseline Survey on the Attitude and Level of Knowledge of the General Public and Stakeholder Groups
Towards Biodiversity in Hong Kong” Research Report
Table 5.14 “The loss of biodiversity will lead to a decrease in food and product choices for citizens.”
(Percentage)
Disagree So-so
Agree
Total
Total 21.2 30.2 48.6 100.0 Sex Male 24.4 28.8 46.8 100.0 Female 12.5 33.9 53.6 100.0
Age 20-34 23.9 27.3 48.9 100.0 35-49 22.0 32.2 45.8 100.0 50 or above 16.9 32.3 50.8 100.0
Educational level Tertiary (non-degree & degree) 23.2 31.2 45.6 100.0 Postgraduate 18.4 28.7 52.9 100.0
Occupation Architect 18.2 27.3 54.5 100.0 Engineer 17.1 28.6 54.3 100.0 Landscape architect/urban
planner/urban designer 3.4 41.4 55.2 100.0
Surveyor 26.8 29.3 43.9 100.0
Years of Industry Experience 10 years or below 22.5 28.8 48.8 100.0 11-20 years 27.7 27.7 44.7 100.0 21 years or above 15.5 31.0 53.5 100.0
Size of Company in Hong Kong 100 employees or below 20.6 25.0 54.4 100.0 101-1000 employees 18.2 34.8 47.0 100.0 1001 employees or above 31.1 28.9 40.0 100.0
Notes: 1. * Chi-Square test indicates a significant relationship exists at 95% confidence level between the response to the question and the demographic attributes.
2. Figures on demographic attributes, those who answered “Other” and “Don’t know/ Refuse to answer” are excluded.

Centre for Communication and Public Opinion Survey, Agriculture, Fisheries and Conservation Department,
CUHK HKSAR
225
“Baseline Survey on the Attitude and Level of Knowledge of the General Public and Stakeholder Groups
Towards Biodiversity in Hong Kong” Research Report
Table 5.15 “The loss of biodiversity will affect citizens’ health.”
(Percentage)
Disagree So-so
Agree
Total
Total 14.6 32.1 53.3 100.0 Sex Male 15.4 34.0 50.6 100.0 Female 12.5 26.8 60.7 100.0
Age 20-34 10.2 36.4 53.4 100.0 35-49 16.9 25.4 57.6 100.0 50 or above 18.5 32.3 49.2 100.0
Educational level Tertiary (non-degree & degree) 16.0 36.8 47.2 100.0 Postgraduate 12.6 25.3 62.1 100.0
* Occupation Architect 13.6 27.3 59.1 100.0 Engineer 5.7 45.7 48.6 100.0 Landscape architect/urban
planner/urban designer 10.3 13.8 75.9 100.0
Surveyor 18.7 33.3 48.0 100.0
Years of Industry Experience 10 years or below 7.5 35.0 57.5 100.0 11-20 years 17.0 25.5 57.4 100.0 21 years or above 18.3 29.6 52.1 100.0
Size of Company in Hong Kong 100 employees or below 13.2 23.5 63.2 100.0 101-1000 employees 15.2 30.3 54.5 100.0 1001 employees or above 15.6 44.4 40.0 100.0
Notes: 1. * Chi-Square test indicates a significant relationship exists at 95% confidence level between the response to the question and the demographic attributes.
2. Figures on demographic attributes, those who answered “Other” and “Don’t know/ Refuse to answer” are excluded.

Centre for Communication and Public Opinion Survey, Agriculture, Fisheries and Conservation Department,
CUHK HKSAR
226
“Baseline Survey on the Attitude and Level of Knowledge of the General Public and Stakeholder Groups
Towards Biodiversity in Hong Kong” Research Report
Table 5.16 “The loss of biodiversity will affect citizens’ living environment.”
(Percentage)
Disagree So-so
Agree
Total
Total 8.5 14.2 77.4 100.0 Sex Male 9.6 14.7 75.6 100.0 Female 5.4 12.5 82.1 100.0
Age 20-34 8.0 14.8 77.3 100.0 35-49 5.1 18.6 76.3 100.0 50 or above 12.3 9.2 78.5 100.0
Educational level Tertiary (non-degree & degree) 10.4 15.2 74.4 100.0 Postgraduate 5.7 12.6 81.6 100.0
Occupation Architect 13.6 13.6 72.7 100.0 Engineer 5.7 11.4 82.9 100.0 Landscape architect/urban
planner/urban designer 3.4 6.9 89.7 100.0
Surveyor 9.8 17.1 73.2 100.0
Years of Industry Experience 10 years or below 5.0 12.5 82.5 100.0 11-20 years 6.4 21.3 72.3 100.0 21 years or above 11.3 9.9 78.9 100.0
Size of Company in Hong Kong 100 employees or below 8.8 8.8 82.4 100.0 101-1000 employees 4.5 13.6 81.8 100.0 1001 employees or above 8.9 26.7 64.4 100.0
Notes: 1. * Chi-Square test indicates a significant relationship exists at 95% confidence level between the response to the question and the demographic attributes.
2. Figures on demographic attributes, those who answered “Other” and “Don’t know/ Refuse to answer” are excluded.

Centre for Communication and Public Opinion Survey, Agriculture, Fisheries and Conservation Department,
CUHK HKSAR
227
“Baseline Survey on the Attitude and Level of Knowledge of the General Public and Stakeholder Groups
Towards Biodiversity in Hong Kong” Research Report
Table 5.17 “Preserving biodiversity can enrich the leisure life of citizens.”
(Percentage)
Disagree So-so
Agree
Total
Total 2.8 11.8 85.4 100.0 Sex Male 3.2 14.1 82.7 100.0 Female 1.8 5.4 92.9 100.0
Age 20-34 3.4 17.0 79.5 100.0 35-49 3.4 13.6 83.1 100.0 50 or above 1.5 3.1 95.4 100.0
Educational level Tertiary (non-degree & degree) 3.2 12.8 84.0 100.0 Postgraduate 2.3 10.3 87.4 100.0
Occupation Architect 0.0 13.6 86.4 100.0 Engineer 2.9 2.9 94.3 100.0 Landscape architect/urban
planner/urban designer 3.4 10.3 86.2 100.0
Surveyor 3.3 14.6 82.1 100.0
Years of Industry Experience 10 years or below 2.5 15.0 82.5 100.0 11-20 years 4.3 6.4 89.4 100.0 21 years or above 1.4 8.5 90.1 100.0
* Size of Company in Hong Kong 100 employees or below 4.4 4.4 91.2 100.0 101-1000 employees 1.5 10.6 87.9 100.0 1001 employees or above 0.0 22.2 77.8 100.0
Notes: 1. * Chi-Square test indicates a significant relationship exists at 95% confidence level between the response to the question and the demographic attributes.
2. Figures on demographic attributes, those who answered “Other” and “Don’t know/ Refuse to answer” are excluded.

Centre for Communication and Public Opinion Survey, Agriculture, Fisheries and Conservation Department,
CUHK HKSAR
228
“Baseline Survey on the Attitude and Level of Knowledge of the General Public and Stakeholder Groups
Towards Biodiversity in Hong Kong” Research Report
Table 5.18 “Preserving biodiversity can bring economic gains to Hong Kong.”
(Percentage)
Disagree So-so
Agree
Total
Total 9.4 34.9 55.7 100.0 Sex Male 11.5 37.2 51.3 100.0 Female 3.6 28.6 67.9 100.0
Age 20-34 6.8 30.7 62.5 100.0 35-49 11.9 40.7 47.5 100.0 50 or above 10.8 35.4 53.8 100.0
Educational level Tertiary (non-degree & degree) 11.2 36.0 52.8 100.0 Postgraduate 6.9 33.3 59.8 100.0
Occupation Architect 13.6 18.2 68.2 100.0 Engineer 8.6 31.4 60.0 100.0 Landscape architect/urban
planner/urban designer 0.0 24.1 75.9 100.0
Surveyor 11.4 41.5 47.2 100.0
Years of Industry Experience 10 years or below 5.0 28.8 66.3 100.0 11-20 years 10.6 42.6 46.8 100.0 21 years or above 12.7 33.8 53.5 100.0
Size of Company in Hong Kong 100 employees or below 10.3 29.4 60.3 100.0 101-1000 employees 6.1 37.9 56.1 100.0 1001 employees or above 11.1 37.8 51.1 100.0
Notes: 1. * Chi-Square test indicates a significant relationship exists at 95% confidence level between the response to the question and the demographic attributes.
2. Figures on demographic attributes, those who answered “Other” and “Don’t know/ Refuse to answer” are excluded.
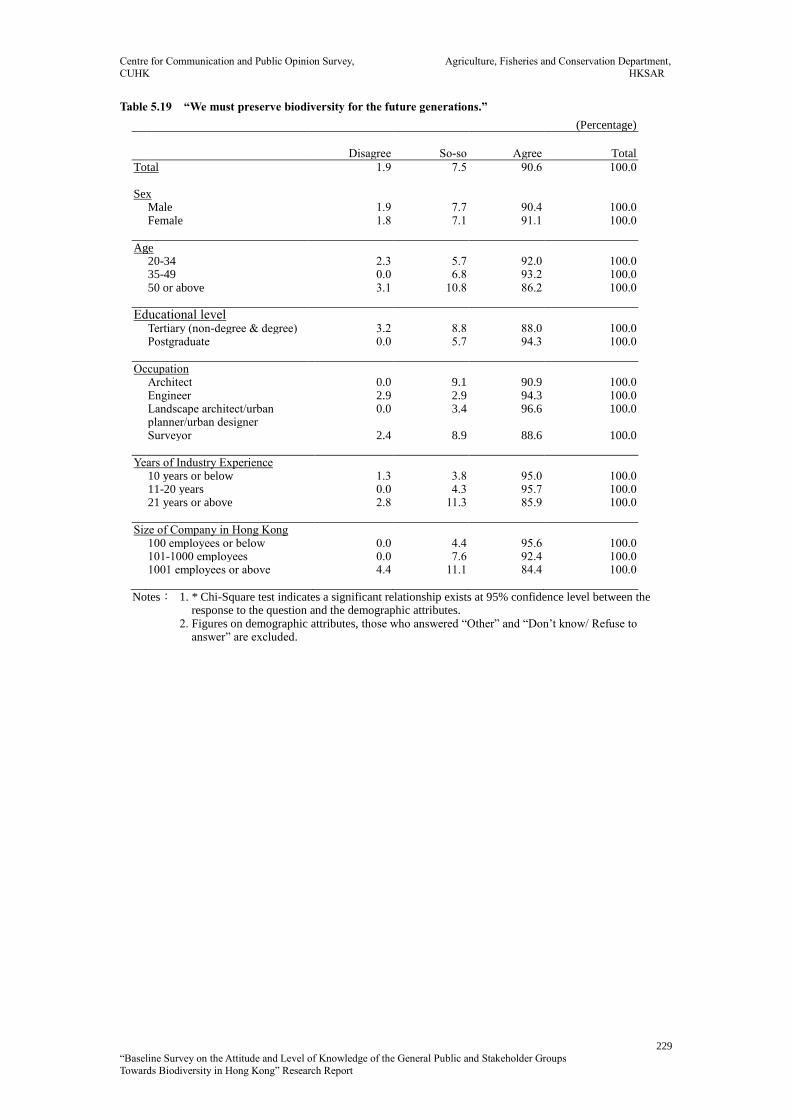
Centre for Communication and Public Opinion Survey, Agriculture, Fisheries and Conservation Department,
CUHK HKSAR
229
“Baseline Survey on the Attitude and Level of Knowledge of the General Public and Stakeholder Groups
Towards Biodiversity in Hong Kong” Research Report
Table 5.19 “We must preserve biodiversity for the future generations.”
(Percentage)
Disagree So-so
Agree
Total
Total 1.9 7.5 90.6 100.0 Sex Male 1.9 7.7 90.4 100.0 Female 1.8 7.1 91.1 100.0
Age 20-34 2.3 5.7 92.0 100.0 35-49 0.0 6.8 93.2 100.0 50 or above 3.1 10.8 86.2 100.0
Educational level Tertiary (non-degree & degree) 3.2 8.8 88.0 100.0 Postgraduate 0.0 5.7 94.3 100.0
Occupation Architect 0.0 9.1 90.9 100.0 Engineer 2.9 2.9 94.3 100.0 Landscape architect/urban
planner/urban designer 0.0 3.4 96.6 100.0
Surveyor 2.4 8.9 88.6 100.0
Years of Industry Experience 10 years or below 1.3 3.8 95.0 100.0 11-20 years 0.0 4.3 95.7 100.0 21 years or above 2.8 11.3 85.9 100.0
Size of Company in Hong Kong 100 employees or below 0.0 4.4 95.6 100.0 101-1000 employees 0.0 7.6 92.4 100.0 1001 employees or above 4.4 11.1 84.4 100.0
Notes: 1. * Chi-Square test indicates a significant relationship exists at 95% confidence level between the response to the question and the demographic attributes.
2. Figures on demographic attributes, those who answered “Other” and “Don’t know/ Refuse to answer” are excluded.

Centre for Communication and Public Opinion Survey, Agriculture, Fisheries and Conservation Department,
CUHK HKSAR
230
“Baseline Survey on the Attitude and Level of Knowledge of the General Public and Stakeholder Groups
Towards Biodiversity in Hong Kong” Research Report
Table 5.20 Will you boycott products and services that would harm biodiversity?
(Percentage)
Will not Half& half
Will
Total
Total 5.7 28.3 66.0 100.0 Sex Male 5.8 29.5 64.7 100.0 Female 5.4 25.0 69.6 100.0
Age 20-34 6.8 31.8 61.4 100.0 35-49 5.1 27.1 67.8 100.0 50 or above 4.6 24.6 70.8 100.0
Educational level Tertiary (non-degree & degree) 8.0 28.0 64.0 100.0 Postgraduate 2.3 28.7 69.0 100.0
Occupation Architect 4.5 27.3 68.2 100.0 Engineer 0.0 20.0 80.0 100.0 Landscape architect/urban
planner/urban designer 3.4 20.7 75.9 100.0
Surveyor 7.3 33.3 59.3 100.0
Years of Industry Experience 10 years or below 6.3 28.8 65.0 100.0 11-20 years 4.3 27.7 68.1 100.0 21 years or above 4.2 23.9 71.8 100.0
Size of Company in Hong Kong 100 employees or below 5.9 20.6 73.5 100.0 101-1000 employees 6.1 30.3 63.6 100.0 1001 employees or above 4.4 33.3 62.2 100.0
Notes: 1. * Chi-Square test indicates a significant relationship exists at 95% confidence level between the response to the question and the demographic attributes.
2. Figures on demographic attributes, those who answered “Other” and “Don’t know/ Refuse to answer” are excluded.

Centre for Communication and Public Opinion Survey, Agriculture, Fisheries and Conservation Department,
CUHK HKSAR
231
“Baseline Survey on the Attitude and Level of Knowledge of the General Public and Stakeholder Groups
Towards Biodiversity in Hong Kong” Research Report
Table 5.21 Will you donate money to associations dedicated to conserving biodiversity?
(Percentage)
Will not Half& half
Will
Total
Total 19.3 36.8 43.9 100.0 Sex Male 22.4 35.9 41.7 100.0 Female 10.7 39.3 50.0 100.0
Age 20-34 27.3 36.4 36.4 100.0 35-49 15.3 40.7 44.1 100.0 50 or above 12.3 33.8 53.8 100.0
Educational level Tertiary (non-degree & degree) 20.8 39.2 40.0 100.0 Postgraduate 17.2 33.3 49.4 100.0
* Occupation Architect 9.1 36.4 54.5 100.0 Engineer 14.3 31.4 54.3 100.0 Landscape architect/urban
planner/urban designer 13.8 20.7 65.5 100.0
Surveyor 24.4 41.5 34.1 100.0
Years of Industry Experience 10 years or below 22.5 33.8 43.8 100.0 11-20 years 17.0 40.4 42.6 100.0 21 years or above 12.7 36.6 50.7 100.0
Size of Company in Hong Kong 100 employees or below 14.7 33.8 51.5 100.0 101-1000 employees 19.7 39.4 40.9 100.0 1001 employees or above 22.2 35.6 42.2 100.0
Notes: 1. * Chi-Square test indicates a significant relationship exists at 95% confidence level between the response to the question and the demographic attributes.
2. Figures on demographic attributes, those who answered “Other” and “Don’t know/ Refuse to answer” are excluded.

Centre for Communication and Public Opinion Survey, Agriculture, Fisheries and Conservation Department,
CUHK HKSAR
232
“Baseline Survey on the Attitude and Level of Knowledge of the General Public and Stakeholder Groups
Towards Biodiversity in Hong Kong” Research Report
Table 5.22 Will you participate in environmental activities related to biodiversity conservation?
(Percentage)
Will not Half& half
Will
Total
Total 18.9 29.2 51.9 100.0 Sex Male 22.4 26.9 50.6 100.0 Female 8.9 35.7 55.4 100.0
Age 20-34 22.7 29.5 47.7 100.0 35-49 16.9 35.6 47.5 100.0 50 or above 15.4 23.1 61.5 100.0
Educational level Tertiary (non-degree & degree) 22.4 32.0 45.6 100.0 Postgraduate 13.8 25.3 60.9 100.0
* Occupation Architect 13.6 36.4 50.0 100.0 Engineer 8.6 20.0 71.4 100.0 Landscape architect/urban
planner/urban designer 6.9 10.3 82.8 100.0
Surveyor 26.0 35.0 39.0 100.0
Years of Industry Experience 10 years or below 17.5 28.8 53.8 100.0 11-20 years 19.1 27.7 53.2 100.0 21 years or above 18.3 28.2 53.5 100.0
* Size of Company in Hong Kong 100 employees or below 11.8 29.4 58.8 100.0 101-1000 employees 27.3 21.2 51.5 100.0 1001 employees or above 17.8 42.2 40.0 100.0
Notes: 1. * Chi-Square test indicates a significant relationship exists at 95% confidence level between the response to the question and the demographic attributes.
2. Figures on demographic attributes, those who answered “Other” and “Don’t know/ Refuse to answer” are excluded.

Centre for Communication and Public Opinion Survey, Agriculture, Fisheries and Conservation Department,
CUHK HKSAR
233
“Baseline Survey on the Attitude and Level of Knowledge of the General Public and Stakeholder Groups
Towards Biodiversity in Hong Kong” Research Report
Table 5.23 Will you encourage your families or friends to preserve biodiversity?
(Percentage)
Will not Half& half
Will
Total
Total 6.6 25.5 67.9 100.0 Sex Male 7.7 27.6 64.7 100.0 Female 3.6 19.6 76.8 100.0
Age 20-34 8.0 28.4 63.6 100.0 35-49 8.5 27.1 64.4 100.0 50 or above 3.1 20.0 76.9 100.0
Educational level Tertiary (non-degree & degree) 8.0 27.2 64.8 100.0 Postgraduate 4.6 23.0 72.4 100.0
* Occupation Architect 4.5 36.4 59.1 100.0 Engineer 2.9 8.6 88.6 100.0 Landscape architect/urban
planner/urban designer 3.4 13.8 82.8 100.0
Surveyor 8.9 30.9 60.2 100.0
Years of Industry Experience 10 years or below 3.8 25.0 71.3 100.0 11-20 years 10.6 21.3 68.1 100.0 21 years or above 5.6 21.1 73.2 100.0
Size of Company in Hong Kong 100 employees or below 2.9 23.5 73.5 100.0 101-1000 employees 9.1 24.2 66.7 100.0 1001 employees or above 6.7 24.4 68.9 100.0
Notes: 1. * Chi-Square test indicates a significant relationship exists at 95% confidence level between the response to the question and the demographic attributes.
2. Figures on demographic attributes, those who answered “Other” and “Don’t know/ Refuse to answer” are excluded.
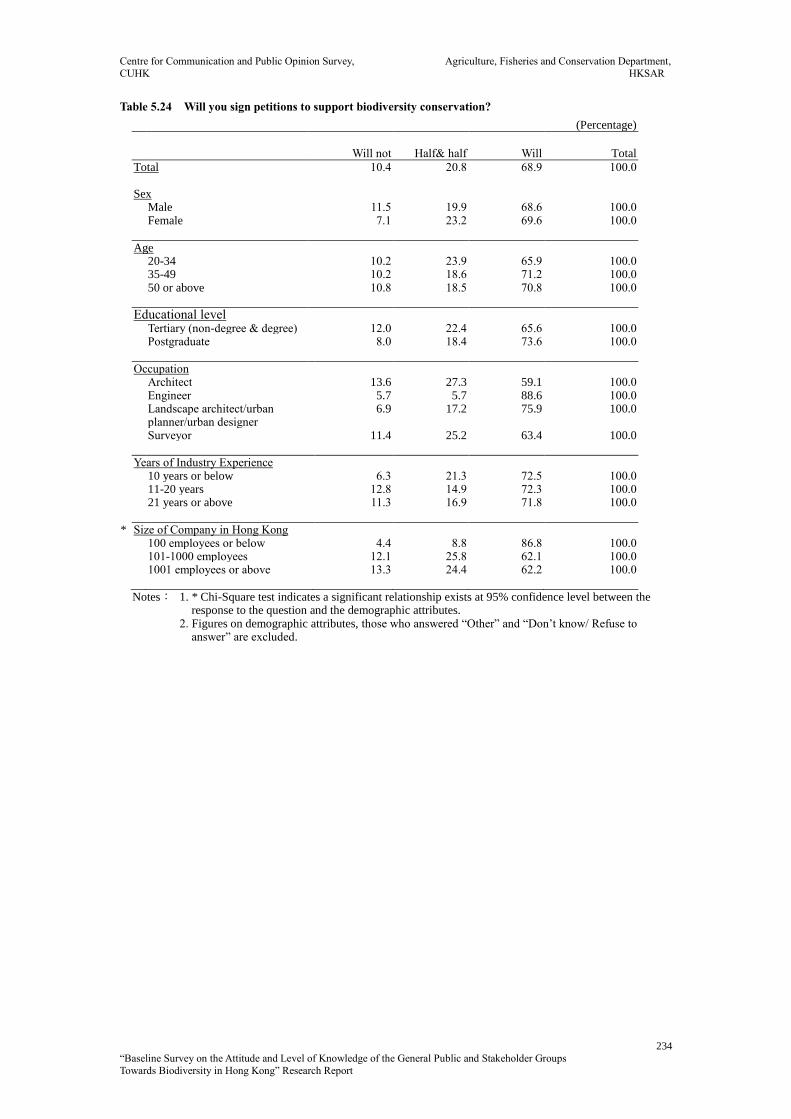
Centre for Communication and Public Opinion Survey, Agriculture, Fisheries and Conservation Department,
CUHK HKSAR
234
“Baseline Survey on the Attitude and Level of Knowledge of the General Public and Stakeholder Groups
Towards Biodiversity in Hong Kong” Research Report
Table 5.24 Will you sign petitions to support biodiversity conservation?
(Percentage)
Will not Half& half
Will
Total
Total 10.4 20.8 68.9 100.0 Sex Male 11.5 19.9 68.6 100.0 Female 7.1 23.2 69.6 100.0
Age 20-34 10.2 23.9 65.9 100.0 35-49 10.2 18.6 71.2 100.0 50 or above 10.8 18.5 70.8 100.0
Educational level Tertiary (non-degree & degree) 12.0 22.4 65.6 100.0 Postgraduate 8.0 18.4 73.6 100.0
Occupation Architect 13.6 27.3 59.1 100.0 Engineer 5.7 5.7 88.6 100.0 Landscape architect/urban
planner/urban designer 6.9 17.2 75.9 100.0
Surveyor 11.4 25.2 63.4 100.0
Years of Industry Experience 10 years or below 6.3 21.3 72.5 100.0 11-20 years 12.8 14.9 72.3 100.0 21 years or above 11.3 16.9 71.8 100.0
* Size of Company in Hong Kong 100 employees or below 4.4 8.8 86.8 100.0 101-1000 employees 12.1 25.8 62.1 100.0 1001 employees or above 13.3 24.4 62.2 100.0
Notes: 1. * Chi-Square test indicates a significant relationship exists at 95% confidence level between the response to the question and the demographic attributes.
2. Figures on demographic attributes, those who answered “Other” and “Don’t know/ Refuse to answer” are excluded.
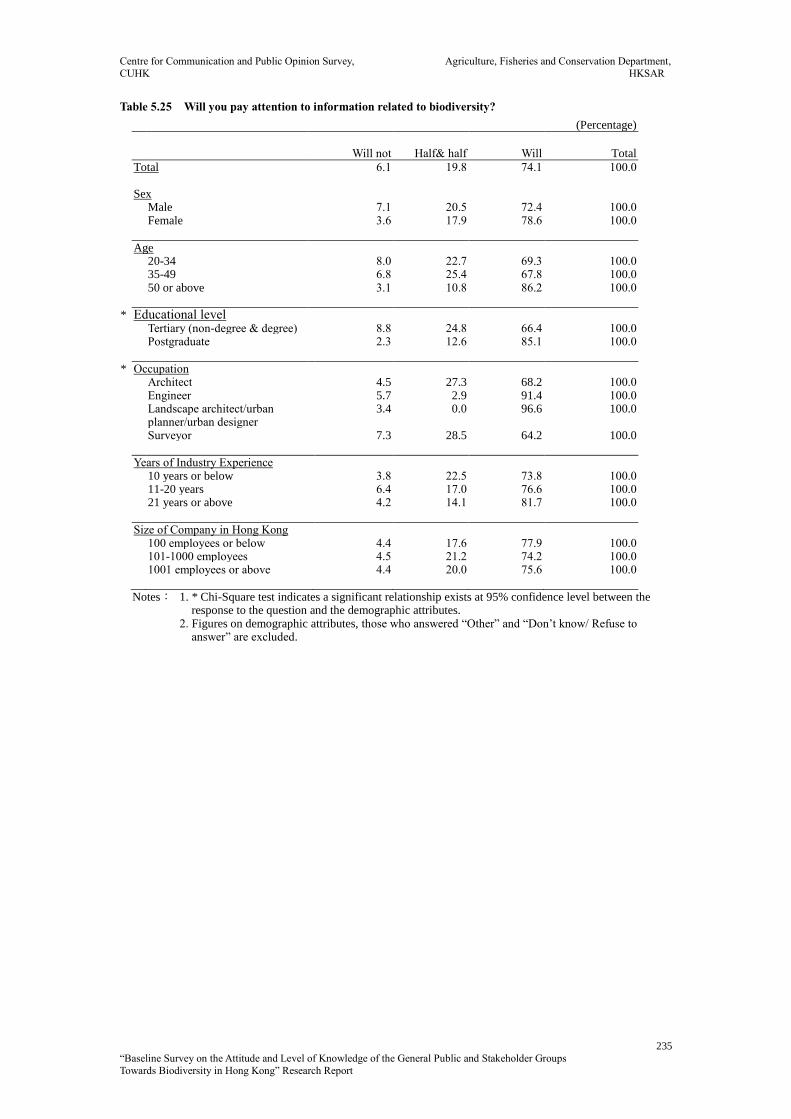
Centre for Communication and Public Opinion Survey, Agriculture, Fisheries and Conservation Department,
CUHK HKSAR
235
“Baseline Survey on the Attitude and Level of Knowledge of the General Public and Stakeholder Groups
Towards Biodiversity in Hong Kong” Research Report
Table 5.25 Will you pay attention to information related to biodiversity?
(Percentage)
Will not Half& half
Will
Total
Total 6.1 19.8 74.1 100.0 Sex Male 7.1 20.5 72.4 100.0 Female 3.6 17.9 78.6 100.0
Age 20-34 8.0 22.7 69.3 100.0 35-49 6.8 25.4 67.8 100.0 50 or above 3.1 10.8 86.2 100.0
* Educational level Tertiary (non-degree & degree) 8.8 24.8 66.4 100.0 Postgraduate 2.3 12.6 85.1 100.0
* Occupation Architect 4.5 27.3 68.2 100.0 Engineer 5.7 2.9 91.4 100.0 Landscape architect/urban
planner/urban designer 3.4 0.0 96.6 100.0
Surveyor 7.3 28.5 64.2 100.0
Years of Industry Experience 10 years or below 3.8 22.5 73.8 100.0 11-20 years 6.4 17.0 76.6 100.0 21 years or above 4.2 14.1 81.7 100.0
Size of Company in Hong Kong 100 employees or below 4.4 17.6 77.9 100.0 101-1000 employees 4.5 21.2 74.2 100.0 1001 employees or above 4.4 20.0 75.6 100.0
Notes: 1. * Chi-Square test indicates a significant relationship exists at 95% confidence level between the response to the question and the demographic attributes.
2. Figures on demographic attributes, those who answered “Other” and “Don’t know/ Refuse to answer” are excluded.
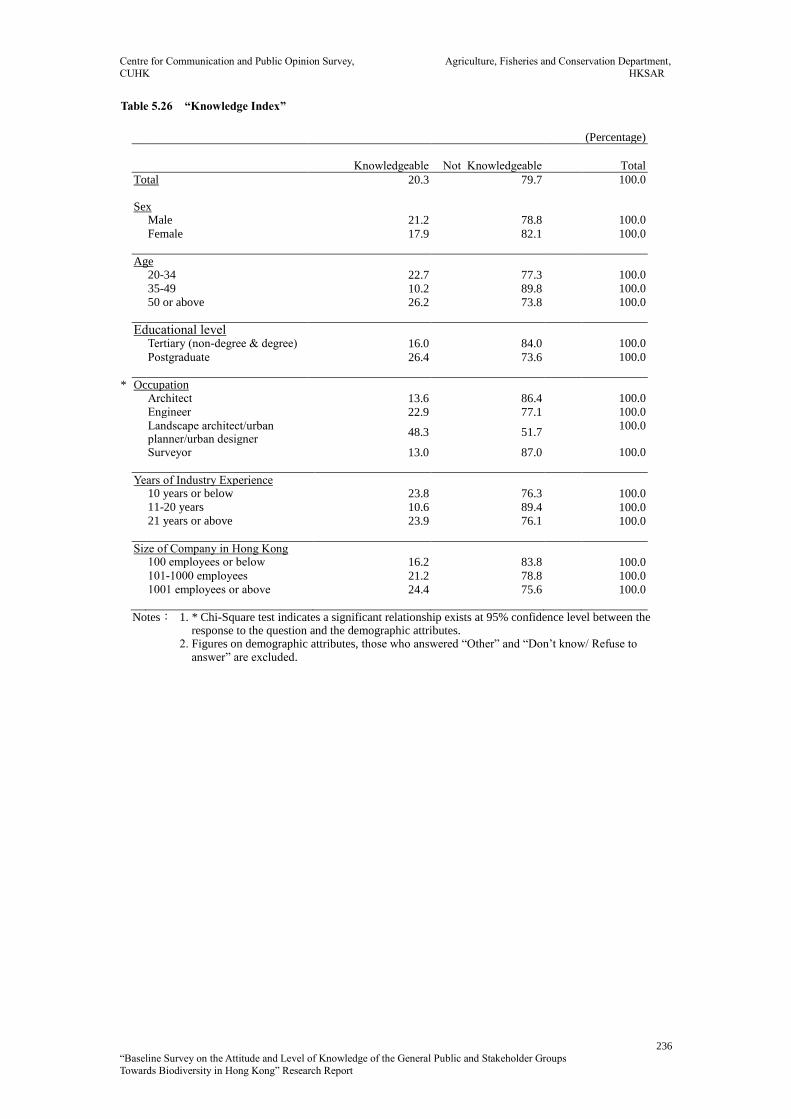
Centre for Communication and Public Opinion Survey, Agriculture, Fisheries and Conservation Department,
CUHK HKSAR
236
“Baseline Survey on the Attitude and Level of Knowledge of the General Public and Stakeholder Groups
Towards Biodiversity in Hong Kong” Research Report
Table 5.26 “Knowledge Index”
(Percentage)
Knowledgeable Not Knowledgeable Total
Total 20.3 79.7 100.0
Sex Male 21.2 78.8 100.0
Female 17.9 82.1 100.0
Age 20-34 22.7 77.3 100.0
35-49 10.2 89.8 100.0
50 or above 26.2 73.8 100.0
Educational level Tertiary (non-degree & degree) 16.0 84.0 100.0
Postgraduate 26.4 73.6 100.0
* Occupation Architect 13.6 86.4 100.0
Engineer 22.9 77.1 100.0
Landscape architect/urban planner/urban designer
48.3 51.7 100.0
Surveyor 13.0 87.0 100.0
Years of Industry Experience 10 years or below 23.8 76.3 100.0 11-20 years 10.6 89.4 100.0 21 years or above 23.9 76.1 100.0
Size of Company in Hong Kong 100 employees or below 16.2 83.8 100.0 101-1000 employees 21.2 78.8 100.0 1001 employees or above 24.4 75.6 100.0
Notes: 1. * Chi-Square test indicates a significant relationship exists at 95% confidence level between the response to the question and the demographic attributes.
2. Figures on demographic attributes, those who answered “Other” and “Don’t know/ Refuse to answer” are excluded.

Centre for Communication and Public Opinion Survey, Agriculture, Fisheries and Conservation Department,
CUHK HKSAR
237
“Baseline Survey on the Attitude and Level of Knowledge of the General Public and Stakeholder Groups
Towards Biodiversity in Hong Kong” Research Report
Table 5.27 “Importance Index”
Mean Sample Size
Total 4.17 212 * Sex Males 4.11 156 Females 4.34 56
Age 20-34 4.23 88 35-49 4.10 59 50 or above 4.16 65
Educational level Tertiary (non-degree & degree) 4.14 125 Postgraduate 4.22 87
* Occupation Architect 4.31 22
Engineer 4.30 35 Landscape architect/urban planner/urban designer 4.47 29 Surveyor 4.04 123
Years of Industry Experience 10 years or below 4.29 80 11-20 years 4.13 47 21 years or above 4.17 71
Size of Company in Hong Kong 100 employees or below 4.35 68 101-1000 employees 4.16 66 1001 employees or above 4.09 45
Notes: 1. * T-test / ANOVA test indicates a significant relationship exists at 95% confidence level between the response to the question and the demographic attributes.
2. Figures on demographic attributes, those who answered “Other” and “Don’t know/ Refuse to answer” are excluded.
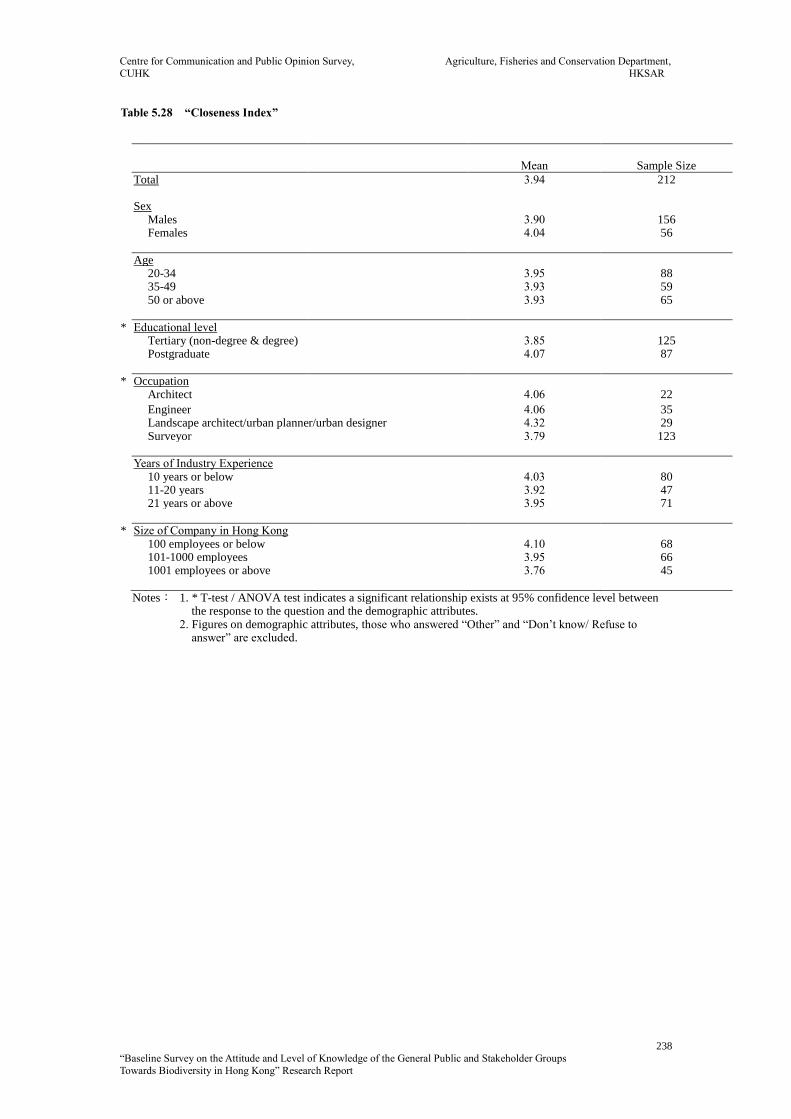
Centre for Communication and Public Opinion Survey, Agriculture, Fisheries and Conservation Department,
CUHK HKSAR
238
“Baseline Survey on the Attitude and Level of Knowledge of the General Public and Stakeholder Groups
Towards Biodiversity in Hong Kong” Research Report
Table 5.28 “Closeness Index”
Mean Sample Size
Total 3.94 212 Sex Males 3.90 156 Females 4.04 56
Age 20-34 3.95 88 35-49 3.93 59 50 or above 3.93 65
* Educational level Tertiary (non-degree & degree) 3.85 125 Postgraduate 4.07 87
* Occupation Architect 4.06 22
Engineer 4.06 35 Landscape architect/urban planner/urban designer 4.32 29 Surveyor 3.79 123
Years of Industry Experience 10 years or below 4.03 80 11-20 years 3.92 47 21 years or above 3.95 71
* Size of Company in Hong Kong 100 employees or below 4.10 68 101-1000 employees 3.95 66 1001 employees or above 3.76 45
Notes: 1. * T-test / ANOVA test indicates a significant relationship exists at 95% confidence level between the response to the question and the demographic attributes.
2. Figures on demographic attributes, those who answered “Other” and “Don’t know/ Refuse to answer” are excluded.

Centre for Communication and Public Opinion Survey, Agriculture, Fisheries and Conservation Department,
CUHK HKSAR
239
“Baseline Survey on the Attitude and Level of Knowledge of the General Public and Stakeholder Groups
Towards Biodiversity in Hong Kong” Research Report
Table 5.29 “Willingness Index”
Mean Sample Size
Total 3.72 212 Sex Males 3.67 156 Females 3.84 56
* Age 20-34 3.59 88 35-49 3.65 59 50 or above 3.94 65
* Educational level Tertiary (non-degree & degree) 3.61 125 Postgraduate 3.87 87
* Occupation Architect 3.75 22
Engineer 4.15 35 Landscape architect/urban planner/urban designer 4.13 29 Surveyor 3.48 123
Years of Industry Experience 10 years or below 3.71 80 11-20 years 3.67 47 21 years or above 3.88 71
* Size of Company in Hong Kong 100 employees or below 3.90 68 101-1000 employees 3.61 66 1001 employees or above 3.66 45
Notes: 1. * T-test / ANOVA test indicates a significant relationship exists at 95% confidence level between the response to the question and the demographic attributes.
2. Figures on demographic attributes, those who answered “Other” and “Don’t know/ Refuse to answer” are excluded.
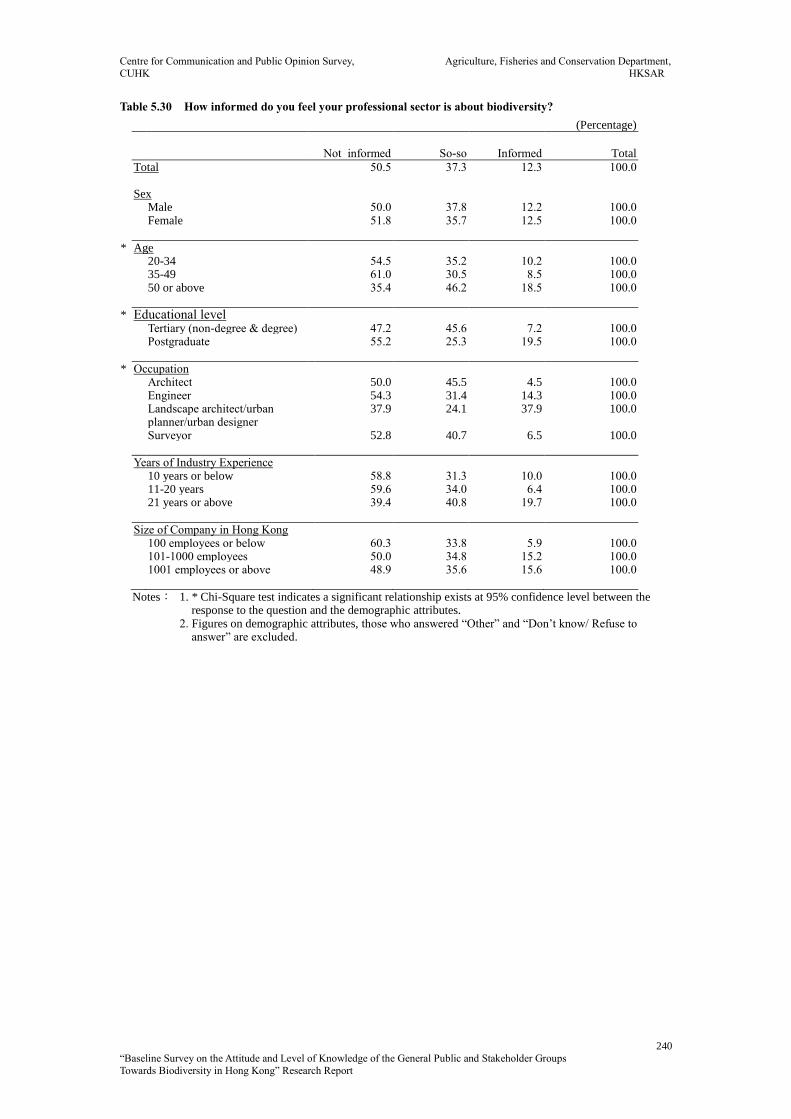
Centre for Communication and Public Opinion Survey, Agriculture, Fisheries and Conservation Department,
CUHK HKSAR
240
“Baseline Survey on the Attitude and Level of Knowledge of the General Public and Stakeholder Groups
Towards Biodiversity in Hong Kong” Research Report
Table 5.30 How informed do you feel your professional sector is about biodiversity?
(Percentage)
Not informed So-so
Informed
Total
Total 50.5 37.3 12.3 100.0 Sex Male 50.0 37.8 12.2 100.0 Female 51.8 35.7 12.5 100.0
* Age 20-34 54.5 35.2 10.2 100.0 35-49 61.0 30.5 8.5 100.0 50 or above 35.4 46.2 18.5 100.0
* Educational level Tertiary (non-degree & degree) 47.2 45.6 7.2 100.0 Postgraduate 55.2 25.3 19.5 100.0
* Occupation Architect 50.0 45.5 4.5 100.0 Engineer 54.3 31.4 14.3 100.0 Landscape architect/urban
planner/urban designer 37.9 24.1 37.9 100.0
Surveyor 52.8 40.7 6.5 100.0
Years of Industry Experience 10 years or below 58.8 31.3 10.0 100.0 11-20 years 59.6 34.0 6.4 100.0 21 years or above 39.4 40.8 19.7 100.0
Size of Company in Hong Kong 100 employees or below 60.3 33.8 5.9 100.0 101-1000 employees 50.0 34.8 15.2 100.0 1001 employees or above 48.9 35.6 15.6 100.0
Notes: 1. * Chi-Square test indicates a significant relationship exists at 95% confidence level between the response to the question and the demographic attributes.
2. Figures on demographic attributes, those who answered “Other” and “Don’t know/ Refuse to answer” are excluded.

Centre for Communication and Public Opinion Survey, Agriculture, Fisheries and Conservation Department,
CUHK HKSAR
241
“Baseline Survey on the Attitude and Level of Knowledge of the General Public and Stakeholder Groups
Towards Biodiversity in Hong Kong” Research Report
Table 5.31 How much does your professional sector value biodiversity conservation?
(Percentage)
Not Valued So-so
Valued
Total
Total 43.4 38.7 17.9 100.0 Sex Male 46.2 35.9 17.9 100.0 Female 35.7 46.4 17.9 100.0
* Age 20-34 56.8 34.1 9.1 100.0 35-49 47.5 37.3 15.3 100.0 50 or above 21.5 46.2 32.3 100.0
Educational level Tertiary (non-degree & degree) 45.6 41.6 12.8 100.0 Postgraduate 40.2 34.5 25.3 100.0
* Occupation Architect 40.9 40.9 18.2 100.0 Engineer 45.7 40.0 14.3 100.0 Landscape architect/urban
planner/urban designer 10.3 37.9 51.7 100.0
Surveyor 52.0 37.4 10.6 100.0
* Years of Industry Experience 10 years or below 53.8 36.3 10.0 100.0 11-20 years 48.9 38.3 12.8 100.0 21 years or above 26.8 40.8 32.4 100.0
Size of Company in Hong Kong 100 employees or below 45.6 39.7 14.7 100.0 101-1000 employees 43.9 33.3 22.7 100.0 1001 employees or above 48.9 35.6 15.6 100.0
Notes: 1. * Chi-Square test indicates a significant relationship exists at 95% confidence level between the response to the question and the demographic attributes.
2. Figures on demographic attributes, those who answered “Other” and “Don’t know/ Refuse to answer” are excluded.
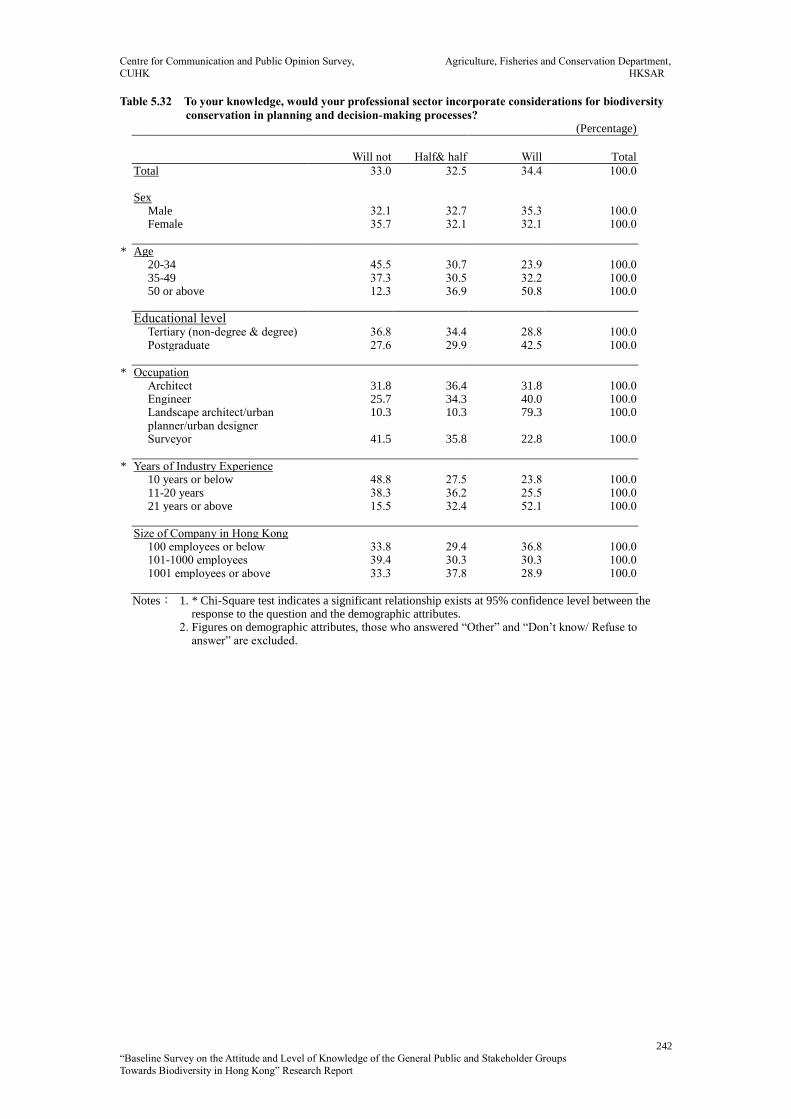
Centre for Communication and Public Opinion Survey, Agriculture, Fisheries and Conservation Department,
CUHK HKSAR
242
“Baseline Survey on the Attitude and Level of Knowledge of the General Public and Stakeholder Groups
Towards Biodiversity in Hong Kong” Research Report
Table 5.32 To your knowledge, would your professional sector incorporate considerations for biodiversity
conservation in planning and decision-making processes? (Percentage)
Will not Half& half
Will
Total
Total 33.0 32.5 34.4 100.0 Sex Male 32.1 32.7 35.3 100.0 Female 35.7 32.1 32.1 100.0
* Age 20-34 45.5 30.7 23.9 100.0 35-49 37.3 30.5 32.2 100.0 50 or above 12.3 36.9 50.8 100.0
Educational level Tertiary (non-degree & degree) 36.8 34.4 28.8 100.0 Postgraduate 27.6 29.9 42.5 100.0
* Occupation Architect 31.8 36.4 31.8 100.0 Engineer 25.7 34.3 40.0 100.0 Landscape architect/urban
planner/urban designer 10.3 10.3 79.3 100.0
Surveyor 41.5 35.8 22.8 100.0
* Years of Industry Experience 10 years or below 48.8 27.5 23.8 100.0 11-20 years 38.3 36.2 25.5 100.0 21 years or above 15.5 32.4 52.1 100.0
Size of Company in Hong Kong 100 employees or below 33.8 29.4 36.8 100.0 101-1000 employees 39.4 30.3 30.3 100.0 1001 employees or above 33.3 37.8 28.9 100.0
Notes: 1. * Chi-Square test indicates a significant relationship exists at 95% confidence level between the response to the question and the demographic attributes.
2. Figures on demographic attributes, those who answered “Other” and “Don’t know/ Refuse to answer” are excluded.
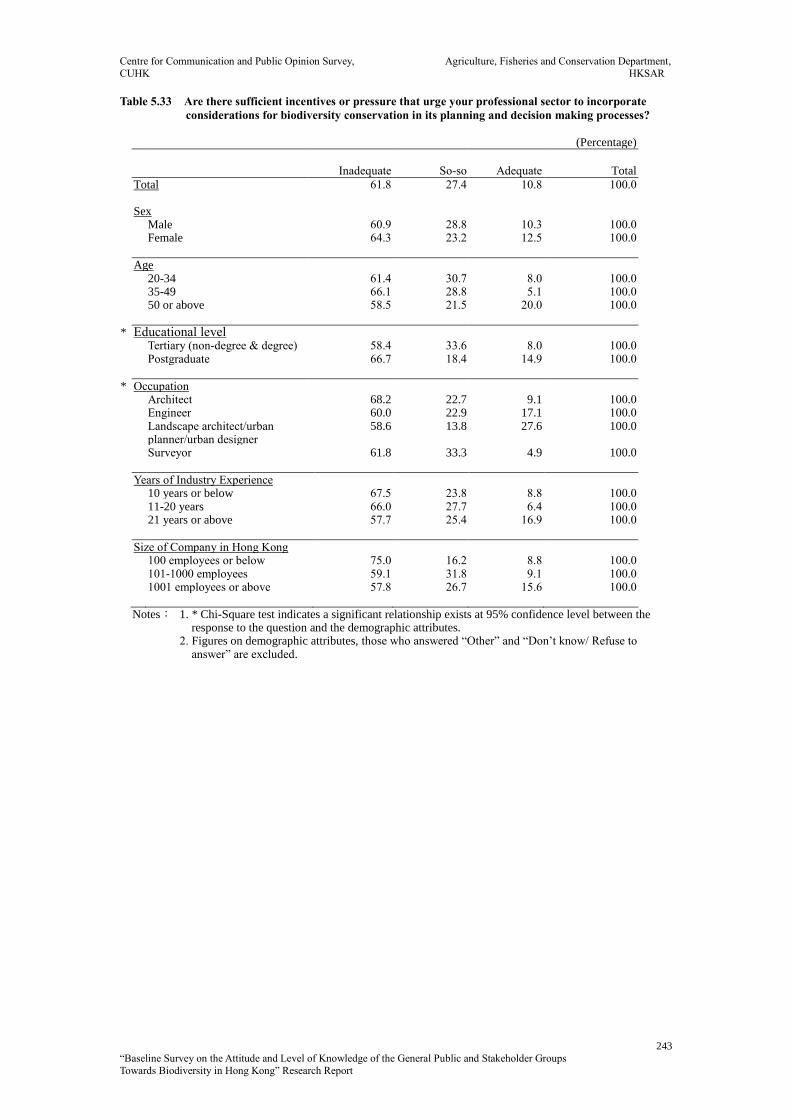
Centre for Communication and Public Opinion Survey, Agriculture, Fisheries and Conservation Department,
CUHK HKSAR
243
“Baseline Survey on the Attitude and Level of Knowledge of the General Public and Stakeholder Groups
Towards Biodiversity in Hong Kong” Research Report
Table 5.33 Are there sufficient incentives or pressure that urge your professional sector to incorporate
considerations for biodiversity conservation in its planning and decision making processes?
(Percentage)
Inadequate So-so
Adequate
Total
Total 61.8 27.4 10.8 100.0 Sex Male 60.9 28.8 10.3 100.0 Female 64.3 23.2 12.5 100.0
Age 20-34 61.4 30.7 8.0 100.0 35-49 66.1 28.8 5.1 100.0 50 or above 58.5 21.5 20.0 100.0
* Educational level Tertiary (non-degree & degree) 58.4 33.6 8.0 100.0 Postgraduate 66.7 18.4 14.9 100.0
* Occupation Architect 68.2 22.7 9.1 100.0 Engineer 60.0 22.9 17.1 100.0 Landscape architect/urban
planner/urban designer 58.6 13.8 27.6 100.0
Surveyor 61.8 33.3 4.9 100.0
Years of Industry Experience 10 years or below 67.5 23.8 8.8 100.0 11-20 years 66.0 27.7 6.4 100.0 21 years or above 57.7 25.4 16.9 100.0
Size of Company in Hong Kong 100 employees or below 75.0 16.2 8.8 100.0 101-1000 employees 59.1 31.8 9.1 100.0 1001 employees or above 57.8 26.7 15.6 100.0
Notes: 1. * Chi-Square test indicates a significant relationship exists at 95% confidence level between the response to the question and the demographic attributes.
2. Figures on demographic attributes, those who answered “Other” and “Don’t know/ Refuse to answer” are excluded.
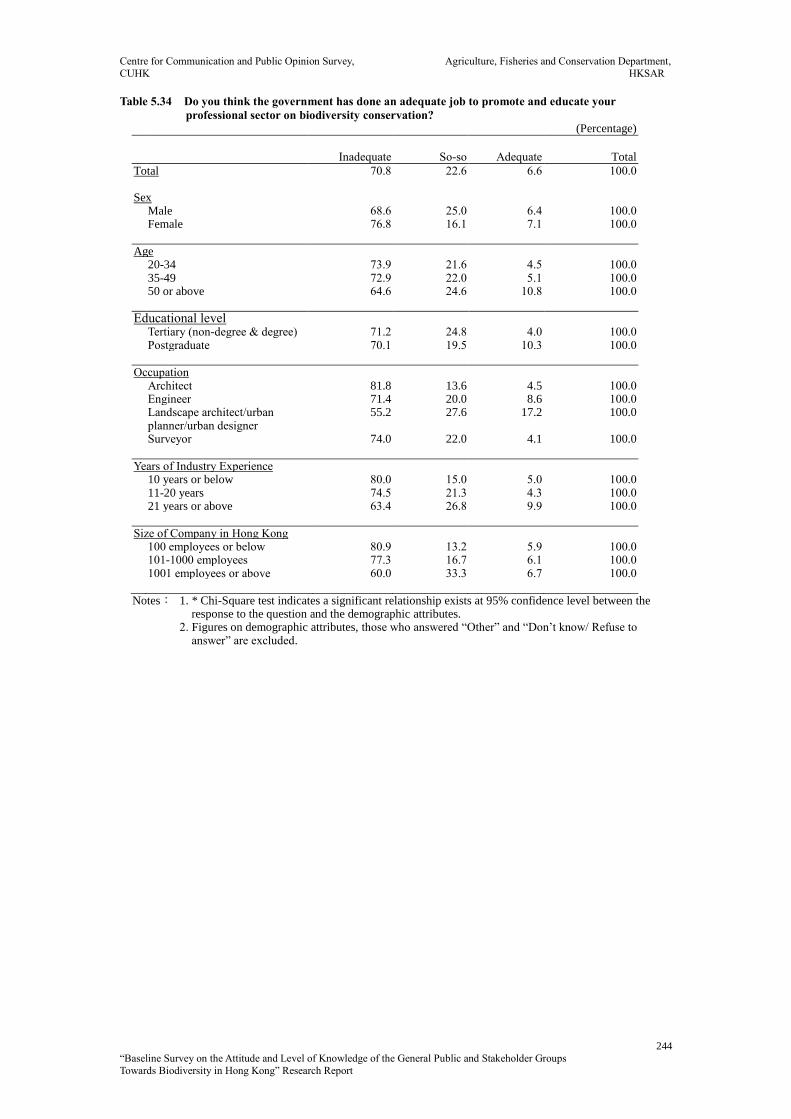
Centre for Communication and Public Opinion Survey, Agriculture, Fisheries and Conservation Department,
CUHK HKSAR
244
“Baseline Survey on the Attitude and Level of Knowledge of the General Public and Stakeholder Groups
Towards Biodiversity in Hong Kong” Research Report
Table 5.34 Do you think the government has done an adequate job to promote and educate your
professional sector on biodiversity conservation? (Percentage)
Inadequate So-so
Adequate
Total
Total 70.8 22.6 6.6 100.0 Sex Male 68.6 25.0 6.4 100.0 Female 76.8 16.1 7.1 100.0
Age 20-34 73.9 21.6 4.5 100.0 35-49 72.9 22.0 5.1 100.0 50 or above 64.6 24.6 10.8 100.0
Educational level Tertiary (non-degree & degree) 71.2 24.8 4.0 100.0 Postgraduate 70.1 19.5 10.3 100.0
Occupation Architect 81.8 13.6 4.5 100.0 Engineer 71.4 20.0 8.6 100.0 Landscape architect/urban
planner/urban designer 55.2 27.6 17.2 100.0
Surveyor 74.0 22.0 4.1 100.0
Years of Industry Experience 10 years or below 80.0 15.0 5.0 100.0 11-20 years 74.5 21.3 4.3 100.0 21 years or above 63.4 26.8 9.9 100.0
Size of Company in Hong Kong 100 employees or below 80.9 13.2 5.9 100.0 101-1000 employees 77.3 16.7 6.1 100.0 1001 employees or above 60.0 33.3 6.7 100.0
Notes: 1. * Chi-Square test indicates a significant relationship exists at 95% confidence level between the response to the question and the demographic attributes.
2. Figures on demographic attributes, those who answered “Other” and “Don’t know/ Refuse to answer” are excluded.
Centre for Communication and Public Opinion Survey, Agriculture, Fisheries and Conservation Department,
CUHK HKSAR
245
“Baseline Survey on the Attitude and Level of Knowledge of the General Public and Stakeholder Groups
Towards Biodiversity in Hong Kong” Research Report
Appendix 4
Full Focus Group Discussion Findings
Centre for Communication and Public Opinion Survey, Agriculture, Fisheries and Conservation Department,
CUHK HKSAR
246
“Baseline Survey on the Attitude and Level of Knowledge of the General Public and Stakeholder Groups
Towards Biodiversity in Hong Kong” Research Report
General Public
I. 對生物多樣性的認識
約一半參與者表示聽過生物多樣性,他們主要從三個途徑得知:
媒體,包括新聞報導、電視或電台新聞或節目、紀錄片和社交媒體等。
學校教育,主要是中學生物科的課程內容。
參與環保或自然相關的活動,例如擔任環保組織義工、到訪濕地公園
或自然保護區等。
在聽過生物多樣性的參與者中,大部份主動表示對這個概念認識不深。
在生物多樣性的三個層面中,參與者最熟識物種多樣性,除了因為這
個概念較普遍地得到介紹外,亦因為市民較容易從生物多樣性的字面
上聯想和理解與物種的關連。
至於生態系統多樣性,部份參與者表示認識,部份表示不知道,主要
因為他們沒有聽過,同時因為他們對「生物多樣性」的認知停留在物
種上,故未能把生態環境聯繫到此概念上。
市民對遺傳多樣性最為陌生,若沒有主持人的介紹,大部份參與者事
前完全沒有聽過,他們表示此概念較少被提及和介紹。另外,雖然「遺
傳多樣性」與物種有關,但他們較少關注同一物種之間的差異。
參與者對於生物多樣性三個層面的認知程度,也能反映他們對這概念
的認識較為淺薄和片面。
II. 對生物多樣性的態度
a. 個人對生物多樣性的關心程度
大部份參與者表示關心生物多樣性,他們關心的原因如下:
珍惜自然環境
Centre for Communication and Public Opinion Survey, Agriculture, Fisheries and Conservation Department,
CUHK HKSAR
247
“Baseline Survey on the Attitude and Level of Knowledge of the General Public and Stakeholder Groups
Towards Biodiversity in Hong Kong” Research Report
參與者有感城市發展影響生態環境,以香港為例,香港多高樓大廈,
有石屎森林之稱,自然環境或綠化帶逐漸減少,認為需要在城市發展
與生態環境之間取得平衡,並避免情況惡化。有參與者表示若因為城
市發展而犧牲生態平衡,是一種倒退的表現。
他們對生態環境的重視源自於它是市民日常生活的一部份,例如不少
參與者表示自然環境或景觀對城市生活有調劑作用,能夠令人感覺放
鬆及改善心情,亦有助舒緩城市人的壓力,影響身心健康。
影響生活質素
參與者表示生態系統環環相扣,互相影響,無論是物種或生態環境的
減少,最終也會影響到人類。較多人舉例指出生物多樣性對空氣和氣
候的影響,例如樹林減少令空氣變差,也令溫度上升,帶來極端天氣,
如颱風的增加。
此外,氣候的變化同時影響食物的生長情況,從而影響食物的供應和
質素。物種多樣性的減少也直接影響食物的選擇。
有參與者更表示生物多樣性是顯示一個地方的生活環境質素的指標。
不希望物種消失,甚至絕種
參與者有感現時不少物種在日常生活中消失,能夠接觸到它們的機會
愈來愈少,也留意到部份物種,例如中華白海豚,面臨絕種的情況,
他們不希望這種事情發生。
他們除了感到這是一種損失外,也為下一代失去認識和接觸這些物種
的機會而感到可惜。
個別參與者表示不太關心生物多樣性,原因如下:
Centre for Communication and Public Opinion Survey, Agriculture, Fisheries and Conservation Department,
CUHK HKSAR
248
“Baseline Survey on the Attitude and Level of Knowledge of the General Public and Stakeholder Groups
Towards Biodiversity in Hong Kong” Research Report
他們表示居住於城市,平日親身接觸大自然的機會少,有感生物多樣
性與自己的生活沒有太大關連。
另外,有參與者認為關心也是徒然,因為政府主導城市規劃,普通市
民事前獲得的資訊不多,也無法參與和改變有關計劃,小至區內的伐
樹決定,大至龍尾灘和人工島工程,市民都沒有主導權。縱使知道生
態環境正受到破壞,一般市民也無力改變,繼而變得漠視。
b. 生物多樣性與個人生活的緊密性
大部份參與者認為生物多樣性流失對個人生活沒有太大即時和直接的影
響,儘管他們明白生物多樣性與生活息息相關。
參與者指出香港是發達城市,以食物選擇為例,食物亦是入口為主,
市民較難感受到生物多樣性流失引致的食物問題。
另外,有參與者表示生物多樣性流失或會影響生活質素,例如影響空
氣和食水質素、食物選擇、氣候情況等,然而,這些改變需要長時間
後才會發生,他們目前還沒有感受到實質的改變和對其生活的影響。
少部份參與者雖然對生物多樣性流失對個人生活造成的影響沒有強烈感
受,但他們認為生物多樣性流失對社會有即時和密切的影響。
有參與者指生物多樣性流失影響食物的供應,從而影響食物的價格和
質素,例如魚獲減少而令價格提升,或者改以人工養殖方式令質素下
降,這些現時已經直接影響市民的生活。
另外,現時全球持續升溫,香港高溫的日子增加,市民已經能夠感受
生物多樣性流失導致氣候的變化。此外,生物多樣性流失影響空氣質
素和城市景觀,這些也是短時間內能夠感受到的影響。
雖然參與者對生物多樣性流失對個人生活的影響有不同看法,但他們一致
認同生物多樣性流失對下一代生活環境將會造成重大影響。參與者理解到

Centre for Communication and Public Opinion Survey, Agriculture, Fisheries and Conservation Department,
CUHK HKSAR
249
“Baseline Survey on the Attitude and Level of Knowledge of the General Public and Stakeholder Groups
Towards Biodiversity in Hong Kong” Research Report
生物多樣性流失對生活環境有著長遠的影響,認為這將會危害到下一代的
生活環境和質素,而表示關注和憂慮。
c. 保護生物多樣性的個人意願
不少參與者會留意自己的生活習慣會否破壞環境,並主動改變生活方式以
減少破壞。
他們具體的生活實踐包括:家居源頭減廢、垃圾分類及回收、自備水
樽和環保袋、減少使用飲筒,減少開冷氣、主動留意產品成份並減少
使用對環境有害的產品,例如髮膠,購買有機食物等。
他們也會主動教育親友,鼓勵他們為環境出一份力,也有參與者參加
有關環保的義工活動,活動包括除草、執垃圾等。
然而,絕大多數市民是重視環保,為了保護環境多於是直接為了保護
生物多樣性。相比起「環保,參與者保護生物多樣性的觀念較弱,有
市民表示不知道如何直接保護生物多樣性,所想到的建議僅有減少摸
蜆及停止放生行為。
參與者對保護生物多樣性較弱的意識,與他們對此概念並不熟識和了
解有關,正如上述所言,近半參與者沒有聽過生物多樣性,而聽過的
參與者的認識也不足。
個別參與者沒有主動做一些保護生物多樣性或環保的行為,例如不會自備
環保袋或做垃圾分類。
主要因為「貪方便」。
除了是個人懶惰的心態外,他們也認為香港急速的生活節奏,令人更
加傾向以便利為主。
另一方面,相比起大企業或城市發展,他們認為個人行為對「生物多
樣性」的影響和破壞有限,尤其是遺傳及物種多樣性兩方面。有參與
Centre for Communication and Public Opinion Survey, Agriculture, Fisheries and Conservation Department,
CUHK HKSAR
250
“Baseline Survey on the Attitude and Level of Knowledge of the General Public and Stakeholder Groups
Towards Biodiversity in Hong Kong” Research Report
者明言雖然知道每個人出一分力都可構成改變的道理,但若大企業或
政府沒有行動,個人的行動只不過是杯水車薪,作用不大,也容易成
為不作改變的藉口。
香港的城市生活模式並不支持和便利市民實踐保育行為。
部份參與者指出,香港商業社會追求便利和效率,其運作模式牽涉很
多不考慮保護環境的細節,例如多數餐廳的外賣會將即棄餐具包裹在
內,超級市場貨品有多重不必要的包裝等。即將市民有心,在日常消
費中也難以經常作出保護生物多樣性的行動。
d. 不同組別參與者之比較
如在研究方法部分(2.3.1 部分)所述,本研究是設有三組針對公眾的焦
點小組。這是根據在電話調查中,受訪者回答有關保護生物多樣性的重要
性的分數,將焦點小組參與者劃分為「高」、「中」、「低」三組。
焦點小組結果發現,這三組參與者對保護生物多樣性的態度,分別不太
大。如上所述,大部分參與者都表示關心生物多樣性,並認為保護生物多
樣性對個人和社會整體而言都是重要的。但不同組別之間是有少許些微差
別:
上述提到,有一小部分參與者表示不太關心生物多樣性,和不太願意
在日常生活中著力保護生物多樣性(因貪圖生活便利)。這少數參與
者主要是來自低分組別。
相對於低分組別,中、高分組別的參與者會更關心生物多樣性。當中,
高分組別的參與者尤其會留意自己的生活習慣會否影響生物多樣
性。同時,他們會更願意主動改變生活方式以減少破壞環境(如棄用
會影響生物多樣性的產品),和主動參與環保活動(如當義工)。
Centre for Communication and Public Opinion Survey, Agriculture, Fisheries and Conservation Department,
CUHK HKSAR
251
“Baseline Survey on the Attitude and Level of Knowledge of the General Public and Stakeholder Groups
Towards Biodiversity in Hong Kong” Research Report
III. 生物多樣性的社會重要性
整體社會對生物多樣性的態度
就市民而言:
部份參與者認為大多數香港市民普遍環保和保育意識不高,較以個人
方便和享受為主;
部份參與者認為近年市民的環保或保育意識已有所提高,現時不少人
也會自發地實踐環保,例如普遍會自備環保袋。另外,近年推出了一
些環保政策,例如膠袋稅、垃圾徵稅等,促進了社會的討論和增加了
市民對保育方面的關注。而且社交媒體的盛行令市民更容易接收有關
環境保育的資訊,近年南生圍和港珠澳大橋涉及環境保育的事件,均
引起不少關注。
有參與者認為市民對保育的重視程度或有年齡或世代分野,年長者較
認為生物多樣性與自己無關,因而視之不重要;而年青人則較多機
會、途徑接觸相關知識,所以較為重視。
可是,整體而言,參與者傾向同意香港市民的環保和保育意識並不
高,尤其在實踐方面。
就香港政府而言:
大部份參與者認為政府不重視保育,多屆政府均側重經濟和城市發
展,甚至為此犧牲生態環境,例如興建三跑而破壞中華白海豚的棲息
地、發展龍尾灘而搬遷當地物種、建議在郊野公園興建房屋等。
另有參與者指出政府在實施環保政策方面的決心不足,例如減排、禁
用柴油車輛而轉為石油氣車輛及電動車等,均沒有進展。
少部份參與者認為現時政府較以往重視多了環境保育,表示環境保育
作為全球發展趨勢,香港政府需要跟上國際步伐,而政府近年確實推
行了不少大型的環保政策,有參與者贊同政府有關的工作和成效。
Centre for Communication and Public Opinion Survey, Agriculture, Fisheries and Conservation Department,
CUHK HKSAR
252
“Baseline Survey on the Attitude and Level of Knowledge of the General Public and Stakeholder Groups
Towards Biodiversity in Hong Kong” Research Report
經濟發展和保護生物多樣性之間的關係
大部份參與者同意城市發展的需要,尤其現時市民住屋需求大,房屋供應
不足的問題需要解決,然而,參與者對為了經濟發展是否需要犧牲保護「生
物多樣性」,以開發土地興建房屋為例,有不同的看法:
大部份參與者不傾向發展郊野公園,他們認為有其他替代方法解決土
地和房屋問題,例如可以利用棕土和空置大廈,儘管有關方法可能較
為耗時或成本較大,但他們仍然願意以此換取郊野公園不被開發,維
持完整的生態環境。
少部份參與者(主要來自低分組別)則不反對發展郊野公園,認為住
屋是人的基本需要,較環境保育重要,即使令自然環境有一定程度的
犧牲也在所難免。而個別參與者表示香港郊野公園面積大,若根據生
態價值的高低而決定是否發展,對生態環境的破壞有限。
參與者一致地希望經濟發展和保護生物多樣性兩者能夠共存。
他們認同保育生物多樣性對社會以及個人日常生活也是十分重要。
大部份參與者認為香港作為經濟發達城市,只要有決心,香港是有條
件和能力令兩者取得平衡,若萬一影響到生態環境,亦有能力可以把
傷害減到最低或事後作出最好的補救。
然而,少部份參與者對兩者共存並不樂觀,指出現時不論是政府或商
界都強調發展,加上整個香港社會的風氣、主流大眾的心態也較注重
發展和經濟效益,容易犧牲生態環境。
社會對保護生物多樣性的責任
大部分受訪市民認為,市民、商界和政府三方面都有責任保護生物多樣
性,然而,政府當中的角色最重要,因為政府對前兩者能起推動的作用:
政府與市民:
Centre for Communication and Public Opinion Survey, Agriculture, Fisheries and Conservation Department,
CUHK HKSAR
253
“Baseline Survey on the Attitude and Level of Knowledge of the General Public and Stakeholder Groups
Towards Biodiversity in Hong Kong” Research Report
政府可以透過宣傳和教育提升市民的保育意識,以減少破壞生態環境
的行為。有參與者更指出若市民整體保育意識提高,社會風氣更重視
保育,這能令以市場為導向的商界因社會氛圍和需要的改變而變更其
運用模式,令環境破壞減少。然而,參與者認為現時政府有關方面的
工作未如理想。首先,有參與者學校教育的課程流於表面,成效不大;
其次,不少參與者表示,他們和身邊的親友都沒有聽過生物多樣性,
這顯示政府的宣傳不足。
政府可以透過立法規管破壞生態環境的行為。有參與者認為在保育方
面,香港政府可以效法新加坡,修訂法例讓市民遵守,客觀上能夠令
保育意識不高的市民,也不會做出破壞生態環境的行為。
政府與商界:
參與者認為商界以商業利益為先,是破壞生態環境的重大元兇,政府
應積極與商界磋商,有需要時甚至可以加以規管和限制,以減低他們
對環境的破壞。
政府也可以與商界加強溝通和合作,甚至提供誘因,令商界為環保出
力,例如減少用電,舉辦無飲筒日等。商界對社會有重大影響力,他
們對保育的投入和參與,能令成效大大提高,但這需要政府努力促成。
參與者就著政府對生物多樣性的推廣不足,提出以下建議:
透過學校教育令新一代及早了解生物多樣性,例如在小學已經開始學
習有關知識,自小灌輸有關概念。另外,學校課程需要有體驗式環節,
增加學生接觸大自然的機會,從而更能體會保育的重要性。
舉辦一些與環境保育相關的免費活動,例如到訪郊野公園,並以導賞
團的形式向市民親身介紹本地的生態環境,加深他們的興趣和認識。
此外,加強宣傳郊野公園,鼓勵市民多接觸大自然也有同樣的效果。
Centre for Communication and Public Opinion Survey, Agriculture, Fisheries and Conservation Department,
CUHK HKSAR
254
“Baseline Survey on the Attitude and Level of Knowledge of the General Public and Stakeholder Groups
Towards Biodiversity in Hong Kong” Research Report
加強大眾媒體宣傳,參與者建議可以透過電視節目和社交媒體進行推
廣。另外,有參與者指出,政府已經製作了不少宣傳短片,但吸引力
欠奉,參與者在內容方面有兩點:第一,向市民說明有關香港「生物
多樣性」的概況,譬如香港具體有多少物種,有助市民了解「生物多
樣性」此抽象概念。第二,向市民說明生物多樣性與個人的關係,從
而令市民自覺有保護「生物多樣性」的責任。
Centre for Communication and Public Opinion Survey, Agriculture, Fisheries and Conservation Department,
CUHK HKSAR
255
“Baseline Survey on the Attitude and Level of Knowledge of the General Public and Stakeholder Groups
Towards Biodiversity in Hong Kong” Research Report
Secondary School Teachers
I. 中學對教授生物多樣性的重視程度
參與者表示,現時中學課程的相關科目,有教授生物多樣性,所以學生對相
關議題有一定程度的涉獵。但普遍來說,學校談不上十分重視教授生物多樣
性。原因如下:
受課程局限
首先,參與者指出,生物多樣性議題在現有中學課程中出現定位的問題。
相關議題主要局限在地理科和生物科,其他科目如通識科或公民教育科
就未必會觸及。若果一些學校的地理科和生物科規模比較少,甚至不設
這兩科,那這議題就會石沉大海。
有參與者指出,就算在最相關的生物科,現時初中和高中生物科課程裡,
只有少部分章節觸及到生物多樣性的知識。例如,有學校教授環保議題
時,主要集中在生活上的環保實踐,如廢紙和固體廢物回收等,課程並
無特別獨立教授生物多樣性。
不過,有參與者也指出,現時每間學校都應設有環保組,集合相關科目
的老師統籌有關環保議題的課程和活動,當中或多或少會涉獵到生物多
樣性這個議題。例如,每年學校都會舉辦一些環保講座,主題亦有包括
生物多樣性。
取決於校長的態度
除了政府課程基本要求外,生物多樣性是否受學校重視,端視乎校長的
個人取態。若果校長本身是生物科或其他相關專科出身的,則會比較重
視推動這個議題。
不過,就算校長關心,以參與者觀察,對很多學校而言,生物多樣性往
往不是要急切推動的議題。
Centre for Communication and Public Opinion Survey, Agriculture, Fisheries and Conservation Department,
CUHK HKSAR
256
“Baseline Survey on the Attitude and Level of Knowledge of the General Public and Stakeholder Groups
Towards Biodiversity in Hong Kong” Research Report
沒有足夠老師認識生物多樣性
參與者認為,現時中學並沒有足夠老師認識生物多樣性。除了專科老師,
很難要求其他科目的老師認識。一些非專科老師對生物多樣性有認識,
只是踫巧他們個人對這議題有興趣而已。
一些參與者也坦言,就算身為專科老師,也未必談得上對生物多樣性有
很深入的認識。他們指出,自己的生物知識主要來自大學教育,而知識
比較停留在理論層面。他們舉例,當自己負責帶領戶外參觀活動時,往
往要靠生態專家從旁協助講解。參與者認爲困難在於要有效地向學生教
授生物多樣性的重要性,不能只簡單介紹香港有哪些物種和這些物種有
何特別,而是要進一步向學生解釋這些物種消失對他們有何影響,這是
需要專業知識的。
另外,參與者稱,老師工作十分繁忙,很難額外花時間鑽研一些課程和
考試範圍以外的知識,局限了自己對生物多樣性的了解。
II. 對生物多樣性課程成效和教材的意見
就現有生物多樣性的課程和教材,參與者有以下意見:
對生物多樣性教材的意見
參與者主要依賴出版社和網上資訊作為教材,認為坊間現時缺乏豐富和
有系統的生物多樣性教材套。
一些參與者知道漁護署有提供相關資源,但有些卻不太清楚。例如,有
一名參與者因最近剛巧在校內要籌辦有關生態旅遊的活動,才知悉漁護
署建立了一個豐富的生物數據庫。若非主動搜尋,否則不會知道。
對生物多樣性課程成效的意見
當被問及現有課程能否提升學生的保育意識,參與者有不同意見。有些
參與者認為,課程或多或少能夠提升學生的認知和興趣。就算只是在課

Centre for Communication and Public Opinion Survey, Agriculture, Fisheries and Conservation Department,
CUHK HKSAR
257
“Baseline Survey on the Attitude and Level of Knowledge of the General Public and Stakeholder Groups
Towards Biodiversity in Hong Kong” Research Report
程中輕輕帶過相關內容,也至少會啟發到學生。學生開了眼界後,若感
興趣,日後自己會再鑽研下去。
但亦有若干參與者就比較悲觀。他們認為,學生吸收課堂知識,主要是
為應付考試,過一段時間就會忘記內容。
III. 中學舉辦生物多樣性活動的情況和困難
上述提到,部分參與者對課程能否提升到學生的保育意識有不同見解。姑勿
論成效如何,他們都普遍認為,單靠課程和課本去教授生物多樣性,只屬紙
上談兵,難以達致最佳教學效果。
因此,他們認為將生物多樣性這個議題連繫到生活至為關鍵。這能夠讓學生
親身了解環境和生活的密切關係,建立他們對生物欣賞的情誼。有見及此,
一些參與者的學校建立了温室和有機農地,讓環保議題融入學生日常生活當
中。偶爾,他們也會舉行講座,邀請校外專業人士向學生介紹課本外的環保
生態議題。
然而,他們一致認為,最有效的方法是舉辦戶外活動,讓老師帶領學生親身
感受大自然環境和近距離觀看動植物。雖然戶外活動被認為是最有效的教學
方法,但這往往也是令老師最卻步的活動。參與者提出以下各樣舉辦戶外活
動的局限和困難:
參與校外活動,因校而異
首先,參與者指出,在香港中學文憑生物科課程下,校外體驗是非必須
的教學活動。故不是每間學校會主動參與或自行籌辦。但一些學校為了
滿足「校本評核」(school-based assessment)制度的要求,每年都有舉辦
相關活動。
參與者解釋,學校經常收到很多坊間生態導賞活動的邀請和推廣資訊。
有些老師比較熱心,就會多安排學生參與,但有些老師工作比較繁忙,
Centre for Communication and Public Opinion Survey, Agriculture, Fisheries and Conservation Department,
CUHK HKSAR
258
“Baseline Survey on the Attitude and Level of Knowledge of the General Public and Stakeholder Groups
Towards Biodiversity in Hong Kong” Research Report
就未必願意參與太多。
缺乏足夠人手和資源
另一個阻礙老師舉辦戶外活動的原因是缺乏足夠人手。由於學校只有少
數老師熟悉生物多樣性,不能將所有外出帶團的責任推給他們,因他們
和其他老師一樣都有很多公務在身。另外,根據教育局指引,學校進行
戶外活動時,師生比例最低限度需達到 1:20,即比一般課堂或室內活
動需要更多人手。若參與戶外活動的班數眾多,學校人手便會不勝負
荷。
此外,學校籌備戶外活動,牽涉很多行政程序,例如派發家長信、租車、
人手安排、安全評估,還有活動之後的功課作業跟進。這些行政工作都
會令老師卻步。
除了人手安排,資源緊絀也構成問題。如上文所述,不是所有老師都熟
悉廣泛的生態和環境知識。故進行戶外活動時,往往要額外花錢聘請專
業導賞員協助。
坊間價錢合適的導賞團供不應求
不少參與者都有安排學生參與戶外活動的經驗。他們認為,坊間價錢合
適的生態導賞團,往往供不應求。他們就算有心安排學生參與,卻苦無
機會。箇中的問題是,一些導賞團收費過高,他們不予考慮。一來學校
資源緊絀,二來學生又未必能夠負擔。但價格相宜又或者是免費的,名
額卻很快爆滿。
Centre for Communication and Public Opinion Survey, Agriculture, Fisheries and Conservation Department,
CUHK HKSAR
259
“Baseline Survey on the Attitude and Level of Knowledge of the General Public and Stakeholder Groups
Towards Biodiversity in Hong Kong” Research Report
IV. 對政府支援中學生物多樣性教育的意見
針對上述的教學局限和困難,參與者建議政府可從以下各方面支援中學的生
物多樣性教育:
加強有關生物多樣性的課程內容
參與者指出,現時中學的生物多樣性教育主要是依據當局課程而定。故
此,若要令學校、老師和學生各方都更加著重生物多樣性,最直接的方
法是在課程中增加相關的教學和考試元素。
訂立具體的生物多樣性教學目標
承繼上述的討論,參加者被問及現時中學生物多樣性教育對提升學生的
保育意識的效用。不少參與者表示很難回答,因為他們沒有客觀標準作
參考。故他們建議政府訂立具體、可量度的教學目標,方便學校老師制
定教學活動,以及評估學生的學習進度。
增加師資培訓和教學資源
針對上述提到缺乏足夠老師認識生物多樣性和缺乏教材的問題,參與者
建議前者可從師資培訓解決。當局可先加強培訓老師認識生物多樣性,
裝備好後才向學生傳授相關知識。
教材方面,參與者建議當局建立一個生物多樣性資源平台予老師和學生。
教材形式最好是多影片和互動性高。有參與者舉例,現時每間學校內或
附近都有栽種植物。當局可製作一個有關植物的互動資源平台。只要每
棵植物附上一個二維條碼,學生用手機或平板電腦一掃,就可以輕易連
結到相關資源平台,了解每棵植物背後的故事。
支援學校各方面的生物多樣性教學活動
參與者十分希望能夠多籌辦和參與有關生物多樣性的戶外教學活動。他
Centre for Communication and Public Opinion Survey, Agriculture, Fisheries and Conservation Department,
CUHK HKSAR
260
“Baseline Survey on the Attitude and Level of Knowledge of the General Public and Stakeholder Groups
Towards Biodiversity in Hong Kong” Research Report
們表示,無論是老師或者學生,都很願意參加,只是學校缺乏時間、人
手和資源。若果政府連同坊間團體,能夠提供更多全面的導賞團服務和
專業支援,讓學校只需報名參加即可,這能減輕老師的工作負擔。
另外,參與者亦建議政府增加和學校的互動。有參與者提到,早年政府
推動市區重建,會有流動車駛到學校宣傳,並在學校舉行講座。政府日
後推廣生物多樣性時,可參考相關做法。
參與者提到,現時很多學校都有自行舉辦不同有關生物多樣性的活動
(例如,有的是戶外活動、有的是舉辦講座、有的是建立綠色校園),
故每間學校有不同需要。所以政府要做到以校為本,因應每間學校的不
同需要提供相應支援。
提供誘因予學校、老師和學生
最後,有參與者認為,當局可在增加誘因方面著手,吸引學校、老師和
學生多推廣、多教、多學習生物多樣性。
針對學校而言,可考慮設立認證制度,如學校在校園裡保護或教育生物
多樣性的工作達標,便會得到政府頒發獎項。參與者相信,這個獎項有
助學校建立良好形象,因而會得到校長支持,繼而推動老師參與。但參
與者也提醒,得奬門檻不要訂得過高,否則學校也不會願意花大太功夫
參與。
在吸引老師方面,當局可設立專項資助計劃,邀請老師申請以用作舉辦
教育和推廣生物多樣性的活動。
就學生而言,當局可舉行聯校比賽,例如要求學生製作展品或影片,介
紹香港生物多樣性的情況,讓學生發揮才能。勝出者可獲資助到海外參
與國際比賽或參觀考察。
Centre for Communication and Public Opinion Survey, Agriculture, Fisheries and Conservation Department,
CUHK HKSAR
261
“Baseline Survey on the Attitude and Level of Knowledge of the General Public and Stakeholder Groups
Towards Biodiversity in Hong Kong” Research Report
Planning and Development Professionals
I. 業界對保護生物多樣性的意識和重視程度
參與者普遍認為,業界對保護生物多樣性的意識不強,重視程度亦低,原因
以下:
業界僅按法例要求行事
參與者表示,一般而言,業界進行工程主要是根據規例行事,例如會進
行各方面的環境評估,包括噪音、污染、污水等,只要符合到法例要求
便可。至於工程對生物多樣性的影響,則是相當次要的考慮,甚至沒有
將其考慮在内。尤其就一些小型工程,如在市區建立一座天橋、鋪設渠
道和水管,只會著重效率和成本控制。業界只有在進行大型基建如落馬
州建設、港珠澳大橋、機場填海工程時,因項目需要通過《環境影響評
估條例》才會較多考慮工程會否影響到生物多樣性。
另外,有參與者指出,業界考慮保護生物多樣性時,也會採取迴避態度。
例如,在開拓一些新發展區時,如新界東北發展,業界甚少考慮工程是
否會影響到生物多樣性,極其量只會考慮避開一些敏感地段(如法定圖
則上訂明的保護區和具特殊科學價值地點)。而工程的焦點主要會放在
通風、交通等基建事宜。
總結而言,業界進行工程時只務求符合最低法定要求,但甚少自行考慮
到要保護生物多樣性和實行對其保護的措施。
業界以滿足發展商要求和符合成本效益為主
參與者認為,普遍業界進行工程時最多是會考慮生物多樣性,但談不上
是會重視。但他們指出,業界內一些建築師和城市規劃師都有願景,想
多做一點事情去保護生物多樣性。但能否成事則取決於發展商的決定。
但他們認為,要求發展商會自行採取額外措施去保護生物多樣性,即是
Centre for Communication and Public Opinion Survey, Agriculture, Fisheries and Conservation Department,
CUHK HKSAR
262
“Baseline Survey on the Attitude and Level of Knowledge of the General Public and Stakeholder Groups
Towards Biodiversity in Hong Kong” Research Report
要求他們自設工程障礙,那是不合符經濟邏輯。商家歸根究底都是追求
成本效益的。
業界對生物多樣性缺乏足夠認識
參與者認為,業界不單對保護生物多樣性的意識不強,就連對生物多樣
性本身的認識都很薄弱。一些參與者在參與研究前都知悉這個概念,但
只局限於認為它是指物種的多寡而已,並不知道原來是有三個不同層次
(遺傳多樣性、物種多樣性、生態系統多樣性)。
他們解釋,由於業界人士本身不是生物和環境專科出身,在大學讀書時
沒有涉獵有關生態和環境的知識,所以對生物多樣性的認識不足,是可
以理解的。
另外,有參與者指出,現時業界缺乏對生態方面的專家。環顧各大發展
商和工程顧問公司,都甚少聘請相關專才。長遠來說,若日後工程要兼
顧對生態的影響,業界就有必要培訓和吸納生態人才。不過,有參與者
就擔心,若設更多專家制度,勢必令工程越來越複雜。
II. 促使業界保護生物多樣性的誘因和壓力
上述提到,業界會否在規劃和發展工程時考慮保護生物多樣性,主要取決於
法例規定需要,但參與者也討論到有甚麼誘因和壓力,能夠促使業界保護生
物多樣性:
業界保護生物多樣性的誘因
上述提到,發展商甚少顧及保護生物多樣性。雖然如此,有參與者感覺
到,近年不少業界人士和發展商都逐漸著重保護環境。例如,近年不少
發展商入標建樓時,都越趨看重在「綠建環評」(Beam Plus)中的評估表
現。這是因為此評估制度提出了經濟誘因,發展商只要在建樓時符合相
關環保規定,就可申請寬免建築物總樓面面積,變相是可以擴大工程範

Centre for Communication and Public Opinion Survey, Agriculture, Fisheries and Conservation Department,
CUHK HKSAR
263
“Baseline Survey on the Attitude and Level of Knowledge of the General Public and Stakeholder Groups
Towards Biodiversity in Hong Kong” Research Report
圍。
參與者提議,以「綠建環評」為藍本,提供誘因予發展商去保護生物多
樣性。評核機制可包括要求發展商記錄和公開工程對生物多樣性的影響
的前後對比,讓民間能監察物種變化。
除了經濟誘因,有參與者指出,隨著社會越來越著重環保,發展商或有
誘因去保護生物多樣性,因這有助於建立良好的品牌形象。有參與者就
建議,業界專業組織可設立有關保護生物多樣性的環保獎項,以表揚業
界人士和發展商。
業界保護生物多樣性的壓力
至於壓力方面,參與者表示身為前線業界人士,在日常工作中,並沒有
感受到任何壓力,促使他們要考慮保護生物多樣性。問及近年公民社會
包括環保團體和市民都越趨關注保護生態環境,並經常就相關議題發聲,
會否對業界構成社會輿論壓力。參與者表示,這些民意可能主要對政府
構成若干壓力,但對業界沒有任何影響。業界人士主要還是根據法例和
發展商要求進行規劃,以及服膺於成本效益的計算,不會因為看到有市
民提出反對意見,便貿然更改工程。
III. 對政府向業界教育及推廣生物多樣性的意見
參與者普遍認為,現時政府向業界教育及推廣生物多樣性的工作不足夠。故
他們提出以下建議:
多辦論壇,配合政策,持續推廣
參與者提議,政府應多辦業界論壇,向業界廣泛推廣生物多樣性。而這
些論壇不應局限在某段時期,而要持續進行。
但有參與者提醒,若論壇純粹是宣傳性質,則和一般公眾推廣無異,只
會吸引到本身對議題有興趣的人去聽。那參與論壇的人數未必會多,而

Centre for Communication and Public Opinion Survey, Agriculture, Fisheries and Conservation Department,
CUHK HKSAR
264
“Baseline Survey on the Attitude and Level of Knowledge of the General Public and Stakeholder Groups
Towards Biodiversity in Hong Kong” Research Report
且參與感也未必強。
所以,舉辦業界論壇必須是有政策配合。即政府先推出有關保護生物多
樣性的政策和相關業界作業指引(practice notes),其後透過論壇向業界
介紹和講解政策。在這個情況下,參與論壇的人數就會增加,因為業界
需要學習及在日後應用相關知識。參與者也坦言,業界人士工作十分繁
忙,若無工作需要,他們亦無須要花時間了解相關議題。
提供專業培訓
上述提到,業界人士本身缺乏認識生物多樣性。針對這個問題,有參與
者提到,政府可配合業界的專業學會,提供有關保護生物多樣性的「持
續專業發展」(Continuing professional development)課程,以提升業界人
士的相關知識。
IV. 對政府支援業界落實保護生物多樣性的意見
政府除了著力向業界教育及推廣生物多樣性,參與者也建議政府可循以下方
法加強支援業界落實保護生物多樣性:
檢討現有環境影響評估機制
由於業界會否保護生物多樣性主要受政策法規影響,參與者深入討論了
現有的環境影響評估制度。普遍意見是,現有制度未有全面顧及到生物
多樣性這個概念,需要檢討。
參與者認為現時的環境評估制度是有效的,因為當中覆蓋的範圍算廣泛,
而且是法例要求,發展商和業界必須遵守。但他們認為,評估制度卻需
要檢討,因為在上世紀九十年代制定相關條例和機制時,並不是針對「生
物多樣性」這個新概念,故未能反映工程對生物多樣性的影響。
有參與者解釋,現有環境影響評估機制只有其中一個範疇牽涉到「生態
影響」(ecological impact),這間接跟生物多樣性相關。但是,現有條例
Centre for Communication and Public Opinion Survey, Agriculture, Fisheries and Conservation Department,
CUHK HKSAR
265
“Baseline Survey on the Attitude and Level of Knowledge of the General Public and Stakeholder Groups
Towards Biodiversity in Hong Kong” Research Report
卻沒有直接、具體和全面觸及「生物多樣性」這個概念,由於未有法例
要求,業界進行工程時不會主動考慮保護生物多樣性。
另外,有參與者認為,現存的環境評估制度只屬一個「被動機制」。在
這機制下,業界的思路只會考慮到工程對生物多樣性有甚麼負面影響,
而需要有甚麼相應補償辦法,務求令影響減至最低。但是,業界卻不會
主動思考如何優化現有狀態(例如如何增加物種)。
此外,有參與者建議政府設立獨立機構進行環境評估。他們指出,現有
環境評估制度另一個不足的地方是,相關評估是由發展商聘請顧問撰寫
的,而不是由獨立機構或人士進行,所以提出的建議都只停留於最基礎
的層面:即若工程會影響到環境,才需要採取相應的補償措施,將影響
減到最低,但就不會進一步採取優化措施。
制定政策,規範商界和業界
上述提到,商界並無太大誘因主動落實保護生物多樣性,所以參與者都
寄望政府能夠帶頭制定政策,以規範發展商和業界。
有參與者指出,現時世界各地都致力提倡保護生物多樣性,是由於多個
政府共同簽署相關國際公約(《生物多樣性公約》)約束,這即說明保護
生物多樣性的責任主要在政府,很難靠商界、業界人士和民間自發去
做。
政府以身作則,樹立榜樣
參與者都認為,現時業界沒有足夠知識如何在規劃和進行工程時,落實
保護生物多樣性,所以他們建議政府身為香港最大的發展商,應率先透
過大型公共工程作示範。例如,在規劃工程階段,政府可牽頭和協調各
持份者包括業界、學術界和環保界促成互動交流,向社會各界展示如何
共同謀劃保護香港的生物多樣性,並讓公眾了解到工程發展和保護生態
Centre for Communication and Public Opinion Survey, Agriculture, Fisheries and Conservation Department,
CUHK HKSAR
266
“Baseline Survey on the Attitude and Level of Knowledge of the General Public and Stakeholder Groups
Towards Biodiversity in Hong Kong” Research Report
是可以共存的。當政府樹立榜樣後,商界和業界便有先例可循。
由較高層次局方負責落實保護生物多樣性的政策
最後,參與者提出,政府若要真正有效落實保護生物多樣性的政策,必
須由一個較高層次的局方去牽頭,而不是由漁護署這個規模相對較小的
部門負責。另外,由於相關政策是針對規劃及發展工作業界,故發展局
是較合適的負責部門。