baseline social & environmental report
TRANSCRIPT

Jun-17
Final Report
Baseline Social &
Environmental Report
Shajapur & Agar 250MW Solar PV Park
Submitted BY:
Knight Frank (India) Pvt. Ltd. 1505 - 1508, Tower- B; Signature Towers, South City- 1 Gurgaon, Haryana - 122001

Page | 1
TABLE OF CONTENTS
CHAPTER I. INTRODUCTION ...................................................................................................................... 3
SECTION 1.01 INTRODUCTION TO THE PROJECT ...................................................................................................... 3
SECTION 1.02 KEY FEATURES OF PROPOSED SITES .................................................................................................. 3
SECTION 1.03 PROJECT RATIONALE ..................................................................................................................... 4
SECTION 1.04 OBJECTIVE OF THE STUDY ............................................................................................................... 4
CHAPTER II. LOCATION OF PROPOSED PROJECT SITES ............................................................................... 5
SECTION 2.01 POTENTIAL SITES .......................................................................................................................... 5
(a) Shajapur 250MW Solar PV Park ....................................................................................................... 5
(b) Agar 250MW Solar PV Park ............................................................................................................. 7
SECTION 2.02 GOVERNMENT LAND PARCELS AVAILABILITY ...................................................................................... 9
(a) Villages of Shajapur District ............................................................................................................. 9
(b) Villages of Agar District .................................................................................................................. 10
CHAPTER III. DELINEATION OF SITE BOUNDARIES ..................................................................................... 12
SECTION 3.01 LOCATION OF POTENTIAL CLUSTERS ............................................................................................... 12
SECTION 3.02 SITE -01 (SUSNER)...................................................................................................................... 13
SECTION 3.03 POTENTIAL SITE – 02 (AGAR -AGAR) ............................................................................................. 16
SECTION 3.04 SITE – 03 (MOMAN BADODIYA-SHAJAPUR) ..................................................................................... 20
CHAPTER IV. SOCIAL & ENVIRONMENTAL BASELINE ................................................................................. 24
SECTION 4.01 LOCATION ATTRIBUTES – CLIMATIC PARAMETERS ............................................................................. 24
SECTION 4.02 SOLAR RESOURCE POTENTIAL ........................................................................................................ 24
SECTION 4.03 LAND ASPECTS ........................................................................................................................... 25
(a) Land Holding Pattern – Susner Tehsil ............................................................................................. 26
(b) Land Holding Pattern – Agar tehsil ................................................................................................ 26

Page | 2
(c) Land Holding Pattern - Moman Badodiya Tehsil ........................................................................... 27
(d) Land values and economic potential of land .................................................................................. 28
(e) Existing Land Use / Land Cover ...................................................................................................... 28
SECTION 4.04 TRANSMISSION LINES .................................................................................................................. 31
SECTION 4.05 SOCIO – ECONOMIC AND DEMOGRAPHIC PROFILE ............................................................................. 31
(a) Demographic Profile ...................................................................................................................... 31
(b) Medical and Health Facilities / Sanitation Facilities ...................................................................... 32
(c) Vulnerability Profile ........................................................................................................................ 33
(d) Occupational / Economic Profile .................................................................................................... 34
(e) Assets Ownerships among the households .................................................................................... 37
SECTION 4.06 GEOLOGY OF THE AREA ................................................................................................................ 37
SECTION 4.07 GEO-MORPHOLOGY FOR THE PROJECT SITES .................................................................................... 39
SECTION 4.08 SOIL CHARACTERISTICS ................................................................................................................ 39
SECTION 4.09 WATER RESOURCES .................................................................................................................... 40
(a) Ground water availability status .................................................................................................... 40
(b) Surface water bodies & drainage Basins........................................................................................ 42
SECTION 4.10 FLORA AND FAUNA / BIO DIVERSITY ............................................................................................... 43
SECTION 4.11 PUBLIC CONSULTATIONS .............................................................................................................. 45
SECTION 4.12 PHYSICAL & CULTURAL RESOURCES ................................................................................................ 47
CHAPTER V. CONCLUSIONS ...................................................................................................................... 49
(a) Sub project activities affecting the natural physical environment ................................................. 49
(b) Project activities affecting the biological environment .................................................................. 49
(c) Project activities affecting the visual environment ........................................................................ 50
(d) Project activities affecting the settlement / infrastructure ............................................................ 50
(e) Project activities affecting the Social Environment ........................................................................ 51

Page | 3
CHAPTER I. INTRODUCTION
Section 1.01 Introduction to the Project
The Government of India has identified the power sector as one of the critical components for
infrastructure development and overall economic growth. The 11th five year plan and 12
th five
year plan (including phase -2 of the National Solar Mission) focusses on a more state led solar
power growth in terms of Ultra Mega Power Projects (UMPP), solar park facilities and new
financing models for implementation.
The Government of India‟s focus on attaining „Power for all‟ has accelerated capacity addition in
the country. The Planning Commission‟s 12th Five-Year Plan estimates total domestic energy
production to reach 669.6 Million Tonnes of Oil Equivalent (MTOE) by 2016–17 and 844 MTOE
by 2021–22. Nearly 4,000 MW of solar power is added in 2016, nearly twice the addition of
2,133 MW in 2015. Between April 2000 and March 2016, the industry attracted US$ 10.48
billion in Foreign Direct Investment (FDI).
The World Bank Group has committed to provide US$ 1 billion for India‟s solar energy projects
and plans to work with other multilateral development banks and financial institutions to develop
financing instruments to support future solar energy development in the country. The Ministry of
New and Renewable Energy (MNRE) has signed an agreement with Germany-based KfW
Development Bank to fund Rs 300 crore (US$ 44.7 million) for floating solar projects in
Maharashtra and Kerala, which are expected to generate over 310 GW of green energy.
Canada's second largest pension fund, Caisse de depot et placement du Quebec (CDPQ), has
set up its office in India and committed to invest US$ 150 million in the Indian renewable energy
sector over the next three to four years.
The Government of India announced a massive renewable energy power production target of
175,000 MW by 2022; this comprises generation of 100,000 MW from solar power, 60,000 MW
from wind energy, 10,000 MW from biomass, and 5,000 MW from small hydro power projects.
Government of India has asked states to prepare action plans with year-wise targets to
introduce renewable energy technologies and install solar rooftop panels so that the states
complement government's works to achieve 175 GW of renewable power by 2022.
The state of Madhya Pradesh is among the favourable states due to high potential attributed to
locational benefits for solar and wind power generation including solar development policy
initiatives taken by the state government. MNRE has proposed Madhya Pradesh to be one of
the potential states for engagement wherein a comprehensive solar development initiative is
being thought about.
The Government of Madhya Pradesh (GoMP) through its New and Renewable Energy
Department (NRED) has identified two sites in Agar-Malwa and Shajapur Districts for setting up
250MW solar parks at each of the locations.
Section 1.02 Key Features of Proposed Sites
Government of Madhya Pradesh through its nodal agency, MPNRED, intends to setup 250MW
solar PV parks each at Shajapur and Agar districts. It is important to undertake the collation of

Page | 4
baseline data and analysis of site suitability before moving in for such large projects. Following
Table -1 provides a brief of the information made available from MPNRED about the proposed
projects.
Table 1: Basic Attributes of Potential Solar Power Project Sites
Sr No Particular Description
1 Project Site Villages Government land parcels identified falling under multiple villages
2 Tehsil / District Agar, Susner, Shajapur & Maksi Tehsils
Shajapur & Agar-Malwa Districts in Madhya Pradesh State
3 Location coordinates Latitude 23-37-00 to 23-57-00 North
Longitude 76-01-00 to 76-17-00 East
4 Road Accessibility Linked by SH / ODR to Tehsil Headquarters
150 km from State Capital - Bhopal
5 Nearest Airport Indore Airport (120 kms)
6 Land Available Mainly government land and certain percentage of private land parcels to be
acquired for contiguity of the site
7 Proposed Capacity Two plants of 250MW each in Agar & Shajapur districts
8 Daily Average Solar
Radiation
5.35 kWh/m2
9 Climate Hot and dry
10 Technology Solar Photovoltaic (PV)
Section 1.03 Project Rationale
While, solar projects in India do not require a regulatory environmental clearance, it is also
understood that large-scale projects will have both environmental and social impacts and these
impacts need to be avoided as far as possible. In case, the impacts cannot be avoided, such
impacts need to adequately mitigated or managed.
The current environmental and social baseline study shall help assess the requirements for
detailed environmental and social assessment study that might need to be undertaken to ensure
that anticipated adverse impacts are adequately mitigated / minimized.
Section 1.04 Objective of the Study
The assignment aims to establish the environmental and social baseline; assess environmental
and social issues and threats that might have an impact on the proposed solar UMPP projects.
The study will help in assessing if the site is free from any major environmental and social
issues.

Page | 5
CHAPTER II. LOCATION OF PROPOSED PROJECT SITES
Section 2.01 Potential Sites
MPNRED shared the available data on the shortlisted land parcels spread across 30 villages in
Shajapur and 7 Villages in Agar Malwa Districts. The spatial location of tehsils covering potential
sites is depicted in Figure -1 below: A brief on the two proposed sites is mentioned in below sub
sections:
Figure 1: Location of Potential Sites in various tehsils of Shajapur & Agar Districts
(a) SHAJAPUR 250MW SOLAR PV PARK
Shajapur district in the state of Madhya Pradesh is the part of Malwa Plateau in Ujjain Division.
The district is situated in the north-western part of the state and is bounded by Ujjain District to
the west, Dewas and Sehore to the east, and Jhalawar District of Rajasthan to north. The
district is further divided into five tehsils i.e. Shajapur, Shujalpur, Kalapipal, Gulana & Moman
Badodiya.
Majority of the land identified (falling under 30 villages) for setting up of the 250 MW solar PV
project is in Shajapur & Moman Badodiya tehsils having a total area of 633 Ha approximately.
The villages can be approached by the existing road network and is well connected to major
urban centre i.e. Indore (approximately 140 kms).

Page | 6
Table-2 below depicts the list of selected land parcels falling under 30 villages in two tehsils in
Shajapur district. Screening of the online P2 forms on the MP land records portal reflects that
almost all (expect two land parcels highlighted in Yellow in Table-2 below) belongs to the
government. Some of the land parcels are already allotted (partially or complete) to MNRE
(highlighted in Orange colour in Table -2 below) and a few of the land parcels (highlighted in
Green in Table-2 below) are either partially or completely allotted for afforestation to the state
Forest Department under separate notification by the Collector Office.
Table 2: Shortlisted Land Parcels for Shajapur 250MW solar PV Park
Teh
sil
Village
Total Allotment
Requested Govt. Land MNRE Pvt. /Allotted Land
No. of
Parcel
Area
(Ha.)
No. of
Parcel
Area
(Ha.)
No. of
Parcel
Area
(Ha.)
No. of
Parcel
Area
(Ha.)
Sh
ajap
ur
Kudeshwar 2 6.38 2 6.38 0 0 0 0
Bamaniyakhedi 2 2.74 2 2.74 0 0 0 0
Boddi 12 27.56 12 27.56 0 0 0 0
Khakri 5 18.45 5 18.45 0 0 0 0
Majhaniya 1 5.17 1 5.17 0 0 0 0
Rehli 7 63.84 7 63.84 5 6.41 0 0
Rulaki 2 4.1 2 4.1 0 0 0 0
Tanda Pindniya 1 1.96 1 1.96 0 0 0 0
Goyla 1 3.62 1 3.62 0 0 0 0
Aakya Chouhani 3 10.65 3 10.65 0 0 0 0
Palsavad Soun 3 24.499 3 24.499 0 0 0 0
Besrapur 3 3.89 3 3.89 0 0 0 0
Khokariya Toak 4 7.18 3 7.1 0 0 1 0.8
Hanoti 15 164.64 15 164.64 0 0 0 0
Total 61 344.679 60 344.599 0 0 1 0.8
Mo
man
Bad
od
iya
DehriPal 3 11.14 3 11.14 0 0 0 0
Parsula 2 18.67 2 18.67 0 0 0 0
Kadula 1 10.84 1 10.84 0 0 0 0
Malyadehi 2 29.65 1 28.65 0 0 1 1
Burlay 4 30.52 4 30.52 0 0 0 0
Javdi 2 21.4 2 21.4 0 0 0 0
Bhandedi 1 6.2 1 6.2 0 0 0 0
Sagdiya 1 42.9 1 42.9 0 0 0 0
Bandadehi 1 16.86 1 16.86 0 0 0 0
Pipalkheda 3 6.81 3 6.81 0 0 0 0
Dupada 4 25.22 4 25.22 0 0 0 0
Beejana 2 9.07 2 9.07 0 0 0 0
Kheriya Yaema 5 17.31 5 17.31 0 0 0 0
Kumhariya khas 4 20.43 3 13.7 1 6.73 0 0
Page | 7
Teh
sil
Village
Total Allotment
Requested Govt. Land MNRE Pvt. /Allotted Land
No. of
Parcel
Area
(Ha.)
No. of
Parcel
Area
(Ha.)
No. of
Parcel
Area
(Ha.)
No. of
Parcel
Area
(Ha.)
Dangicha 2 3.83 2 3.83 0 0 0 0
Jaman 7 17.51 7 17.51 0 0 0 0
Total 44 288.36 42 280.63 1 6.73 1 1
Grand Total 105 633.039 102 625.229 1 6.73 2 1.8
Private Land Parcels
Land Parcels already allotted to MPNRED
Allotted for afforestation (Complete / partial)
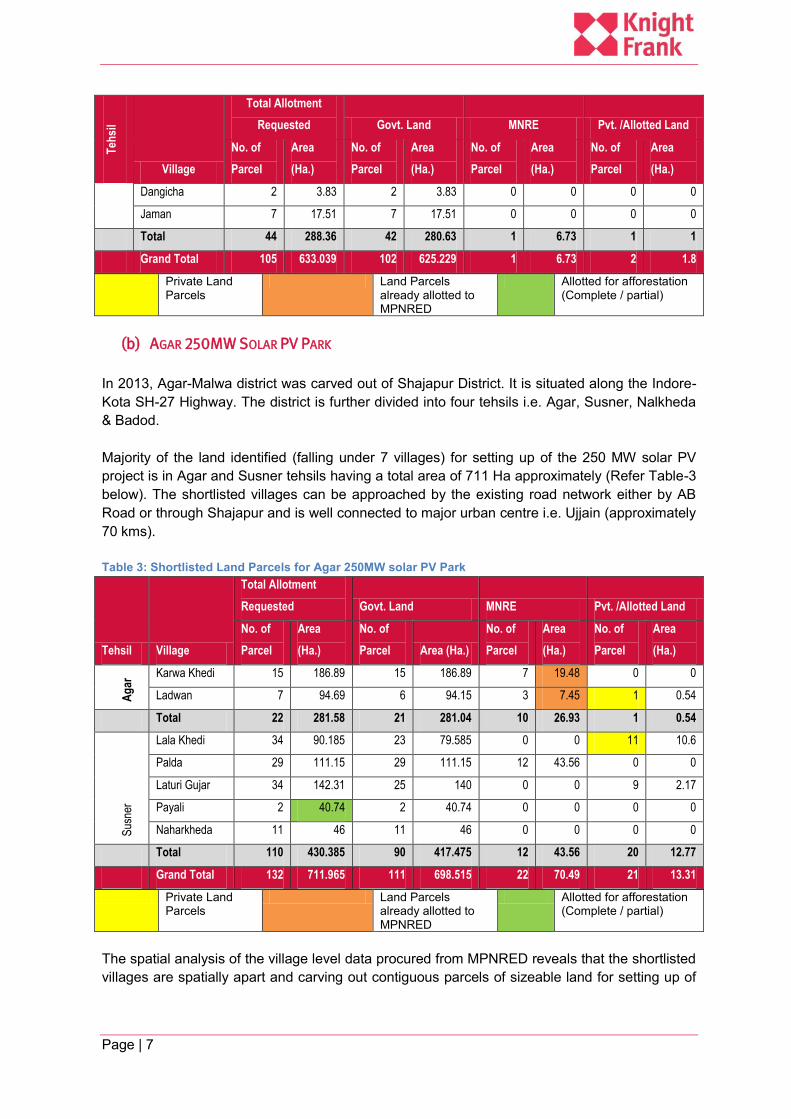
(b) AGAR 250MW SOLAR PV PARK
In 2013, Agar-Malwa district was carved out of Shajapur District. It is situated along the Indore-
Kota SH-27 Highway. The district is further divided into four tehsils i.e. Agar, Susner, Nalkheda
& Badod.
Majority of the land identified (falling under 7 villages) for setting up of the 250 MW solar PV
project is in Agar and Susner tehsils having a total area of 711 Ha approximately (Refer Table-3
below). The shortlisted villages can be approached by the existing road network either by AB
Road or through Shajapur and is well connected to major urban centre i.e. Ujjain (approximately
70 kms).
Table 3: Shortlisted Land Parcels for Agar 250MW solar PV Park
Tehsil Village
Total Allotment
Requested Govt. Land MNRE Pvt. /Allotted Land
No. of
Parcel
Area
(Ha.)
No. of
Parcel Area (Ha.)
No. of
Parcel
Area
(Ha.)
No. of
Parcel
Area
(Ha.)
Ag
ar Karwa Khedi 15 186.89 15 186.89 7 19.48 0 0
Ladwan 7 94.69 6 94.15 3 7.45 1 0.54
Total 22 281.58 21 281.04 10 26.93 1 0.54
Sus
ner
Lala Khedi 34 90.185 23 79.585 0 0 11 10.6
Palda 29 111.15 29 111.15 12 43.56 0 0
Laturi Gujar 34 142.31 25 140 0 0 9 2.17
Payali 2 40.74 2 40.74 0 0 0 0
Naharkheda 11 46 11 46 0 0 0 0
Total 110 430.385 90 417.475 12 43.56 20 12.77
Grand Total 132 711.965 111 698.515 22 70.49 21 13.31
Private Land Parcels
Land Parcels already allotted to MPNRED
Allotted for afforestation (Complete / partial)
The spatial analysis of the village level data procured from MPNRED reveals that the shortlisted
villages are spatially apart and carving out contiguous parcels of sizeable land for setting up of

Page | 8
solar parks might be a challenge. Figure-2 below depicts the spatial spread of the shortlisted
villages falling within Agar Malwa and Shajapur districts.
Figure 2: Location of Village clusters for Potential Solar Power Projects

Page | 9
Section 2.02 Government Land Parcels Availability
(a) VILLAGES OF SHAJAPUR DISTRICT
In order to identify contagious land parcels an attempt was made by the consultants to reclassify
the villages in different clusters and review the available government land in each of these
clusters. The details of the total government land in each of the above shortlisted villages are
depicted below in Table -4:
Table 4: Details of Government Land for Villages in Shajapur District
Village Code Village Geographical Area Shortlisted Area Total Govt. Land
Shajapur
646 Kudeshwar 337.72 6.38 44.04
697 Bamaniyakhedi 132.63 2.74 34.44
701 Boddi 670.96 27.56 213.88
702 Khakri 314.47 18.45 126.58
671 Majhaniya 433.65 5.17 82.703
763 Rehli 781.42 63.84 141.68
767 Rulaki 733.94 4.1 99.23
782 Tanda Pindniya 260.19 1.96 78.17
786 Goyla 345.98 3.62 31.56
744 Aakya Chouhani 344.28 10.65 97.65
758 Palsavad Soun 693.88 24.499 355.9
760 Besrapur 492.57 3.89 338.32
752 Khokariya Toak 368.32 7.18 92.79
753 Hanoti 698.25 164.64 260.91
6608.26 344.679 1997.853
Moman Badodiya
889 DehriPal 944.49 11.14 235.41
886 Parsula 692.98 18.67 176.22
890 Kadula 1328.92 10.84 137.45
892 Malyadehi 421.5 29.65 128.38
904 Burlay 948.35 30.52 298.3
905 Javdi 304.65 21.4 75.79
909 Bhandedi 378.43 6.2 82.59
908 Sagdiya 517.07 42.9 157.99
913 Bandadehi 588.97 16.86 171.43
912 Pipalkheda 151.03 6.81 40.96
952 Dupada 1569.81 25.22 310.51

Page | 10
Village Code Village Geographical Area Shortlisted Area Total Govt. Land
Shajapur
963 Beejana 967.66 9.07 135.09
967 Kheriya Yaema 1069.49 17.31 249.79
972 Kumhariya Khas 566.89 20.43 114.73
971 Dangicha 352.19 3.83 40.19
981 Jaman 396.07 17.51 88.99
11198.5 288.36 2443.82
As per the estimates, an area of approximately 125-150 Ha would be required to set up a single
module of 50MW solar PV. A preliminary assessment of the above data suggests 27 villages of
a total of 30 villages have shortlisted government land area less than 30 Ha (including 12
villages with shortlisted government land area of less than 10 Ha). Only one village (Hanoti –
village code 753) has area of 164 Ha, where as other two villages i.e. Sagdiya (village code
908) and Rehli (village code 763) have area of 42 and 63 Ha respectively. Key observations
include:
1. Some of the shortlisted villages are spatially not together (i.e. village code 782, 697,
786, 763, 767, 744, 981, 952, 760). This will pose certain challenges in providing
contiguous land parcels.
2. Majority of these villages have selected government land area less than 30 Ha. 19 out of
30 villages have total government land availability less than 150 Ha which is required for
a single 50MW module. These village codes are 744, 697, 909, 963, 971, 786, 981, 905,
890, 702, 752, 646, 972, 671, 892, 763, 767, 912 and 782.
3. It is important to highlight here that several villages located spatially apart and with small
areas would not be feasible from the perspective of even the single module of 50 MW
and hence are proposed to be excluded from the purview of the current assignment.
The clusters of villages together with at least a potential of feasible module of 50 MW
have been taken up for further analysis.
(b) VILLAGES OF AGAR DISTRICT
Similar analysis has been undertaken for the seven shortlisted villages for proposed Agar-
Malwa 250MW solar PV project. The key observations based on the review of Table-5 are:
Table 5: Details of Government Land for Agar District
Village code Village Geographical Area Shortlisted Area Total Govt. Land
584 Karwa Khedi 587.09 186.89 378.78
585 Ladwan 590.74 94.69 286.17
1177.83 281.58 664.95
179 Lala Khedi 662.54 90.185 390.38
235 Palda 801.75 111.15 362.76
241 Laturi Gujar 520.68 142.31 266.6
200 Payali 727.11 40.74 223.09
240 Naharkheda 837.36 46 426.54

Page | 11
Village code Village Geographical Area Shortlisted Area Total Govt. Land
3549.44 430.385 1669.37
1. 3 of the 7 selected villages have shortlisted government land areas above 100 Ha i.e.
Code 584, 241 and 235.
2. Village Code 179 and 200 are scattered and also does not have the minimum 125-150
area required for setting up of a single module. However both these villages have total
government land parcels more than 200 Ha wherein procurement of additional
government land may be an option.
3. Cluster 1 i.e. 241 and 240 villages have available government land to the tune of 693.14
Ha whereas currently shortlisted government land area is 188.31 Ha only in these
villages. Additional land available (preferably government land) can be an option.
4. Cluster 2 i.e. 584 and 585 villages have total government land to the tune of 664.95 Ha
and currently 281.58 Ha is shortlisted. Options for additional government land
availability have been examined in the subsequent section.
The selected villages were reorganized based on their location, proximity to other shortlisted
villages and clusters were defined (Refer Figure-2). The cluster approach was adopted to
identify contagious land parcels in a group of 4-7 villages as larger government land parcels
were not available in any of the individual selected villages.
The consultant‟s team in consultation with the MPNRED officials initiated the tasks of
demarcating the potential sites for the proposed 250MW solar PV parks with the following
criteria:
1. The land parcels selected should be essentially owned by government / revenue parcels
to the extent possible.
2. Private land parcels should be avoided to the extent feasible.
3. Designated Forest land parcels / ecologically fragile areas should be excluded during
the site selection.
4. All major surface water bodies / major drainage channels should be excluded during the
site selection.
5. Site accessibility from the existing road network for movement of heavy machinery and
materials should be considered as an added advantage.
The outcome of the site selection (demarcation of revised boundaries) resulted in identification
of three potential sites by the consultant‟s team as elaborated in the subsequent chapter.

Page | 12
CHAPTER III. DELINEATION OF SITE BOUNDARIES
Section 3.01 Location of Potential Clusters
Based on the criteria depicted in preceding chapter and consultations with MPNRED local team
and village revenue officials, following three contiguous clusters of land parcels were identified /
found appropriate for setting up of the 250 MW solar PV parks. The location of proposed sites is
presented in Figure-3 below.
Figure 3: Map showing location of proposed sites (revised)
A brief description of the three proposed sites is depicted in table below followed by a more
detailed analysis in the subsequent sections:
Site -01 / Susner Site -02 / Agar Site -03 / Moman Badodiya
Proposed Capacity 250 MW 250 MW 250 MW
Estimated Area, HA 826.7 Ha 731.37 Ha 833.41 Ha
Tehsil Name Susner Agar Moman Badodiya
Identified villages (19 in all)
Naharkheda Palda Pipalya Nankar Umariya
Bijankhedi | Dudhpura Karwa Khedi | Kesaidehriya Ladwan | Madhopur Pipalya Kumhar
Parsula | Jawadi Fawaka | Dhatrawada Dehripal | Chauma Burlay | Bijanakhedi

Page | 13
Figure-4 below depicts the three potential sites overlaid with SoI map sheets for setting up of
250MW solar PV parks.
Figure 4: Preliminary Site Delineation
The site boundaries at three different locations, wherein maximum government land was
available, based on the information available online from the land records department have
been delineated. None of the villages (19 selected villages in total) have connectivity by rail or
National Highways. Only one village (i.e. Chouma) is connected by State Highway. All the
villages except Naharkheda and Dudhpura have all weather pucca black topped road.
The brief description of the potential sites is presented in the subsequent sub-sections.
Section 3.02 Site -01 (Susner)
Site – 01 falls under four villages i.e. Naharkheda,
Palda, Pipalya Nankar and Umariya in Susner tehsil
of Agar district (refer Figures 5). The estimated area
is 826 Ha which would be fit for setting up a 250MW
solar PV park.
In order to ensure continuity of land, certain private
land parcels were also included (approximately 74
parcels) amounting to a total area of 147.58 Ha as
per the P2 data available online from MP land Figure 5: Site -01 w.r.t the village
boundaries

Page | 14
records URL: http://landrecords.mp.gov.in/. Figure-6 below presents the land categorization for
proposed site-01.
Figure 6: Proposed Site-01 (Susner) Land categorization
The details of the land parcels delineated as part of Site-01 are presented in Table-6 below.
Majority of the land is under the government ownership. The community forestry land (marked
as “panch van”) in P2 formats which accounts for 22 per cent total area can be allocated to
MPNRED as per the available information. The area classified under “Others” category
accounts for about 5% of the total area and includes water bodies / roads. Transfer of this land
to MPNRED for solar park will be difficult.
Table 6: Details of Shortlisted Land parcels
Village
Name
Govt Parcels Private
Parcels
Community
Forestry
/Horticulture
Grazing Land Others
Total
Count Area Count Area Count Area Count Area Count Area Area
Naharkheda 19 74.68 24 62.71 8 26.69 2 5.17 11 4.13 173.38
Palda 17 67.34 5 5.28 0 0 1 6.23 5 1.03 79.88
Pipalya
Nankar 28 174.14 1 0.5 0 0 6 24.49 13 6.49 205.62
Umariya 32 53.81 7 5.3 49 158.5 33 123.93 58 26.28 367.82

Page | 15
Village
Name
Govt Parcels Private
Parcels
Community
Forestry
/Horticulture
Grazing Land Others
Total
Count Area Count Area Count Area Count Area Count Area Area
Total 96 369.97 37 73.79 57 185.19 42 159.82 87 37.93 826.7
% age 44.8% 8.9% 22.4% 19.3% 4.6% 100.0%
The topographic map (Refer Figure-7) for the proposed site-01 depicts that most of the
shortlisted land parcels are basically “open scrub” land. The southern limits of the proposed site
border a protected forest. Designated forest area towards the southern end of the site has been
excluded during the desk based site identification.
The proposed site -01 is well connected by a village road connecting Umariya village further
linking Susner tehsil headquarters. The existing road also splits the proposed site-01 in two
parts.
Figure 7: Topographic map of site-01
Post the identification of the potential site based on the available secondary information and
desk based GIS mapping, field visits were conducted to validate the findings, land cover in the
area and other key features within and in vicinity of the proposed site. Figure-8 below depicts
the satellite imagery view for the proposed site along with site photographs.
There are two existing solar PV parks in vicinity as depicted in the imagery below. One of the
PV facilities is already commissioned whereas work on the other is yet to start.

Page | 16
Section 3.03 Potential Site – 02 (Agar -Agar)
Site -02 falls under
seven villages i.e.
Bijankhedi,
Dudhpura, Karwa
Khedi, Kesaidehriya,
Ladwan, Madhopur
and Pipalia Nankar
(within Agar Tehsil)
with an estimated
area of more than
731 Ha for setting up
a 250MW solar PV
park.
It may be noted that
certain parcels of
land are already
allotted to MPNRED
for setting up of WTG stations of 1.5MW each. These WTG‟s are operated by M/s SUZLON in
Figure 8: Satellite Imagery View of Site -01

Page | 17
this area under a separate lease agreement with MPNRED. The Figure below shows the land
categorization for Site-02 (Agar).
Figure 9: Land categorization fro site -02
The break up amongst the various land categories for site –02 is depicted in Table below. The
estimated total area is 731.37 Ha approximately.
Table 7: Details of Land Parcels for Potential Site-02 in Agar District
Village Name Govt Parcels
Private
Parcels
Community
Forestry
/Horticulture Grazing Land Others Total
Count Area Count Area Count Area Count Area Count Area Area
Bijanakhedi 3 53.33 0 0 0 0 1 2.3 1 0.29 55.92
Dudhpura 15 93.87 15 52.93 2 14.95 0 0 10 7.92 169.67
Karwa Khedi 20 151.03 2 1.07 0 0 2 19.56 11 11.51 183.17
Kesaidehriya 1 13.85 0 0 0 0 1 28.3 1 1.2 43.35
Ladwan 19 135.92 0 0 0 0 5 66.23 5 5.07 207.22
Madhopur 6 20.36 0 0 0 0 0 0 4 11.7 32.06
Pipalya Kumhar 8 34.92 4 5.06 0 0 0 0 0 0 39.98
Total 72 503.28 21 59.06 2 14.95 9 116.39 32 37.69 731.37
% age 68.8% 8.1% 2.0% 15.9% 5.2% 100.0%

Page | 18
In order to ensure contiguous land parcel, an estimated 8% of private land parcels of the total
area has also been included in the above estimates. The preliminary site validation surveys and
public consultations conducted by the consultant‟s team revealed that villagers may have some
apprehensions in procurement of private land due to their unpleasant past experience with
private developer M/s SUZLON. Following land parcels are allocated to the WTG operator
which accounts for nearly 20 Ha of land from the above shortlisted land parcels.
Tehsil Village name Khasra no Total Area (Ha) Khasra No
allotted for WTG
Area (Ha)
Agar Karwa Khedi 55 7.82 55/min1 2.82
Karwa Khedi 57 28.20 57/min1 3.00
Karwa Khedi 61 78.70 61/min1 6.24
Karwa Khedi 184 7.32 184/min1 1.37
Ladwan 1 30.08 1/min1 2.45
Ladwan 7 24.25 7/min 1 3.00
Ladwan 34 37.70 34/min1 2.00
Total 214.07 20.88
The existing WTG within the proposed site would have its own advantages vis-a-vis
disadvantages whereby options to use the existing transmission networks can be explored,
thereby reducing infrastructure development costs. At the same time, the existing WTG will also
have adverse impacts due to shadows and flickering effect which need to take into
consideration while planning for PV panel‟s layout.
Post the deductions, an effective area of 700 Ha approximately may be available under Site-02
which excludes total area under the “others” category and WTG leased area.
A typical footprint (direct surface area of impact which last the life of the facility) for a single
WTG of 1.5 MW / 2 MW is calculated based on the size of the blade lengths. For a 40 meter to
45 meter blade length, an area of approximately 100meter by 100 meter (1 hectare) is required.
These include the area occupied by the wind turbine pads, sub stations, service buildings and
other supporting infrastructure facilities. Additionally there is a radius of restriction which is
calculated as (tower height plus (+) 0.5 times the blade diameter) wherein there are height
restrictions for buildings / vegetation to ensure safety of the WTG. The setbacks / spacing
between multiple WTG‟s are influenced by issues including visual impacts, noise, flicker effect
and safety. In general, the developer shall leave a distance of 2D perpendicular to the
predominant wind direction and 3D distance in the pre-dominant wind direction.
The area (allocated) leased to various WTG‟s varies from 1.37 Ha to 6.24 ha within the
proposed site-02. Options to reclaim the excess land (i.e. > 1.5 Ha per WTG) allotted to
operators may also be considered.
The preliminary site visits conducted by the consultant‟s team to validate the land cover and
other environmental and social key indicators is reflected in the subsequent chapters. Below
figure – 10 depicts the key visual observations for Site-02

Page | 19
Figure 11: Topographic Map of Site-02
Figure 10: Satellite Imagery Site -02
Page | 20
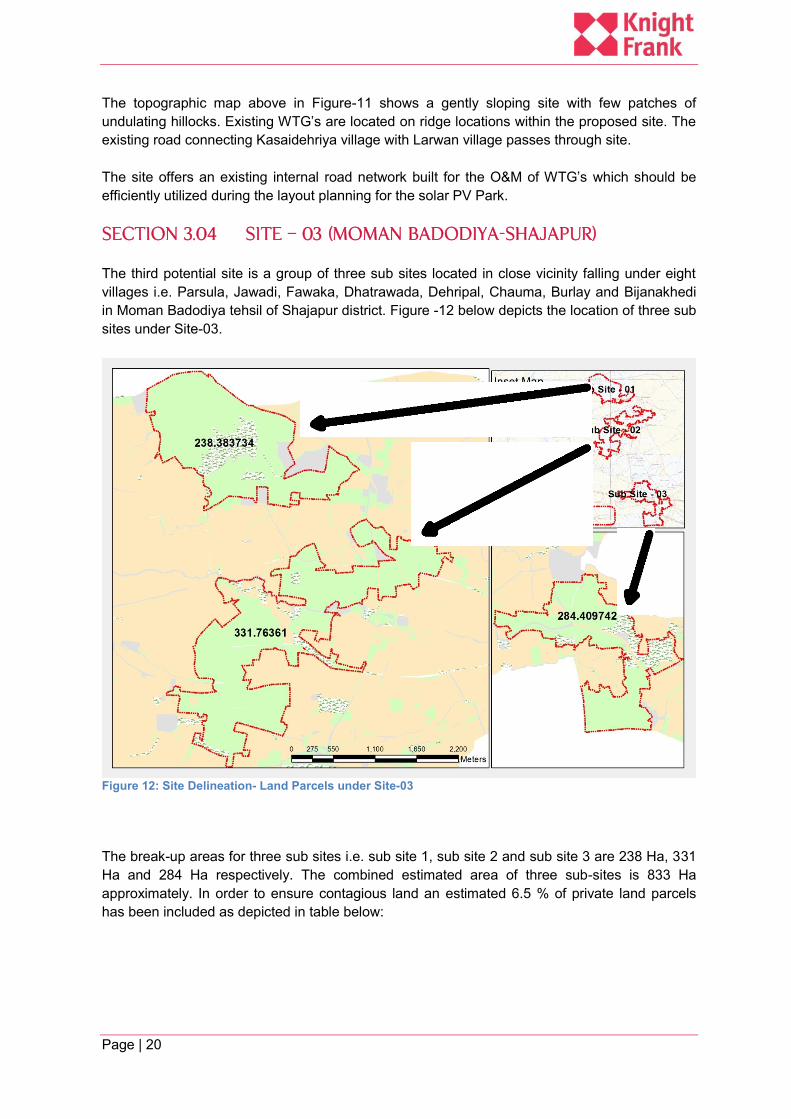
The topographic map above in Figure-11 shows a gently sloping site with few patches of
undulating hillocks. Existing WTG‟s are located on ridge locations within the proposed site. The
existing road connecting Kasaidehriya village with Larwan village passes through site.
The site offers an existing internal road network built for the O&M of WTG‟s which should be
efficiently utilized during the layout planning for the solar PV Park.
Section 3.04 Site – 03 (Moman Badodiya-Shajapur)
The third potential site is a group of three sub sites located in close vicinity falling under eight
villages i.e. Parsula, Jawadi, Fawaka, Dhatrawada, Dehripal, Chauma, Burlay and Bijanakhedi
in Moman Badodiya tehsil of Shajapur district. Figure -12 below depicts the location of three sub
sites under Site-03.
Figure 12: Site Delineation- Land Parcels under Site-03
The break-up areas for three sub sites i.e. sub site 1, sub site 2 and sub site 3 are 238 Ha, 331
Ha and 284 Ha respectively. The combined estimated area of three sub-sites is 833 Ha
approximately. In order to ensure contagious land an estimated 6.5 % of private land parcels
has been included as depicted in table below:

Page | 21
Table 8: Details of Land Parcels for Potential Site-03 in Shajapur District
Village
Name
Govt Parcels Private
Parcels
Community
Forestry
/Horticulture
Grazing Land Others Total
Count Area Count Area Count Area Count Area Count Area Area
Parsula 47 110.75 1 0.7 0 0 5 24.04 6 1.46 136.95
Jawadi 7 16.79 0 0 0 0 2 18.47 4 12.94 48.2
Fawaka 5 17.1 3 5.52 0 0 0 0 0 0 22.62
Dhatrawada 25 158.88 12 2.77 0 0 10 42.14 12 11.16 214.95
Dehripal 51 128.92 20 11.15 1 9.44 0 0 7 10.17 159.68
Chauma 5 30.5 11 8.92 0 0 4 13.76 2 2.15 55.33
Burlay 10 63.87 2 5 0 0 0 0 4 2.44 71.31
Bijanakhedi 33 70.41 19 19.91 0 0 13 27.31 6 6.74 124.37
Total Area 183 597.22 68 53.97 1 9.44 34 125.72 41 47.06 833.41
% Age 71.7% 6.5% 1.1% 15.1% 5.6%
The collation of P2 data available online on the MP land records portal reveals that there are
327 land parcels in total having an area of 833 Ha. However out of the total 327 land parcels,
not all land parcels may be available. The land parcels which might have issues include:
Table 9: Land allocated to other departments including patta land
Ownership Village Khasra No Area (Ha) Count Total Area (Ha)
Horticulture Dept Dehripal 1/1/MIN-19 9.44 1 9.44
GAIL India Ltd. Dhatrawada 83--1 0.05 3 0.18
Dhatrawada 83-2-MIN-1 0.03
Dhatrawada 4--2 0.1
Indian Gas Godown Dhatrawada 82 0.3 1 0.3
Mining Jawadi 295 0.63 7 8.57
Fawaka 818 4.18
Dhatrawada 84 1.25
Dehripal 339 0.42
Chauma 525 0.41
Bijanakhedi 44 0.63
Bijanakhedi 45 1.05
Govt. Patta Parsula 978-1 0.19 21 9.87
Parsula 978-2 0.36
Parsula 978-3 0.36
Parsula 978-4 0.36
Parsula 978-5 0.6
Parsula 978-6 0.36

Page | 22
Ownership Village Khasra No Area (Ha) Count Total Area (Ha)
Parsula 978-7 0.36
Parsula 978-8 0.6
Parsula 978-9 0.36
Parsula 978-10 0.36
Parsula 978-11 0.36
Parsula 978-12 0.36
Parsula 939-1 0.6
Parsula 939-2 0.6
Parsula 939-3 0.6
Parsula 939-4 0.6
Parsula 939-5 0.6
Parsula 939-6 0.6
Parsula 939-7 0.6
Parsula 939-8 0.6
Parsula 939-9 0.35
Topographically, the site is gently sloping with well-defined non-perennial channels as visible in
Figure 13 below. The contour intervals vary from 430 meters to 440 meters for most of the
potential site. The southern end of the proposed site exist a small hillock with a spot height of
482 meters. North of sub site -3 is a major water body / earthen check dam which acts a major
source of water for the locals for irrigation / other household and livestock requirements.
Figure 13: topographic map site 03

Page | 23
The preliminary site visits conducted by the consultant‟s team to validate the land cover and
other environmental and social key indicators if reflected in the subsequent baseline report
chapters. Below figure – 14 depicts the key visual observations for Site-03
Figure 14`: key site observations - site -03

Page | 24
CHAPTER IV. SOCIAL & ENVIRONMENTAL BASELINE
Section 4.01 Location Attributes – Climatic Parameters
The study area forms part of the Malwa region and experiences „semi-arid‟ to dry weather
conditions. Winter season lasts from December to February followed by summer months from
March till mid of June. The normal maximum temperature is the highest during the month of
May, ranging from 410
C to 430
C. The minimum temperature is recorded during the month of
January which ranges from 110C to 13
0C.
The monsoon season is from middle of June to September (south-west monsoon season) and
October to December is the North-East Monsoon. The normal annual rainfall received in the
study region is 1020.2 mm. The area receives maximum rainfall during its south – west
monsoon period. About 92.3% of the annual rainfall is received during south – west monsoon
period. Average Rainfall in last 10 year is 894.9 mm and highest rainfall was 1513.6 mm in
2006-07. Average height of the district above mean sea level is 453 meters approximately.
During the south- west monsoon season the relative humidity generally exceeds 88% (July /
August month). The rest of the year is drier. The driest part of the year is the summer season,
when relative humidity is less than 33%. April is the driest month of the year.
The wind velocity is higher during the pre-monsoon period as compared to post-monsoon
period. The maximum wind velocity observed is 27.0 km / hr during the month of June and
minimum 7.1 km/hr during the month of November. The average normal annual wind velocity of
Shajapur district is 15.9 km / hr.
Section 4.02 Solar Resource Potential
Solar radiation which we receive as heat and light can be converted to useful thermal energy or
for production of electricity either through solar photovoltaic route or through solar thermal route.
Availability of reliable solar radiation data is vital for the success of solar energy installations in
different sites of the country. For solar collectors which are flat in nature, solar radiation data in
the form of Global Horizontal Irradiance (GHI) is useful whereas for solar collectors which are
concentrating in nature Direct Normal Irradiance (DNI) data is required.
Solar Global Horizontal Irradiance (GHI) is the total amount of shortwave radiation received
from above by a surface horizontal to the ground. This value is of particular interest to
photovoltaic installations and includes both Direct Normal Irradiance (DNI) and Diffuse
Horizontal Irradiance (DHI). Figure-1 below depicts the annual GHI value range for the
proposed sites.
Most of the areas in selected districts receive sunlight for about 300 days in a year with 8 hours
of daily sunshine. Though the climate and weather patterns are strongly influenced by the
monsoon cycles, the overall very good solar irradiance makes PV an attractive generation
option. For most of the shortlisted potential sites, the annual GHI values is above 5.65
KWh/m2/day as also reflected in the Figure -15 below.

Page | 25
Figure 15: Annual GHI Values for potential sites
Section 4.03 Land Aspects
The informal consultations carried out by the consultant‟s team for the three potential sites
reveals that the majority of the families fall under the marginal / small land holdings category in
these villages.
For site -01 (consisting of 4 villages) the average land holdings varies from 4 to 8 bigga1 per
family. The average monthly earning as reported during the informal consultations ranges from
INR 2000 to INR 3500 per family. More than 65% of the families in these villages are
categorized as BPL families, with villages like Umariya reporting 90% of the families listed under
the BPL category.
For site -02 (consisting of 7 villages) the average land holdings varies from 4 to 6 bigga in most
of the villages except Daupada which is mainly occupied by locally known as “Banjara
Community”. The residents of Daupada work as daily wagers in agricultural fields and as other
unskilled labour in nearby Agar town. As an alternative source of livelihood, the families own
cattle, buffalo and goat mainly for milk supply for commercial sale. The Pipaliyakalan talab
(permanent water body) is abutting the village Daupada which acts as a main source of water
for the villagers and in meeting livestock requirements.
1 1 Hectare = 5 Bigga.

Page | 26
For Site -03 (consisting of 8 villages) the average land holding size varies from 2 to 8 bigga per
family in most of the villages. Double crops per year are harvested in all these villages. The
average monthly earning in majority of the villages is INR 4000 to INR 6000 approximately. The
BPL families accounts for 60 to 80% of the total families in these villages. Not many village
students opt for higher education and get involved in the agricultural activities.
The subsequent sub sections provide an assessment of the land holding pattern in the selected
tehsils under which the potential sites are located.
(a) LAND HOLDING PATTERN – SUSNER TEHSIL
There are a total of 111 inhabited villages in Susner tehsil. The total geographical area of the
Susner tehsil is 622.24 sqkm, whereas the geographical area of selected four villages is
2878.10 Ha approximately.
Table 10: Land Holding Pattern in Susner Tehsil- Agar District
SUSNER Scheduled Tribes Scheduled Caste Other Holdings Total Holdings
Size of Holding (in
ha.) Number Area Number Area Number Area Number Area
Below 0.5 100 30 1,296 435 4,707 1,376 6,103 1,840
0.5-1.0 111 80 1,385 976 5,523 3,000 7,019 4,056
1.0-2.0 116 161 1,375 1,831 5,626 7,961 7,117 9,953
2.0-3.0 36 88 306 707 2,677 6,559 3,019 7,354
3.0-4.0 18 61 84 262 1,323 4,622 1,425 4,945
4.0-5.0 13 62 57 243 847 3,753 917 4,057
5.0-7.5 - - 25 142 891 5,312 916 5,454
7.5-10.0 1 8 4 33 271 2,315 276 2,356
10.0-20.0 - - 3 36 142 1,843 145 1,879
20.0 & ABOVE - - - - 7 1,843 7 1,843
ALL CLASSES 395 490 4,535 4,664 22,014 38,584 26,944 43,738
The break-up of land-holdings clearly shows
50% of the land holdings are less than 1 Ha
and only 5% of the land holdings are above 5
Ha. Similar trends are also reflected in the case
of scheduled caste and tribes‟ population as
depicted in the table above
(b) LAND HOLDING PATTERN – AGAR TEHSIL
The total geographical area of Agar tehsil is 676
sqkm approximately. There are a total of 137
villages falling under Agar tehsil of which 7
villages have been shortlisted for the proposed
solar PV Park. The total geographical area of
Page | 27
these villages is 2290.6 Ha.
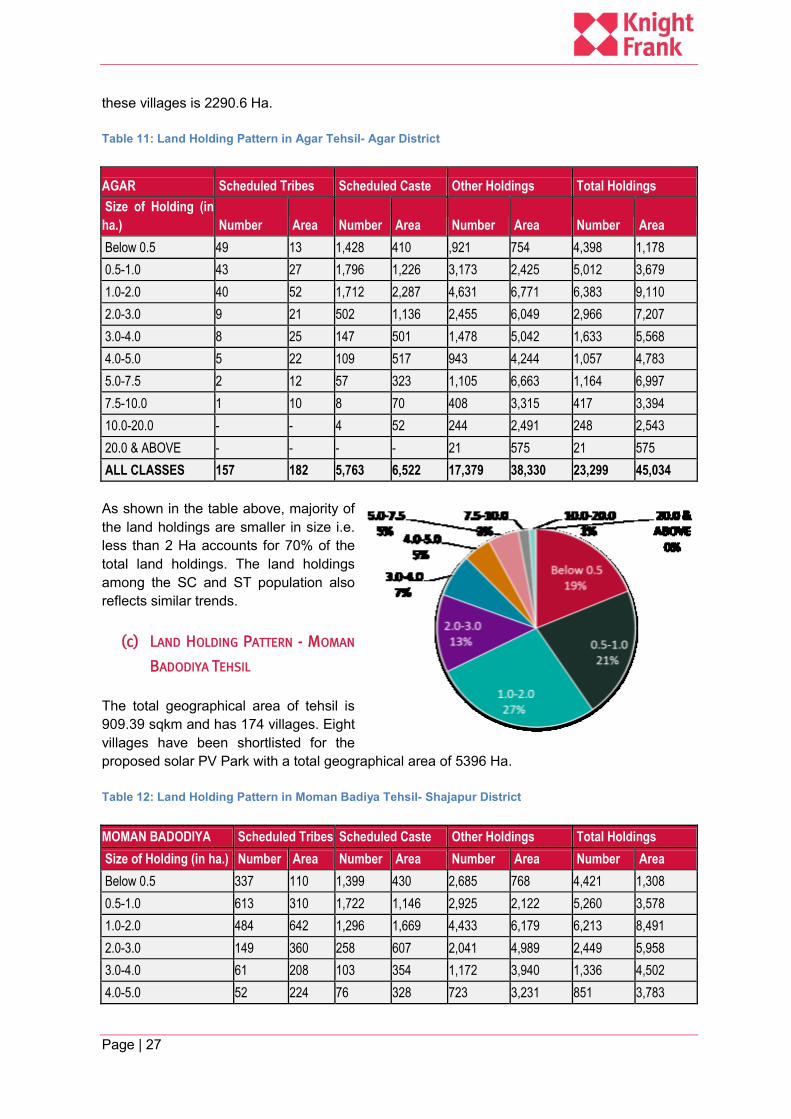
Table 11: Land Holding Pattern in Agar Tehsil- Agar District
AGAR Scheduled Tribes Scheduled Caste Other Holdings Total Holdings
Size of Holding (in
ha.) Number Area Number Area Number Area Number Area
Below 0.5 49 13 1,428 410 ,921 754 4,398 1,178
0.5-1.0 43 27 1,796 1,226 3,173 2,425 5,012 3,679
1.0-2.0 40 52 1,712 2,287 4,631 6,771 6,383 9,110
2.0-3.0 9 21 502 1,136 2,455 6,049 2,966 7,207
3.0-4.0 8 25 147 501 1,478 5,042 1,633 5,568
4.0-5.0 5 22 109 517 943 4,244 1,057 4,783
5.0-7.5 2 12 57 323 1,105 6,663 1,164 6,997
7.5-10.0 1 10 8 70 408 3,315 417 3,394
10.0-20.0 - - 4 52 244 2,491 248 2,543
20.0 & ABOVE - - - - 21 575 21 575
ALL CLASSES 157 182 5,763 6,522 17,379 38,330 23,299 45,034
As shown in the table above, majority of
the land holdings are smaller in size i.e.
less than 2 Ha accounts for 70% of the
total land holdings. The land holdings
among the SC and ST population also
reflects similar trends.
(c) LAND HOLDING PATTERN - MOMAN
BADODIYA TEHSIL
The total geographical area of tehsil is
909.39 sqkm and has 174 villages. Eight
villages have been shortlisted for the
proposed solar PV Park with a total geographical area of 5396 Ha.
Table 12: Land Holding Pattern in Moman Badiya Tehsil- Shajapur District
MOMAN BADODIYA Scheduled Tribes Scheduled Caste Other Holdings Total Holdings
Size of Holding (in ha.) Number Area Number Area Number Area Number Area
Below 0.5 337 110 1,399 430 2,685 768 4,421 1,308
0.5-1.0 613 310 1,722 1,146 2,925 2,122 5,260 3,578
1.0-2.0 484 642 1,296 1,669 4,433 6,179 6,213 8,491
2.0-3.0 149 360 258 607 2,041 4,989 2,449 5,958
3.0-4.0 61 208 103 354 1,172 3,940 1,336 4,502
4.0-5.0 52 224 76 328 723 3,231 851 3,783

Page | 28
MOMAN BADODIYA Scheduled Tribes Scheduled Caste Other Holdings Total Holdings
Size of Holding (in ha.) Number Area Number Area Number Area Number Area
5.0-7.5 19 114 43 259 760 4,611 822 4,985
7.5-10.0 11 92 5 43 282 2,434 299 2,577
10.0-20.0 5 58 6 73 167 2,143 181 2,306
20.0 & ABOVE - - - - 17 444 17 444
ALL CLASSES 1,731 2,118 4,908 4,909 15,205 30,862 21,849 37,931
The tehsil shows similar land holding trend wherein
smaller / marginal land holdings account for
majority among the total land holdings. Only 10%
of the land holdings are larger than 5 Ha.
(d) LAND VALUES AND ECONOMIC POTENTIAL OF
LAND
The agricultural land parcels in vicinity of all the
three proposed sites are fairly fertile and fall under
the double croplands. Water scarcity is an issue
that has its impacts during the peak summer
months.
The market value of land parcels in the area varies for three sites. Site -01 consisting of four
villages, the average land values for irrigated land varies from 2.0 to 2.5 lakhs per bigga. For
site -02 the land values range from 2.5 to 3.5 lakhs per bigga for irrigated land parcels
particularly in villages Madhopur and Bijankhedi. For site-03 the land values range from 5 to 2.5
lakhs per bigga for irrigated land. The variations in land values are also due to the access from
the main road. Land parcels having direct access to the all-weather roads demand a higher
premium as compared to other land parcels.
Overall for all sites, land varies from 10 to 15 lakhs per hectare. The location proximity from all-
weather road, land fertility, location of water body within the parcel is some of the factors
affecting the land values.
(e) EXISTING LAND USE / LAND COVER
The analysis of the land cover map for proposed Site -01 as depicted below. The proposed sites
for solar PV parks are mainly barren / open scrub land parcels (accounting to more than 70% in
total in all three sites) and very few agricultural parcels have been shortlisted, thereby ensuring
that the likely impacts of loss of livelihood would be minimal.
Agricultural lands account for 8.5% of the total area in all three sites whereas grazing lands
forms a substantial 15% of the total area as per the P2 data available online for the potential
sites.

Page | 29
Landuse
Site 01 Site 02 Site 03
Area (Ha) % Area (Ha) % Area (Ha) %
Abadi 1 0.1% 3.83 0.5% 3.2 0.4%
Agricultural Land 99.08 12.0% 85.9 11.7% 70.24 8.4%
Barren Land 325.78 39.4% 485.87 66.4% 593.25 71.2%
Grazing Land 180.19 21.8% 116.39 15.9% 127.8 15.3%
Roads 1.79 0.2% 0.2 0.0% 24.21 2.9%
Community Forest / Panch Van 185.19 22.4% 14.95 2.0% 0.55 0.1%
Water Body 31.29 3.8% 15.35 2.1% 6.75 0.8%
Others 2.38 0.3% 8.88 1.2% 7.41 0.9%
Total 826.7 100.0% 731.37 100.0% 833.41 100.0%
Figure – 16 below depicts the land use / land cover data for the proposed site -01 and has been
derived from the open source data available online for India at 1:50,000 scale for year 2011-12.
(Source: http://bhuvan.nrsc.gov.in/gis/thematic/index.php)
Figure 16: Land Use / Land Cover data for Site -01
Similar land use / land cover classification is generated for site -02 and 03 wherein maximum
land selected for the proposed sites include barren / waste land / open scrub land as depicted in
Figure 17 and 18 below. The may be noted that the existing water bodies / major drainage
channels present within the proposed site shall be excluded during the site demarcation.

Page | 30
Figure 17: Land use Map Site 02
Figure 18: Land Use Map Site 03

Page | 31
Section 4.04 Transmission Lines
132KV sub station and transmission lines are in close vicinity to site -01 and site -02. The main
Nagda 400KV transmission line (power grid) is in close vicinity of the proposed site-03 as shown
in Figure 19 above.
Figure 19: Location of main power grid / state grid lines in vicinity of the proposed sites
Section 4.05 Socio – Economic and Demographic profile
(a) DEMOGRAPHIC PROFILE
The total population as per the census 2011 in all the selected villages (19 in all) is 21,594, with
an average household size of 4.55 (refer table below). Majority of the villages have population
less than 1500 except for Dehripal, Burlay and Chouma villages. The three villages with
population more than 1500 fall under proposed Site-03.
The average literacy level in the selected 19 villages is 56.5% for total population excluding 0-6
age group. Most of the villages in Site -01 and Site -02 have middle level school (upto 8th
standard) and an anganwadi as well. For higher education, students are going to Susner and
Agar town schools. For site -03, all villages have schools till 8th standard except for Burlay
village which has a high school.
64% of the total female population the selected villages are classified as illiterate as per census
2011 data.

Page | 32
Table 13: Demographic Profile for selected villages
Level Name TRU HH Size Total Population
Sex Ratio
Population in the age group 0-6
Literacy Rate
Literacy Rate - Female
SUB-DISTRICT
Susner Rural 4.79 112615 957 15988 59.36 45.06
VILLAGE Pipalya Nankar Rural 4.64 1323 972 186 47.23 34.68
VILLAGE Umariya Rural 4.52 610 877 71 55.66 39.69
VILLAGE Naharkheda Rural 5.17 1148 993 212 48.29 34.72
VILLAGE Palda Rural 5.04 837 1051 144 60.32 49.28
SUB-DISTRICT
Agar Rural 4.61 124960 948 19701 61.16 46.93
VILLAGE Bijnakhedi Rural 4.54 1216 990 169 59.41 47.98
VILLAGE Madhopur Rural 4.22 852 986 157 49.35 40.00
VILLAGE Kasai Dehariya Rural 4.37 651 915 88 62.70 47.17
VILLAGE Karwa Khedi Rural 4.09 715 833 106 51.23 31.75
VILLAGE Ladwan Rural 3.89 829 951 124 45.11 29.15
VILLAGE Dudhpura Rural 4.56 424 991 70 46.61 29.61
VILLAGE Pipalya Kumhar
Rural 4.41 631 901 88 57.83 37.35
SUB-DISTRICT
Moman Badodiya
Rural 5.01 115216 935 17194 65.84 51.04
VILLAGE Parsula Rural 4.85 1097 882 119 71.06 56.39
VILLAGE Fawaka Rural 4.38 1177 880 192 66.90 50.00
VILLAGE Dehripal Rural 4.59 2688 961 495 62.84 45.53
VILLAGE Chouma Rural 4.83 2625 952 426 62.76 48.68
VILLAGE Bijanakhedi Rural 3.89 781 928 110 60.21 38.75
VILLAGE Burlay Rural 5.10 1954 895 289 56.40 39.11
VILLAGE Jawadi Rural 4.81 880 872 147 50.89 34.83
VILLAGE Dhatrawada Rural 4.48 1156 1007 170 59.23 44.44
(b) MEDICAL AND HEALTH FACILITIES / SANITATION FACILITIES
There is practically no medical facility available in the selected villages except for anganwadi
centres in these villages where a female nurse generally visits once a week. For all the other
health related issues people have to travel to Agar, the nearest town & tehsil headquarter. The
information available from census 2011 reconfirms the above findings captured during the field
visits by the consultant‟s team.

Page | 33
Community Health Center
Primary Health Center
Sub PHC Maternity & Child Welfare
Hospital Dispensary Mobile Health Clinic
Palda No No No No No No No
Pipalya Nankar
No No No No No No No
Umariya No No No Yes No No No
Naharkheda No No Yes Yes No No No
Bijnakhedi No No No No No No No
Madhopur No No No No No No No
Kasai Dehariya
No No No No No No No
Karwa Khedi No No No No No No No
Ladwan No No No No No No No
Dudhpura No No No No No No No
Pipalya Kumhar
No No No No No No No
Fawaka No No No No No No No
Parsula No No No No No No No
Dehripal No No No No No No No
Chouma No No Yes No No No No
Bijanakhedi No No No No No No No
Burlay No No No No No No No
Jawadi No No No No No No No
Dhatrawada No No No No No No No
There are two veterinary hospitals located in the study area villages i.e. one each at
Naharkheda and Palda village.
Individual toilet blocks (connected to soak pits) were seen in most of the households in 8
villages falling under site – 03. However the usage of toilets is still lacking due to primeval
perceptions and resistance to change. Another major reason for the non-functioning toilets is
lack of availability of adequate water for flushing and cleaning requirements.
During the consultations in Site -01 and Site -02, most of the villages have reported 30% to 50%
households lacking individual toilets. Open defecation is quiet common in the study area.
(c) VULNERABILITY PROFILE
The district of Shajapur and Agar – Malwa have about 23% SC and 2.5% ST population within
the district. The selected villages have nearly insignificant ST population and nearly 25% of the
population falls under the SC category.
The table 15 below presents the vulnerability profile based on the social structure. The SC and
ST population accounts for nearly 29% of the total population in the selected villages. The ST
population accounts for only 1% of the total population, mainly concentrated in two villages i.e.
Parsula (Moman Badodiya) and Ladwan (Agar) villages.

Page | 34
Table 15: Vulnerability Profile for Villages under Potential Sites
Level Name TRU ST % SC % SC Person
SC Male
SC Female
ST Person
ST Male
ST Female
SUB-DISTRICT
Susner Rural 2.92 25.34 28538 14729 13809 3291 1664 1627
VILLAGE Pipalya Nankar
Rural 0.00 33.64 445 233 212 0 0 0
VILLAGE Umariya Rural 0.00 44.10 269 141 128 0 0 0
VILLAGE Naharkheda
Rural 0.00 29.18 335 167 168 0 0 0
VILLAGE Palda Rural 0.36 36.44 305 146 159 3 1 2
SUB-DISTRICT
Agar Rural 0.83 30.94 38668 19865 18803 1037 543 494
VILLAGE Bijnakhedi Rural 0.00 26.73 325 167 158 0 0 0
VILLAGE Madhopur Rural 0.00 11.27 96 46 50 0 0 0
VILLAGE Kasai Dehariya
Rural 0.00 30.26 197 99 98 0 0 0
VILLAGE Karwa Khedi
Rural 0.00 20.98 150 84 66 0 0 0
VILLAGE Ladwan Rural 5.79 57.66 478 242 236 48 27 21
VILLAGE Dudhpura Rural 0.00 0.24 1 1 0 0 0 0
VILLAGE Pipalya Kumhar
Rural 0.00 42.00 265 142 123 0 0 0
SUB-DISTRICT
Moman Badodiya
Rural 9.45 26.50 30537 15943 14594 10892 5590 5302
VILLAGE Parsula Rural 17.68 20.33 223 120 103 194 108 86
VILLAGE Fawaka Rural 2.38 34.75 409 209 200 28 19 9
VILLAGE Dehripal Rural 0.19 6.44 173 89 84 5 2 3
VILLAGE Chouma Rural 0.72 39.73 1043 529 514 19 9 10
VILLAGE Bijanakhedi Rural 0.00 14.08 110 50 60 0 0 0
VILLAGE Burlay Rural 0.00 33.01 645 344 301 0 0 0
VILLAGE Jawadi Rural 0.34 32.84 289 166 123 3 2 1
VILLAGE Dhatrawada
Rural 0.00 16.78 194 95 99 0 0 0
Informal consultations during the field visits by the consultant‟s team confirm that the reported
1% ST population in these shortlisted villages is part of the main stream community. No
traditional cultural practices are followed by ST population and are mainly working as
agricultural labourers in nearby fields.
All the selected villages have a high percentage (65-70%) of BPL families. Stray incidences of
girl child marriages have also been reported during discussions.
(d) OCCUPATIONAL / ECONOMIC PROFILE
The total work force participation rate in the project villages is 57.72% while the female work
force participation rate is 48.33%. However, it is important to understand and appreciate that
high workforce participation rates need not necessarily reflect the true picture with respect to the

Page | 35
economic status and the living index which is reflected through the status of housing in these
villages, where majority of the population lives in temporary (mud / thatched roofs) or semi-
pucca houses (brick walls / roof tiles).
The residents of villages in the study area are generally dependent on agriculture for their
livelihood. Dairy farming / cattle rearing are also practiced for supplementary family income.
There is no economic dependence on the designated forest areas in the vicinity of the
shortlisted villages. Tables below provide a distribution of total workers, main workers, marginal
workers segregated by gender.
Table 14: Total Worker Population
Name Population Population in the age group 0-6
Total Worker Population
WFPR
Total Female Total Female Total Female Total% Female%
Susner 112615 55060 15988 7731 62785 29121 64.98% 61.53%
Pipalya Nankar
1323 652 186 84 769 380 67.63% 66.90%
Umariya 610 285 71 28 375 161 69.57% 62.65%
Naharkheda 1148 572 212 114 650 304 69.44% 66.38%
Palda 837 429 144 84 443 216 63.92% 62.61%
Agar 124960 60823 19701 9506 61221 25088 58.16% 48.89%
Bijnakhedi 1216 605 169 86 669 323 63.90% 62.24%
Madhopur 852 423 157 68 364 123 52.37% 34.65%
Kasai Dehariya
651 311 88 46 232 41 41.21% 15.47%
Karwa Khedi 715 325 106 51 232 7 38.10% 2.55%
Ladwan 829 404 124 61 278 48 39.43% 13.99%
Dudhpura 424 211 70 32 233 116 65.82% 64.80%
Pipalya Kumhar
631 299 88 42 369 180 67.96% 70.04%
Moman Badodiya
115216 55667 17194 8173 57270 24467 58.43% 51.52%
Parsula 1097 514 119 60 613 281 62.68% 61.89%
Fawaka 1177 551 192 87 652 306 66.19% 65.95%
Dehripal 2688 1317 495 254 1189 462 54.22% 43.46%
Chouma 2625 1280 426 222 1152 436 52.39% 41.21%
Bijanakhedi 781 376 110 56 303 83 45.16% 25.94%
Burlay 1954 923 289 138 1059 487 63.60% 62.04%
Jawadi 880 410 147 54 485 240 66.17% 67.42%
Dhatrawada 1156 580 170 85 462 139 46.86% 28.08%
The table/graphs below present the breakup of the main workers under cultivators, agricultural
labourers, household and other category along with marginal workers. In terms of proportion,
46% main workers are male and 22% are female main workers of the total workers. Marginal
workers account for 32% of the total work force in selected villages.

Page | 36
Figure 20 Total Workforce segregated by gender
Figure 21: Distribution of Main workers segregated by gender
Among the main workers, 74% are classified as Male main cultivators and only 12% accounts
for Female cultivators. These mainly represent parcel owners where most of the family
members are involved in agriculture activity as was also observed during the field visits.
Table 15: Distribution of Total Main Workers and Marginal Workers
Name Total Workers %
Main % Main Cultivator Population Person
Main Agricultural Labourers
Main Household Industries
Main Other Workers
Marginal %
Susner Tehsil 64.37 64.366 23400 13701 304 3007 35.634
Pipalya Nankar 13.39 13.394 89 2 0 12 86.606
Umariya 70.40 70.400 220 38 1 5 29.600
Naharkheda 37.85 37.846 189 16 0 41 62.154
Palda 92.10 92.099 101 281 0 26 7.901
Agar Tehsil 70.26 70.263 19227 20060 270 3459 29.737
Bijnakhedi 91.18 91.181 487 117 0 6 8.819
Madhopur 93.41 93.407 80 259 0 1 6.593
Kasai Dehariya 99.57 99.569 67 145 0 19 0.431
Karwa Khedi 94.83 94.828 124 86 3 7 5.172
Ladwan 97.84 97.842 89 170 4 9 2.158
Dudhpura 94.42 94.421 117 103 0 0 5.579
Pipalya Kumhar 62.06 62.060 49 164 0 16 37.940
Moman Badodiya Tehsil
69.46 69.462 18263 17832 283 3403 30.538
Parsula 75.37 75.367 192 263 0 7 24.633
Fawaka 36.50 36.503 63 154 0 21 63.497
Dehripal 75.11 75.105 356 515 2 20 24.895

Page | 37
Name Total Workers %
Main % Main Cultivator Population Person
Main Agricultural Labourers
Main Household Industries
Main Other Workers
Marginal %
Chouma 94.27 94.271 204 770 10 102 5.729
Bijanakhedi 81.85 81.848 148 85 0 15 18.152
Burlay 56.94 56.941 267 312 0 24 43.059
Jawadi 27.63 27.629 74 43 1 16 72.371
Dhatrawada 69.91 69.913 176 110 0 37 30.087
There are a few registered SHG in these selected villages but not many of those are functional
as found during the informal consultations with the villagers.
(e) ASSETS OWNERSHIPS AMONG THE HOUSEHOLDS
LPG gas penetration for household cooking is limited in the study area and only
available in Palda, Bijnakhedi, Dehripal, Chouma and Burlay villages. On an average
only 2.5% of the families in these villages are using LPG for cooking. Fire-wood along
with cow dung cakes are the main source of fuel used for cooking.
32% of the families own a mobile phone whereas the penetration of landline phone is
only 2% in the selected villages.
As regards vehicle ownerships, less than 0.5% families own four-wheeler, 7% of the
families own motorized 2Wheeler / Scooter whereas the bicycle ownership is with 25%
of the families in the study area.
Computer / laptop penetration is limited to approximately 2% of the households in the
selected villages and only a few of these have internet connectivity.
70% of the households in the selected 19 villages are classified as semi-permanent type
structures, 10% temporary structures, 15% as permanent structures.
20% of the households are connected to the banking systems and availing services.
97% of the population does not have access to community / public toilets in the study
area as per Census 2011 data. The access to individual toilets in some of the villages
have improved post the “Swach Bharat Abhiayan (selected as a pilot district - Shajapur)”
launched by GoI however open defecation is still very prevalent in the study area.
All the 19 villages are connected by power supply; however 60% of the households
have electricity supply connections in these villages. Remaining households use
kerosene for lighting purposes.
State government has funded the installation of solar street lighting in these villages,
most of which are not functioning due to lack of maintenance.
Almost 56% of the household‟s females have to travel more than 500 meters for fetching
water for household needs.
Section 4.06 Geology of the Area
The oldest group of rocks comprising of Archaeans and Proterozoic formation constitute nearly
45% area of the State. The next younger formation of Carboniferous to lower Cretaceous
comprising Gondwana Super Group covers 10% area while the formation of Cretaceous to
Paleocene comprising mostly of Deccan Trap basalt constitutes 38% area of the State.

Page | 38
The potential sites form part of the deccan traps. The Deccan traps consist of massive basalt,
amygdaloidal basalt and agglomerate. The rock formation exposed in the district range in age
from Cretaceous to Holocene. They consist of deccan traps capped by laterite and alluvium.
The rocks in general are dark grey, fine to medium grained, massive, hard and compact,
sparsely to moderately porphyritic and are of blastic in composition.
Figure 22: Geological Characteristics
Occurrence of laterite is noticed in the west central and north-western parts of the district,
generally at 460m above msl. It is reddish or yellowish brown in colour with a purple tinge and
porus in nature.
Alluvium is well observed along the course of Kalisindh River in northern and southern part
parts of the district and along Lakunder River in south western corner of the district. It is
generally Yellowish /.greyish in colour, soft, unconsolidated, silty sand with kankar and pebbles.
Below figure depicts the permeability, bearing capacity and foundation characteristics for the
proposed sites. The potential sites have low permeability levels, the bearing capacity /
compressive strength is very high (1500 – 2900 kg/cm2) with excellent foundation
characteristics.

Page | 39
Section 4.07 Geo-morphology for the Project Sites
Figure 23: Geomorphology Map of the region
The district lies on a part of Malwa plateau at a general elevation between 335 and 608m above
msl with an elevation of about 275m. The entire district is characterized by a typical Trappean
geomorphology comprising extensive plain, low lying hills and hills clusters with gentle northerly
slope. Western, south, south-eastern parts are highly undulated with broad flat topped hills,
cluster terraces and isolated hills. A number of hills capped by laterite are noticed in the north-
western, western part. The central area is plain with scattered hillocks. The highest point of
elevation i.e. 608m above msl is a few kilometres south-west of Shajapur and the lowest part is
about 335m in the Kali Sind and Newaj river valleys. Bad land topography along small nalah
courses and scarp development upto maximum of 20m are quite common along the rivers. The
general slopes are from south to north marked by a number of small rivers which later join the
Kali Sind River.
The potential project sites area forms part of the Malwa plateau. The entire area is
characterized by a typical trappean geomorphology comprising extensive plains, low-lying hills
and hill clusters with gentle northerly slope. The proposed sites fall under the weathered basalt
as depicted in Figure-23 above.
Section 4.08 Soil Characteristics
The soil in Shajapur district is of mixed type and there is no distinct boundary in between any
two types of soils. A variety of soils are developed in the district. They are black cotton soils

Page | 40
overlaying the vesicular zone, greyish soil on massive basalt and reddish brown soil on laterite.
The district is devoid of any mineral of economic importance. There are three categories of soils
identified in the district area-
Black cotton Soil
These soils are dark grey to black in color, composed of clay and are plastic & sticky in nature.
These soils are fertile in nature and derived from decomposition of trappean rocks having
thickness of 15 cm to 2m. These soils cover major part of the district. Black cotton soils are
useful for cultivation and also serve as a zone for storage of ground water.
Lateritic soil
These soils consist of sandy loam to clayey loam and brick red to red in colour. These soils are
derived from weathered ferruginous basalt and are found around Agar and Barod blocks.
Alluvium soil
The alluvium is of mixed origin & comprises of silt & clay and admixtures of these in varying
properties. The occurrence of alluvium is confined to the bank of stream and rivers and usually
3 to 4m in thickness.
Section 4.09 Water Resources
Uncovered wells and hand pumps are the main source for rural water supply in the study area.
Among the 19 shortlisted villages, only two villages are connected by taped water supply i.e.
Bijankhedi and Burlay falling under Moman Badodiya Tehsil. A brief status of the ground water
and surface water resources is presented in below sub sections:-
(a) GROUND WATER AVAILABILITY STATUS
The depth to ground water level during 2012, pre-monsoon season was recorded between 6.90
to 23.4 m; whereas post monsoon trends for the same duration indicated between 1.07 to 15.08
m. Analysis of the long term data (2003 – 2012) ground water trends indicate that there is
declining trend in water level between 0. 1 to 0.17 m/year & rising trend ranges between 0.09-
0.11 m/year in different parts of the district.
In pre monsoon period, May 2012, depth to water level ranges between 6.90mbgl to 23.40
mbgl. The most part of the district have water level in the range of 8.0 to 12.0 m bgl during the
pre-monsoon water level.
During Post monsoon period November 2012, the water level ranges from 1.07 m bgl to 15.08
mbgl. It is observed that in most part of the district the water level lies within 5.00 mbgl.

Page | 41
Figure 24: Ground Water Potential for potential sites
The ground water development observed from central ground water report explains the criticality
of extraction of ground water in Susner and Moman Badodiya Tehsils. These Tehsils are
categorized under „Over Exploited‟ which infers that the ground water development is more than
100%. Agar Tehsil within the study zone is categorized under critical which indicates that the
ground water development ranges from 65% to 83%.
Ground water quality in the districts is generally medium to high saline as electric conductivity
values ranges between 825 – 2530 µS/cm. Saline water has also been reported in one of the
villages in vicinity of Site -3.
The detailed ground water availability and use for each of the Tehsils is shown in Table below:
Table 17: Ground Water Status for Tehsils
Tehsil Availability (ham)
Irrigation(ham)
Domestic& IndustrialWater Supply(ham)
All Uses (ham)
Provision for next 25 year(2033) (ham)
Availability for future (ham)
Stage of GroundWater Development (%)
Category
Su
sn er
Command - - - - - - -

Page | 42
Tehsil Availa
bility (ham)
Irrigation(ham)
Domestic& IndustrialWater Supply(ham)
All Uses (ham)
Provision for next 25 year(2033) (ham)
Availability for future (ham)
Stage of GroundWater Development (%)
Category
Area
Non-Command
9724 9870 311 10181
311 -457 105 Over Exploited
Block Total
9724 9870 311 10181
311 -457 105
Ag
ar
Command Area
3441 323 74 397 133 2985 12
Non-Command
7389 6384 295 6679 295 710 90 Critical
Block Total
10830 6707 369 776 428 3695 65
Mo
man
-Bad
od
iya
Command Area
- - - - - - -
Non-Command
12398 16650 470 17120
470 4722 138 Over Exploited
Block Total
12398 16650 470 17120
470 4722 138
Ground water in the district is generally medium to high saline as electric conductivity values
ranges between 825 – 2530 µS/cm. Constituents like Sulphate, Calcium and Magnesium were
within the safe limit for drinking water as per BIS standards. Nitrate in the ground water of
Shajapur is varying between 36- 270 mg/l. High nitrate in the village area appears due to
excessive use of fertilizers and agricultural waste. Ground water in the district at many places is
saline and due care is needed before its use.
(b) SURFACE WATER BODIES & DRAINAGE BASINS
The drainage pattern is dendritic to sub-dendritic with a moderate drainage density. The district
is devoid of any mineral of economic importance. The region has a height ranging from 350m to
450m mean sea level. Since, this region is a part of the upland many seasonal streams
originate in this zone and drains towards the north and east. Eastern part of the study zone
represents dissected topography where hills are eroded by streams. Northern part of the district
shows a plain topography along Kali Sindh River.

Page | 43
Figure 25: Drainage Map of the study area
Section 4.10 Flora and Fauna / Bio diversity
Presently study region is outside the purview of any Biodiversity rich sites as per the Madhya
Pradesh State Biodiversity Board. The site study zone does not have any designated forest
areas or critical forest areas for conservation as identifies by the central or state forest
department.
Human- animal conflicts leading to crops damage is reported in almost all the three proposed
sites. The wild animals from nearby forest areas are often spotted nearby agricultural fields //
village settlements during the morning hours or late evening / night time.

Page | 44
Figure 26: Map showing location of designated forest areas in vicinity of proposed sites
The proposed site -01 and site -02 have protected / reserved forests in its vicinity. Wild animals
like Nilgai, Hynea, monkeys, wild boar are frequently spotted during early morning or late
evenings / night time, near the agricultural fields. Instances of crop damage due to wild animals
are regular feature in the study area. No endangered species or critical habitats are located
within 10kms buffer of the proposed sites.
Among the shortlisted 19 villages, four villages have designated forest areas as depicted below:
Name of the Village Total Geographical Area Forest Area
Palda – Susner 801.75 Ha 81.42 Ha
Naharkheda – Susner 837.36 Ha 146.2 Ha

Page | 45
Name of the Village Total Geographical Area Forest Area
Madhopur – Agar 509.42 Ha 53.48 Ha
Dudhpura- Agar 482.09 Ha 117.04 Ha
The forest areas to the west of site-01 are part of the Vindhya Range in bordering Rajasthan
state. Based on the discussions with the local villagers in the study area and wild animals
spotted in Dag forest range (Jhalawar district) include
1. Indian Gazelle (Gazella gazella bennetti),
2. Indian wolf (Canis lupus pallipes),
3. Nilgai (Boselaphus tragocamelus),
4. Locally known as “Rojra”,
5. Peacock (Pavo cristatus)
6. Jungle cat (Felis chaus),
7. Fox / Desert fox (Vulpes bucapus),
8. Jackal (Canis aureus)
9. Common langur (Presbytis entellus)
None of these wild animals fall under the IUCN endangered / vulnerable / threatened species
list.
Section 4.11 Public Consultations
The consultant‟s team conducted informal consultations with the villagers in each of the clusters
to inform them about the upcoming solar PV parks and gain understanding of their views &
perceptions on the subject.
All the 19 villages are connected by power supply network, however the supply is erratic. During
the summer months the power supply varies from 4 to 10 hours a day and in winter months is
slightly better ranging from 7 to 16 hours. Power connections for agricultural and commercial
connections are also available. The main crops (double cropping mostly) grown in the study
area includes Soyabean, Makka, Channa, Wheat and Jawar. Wells and tube wells act as a
major source of irrigation with very minor irrigated water supplied via tanks / lakes / canal
network in the study area.
Following are the key observations, which were discussed during the various informal
consultations:
Table 16: Public Consultation Summary
Date Location Participant Key Observations
7.03.17
and
8.03.17
Cluster 1
Susner
Tehsil
(Multiple
locations)
120
Male: 80
No major concerns by the respondents concerning the proposed
solar park in the vicinity.
Respondents anticipate the solar park to bring overall development
in the area
Respondents expect better power supply in their villages post the
commissioning of these projects in lieu of land acquisition.
Villagers anticipate better employment opportunities due to coming

Page | 46
Date Location Participant Key Observations
Female: 40 of these projects.
The majority of patta lands allotted are non-fertile parcels. Such
families would be given preference for employment in these
upcoming projects.
Water scarcity during peak summers is an issue. The ground water
is at 400 to 500 feet bgl. Extraction of water by contractors for
construction etc activities would lead to conflicts.
Animals like Nilgai, Hyena, Wildboar, Monkey etc from nearby
forest areas area are a cause of concern due to crop damage
There are two seasonal water bodies around cluster 1 namely
Naharkheda and Umariya talab. River in proximity of 2Km is
Kanthali river
09.03.17
and
10.08.17
Cluster 2
Agar Tehsil
(Multiple
locations)
100
Male: 65
Female: 35
No major concerns of the respondents concerning the proposed
solar park in the vicinity, however due to bitter experience faced
during installation of previous wind power projects (SUZLON);
there is a poor response to the private land acquisition under the
proposal.
Villagers expect better power supply in their villages post the
commissioning of these proposed projects.
Lack of grazing land for the cattle has been a concern raised by
the villagers. With these Solar PV plants the grazing lands would
reduce further.
Villagers feel that the private land acquisitions would also lead to
loss of livelihood for the landless labourers.
Agriculture is the only major occupation in the study area. Training
for alternative livelihood options should also be provided to the
villagers to improve per capita incomes.
Crop damage due to wild animal‟s movement from nearby
designated forest area is also reported from these villages.
Few villages under ITC scheme have implemented watershed
management to improve green cover and fodder generation.
Majority of government owned hand pumps are dysfunctional and
require repairing.
Pipaliyakumar water body is one of the large scale water body in
vicinity to the identified land parcel
11.03.17
and
12.03.17
Cluster 3
Moman
Barodiya
Tehsil
(Multiple
locations)
200
Male: 130
Female: 70
No major concerns of the respondents concerning the proposed
solar park in the vicinity
Respondents anticipate the solar park to bring overall development
in the area
Respondent also anticipate job opportunities
No issues regarding domestic violence or gender bias experienced
in the area
Lack of grazing land for the cattle
None of the Self Help Groups are operational except for the one
preparing food for the „Madhyan Bhojan‟ (Mid-day Meal) of
Anganwardi.
Apart from agriculture, 10-15% of the village income source is from

Page | 47
Date Location Participant Key Observations
selling 200 liter/day milk to the government and private dairies.
Water scarcity during peak summers as ground water is at 300 to
400 feet bgl
Ground water quality is saline at few locations
Animals like Nilgai, Wildboar, Hyena, Monkey etc of nearby forest
are a cause for damaging crop
Burlay tank is one of the main water body in this area and the river
in immediate vicinity is Lakhundar River.
Hamlets near river Lakhundar face flooding issues during peak
monsoon
The respondents in all the above villages do not have any objections to the upcoming solar PV
projects but do expect better development of the area in terms of better facilities, job
opportunities and alternative livelihood options. Some of the respondents did express
apprehensions on private land acquisitions and its likely negative impacts related to loss of
livelihood. Agriculture remains the primary source of livelihood in all the selected villages.
Water is a scarce resource particularly during the peak summer months and may pose
challenges during the project construction and operations phase. Human – animal conflict is
quite evident from the reported instances of crop damage.
Section 4.12 Physical & Cultural Resources
There are three temples in the vicinity of the proposed sites which hold local significance as
shown on the map below. None of these religious structures are likely to be impacted by the
proposed solar PV projects.

Page | 48

Page | 49
CHAPTER V. CONCLUSIONS
The subsequent sections summarizes the findings of the baseline study along with the
identification of detailed studies that would be required for a detailed assessment of the likely /
anticipated adverse impacts due to the proposed projects.
(a) SUB PROJECT ACTIVITIES AFFECTING THE NATURAL PHYSICAL ENVIRONMENT
Information/Checklist confirmation Status Detailed Information
Preliminary secondary data related to soil quality and its bearing strength
Yes
Secondary data available has been included in the report
State / National Boundaries Yes Site is approx. 20 Kms away from the state boundary of Rajasthan
Addition of new features to topography due to project
Yes Built structures including sub stations, internal road networks, fencing of the site boundaries etc shall lead to certain changes in topography.
Anticipated underground works Yes Actions related for digging:
Tube wells / bore wells
Transmission towers
Anticipated changes in existing drainage pattern
Yes Site clearing & grubbing operations, setting up of infrastructure facilities should ensure that natural drainage channels are not altered / blocked except for minor alterations.
Land Reclamation works No
Identification of erosion prone areas No The review of secondary data on soil / geological characteristics doesn‟t suggest any erosion prone areas.
Change in Land cover due to project Yes From current scrub land / agricultural / fallow land parcels will change to industrial use (white industry) within the site extents
Site prone to any natural hazard No
Activities changing hydrology or water courses or aquifers
No
Water quality characteristics and its availability
Yes Ground water quality fit for human consumption
Any order/policy specific to the site No
(b) PROJECT ACTIVITIES AFFECTING THE BIOLOGICAL ENVIRONMENT
Information/Checklist confirmation Status Aerial distance (within 10 km) of proposed-project
location boundary
Vicinity to National Park, Wildlife Sanctuary,
Reserved forests, woodland, protected
forests
Yes Agar Tehsil –Ahir Barariya Reserve Forest under „Open Scrub‟ classification (1Km away from site)
Susner Tehsil- is Khanota Reserve Forest under „Open Scrub‟ classification (1-2Km away from site)
Vicinity to Migratory bird routes No
Site in vicinity to congregator areas (nesting,
roosting, breeding, foraging)
No
Vicinity to sensitive flora, fauna No
Areas already subjected to pollution or
environmental damage
No

Page | 50
Information/Checklist confirmation Status Aerial distance (within 10 km) of proposed-project
location boundary
Vicinity to eco-sensitive areas (wetlands,
CRZ, water course, mountains etc)
Yes Agar: 1.5 Km (approx.) away from Ahu River 0.7Km (approx.) away from Pipaliyakumar Talab
Susner: 2 Km away from Kanthali River
Moman Barodiya: Lakundar River is 2km away from site
Presence of endangered species / habitat
areas
No
Vicinity to island, coastal marine or
underground water
No
Loss of any native species or genetic
diversity
No
Any season specific issues with site
regarding ecological functions
Yes Ground water resources are critical and inadequate
during peak summer season.
(c) PROJECT ACTIVITIES AFFECTING THE VISUAL ENVIRONMENT
Information/Checklist confirmation Status Aerial distance (within 10 km) of proposed-
project location boundary
Area with Outstanding Natural Beauty (ANOBs)
or Natural Heritage sites
No
Area with Archaeological importance No
Area with high scenic value No
Existing viewpoints/ pause points No
(d) PROJECT ACTIVITIES AFFECTING THE SETTLEMENT / INFRASTRUCTURE
Information/Checklist confirmation Status Details thereof (quantification wherever possible) with
source of information data
Settlement area/Built up environment
in vicinity / distance
Yes Susner: site surrounded by 4 villages
Agar: site surrounded by 7 villages
Moman Barodiya: site surrounded by 8 villages
Agricultural land/land under livelihood
(area in Hectare)
Yes The potential sites excludes any habitations areas, however
some private land has been included to maintain continuity of
proposed site.
Type of crops grown / number of crops grown in a year
Yes Mainly double crop are cultivated - Soyabean, Chana, Wheat,
Jawar and Corn
Source of Irrigation Yes Wells and bore wells account for major source of irrigation.
Drinking water sources Yes Groundwater – hand pumps
Sensitive receptors Yes Anganwadi and upto 8th standard government schools are
located in all the selected villages. As these are located within
the “Abadi Area” no impacts are anticipated.
Religious –Physical Resources Yes All settlements have their temples with in the village, apart from
them there are three famous temples in vicinity of high
importance approx. 5-8km away namely Baijnath Temple, Shiv-
Toda temple and Devnarayan Temple
Community-Physical Resources Yes Two Temples hold Annual Fair these are 5-8Km away from

Page | 51
Information/Checklist confirmation Status Details thereof (quantification wherever possible) with
source of information data
site, namely Baijnath and Shiv-toda temples.
Underground utility lines like electricity
lines, pipelines for gas, etc
Yes Existing GAIL Gas pipeline in Moman Barodiya only
Defence Installations / Airport Routes No
Likely damage to existing
infrastructure, public utilities, amenities
etc.
No
Presence of Indigenous / vulnerable
communities
No
New or diverted transmission lines due
to the project
No
(e) PROJECT ACTIVITIES AFFECTING THE SOCIAL ENVIRONMENT
Information/Checklist confirmation Status Aerial distance (within 2 km) of proposed-project location
boundary
Land area under private ownership Yes 6-8% of the land identified is under private ownership
Land area under government
ownership
Yes 90% of land under government ownership
Any litigation pending on project or
land involved (provide details)
No No information available under public domain
Land area under various land-uses
(area in Hectare)
Yes Agricultural land parcels - 8 – 9%
Barren Land parcels - 72%
Grazing Land parcels - 15%
Water Bodies / lakes - 1%
Road Networks - 3%
Land under temporary or permanent
acquisition or lease
Yes 186.82 Ha (falling under 126 parcels) for permanent acquisition
Presence of Indigenous People No
Involuntary resettlement requirements Yes 186 Ha to be acquired and also patta land owners need to be relocated / compensated.
Any Social conflict between
stakeholders
No
Employment opportunity for people
residing in vicinity
Yes There will be employment generation for the villagers in vicinity
during the construction phase and maintenance phase
Women empowerment (employment
opportunities for women of the area)
Yes Strengthen the Self-Help-Groups and involving women in
decision making during local discussions
Any loss / reduction of access to
traditional dependent communities (to
areas where they earn for their primary
or substantial livelihood).
Yes The percentage of people practicing agriculture and grazing on
the identified private land parcels of the site
Any adverse impacts on women,
including economic and safety
concerns
No
Involuntary land taking resulting in loss
of income; livelihood; sources of
Yes 186 Ha of land to be acquired including agricultural land

Page | 52
Information/Checklist confirmation Status Aerial distance (within 2 km) of proposed-project location
boundary
livelihood; loss of access to common
property resources and / or private
residential and/or property resources.
Any specific gender issues No
Possible conflicts with and/or disruption
to local community
No
Significant issues raised by the
stakeholders during consultation
Yes Need for sufficient grazing land.
Water conservation to meet the peak summer demand

Page | 53
Annexures