barriers to energy-efficient investments
TRANSCRIPT
1
Barriers to energy-efficient investments
in the glassmaking industry
Patrik Lundmark and Viktor Bergman
Halmstad University, Halmstad, Sweden
School of Business and Engineering, 2011
ABSTRACT
The purpose of this paper is to present the barriers to energy-efficient
investments (EEIs) and give reasons to their existence in the marketplace.
Furthermore, this paper sets out to investigate what barriers to energy-
efficient investments are present for Pilkington Floatglas AB, a firm
operating in the glassmaking industry in Halmstad, Sweden. Findings
suggest that five barriers act as hinders to energy-efficient investments for
Pilkington, where the two most influential barriers are technological
uncertainty and economic uncertainty.
1. INTRODUCTION
In 1983 the United Nations formed The
World Commission on Environment and
Development (WCED). In 1987 the
WCED published the report called Our
Common Future, probably more known as
the Brundtland Commission report. In this
report it was clearly stated that more focus
had to be put on incorporating
environmental concerns into strategic
decision making. Additionally, along with
the report came the establishment of the
term “sustainable development” which in
turn made scholars start discussing how to
make corporations integrate environmental
strategies into their strategic management.
The Brundtland Commission report
marked the start for the acceleration of
environmental awareness. In the late
1980’s more and more firms started to feel
the pressure from environmentally
concerned customers and started looking at
enhancing their environmental
responsibility by lowering their impact on
the environment by assessing their
operations and procedures (Kleiner, 1991).
Soon companies and researchers realized
that implementing green strategies into
strategic decision making could result in
financial benefits (Porter & van der Linde,
1995; Shrivastava, 1995). Some
researchers even went to the extent to say
that incorporating environmental strategies
would result in win-win situations where
trade-offs between environmental
commitment and economic gains do not
exist (Porter & van der Linde, 1995). Other
researchers positioned themselves on the
complete opposite of the scale. Their view
was that even though win-win
opportunities could arise, the most
common outcome of environmental
enhancing projects would be great losses in
investment capital since the environmental
V. Bergman and P. Lundmark Barriers to energy-efficient investments
2
goals that are reached usually do not result
in the same amount of financial returns
(Walley & Whitehead, 1994). Recent
studies support booth arguments.
Nidumolu, Prahalad and Rangaswami
(2009) mentions in their study that they
believe there is no alternative to
sustainable development and companies
need to take it into consideration in all
stages of their business model. Even so,
they have found that it is a common view
among companies that the more
environment-friendly they become, the
more these efforts will add costs that will
not yield financial benefits in the future.
Large firms such as 3M early realized the
importance of greening the organization
and took measures to ensure that their
practices were introduced throughout the
entire organization. After its introduction
30 years ago, 3M’s Pollution Prevention
Pays program has saved 3M over 2.6
billion pounds by reducing pollutants in
their operations (Lubin & Esty, 2010).
Motivated by factors such as increased
competitive advantage, legitimation and
ecological responsibility more and more
firms have started greening their
organization (Danjelico & Pujari, 2010).
Today, the environment has become a
mainstream issue. A large number of
organizations have a formal or informal
sustainability policy (Ecomarkets
Summary Report, 2009) and a growing
number of customers are asking for
environmentally friendly products. As
firms have been taking measures to deal
with their environmental performance,
both pro-actively and forced to by laws and
regulations, the focus of the sustainability
issue has also changed. Today, one of the
most highlighted areas in the
environmental literature is energy and how
firms can become more energy-efficient.
The direct correlation between energy use
and cost has made energy efficiency an
attractive area of improvement for many
businesses and due to the increase in
energy prices in the past, energy efficiency
has become an increasingly important area,
especially for firms operating in energy
intensive industries. Between 1997 and
2011 the electricity prices in Sweden for
firms in energy intensive industries (i.e.
firms using more than 300 000 MWh per
year) more than doubled, reaching 60
öre/KWh as the average price in the first
half of 2011 (Energipriser SCB, 2011).
The price of light crude oil has increased
even more during the same period,
reaching 75 USD per barrel by the end of
2009 from 1997’s level of approximately
20 USD per barrel, a price increase of
275%. The price of coal reached a record
level of 220 USD per tonne in 2008 and
the price of natural gas has increased with
roughly 70% since 1997 (Energy in
Sweden, 2010).
The deregulation of the Swedish energy
market in 1996 has since then made it
increasingly integrated with the Nordic
electricity market and the EU. Not
surprisingly, energy efficiency has
increased rapidly in importance not only in
Sweden, but also internationally and in the
EU.
The growth in world energy use is
estimated to be nearly 50 percent from
2009 through 2035 where non-OECD
(Organization for Economic Cooperation
and Development) economies, e.g. China
and India, are expected to drive most of the
growth as their energy use increase by 84
percent (Annual Energy Outlook, 2011).
V. Bergman and P. Lundmark Barriers to energy-efficient investments
3
During Sweden’s presidency of the EU in
late 2009, the focus was set on how to
combat climate issues and enhance EU’s
competitiveness by switching to an eco-
efficient economy and improvements in
energy-efficiency had a high priority on
the agenda (Energy in Sweden 2010). In
June 2010, the European Council decided
to implement a new strategy for the EU
with the three key areas being energy,
innovation and efficient use of resources.
This strategy, referred to as “Europe
2020”, has set it targets to ensure
improvements by 20% in the efficiency of
energy use for year 2020. Furthermore,
discussions are in progress within the EU
to increase these targets to 30% for the
period after 2012 (Energy in Sweden
2010).
Today, about 20% of the energy
consumption in the EU can be accounted
for by industry. The progress in energy-
efficiency in the industrial sector has led to
a reduction of energy use by 30% over the
last 20 years but many cost-efficient
investment opportunities still exist in this
sector (EU energy efficiency plan 2011).
The energy efficiency gap
When estimating the economic value of an
investment, firms often use the net present
value (NPV) as an indicator of the
investment’s economic potential. A
positive net present value indicates a
profitable investment and should,
according to economic theory, be
undertaken by the firm as long as there is
no opportunity cost (i.e. there are limited
resources and another project has a higher
projected NPV) and the project carries an
acceptable risk. However, many
investments in energy-efficiency are
unrealized even though they very often
have a positive net present value and are
economically viable to the firm, not to
mention other positive effects such as
better environmental performance
(Abdelaziz, Saidur, & Mekhilef, 2011).
Research has shown that there is a gap
between the current level of investments in
energy-efficiency and a higher, still
economically profitable level, a
phenomenon referred to in the literature as
“the energy efficiency gap”.
Why is that?
First, it is important to point out that the
diffusion of a superior (economically or
other quality) technology always follows
an s-shaped curve with a gradual diffusion
over time, and although they might present
obvious advantages to the current
technology they are not necessarily
diffused rapidly or, in some cases, diffused
at all (Rogers, 2003). Moreover, much of
the early literature on energy-efficiency
has been criticized for its simplified
assumption that firms always take rational
decisions (Jaffe and Stavins, 1994;
DeCanio, 1993) and for the existence of
“low hanging fruits in energy saving” (van
Soest & Bulte, 2001). The neo-classical
view assumed that all investments with a
positive NPV should be realized by the
firm. However, this oversimplified view
led researchers to identify other important
determinants or barriers beyond the
standard NPV and cost of capital
calculations (DeCanio & Watkins, 1998)
and divide these barriers between market
failure explanations of the energy-
efficiency gap, and non-market failure
explanations (i.e. the rational decisions for
the firm) of the energy-efficiency gap in
V. Bergman and P. Lundmark Barriers to energy-efficient investments
4
order to identify what barriers could be
improved by, for example, governmental
policies, and what barriers are actually
optimal from the point of view of the
energy user (Jaffe & Stavins, 1994).
The purpose of the present paper is to
present the barriers to energy-efficient
investments (EEIs) and give reasons to
their existence in the marketplace.
Furthermore, this paper sets out to
investigate the influence from the barriers
to energy-efficient investments for
Pilkington Floatglas AB, a firm operating
in the glassmaking industry in Halmstad,
Sweden.
2. LITERATURE REVIEW
2.1 Economic barriers
There are many economic factors that
firms take into consideration when
deciding whether or not to invest in cost-
effective and energy-efficient technologies,
as with any other investment opportunity.
Firstly, lack of access to capital act as a
barrier for many firms to undertake an
energy-efficient investment (Rohdin,
Thollander, & Solding, 2007). Also, many
firms fear that the costs will be too high for
such an investment, which will be reflected
as a price raise for the end product and in
turn make the firm less competitive on the
market (Sardianou, 2008). Other economic
barriers are the internal rivalry between the
different profitable investments the firm
can choose from (Groot, Verhoef, &
Nijkamp, 2001) and the bureaucratic
procedures to get financial support for
EEIs (Sardianou, 2008). Some investments
are never realized simply because there are
other investments that are more important
(Groot, Verhoef, & Nijkamp, 2001).
Heterogeneity
For the reason that firms are heterogeneous
it also holds true that a given technology,
which is cost-effective on average, will
most likely not be so for all firms. A
technology which is cost-effective in an
energy-intensive industry might not be
cost-effective for firms in less energy-
intensive industries, or even provide all
firms in the energy-intensive industry with
the same cost advantage (Jaffe & Stavins,
1994). This is also in line with traditional
diffusion theory which stress that the same
innovation must not be equally desirable to
all potential adopters, as each adopter’s
situation differs (Rogers, 2003).
Principal / agent dilemma
A principal/agent problem arises when the
potential adopter is not the one who pays
the energy bill and, hence, must find a way
to recover the investment from the one
who enjoys the cost reduction (Jaffe &
Stavins, 1994). For this reason,
investments in energy-efficiency are not
optimally diffused since the person who
pays cannot enjoy the benefits from such
an investment. Schleich and Gruber (2008)
found this principal/agent dilemma for
firms renting their space, as this, not
surprisingly, had a negative effect on
energy-efficiency investments.
Insufficient information
Firms tend to under-invest in information
since information can be easily spread to
more people at no additional cost
(Schleich, 2009). Similarly, when adopting
a technology gives away information,
firms also tend to under-invest in such
V. Bergman and P. Lundmark Barriers to energy-efficient investments
5
activities (Jaffe & Stavins, 1994).
Insufficient access to information on
possible energy-efficient investments is for
this reason one of the explanations to the
existence of market failure barriers leading
to sub-optimal investments in energy-
efficiency (Groot, Verhoef, & Nijkamp,
2001).
The better the diffusion of information in a
sector or region, the more it facilitates
firms’ undertakings in energy-efficiency
(DeCanio & Watkins, 1998). Some sectors,
such as the German commercial and
services sub-sectors, show that lack of
information on energy efficiency measures
is not a wide spread problem for firms
according to their own perception
(Schleich, 2009). However, the problem
with insufficient information is not only
sector dependent but, rather, dependent on
the firms’ commitment to investments in
human capital. Therefore, firms can
increase the possibilities of obtaining
information on energy-saving technologies
by investing in skilled and high-educated
personnel (Sardianou, 2008). Large firms
that invest a great deal and are faced with
competition has been found to possess a
higher level of knowledge as competition
works as an incentive for firms to obtain
strategic information (Groot, Verhoef, &
Nijkamp, 2001). Moreover, firms with
high energy cost related to their total cost
are more likely to be informed about
potential energy-efficient investments
(Sardianou, 2008). For mentioned reasons,
it is not surprising that the information gap
tends to be larger in small firms spending
relatively little on investments and not
faced with much competition (Groot,
Verhoef, & Nijkamp, 2001).
As is shown in DeCanio & Watkins (1998)
article, successful diffusion on energy-
saving technologies can actually provide
win-win benefits for taxpayers, consumers
and shareholders. Firms participating in a
voluntary program on energy-reduction
were able to reduce their energy, in a
profitability manner, without any
deterioration of the working environment.
This was made possible through an
information diffusion program where the
EPA (United States Environmental
Protection Agency) acted as a
clearinghouse for information provided by
a cluster of participating firms, allies and
technical expertise.
Another information-barrier which was
found to be present in one third of the 16
sub-sectors on the German commercial and
services sector is lack of information about
energy consumption patterns (Schleich,
2009). The information barrier can also
manifest itself as a gap for the buyers of
the firm’s energy-efficient products. For
example, when each European motor
manufacturer classified their own engines
in accordance to their own criteria, as well
as using different energy efficiency
measures, it created a great deal of
confusion for the customers who were
incapable of comparing and evaluate the
range of options available to them
(Almeida, 1998).
Undesirable attributes in new
technology
Another explanation and potential non-
market failure stems from the fact that new
technology usually holds different
attributes than the current technology
which could be an obstacle to optimal
diffusion. One example is the difference in
hue between the older generation of light
V. Bergman and P. Lundmark Barriers to energy-efficient investments
6
bulbs, the incandescent lighting, and the
new generation of light bulbs, the
fluorescent lighting. Consumers were slow
to accept the new technologies replacing
the incandescent light bulbs and one of the
main complaints were the difference in
glow between the amber glow of the
incandescent light bulbs and the harsher
and greener glow of the fluorescent
lighting (Jaffe & Stavins, 1994).
Uncertainty of technology
There are certain barriers of uncertainty
related to any new technology in energy-
efficiency, such as uncertainty of its
performance (van Soest & Bulte, 2001)
and risks for production disruption
(Rohdin, Thollander, & Solding, 2007).
Depending on the cumulative experience in
the existing technology, a change to a new
and unfamiliar technology could carry
hidden costs such as education of the staff
and new measurement systems (Mohr,
2002). Another barrier is the fact that
certain technologies can only be
implemented after the current technology
has been replaced (Groot, Verhoef, &
Nijkamp, 2001). Also, difficulties in
monitoring energy consumption of the
purchased equipment create a barrier to
EEI (Rohdin, Thollander, & Solding,
2007). A more general barrier is the
uncertainty regarding the quality of the
new technology (Groot, Verhoef, &
Nijkamp, 2001).
Economic uncertainty
Uncertainty is an important factor in
energy-efficient investment decisions and
it is related to both uncertainty of the
technology (van Soest & Bulte, 2001) and
uncertainty about future energy prices
(Jaffe & Stavins, 1994). Even if investing
in a particular technology would be cost-
effective it might be optimal to postpone
this investment if the energy prices
fluctuate randomly and the new technology
replaces a current one, since it may turn a
profitable situation into an unprofitable one
if the energy prices would fall after the
new technology has been adopted (van
Soest & Bulte, 2001). Therefore, it is
important to consider the opportunity cost
for an immediate investment in new and
more energy-efficient technology, as it
might be more cost effective to postpone
such an investment on behalf of the current
technology. This holds true when the
investment is (at least partly) irreversible
as it would commit the firm to the new
technology. In other words, postponing an
investment today, although profitable,
could lead to an even better investment
opportunity in the future (van Soest &
Bulte, 2001; Jaffe & Stavins, 2004).
Therefore, uncertainty should not be
considered a barrier, but a rational way for
firms to account for future volatility in
energy prices or unexpected negative
performance in the technology.
Hidden costs
Hidden costs, or costs of adoption, such as
information acquisition (e.g. of the
technology or the suppliers) and the
compatibility of new technology for the
firm must be evaluated and embedded into
the calculation. Such transaction costs,
although frequently overlooked, can prove
to be significant to the investment in the
new technology (Jaffe & Stavins, 1994). In
fact, for firms spending relatively little on
energy in general, the costs for adoption,
such as information acquiring and
implementation costs of the new
technology can often succeed the amount
V. Bergman and P. Lundmark Barriers to energy-efficient investments
7
saved on electricity which creates a barrier
to investing in new technology (Groot,
Verhoef, & Nijkamp, 2001).
2.2 Organizational barriers
Split incentives
In economics, one often refers to the firm
as one entity, with the objective to
minimize costs and/or maximize profits.
However, this theoretical simplification is
not practical when we wish to study why
firms repeatedly avoid investment
opportunities in energy-efficiency, even
though it would be profitable to the firm.
Instead, we need to realize that the firm is
a collection of individuals and the
decisions are, therefore, the product of
interpersonal communication. The
decisions are shaped by the rules,
conventions and policies of the firm, as
well as from the environment in which it
operates. Consequently, the action of the
firm might be less than optimal when the
individuals in the firm have split incentives
and are, primarily, looking after their own
interests (DeCanio, 1993). An example
where split incentives might hinder the
optimal diffusion of energy-efficient
investments is the managers who have
limited time in their post (e.g. due to job
rotation) and, therefore, have limited
incentives for long-term investments
(Schleich, 2009; DeCanio, 1993).
Departments in larger organisations might
also have limited incentives for energy-
efficient investments if the gains from such
investments could not be linked directly to
them (Schleich, 2009).
Internal priority
Studies show that energy efficiency is most
often a low prioritized area for the upper
management, as it is often not seen as a
strategically important area (DeCanio,
1993). Furthermore, this barrier is often
underestimated in the organization when it
comes to internal priority to planned
projects (Schleich, 2009). Such internal
priority setting barriers can stem from the
lack of capital (Schleich & Gruber, 2008)
or the fact that energy conservation is seen
as a peripheral business activity and the
personnel instead focus on their daily
activities (Sardianou, 2008). It also relates
to the power-structure between groups or
individuals in the firm. The potential
influence a group has stems from its formal
authority and access to scarce resources
and information. If energy management
which usually has relatively little formal
authority in a firm also lacks the support
from upper management and has low
access to capital, it creates an
organizational barrier to energy-efficient
investments (Sorrell et al, 2000).
Time constraints
Lack of time is another important
organizational constraint which hinders
employees from staying updated on
technical information, to identify
opportunities for economically viable
energy-efficient investment and to
implement projects in energy-efficiency
(Sorrell et al, 2000).
2.3 Behavioural barriers
Bounded rationality
Furthermore, when a decision-maker lacks
the ability (i.e. cognitive limitations) and
resources (e.g. information and time) to
arrive at an optimal solution, he or she
instead tend to look for a satisfactory
solution to the problem. This concept is
V. Bergman and P. Lundmark Barriers to energy-efficient investments
8
referred to as bounded rationality.
(DeCanio, 1993). Even with the
assumption that the decision-maker has no
limitation in cognitive abilities, or lack of
resources, and therefore can operate to
arrive at optimal solutions with the
available information (an opposing idea to
“bounded rationality”, referred to as
“rationality as optimization”) there is still
the possibility that restrictions on
information availability or differences in
underlying interests among the individuals
of the corporation can lead to failure for
organization to maximize profits and/or
minimize costs (DeCanio, 1993). An
example of bounded rationality, from the
end-users’ point of view, is taken from the
French motor market where customers
typically must rely on “rule of thumb”
estimations due to the difficulties for them
to have access to all the information they
need to arrive at an optimally satisfying
solution. As a rule of thumb the customers
typically buy the same type and brand as
the motor which they wish to replace, from
the retailer closest to them (Almeida,
1998).
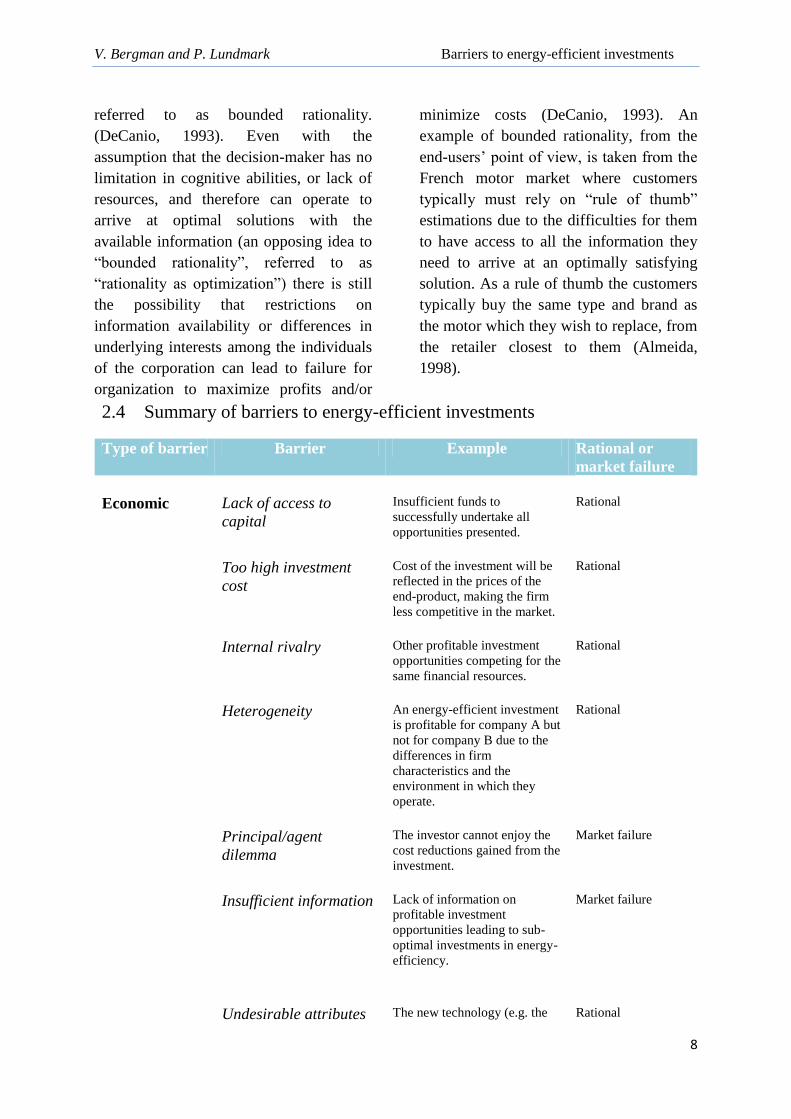
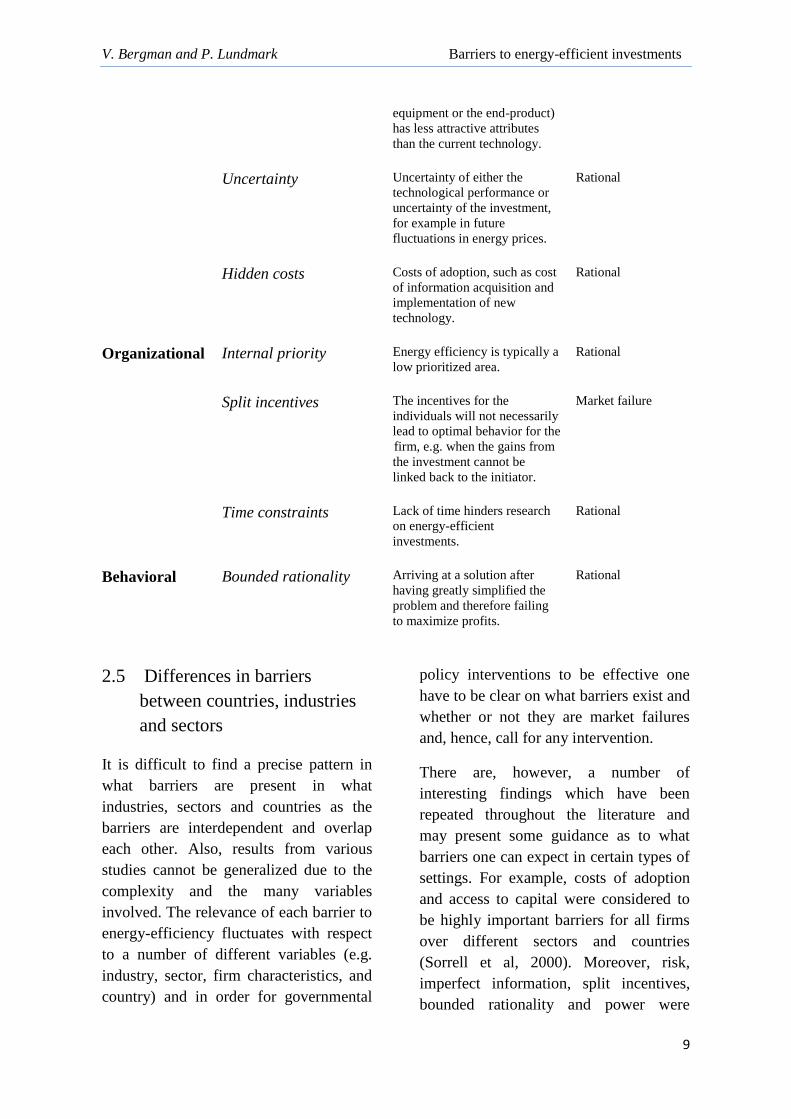
2.4 Summary of barriers to energy-efficient investments
Type of barrier Barrier Example Rational or
market failure
Economic Lack of access to
capital
Insufficient funds to
successfully undertake all
opportunities presented.
Rational
Too high investment
cost
Cost of the investment will be
reflected in the prices of the
end-product, making the firm
less competitive in the market.
Rational
Internal rivalry Other profitable investment
opportunities competing for the
same financial resources.
Rational
Heterogeneity An energy-efficient investment
is profitable for company A but
not for company B due to the
differences in firm
characteristics and the
environment in which they
operate.
Rational
Principal/agent
dilemma
The investor cannot enjoy the
cost reductions gained from the
investment.
Market failure
Insufficient information Lack of information on
profitable investment
opportunities leading to sub-
optimal investments in energy-
efficiency.
Market failure
Undesirable attributes The new technology (e.g. the Rational
V. Bergman and P. Lundmark Barriers to energy-efficient investments
9
equipment or the end-product)
has less attractive attributes
than the current technology.
Uncertainty Uncertainty of either the
technological performance or
uncertainty of the investment,
for example in future
fluctuations in energy prices.
Rational
Hidden costs Costs of adoption, such as cost
of information acquisition and
implementation of new
technology.
Rational
Organizational Internal priority Energy efficiency is typically a
low prioritized area.
Rational
Split incentives The incentives for the
individuals will not necessarily
lead to optimal behavior for the
firm, e.g. when the gains from
the investment cannot be
linked back to the initiator.
Market failure
Time constraints Lack of time hinders research
on energy-efficient
investments.
Rational
Behavioral Bounded rationality Arriving at a solution after
having greatly simplified the
problem and therefore failing
to maximize profits.
Rational
2.5 Differences in barriers
between countries, industries
and sectors
It is difficult to find a precise pattern in
what barriers are present in what
industries, sectors and countries as the
barriers are interdependent and overlap
each other. Also, results from various
studies cannot be generalized due to the
complexity and the many variables
involved. The relevance of each barrier to
energy-efficiency fluctuates with respect
to a number of different variables (e.g.
industry, sector, firm characteristics, and
country) and in order for governmental
policy interventions to be effective one
have to be clear on what barriers exist and
whether or not they are market failures
and, hence, call for any intervention.
There are, however, a number of
interesting findings which have been
repeated throughout the literature and
may present some guidance as to what
barriers one can expect in certain types of
settings. For example, costs of adoption
and access to capital were considered to
be highly important barriers for all firms
over different sectors and countries
(Sorrell et al, 2000). Moreover, risk,
imperfect information, split incentives,
bounded rationality and power were
V. Bergman and P. Lundmark Barriers to energy-efficient investments
10
considered to be of high importance to a
large number of the investigated sectors
and countries (Ibid).
Energy-intensive industries
Firms in energy-intensive industries tend
to display the least amount of barriers
(Schleich, 2009; Schleich & Gruber,
2008) due to the fact that they can put
more resources into energy-efficiency,
due to the highly economic potential in
energy-saving measures. Industries with
high energy costs, relative to their total
costs, are also more likely to be informed
on energy reducing measures (Sardianou,
2008). Since companies operating in
energy-intensive industries (e.g. iron and
steel, mineral processing and pulp and
paper), have a strong economic incentive
to cut costs in energy use they tend to be
informed and updated on potential
energy-efficient investments (Schleich &
Gruber, 2008). Not surprisingly, one of
the strongest drivers for firms in energy-
intensive industries is the potential cost-
savings resulting from using less energy
(Groot, Verhoef, & Nijkamp, 2001).
Compatibility problems when installing
new technology to fit with the current
one, due to lack of capable employees,
internal knowledge or physical space
were identified as the organizational
barriers hindering EEIs in the energy-
intensive horticulture sector (Groot,
Verhoef, & Nijkamp, 2001). In the
energy-intensive Swedish foundry
industry one highly relevant barrier was
found to be limited access to capital,
together with barriers such as technical
risk (risk of production disruptions) and
lack of budget funding (Rohdin,
Thollander, & Solding, 2007).
3. METHOD
Scientific View
The purpose of this thesis is to uncover
what barriers may exist towards
implementing energy savings. The
authors of this thesis undertook an
interpretative stance since many of the
interview questions require the
interviewee to interpret the situation
through the lens of social actions and its
subjective meaning. Therefore this work
is in some ways linked to interpretivism
which according to Bryman and Bell
(2007) puts an emphasis in understanding
the human behavior, rather than explain
it.
Research Approach
The research in this paper will be an
iterative process, referring to a mixture
between a deductive and inductive
process (Bryman and Bell, 2007). While
the authors of this paper take a deductive
approach as a foundation there might be
reasons to take an inductive approach
when drawing conclusions and generating
theories based on the data collected. The
resulting process will therefore inevitably
end up as an iterative process because of
the need to sometimes add more theory
during the period of the data collection.
The authors of this paper would therefore
suggest the reader to see our chosen
research approach as a tendency rather
than an absolute distinction because of the
complications to occasionally make a
distinction between the two approaches
(Ibid).
Research Strategy
A qualitative research strategy has been
chosen for this paper. A qualitative rather
V. Bergman and P. Lundmark Barriers to energy-efficient investments
11
than a quantitative research strategy was
based on a few factors. Firstly, a
qualitative research strategy allowed the
authors to get closer to the interviewee’
and, as Bryman and Bell (2007) explains,
this provided the researchers an
opportunity to investigate and understand
the social world from the interviewee’s
point of view. Secondly, a qualitative
research strategy provide the researchers
with more flexibility in the research
process, a more open mind to the research
area and an opportunity to more easily
follow up with questions when interesting
aspects might present themselves (Ibid).
Thirdly and last, the time aspect for this
paper does not make it equally suitable
for a quantitative research strategy since
this would have required longer time to
collect questionnaires from interviewees
and to send out follow up questions.
Research Design
The authors of this paper found it most
appropriate to intensively examine one
object of interesting, as this correlates
well with a qualitative research strategy,
though one needs to be careful not to
associate specific research designs with
the choice of research strategy (Bryman
and Bell, 2007). There are two methods
one can use when analyzing only one
case: longitudinal design and case study
design. The longitudinal research design
involves a higher investment in time, as it
requires the researcher to collect data on
at least two occasions (Ibid). It was
therefore more suitable with a case study
design for this thesis.
Research method
The data for this paper was provided
through a semi-structured interview. This
gave the interviewers more flexibility
when asking questions and made it easier
to penetrate interesting areas as the
interview went on. With two authors
conducting the interview, there was the
opportunity for one researcher to take
notes, observe body language and
reactions from the respondents and fill in
with questions when needed. A set up
with two interviewers can also contribute
to a more informal atmosphere, as
mentioned by Bechofer, Elliot and
McCrone (1984) in Bryman and Bell
(2007).
The authors used an audio recorder during
the interview. As mentioned by Bryman
and Bell (2007), this is helpful when
conducting semi-structured interviews
since many questions will be generated
and further developed during the process
of the interviews.
A copy of the questionnaire used for the
interview can be found as an appendix
following this paper.
Company background
The case study
The purpose of this paper is to identify
what barriers are relevant, and for what
reasons they might exist, for a specific
firm, through a qualitative research study
approach. For this reason, the authors of
this paper found it interesting to look at a
firm with unique and distinctive qualities,
as it would not be possible to generalize
the results from a study using only one
firm. For the same reason, the choice of
industry was made between energy-
intensive firms and firms using small
amounts of energy. For this paper, the
authors had the opportunity to investigate
V. Bergman and P. Lundmark Barriers to energy-efficient investments
12
Pilkington Floatglas AB in Halmstad, an
energy-intensive firm operating in the
glassmaking industry under very
company specific conditions. The
information was gathered through an in-
depth interview with Lars Andersson,
environmental manager at Pilkington
Floatglas AB, as well as from company
documentation.
Float glass
In 1952, Sir Alastair Pilkington
revolutionized the glassmaking industry
by introducing the float glass process
(also known as the Pilkington process).
This innovative approach to manufacture
sheets of glass produced a higher quality
glass in a more economical way and is
now the world standard for production of
high quality glass (Company introduction,
Pilkington webpage, 2011). The market
demand for float glass has been exceeding
the market growth for the last 15 years.
Reason for this is the increasing use of
glass in architecture, as well as in the
automotive industry (where the use of
glass in vehicles has increased by 50%
the last 35 years) (Unpublished
information folder, Pilkington, 2011). The
growth is also driven by the recent
economic growth as well as the
regulations and legislations concerning
safety, noise abatement and the growing
need for energy-efficiency and energy-
conservation. Therefore, the demand for
value-added glass is growing at a faster
pace than basic glass (NSG Annual
Report, 2010).
Pilkington and the NSG Group
Pilkington operates in the glassmaking
industry and is one of the world’s largest
manufacturers of glass and glass products
for the building and the automotive
industry. Pilkington was founded in 1826
and was a privately owned firm until
1970 when it was introduced at the
London stock exchange (Unpublished
information folder, Pilkington, 2011). In
2006, Pilkington became a subsidiary
company to its then much smaller
competitor, NSG Group (Nippon Sheet
Glass), which is a Japanese glass
manufacturer listed on the Tokyo stock
exchange. Today, the NSG Group
employs 29300 people, with sales in 130
countries and manufacturing operations in
29 countries (about NSG Group, 2010).
NSG Group has large shares of the
markets in the building and automotive
industry and had sales of 4707 million
euro in 2010 (NSG Annual Report, 2010).
44 per cent of the sales are in Europe, 29
per cent in Japan and 13 per cent in North
America and 14 per cent from the rest of
the world (NSG Annual Report, 2010). In
the building industry and automotive
industry, NSG Group operates under the
Pilkington brand, while the specialty glass
business operates under the NSG Group
brand. Pilkington Floatglas AB, located in
Halmstad, Sweden, was the first float
glass factory in the Nordic region when
the production started in 1976. It
currently employs approximately 290
people (Pilkington in Sweden, Pilkington
webpage, 2011).
Over the past years, the NSG Group has
strengthened its commitment to
sustainability. They have set a number of
sustainability targets to reach by 2015 and
have also appointed their first Director of
Sustainability in 2010. In the area of
energy efficiency, the following targets
have been set:
V. Bergman and P. Lundmark Barriers to energy-efficient investments
13
Energy: “Report specific direct energy
usage for eight key products, across all
three business lines, and demonstrate
improvement by 2015.”
Product development: “Report energy
payback/life cycle analysis for eight key
products, across all three business lines,
and demonstrate improvement by
2015.”(NSG Sustainability Report, 2010)
As the targets are very general, little can
be evaluated before the data on these
improvements are presented in 2015.
Pilkington Floatglas AB in Halmstad, is a
member of the voluntary state program,
PFE (Programmet för
energieffektivisering), which is a program
directed towards firms in energy-intensive
industries. This program creates an
opportunity for firms to improve on their
energy usage by contributing with
information and knowledge on energy-
efficient improvements. Successful
members of the program, i.e. those who
can map out their energy usage, introduce
an energy management system and
implement suggested changes to improve
upon their energy use, can enjoy a tax
reduction on the energy taxes from 0,5
öre/kWh to 0 öre/kWh.
Float glass production is a highly energy-
intensive industry as it involves the
melting of raw materials at high
temperatures. The float glass production
line is running non-stop for 11 to 15 years
and produces approximately 6000
kilometers of glass per year. The most
energy consuming component of the
production line at Pilkington in Halmstad
is the oven, which uses about 99.5 percent
of the total use of the non-renewable
energy resources (i.e. natural gas, oil, and
diesel) and about 60 percent of the total
electricity used. The total energy use per
year for Pilkington Floatglas in Halmstad
is approximately 0.5 TWh or 1.8
Petajoule (PJ) of energy. To give an
example of the energy consumption at
Pilkington one can equal the energy
consumption of two households per year
with the energy consumption at
Pilkington per hour. The total energy
consumption by the NSG Group in 2009
was 53.17 PJ and was comprised of
natural gas (32.7 PJ), heavy fuel oil (11.2
PJ), diesel oil (0.8 PJ), liquid petroleum
gas (0.5 PJ) and electricity (8.0 PJ).
Compared to 2008, this was a reduction in
energy usage by 10 percent (NSG
Sustainability Report, 2010).
Pilkington / the NSG Group “defend” the
high use of energy in their processes by
highlighting how their products contribute
to energy conservation and energy
efficiency:
The ‘energy balance’ between the
manufacture of high-performance glazing
products and their use means that the
energy used and CO2 emitted in
manufacture are quickly paid back
through the lifetime of most of our
products (NSG Sustainability Report,
2010). Moreover, NSG/Pilkington
emphasize their focus on providing its
customers with energy-efficient solutions,
as can be read under the sustainability
agenda of NSG’s annual report:
“Glass has a major part to play in
society’s efforts to reduce greenhouse gas
emissions and to mitigate the effects of
climate change. We aim to be the global
leader in innovative high-performance
glass and glazing solutions, contributing
V. Bergman and P. Lundmark Barriers to energy-efficient investments
14
to energy conservation and generation,
working safely and ethically”
Pilkington has three product categories of
value-added glass where energy
conservation and energy efficiency are
the key elements of the product. Firstly,
thermal insulation glass reduces the
amount of energy lost through the
windows as well as using the heat energy
from the sun efficiently. Secondly, solar
control glass can be used to minimize
solar heat gained where it is likely to pose
a problem, such as in warmer climates
and for larger facades of glass. This in
turn helps to minimize the need for air
conditioning systems and thereby reduce
energy usage. Lastly, the solar energy
glass which is a high quality glass used to
convert solar energy into electricity.
Although this paper focus on energy-
efficiency in the production of Pilkington,
Halmstad, we found it worth to highlight
this other aspect of energy-efficiency, as
it is a complementary area when looking
at how firms deal with energy efficiency.
4. FINDINGS & ANALYSIS
Pilkington has no lack of possibilities to
invest in energy saving technology. Since
they voluntarily participate in PFE,
“Programmet För Energieffektivisering”
(the program for energy efficiency), they
take responsibility to seek out and
perform upgrades within the area of
energy savings. According to our
interviewee there is no lack of resources
to invest in energy saving technology, ”as
long as it can be financially motivated we
often invest” he says. This finding
suggests that there are no barriers related
to lack of funding. Although the literature
has suggested that this barrier is often
relevant, also for firms operating in
energy-intensive industries (e.g. Rohdin,
Thollader & Solding, 2007; Sardianou,
2008), it is not a barrier for Pilkington in
Halmstad, due to the financial strength of
the NSG Group.
Lars Andersson explains that in many
cases they might find themselves looking
at more than one possible new
investment. However, there have been
situations where Pilkington has chosen
not to invest even though the investment
was beneficial from an energy
perspective. One example of this, that the
interviewee mentions, is the melting oven
that is used to melt all the components
into liquid glass. Replacing this oven is
not something that the company does very
often. When the oven is installed it has to
work for about 15 years, preferably
without ever being shut down. If the oven
were to be shut down in order to be
replaced or gradually upgraded, the
shutdown and cool-down process would
take approximately two months. Such a
downtime period would result in vast
monetary losses for the company. This
places very high emphasis on the
durability of the oven as it is expected to
run non-stop for such a long period of
time, and as Lars says “the fact that the
oven has to be reliable for such a long
period of time pressures us to take a safer
route when choosing our new technology.
You have to be sure that it will last for 15
years, at least when it comes to the oven”.
V. Bergman and P. Lundmark Barriers to energy-efficient investments
15
He continues by saying that even though
many oven upgrades or partial oven
upgrades are available, Pilkington would
probably not invest in such things until
the oven has reached its full lifespan and
needs to be fully replaced.
These findings represent a highly relevant
barrier for Pilkington, Halmstad, which is
the uncertainty of technology. In
accordance with the literature, production
disruption (Rohdin, Thollander &
Solding, 2007) or uncertainty of the
technology’s performance (van Soest &
Bulte, 2001) presents barriers in this area.
Also, when looking at the production line,
and more specifically the oven, the
current technology must usually be
replaced before the new technology can
be implemented and therefore creates a
barrier to energy-efficiency (Groot,
Verhoef, & Nijkamp, 2001).
There are a number of factors which
makes Pilkington’s situation very unique
(which in turn suggests the presence of
the heterogeneity barrier). Firstly, the
oven alone represents such a dominant
part of the total energy usage, which
inevitably forces Pilkington to improve
on its energy-efficiency, as a small
percentage in saved energy would result
in very high financial savings for the firm.
At the same time, as the findings above
suggest, there is another very relevant
barrier present for Pilkington, which is
the uncertainty of technology barrier.
Since Pilkington must prioritize reliability
of the new technology, it also gives
Pilkington little incentive to try out the
most recent technology if there are any
doubts of its reliability when compared to
an older and already tested technology.
The blueprint for a new oven is designed
internally by engineers at Pilkington and
custom built to fit the requirements of
Pilkington, Halmstad. Due to the
complexity and uniqueness of the oven at
Pilkington, it is often difficult for
someone outside the firm to improve
upon, or suggest changes to, the
equipment. According to our interviewee,
many consultants with an expertise in
energy have worked with Pilkington
without much of a success since most of
the suggested changes already have been
identified by Pilkington themselves, or,
the suggestions have limitations to them
when taking a closer look. As an example
Lars explained that a few years ago
Pilkington, Halmstad, had consultants
assisting them in energy saving projects.
They looked mostly at how additional
waste heat could be saved in order to be
used somewhere else or sold. The
problem with this, according to our
interviewee, is that Pilkington has no
means to store waste heat. They cannot
use it to heat up their facilities and the
demand for heat in the municipality is not
always constant. And if there is no
demand at some times, Pilkington have to
use cooling systems to cool away the
additional waste heat since it otherwise
would damage the systems. Another
difficulty for Pilkington is that
information-sharing is, by law, not
allowed in the industry. Five years ago,
The European Competition Authority
sentenced the glassmaking industry for
performing actions such as having
connections between companies that
limited competition and coordinating
prices for flat glass. (konkurrensverket.se
). Heavy penalties and a collective fine of
486.9 million euro were handed out, and
ever since then the NSG group have had a
V. Bergman and P. Lundmark Barriers to energy-efficient investments
16
strict policy of not sharing any
information with other actors within their
industry. This, together with the
aforementioned factors creates a unique
situation for Pilkington, where the
information and knowledge on the
production line is very isolated to
Pilkington themselves which creates a
barrier to outside information. The lack of
diffusion of information in the
glassmaking industry makes the authors
to believe that it would give reasons for
sub-optimal investments in the concerned
areas, such as the production line. At
Pilkington it is only our interviewee Lars
Andersson and his head manager who
works within the area of energy
investments and they rely solely on the
information they uncover themselves. No
governmental organs aid in this process.
The only external sources for Pilkington
Floatglas are its affiliated subsidiaries
under NSG. However, Pilkington
Floatglas is the only firm among NSG’s
subsidiaries to systematically work with
energy issues and to have a certified
energy management system. According
to our interviewee there is sufficient
information available to them in order to
make the right decisions. However,
because of the isolated situation for
Pilkington (most of the knowledge comes
from the inside) and the nature of
information (it is nearly impossible to
know how much information one have if
we cannot compare it with someone else)
it is very difficult to speculate whether
investments in skilled personnel would
increase the possibility of obtaining
information on energy-saving
technologies (Sardinou, 2008). Moreover,
Pilkington Floatglas AB is the only firm
in the corporate group to work
systematically with energy issues which
rule out the possibility for them to share
information within the corporation,
regionally or on a larger scale.
In accordance to the literature,
insufficient information on possible
energy-efficient investments (Groot,
Verhoef, & Nijkamp, 2001) will most
likely create an insufficient information
barrier. In contrast, factors such as the
fact that Pilkington is a large firm
operating in a very competitive industry
(Groot, Verhoef, & Nijkamp, 2001), its
high energy usage (Sardianou, 2008) and
the fact that Pilkington are members of
the state run energy program PFE (with
many similarities to the voluntary
program described in the article by
DeCanio and Watkins (1998)) are all
factors suggesting the information barrier
to be less relevant. The insufficient
information barrier changes depending on
what areas of the firm one decides to look
at. For the production line, the
information barrier seems to be much
higher than for other areas of the firm.
During the interview we found that
Pilkington use different payback times
depending on what type of investment it
is, how large it is, and whether or not it
has a strategic effect for the firm. Small
investments are usually allowed to have a
bit longer payback time, for example 3
years. Larger investments need shorter
payback times and the decision for the
investment is usually moved from
Halmstad to a regional or global level
within the NSG group. Our interviewee
also mentions that due to the currently
weak financial resources in the
corporation there are also limited
possibilities for new investments, which
V. Bergman and P. Lundmark Barriers to energy-efficient investments
17
in turn has an effect on the payback time.
The only investments to constantly have a
3 year payback period are energy-saving
investments in electrical equipment. The
reason for this is because it is demanded
from the Program for Energy efficiency
(PFE).
What they prefer to separate between in
order to evaluate between different
energy investments is whether it is an
investment for improving the production
or an investment for improving the final
product. This is according to our
interviewee because: “Savings on the
production-side are most often worth
more than improvements on the end
product. One saved Swedish Krona in the
purchase/production results in one saved
Swedish Krona in the end. One Swedish
Krona in raised product price could
theoretically result in 25 Swedish öre in
extra income in the end”, due to taxes
amongst other things. For the
aforementioned reasons, investments in
energy-efficiency are often viewed
positively since they have high savings
potential for the firm and according to
Lars there is little or no internal
competition over financial resources.
Therefore, no support for the more
general economic barriers was found by
the authors.
No internal priority barrier was identified.
Barriers such as lack of capital (Schleich
& Gruber, 2008), low prioritization
(Sardianou, 2008) or little formal
authority were not evident to be relevant
barriers in this study. We asked our
interviewee if he could rank how
important he thought the area of energy
saving investments was in comparison to
the other major areas of the company. He
thereafter told us that there were four
major areas of their production: transport,
salaries, raw material and energy. Within
these four areas energy concerns,
according to him, was a present and
relevant factor in three of them and
therefore energy should be considered a
very relevant part of their business. He
provided a good example that explained
how energy savings can come from many
sources. At Pilkington they were
reconstructing their heat dispensing
system. At their factory they disperse heat
in a heat-water system. This system
operates with two pumps which take turns
powering the system every other month.
When these pumps change from
redundant to active pump every other
month they momentarily overload the
water pressure which puts additional
strain on the piping system. In order to
prevent the system from experiencing a
breakdown in the future they
reconstructed the system so that the
pumps would interact in a way that they
would not overload the water pressure.
Even though his was done in order to
prevent a possible breakdown it was later
shown that the new system had lowered
the energy usage by 75% while the pumps
changed. Our interviewee followed up by
saying that “even though direct energy
saving measures in the manufacturing
process might not have the highest
priority, some of them still come back in
the form of other aspects such as energy
saving attributes in the end product which
entails that the customer reaps the
benefits of the energy saving”.
The split incentives barrier was not
identified as a major reason for under-
investments in energy efficiency. There is
no job rotation at Pilkington but our
V. Bergman and P. Lundmark Barriers to energy-efficient investments
18
interviewee could not identify any
situation where split incentives would
hinder certain investments, even though
one might argue that no job rotation
would contribute to such a barrier. One
reason would be that the payback periods
for the investments is one to three years
which is a reasonably short period and,
hence, not requiring a manager to commit
to a long-term investment. However, this
area would require much more thorough
studies to be rejected as not relevant as
the findings represent the opinions from
one individual.
When asked about the economic
uncertainty of possible investments in
energy-efficiency, Lars provides us with
an example where they were installing a
new heat-recovery boiler. When they
installed a new oven in 1999 they also
decided to install this boiler. Depending
on if they just installed the boiler or added
an extra pressure turbine they could either
sell the recovered heat purely as heat to
the municipality, or they could sell it as
electricity to the same recipient. Installing
the additional turbine was more expensive
at that time and the price for heat and
electricity was roughly equal. Therefore,
a decision was made for the normal heat-
recovery boiler and to sell it as pure heat.
Today, 12 years later, the price for heat
has gone down slightly while the
electricity price has increased more than
three times. Obviously, making the
additional investment for the turbine
would have been a better choice, but the
economic uncertainty at that time,
regarding the different prices, made it
impossible to know which one would be
most profitable in the future. Also, in line
with van Soest and Bulte (2001) and Jaffe
and Stavins (2004), the majority of
investments in energy-efficiency, whether
it is the production line or as in the
aforementioned example in additional
equipment, economic uncertainty is
according to Lars always considered with
this in mind. Therefore, economic
uncertainty is another relevant barrier for
Pilkington, Halmstad. When talking about
economic uncertainty it became evident
that bounded rationality is another barrier
for Pilkington, Halmstad. Assumptions
and educated guesses are, according to
Lars, commonly used when trying to
estimate the potential in an investment,
and as the above example shows, optimal
solutions are nearly impossible to arrive
at.
As suggested by the earlier literature on
energy-efficient investments, the
strongest driver for Pilkington, Halmstad,
is the potential savings from reduction of
energy use (Groot, Verhoef, & Nijkamp,
2001). However, the information barrier
seems to be more present for Pilkington
than in traditional literature on energy-
intensive industries. The fact that laws
and regulations hinder diffusion of
information between industry actors
might hinder Pilkington, Halmstad to
arrive at optimal investments in energy-
efficiency. Also, since the production line
is built in isolation in the firm, little
information can be gained from outside
sources such as the government or energy
experts. On the other hand, lack of access
to capital is a very widespread barrier
which was not evident to be of
importance for Pilkington, Halmstad.
Interestingly, the authors of this paper
identified a barrier to energy-efficient
investments present for Pilkington
Floatglas AB which has not been
V. Bergman and P. Lundmark Barriers to energy-efficient investments
19
presented in the previous literature. This
barrier is present due to the fact that
Pilkington Floatglas AB works
systematically with energy issues and
therefore can identify energy-efficient
investments which are both possible and
economically viable. However, there are
currently no suppliers on the market
offering these solutions to Pilkington
Floatglas AB, hence creating a barrier to
energy-efficient investments. An example
when this barrier occurs is for the fuel oil.
The fuel oil is today transported by trucks
to Pilkington Floatglas AB in Halmstad.
Pilkington has identified that having the
fuel oil transported by train instead of
trucks would lead to a significant
reduction in energy usage, but no
suppliers are currently offering this
service, therefore creating a barrier we
refer to as lack of suppliers.
5. DISCUSSION
The five barriers found to be of relevance
for Pilkington Floatglas AB are:
heterogeneity, insufficient information,
technological uncertainty, economic
uncertainty, bounded rationality and lack
of suppliers. In this paper we have
identified three main underlying causes
giving rise to the aforementioned barriers.
The first cause is isolation, which is
created by the corporate policy not to
share information or knowledge with
other actors in the industry. As an effect,
it most likely contributes to increased
heterogeneity among firms and is also the
main cause behind the insufficient
information barrier. The second cause,
which is also overlapping with isolation,
is the oven at Pilkington. Besides giving
rise to the insufficient information barrier
(outsiders are unable to provide useful
information or knowledge because of its
complexity and company-specific
configuration) and heterogeneity
(information sharing is not allowed and
therefore every firm engineer its own
specific oven) it also contributes to the
technological uncertainty barrier (long-
term reliability and dependability is the
number one priority and technological
uncertainty therefore hinders investments
which would be more energy-efficiency
but perhaps less dependable). The last
cause is uncertainty, which, for example,
comes from uncertainty in future
projections of energy prices or the
aforementioned technological uncertainty.
Besides technological uncertainty and
economic uncertainty it also supports the
creation of the bounded rationality
barrier, where future estimations (due to
uncertainty factors) are common practice.
The last barrier, lack of suppliers, is
perhaps the most clear-cut barrier to
energy-efficient investments, in that it
either exists (and therefore hinders the
investment) or does not exist. One of the
contributions of this paper is the
identification of this barrier and although
we chose not to group this barrier as a
separate cause, its importance is still in
comparison with other identified barriers
for Pilkington Floatglas AB.
How can Pilkington Floatglas AB use this
information to lower their barriers to
energy-efficient investments? Clearly, the
answer will differ depending on the
barrier and a number of other factors. The
following section is intended as a
speculative discussion around the
strategic opportunities for Pilkington
Floatglas AB and how its position as a
V. Bergman and P. Lundmark Barriers to energy-efficient investments
20
subsidiary in a global multinational
corporation affects its strategic
possibilities to lower or eliminate the
identified barriers to energy-efficient
investments.
NSG is a global corporation
headquartered in Tokyo, Japan.
Strategically, the organization is divided
into four levels of decision making:
global level, continental level, regional
level and local level. Europe is, for
example, divided into two regions.
Decisions are taken at these different
strategic levels depending on its strategic
importance to the corporation. Setting up
a new operation or production facility
requires a decision on the global level
while, for example, decisions on what
products are produced at Pilkington
Floatglas is taken at the European level.
There are a number of connections
enabling Pilkington Floatglas to exert
some degree of strategic influence on its
operations. The CEO of Pilkington
Floatglas is a member of the European
management team which opens a channel
to the regional level where decisions on
production are made. According to our
interviewee there is a considerable degree
of information sharing between
Pilkington Floatglas and the regional
manager as well as the head of production
at the European level, and both are
members of the board of directors in
Halmstad.
Pilkington Floatglas is a highly
production oriented firm and holds, for
example, considerable expertise in
coating techniques. The main market for
Pilkington Floatglas consist of the Nordic
countries, including Estonia and Latvia,
but they also have certain coated products
that are being shipped longer distances
since Pilkington Floatglas is the sole
producer of them. These products are
according to our interviewee considered
to have strategic importance for NSG.
Most products are, however, not shipped
that far even though they are often
adapted to the global market. This is
because glass is a weighty product and
does not endure very long transportation.
R&D is a centralized function and the
information and knowledge is then shared
and distributed to the subsidiaries.
Aforementioned qualities (moderate
strategic influence and high international
configuration of products) indicate that
Pilkington Floatglas would fall under
what Birkinshaw and Morrison (1995)
refers to as specialized contributor.
Although Pilkington can (theoretically)
exert some level of strategic influence, it
is not possible for this paper to answer to
what degree this is practiced today.
Strategic resources are required to reduce
or eliminate barriers to energy-efficient
investments and Pilkington Floatglas
depends on the attention from higher
management (European level or higher)
for this. This is an area which needs
considerable attention before it is possible
to draw conclusions on whether or not
Pilkington Floatglas is disconnected
strategically and, hence, not capable of
reducing identified barriers to energy-
efficient investments.
V. Bergman and P. Lundmark Barriers to energy-efficient investments
21
6. CONCLUSIONS
The aim of this study was to map out the
different barriers to energy-efficient
investments and give reasons to their
existence as well as identify what barriers
are relevant for Pilkington, a firm
operating in the glassmaking industry in
Halmstad, Sweden.
The barriers found to be of relevance for
this case study were Heterogeneity,
Insufficient information, technological
uncertainty, economic uncertainty and
bounded rationality, with technological
uncertainty and economic uncertainty
being the two most influential barriers.
Interestingly, all barriers are non-market
failure (i.e. rational for the firm), except
for the insufficient information barrier.
This information barrier arises due to the
complexities of Pilkington’s company
specific equipment, as well as from the
laws hindering Pilkington from sharing
information on energy efficiency with its
competitors. It should be noted however,
that this information barrier might show
to be of less relevance when further
investigating the influence of these
industry laws and how well information is
diffused within the PFE program. Also,
even though the bounded rationality
barrier was found to be present in
Pilkington, it does not mean that it is
higher than for other firms in the same
industry or higher than firms operating in
other industries. Measuring the relevance
of such a barrier would require more in-
depth knowledge than this article can
provide in that specific area. The
technological uncertainty barrier is the
biggest barrier to energy-efficient
investments for Pilkington for the reason
that the most energy demanding
technology in the production, the oven, is
required to run non-stop for
approximately 15 years. This places
factors such as reliability and stability
higher than energy-efficiency.
Future research
This study contributes to the existing
literature on barriers to energy-efficient
investments and, more specifically,
contributes to the relevance of each
barrier in the glassmaking industry in
Sweden. Our suggestion for future
research within this area is to research on
how restrictions to information sharing
within an industry influence the firms
operating therein and how firms could
potentially proceed to solve this problem
of information isolation.
Limitations
The results from this case study cannot be
generalized since barriers to energy-
efficient investments, and their relevance,
differ between firms and industries.
Moreover, the findings from this case
study are based from an interview with
only one person, which will influence the
importance of each barrier. Also, the
barriers are gathered from a range of
different areas, concerning a variety of
topics, such as economics, production,
psychology and organizational structure
and the authors of this paper do not claim
expertise in all these areas. However, this
study has shown the importance of
investigating each firm individually as
there can be a variety of underlying
reasons giving understanding to the
existence of barriers to energy-efficient
investments.
V. Bergman and P. Lundmark Barriers to energy-efficient investments
22
Acknowledgements
We would like to thank Lars Andersson
for participating as an interviewee for this
case study along with other helpful
employees at Pilkington Floatglas AB for
providing us with information and
documentation. We would also like to
thank our supervisors Fawzi Halila and
Jonas Rundquist, our examinator Mike
Danilovic and our colleagues for
providing us with interesting thoughts and
useful opinions on our work.
23
7. REFERENCES
Abdelaziz, E. A., Saidur, R., & Mekhilef, S. (2011). A review on energy saving strategies
in industrial sector. Renewable and Sustainable Energy Reviews 15 , 150-168.
About NSG Group. Downloaded July 10, 2011, from webpage
http://nsg.com/aboutnsggroup/about-nsg.htm
Almeida, E. L. (1998). Energy efficiency and the limits of market forces: The example of
the electric motor market in France. Energy Policy , 643-653.
Annual Energy Outlook 2011. Downloaded May 02, 2011, from webpage
www.eia.gov/forecasts/aeo/
Birkinshaw, J. M., Morrison, A. J. (1995). Configurations of strategy and structure in
subsidiaries of multinational corporations. Journal of International Business Studies 26,
729-753.
Bryman, A., & Bell, E. (2007). Business Research Methods. New York: Oxford University
Press Inc.
Company introduction (in Swedish) – Pilkington. Downloaded July 10, 2011, from
webpage http://www.pilkington.com/europe/sweden/swedish/about+pilkington/default.htm
Danjelico, R. M., & Pujari, D. (2010). Mainstreaming Green Product Innovation: Why and
How Companies Integrate Environmental Sustainability. Journal of Business Ethics , 471-
486.
DeCanio, S. J. (1993). Barriers within firms to energy-efficient investments. Energy Policy
(September), 906-914.
DeCanio, S. J., & Watkins, W. E. (1998). Investment in Energy Efficiency: Do the
Characteristics of Firms Matter? The Review of Economics and Statistics , 80 (1), 95-107.
Det här är Pilkington. Unpublished information folder, Pilkington, Halmstad, 2011.
Ecomarkets Summary Report, 2009. Downloaded April 28, 2011, from webpage
http://www.terrachoice.com/files/2009%20EcoMarkets%20Summary%20Report%20-
%20September%2018,%202009.pdf
Energipriser SCB. Downloaded August 28, 2011, from webpage
http://www.scb.se/Pages/ProductTables____24726.aspx
Energy in Sweden 2010. Downloaded May 03, 2011, from webpage
http://webbshop.cm.se/System/ViewResource.aspx?p=Energimyndigheten&rl=default:/Res
ources/Permanent/Static/b4cea7b00212456b9bdbdbe47a009474/ET2010_47w.pdf
V. Bergman and P. Lundmark Barriers to energy-efficient investments
24
EU energy efficiency plan 2011. Downloaded May 03, 2011, from webpage
http://ec.europa.eu/clima/documentation/roadmap/docs/efficiency_plan_en.pdf
Groot, H. L., Verhoef, E. T., & Nijkamp, P. (2001). Energy saving by firms: decision-
making barriers and policies. Energy Economics , 717-740.
Jaffe, A. B., & Stavins, R. N. (1994). The energy-efficiency gap: What does it mean?
Energy Policy , 804-810.
Kleiner, A. (1991). What Does It Mean to Be Green? Harvard Business Review .
Lubin, D. A., & Esty, D. C. (2010). The Sustainability Imperative – Lessons for leaders
from previous game-changing megatrends. Harvard Business Review , 42-50.
Mohr, R. D. (2002). Technical Change, External Economies, and the Porter Hypothesis.
Journal of Environmental Economics and Management 43 , 158-168.
Nidumolu, R., Prahalad, C. K., & Rangaswami, M. R. (2009). Why Sustainabilty Is Now
The Key Driver Of Innovation. Harvard Business Review , 57-64.
NSG Annual report 2010. Downloaded July 10, 2011, from webpage
http://nsg.com/resources/nsggroupannualreport20101.pdf
NSG Sustainability report 2010. Downloaded July 10, 2011, from webpage
http://nsg.com/resources/nsggroupsustainabilityreport2010.pdf
Pilkington in Sweden (in Swedish). Downloaded July 10, 2011, from webpage
http://www.pilkington.com/europe/sweden/swedish/about+pilkington/pilkington+i+sverige/
default.htm
Porter, M. E., & van der Linde, C. (1995). Green and Competitive: Ending the Stalemate.
Harvard Business Review .
Rogers, E. M. (2003). Diffusion of innovations. New York: Free Press.
Rohdin, P., Thollander, P., & Solding, P. (2007). Barriers to and drivers for energy
efficiency in the Swedish foundry industry. Energy Policy 35 , 672-677.
Sardianou, E. (2008). Barriers to industrial energy efficiency investments in Greece.
Journal of Cleaner Production , 1416-1423.
Schleich, J. (2009). Barriers to energy efficiency: A comparison across the German
commercial and services sector. Ecological Economics , 2150-2159.
Schleich, J., & Gruber, E. (2008). Beyond case studies: Barriers to energy efficiency in
commerce and the services sector. Energy Economics 30 , 449-464.
Shrivastava, P. (1995). Environmental Technologies and Competitive Advantage. Strategic
Management Journal , 183-200.
V. Bergman and P. Lundmark Barriers to energy-efficient investments
25
Sorrell, S., Schleich, J., Scott, S., O'Malley, E., Trace, F., Boede, U., o.a. (2000). Reducing
Barriers to Energy Efficiency in Public and Private Organisations. SPRU .
Swedish Competition Authority report 2007, Downloaded December 17, 2011, from
webpage http://www.kkv.se/t/NewsPage.aspx?id=2884 &
http://europa.eu/rapid/pressReleasesAction.do?reference=IP/07/1781&format=HTML&aged=0&l
anguage=EN&guiLanguage=en
Walley, N., & Whitehead, B. (1994). It’s Not Easy Being Green. Harvard Business Review
, May-June.
van Soest, D. P., & Bulte, E. H. (2001). Does the Energy-Efficiency Paradox Exist?
Technological Progress and Uncertainty. Environmental and Resource Economics , 101-
112.
26
8. APPENDIX
8.1 Interview guide
Respondent: Lars Andersson, environmental manager, Pilkington, Halmstad, Sweden.
Economic barriers
In your opinion, would you say that your company has possibilities to invest in energy
saving technology?
Do you have the financial resources to invest in all our identified business opportunities
regarding this area?
Have there been any investments that you have chosen not to go through with despite the
fact that they have been proven to be beneficial?
What type of criteria do you put on your investments? (Profitability, pay-back time etc.)
Compared to other areas of investment, do you apply higher or lower criteria for
investments in energy saving technology?
Looking at all of your investments on a more general level, how do you prioritize the
different areas?
How does the infrastructure look in your company? How many people are working within
the area of energy efficiency?
Heterogeneity
Do you differ anything from other companies within this industry?
Principal/agent dilemma
Is there a possibility that you would chose not to invest because you cannot make use of all
the benefits that comes with a specific investment? (Leasing alternatives for example)
Insufficient information
How do you normally collect information regarding this type of investments?
Do you have any external partners that you can turn to for information? Do you receive
help from any governmental institution?
Do you to any degree use external expertise regarding energy related questions?
What sources of information to you trust the most?
How much resources to you put on information gathering within this area?
V. Bergman and P. Lundmark Barriers to energy-efficient investments
27
Could you make an estimate of how much information you believe that your company have
compared to what is out on the market?
Undesirable attributes in new technology
Has there been any energy saving technology that you have chosen not to invest in because
it would have been too much of a change for example for the staff or the end-products
attributes?
Uncertainty (technology and economic)
Looking at the financial calculations, how much does uncertainty weigh in when you are
considering a new investment?
Hidden costs
Would you say that “hidden costs” such as information gathering and implementation
makes up a barrier to investment?
Organizational barriers
Split incentives
In general, how long does people assigned to energy-related tasks stay at the same positions
within your company? Do you have any form of rotation system?
Do you have any ways of letting people know about successful energy saving investments
within your company? Do you have any reward system?
Internal priority
From your point of view, which other areas are more important than energy saving? Are
there any?
Have the importance of energy savings increased during recent years?
Time constraints
Do you (or your staff) feel that the time set of for collecting and analyzing information
about energy savings is insufficient?
Do you feel that there exist any barriers towards energy saving investments for example
due to lack of competence within your staff or maybe due to lack of office space?
Behavioural barriers
Bounded rationality
Do you feel that you are able to make theoretically optimal decisions when making these
investments or do you have to make any “qualified guesses”?
V. Bergman and P. Lundmark Barriers to energy-efficient investments
28
Remaining Questions
How would your company react to a scenario where energy taxes and/or energy prices are
raised?
Would you then focus more on energy saving technology or would you raise the price on
the end product?
Would you perhaps move the production abroad?
Are you familiar with a programme call “Programmet För Energieffektivisering” (PFE)?
Are there any other similar programmes that you are participating in?
Compared to other countries, how good is Sweden when it comes to putting up promotional
policies, voluntary support programmes and standards aimed at helping companies?
In 2006 Pilkington was bought by the Japanese group of companies NSG. Do you feel that
this has in any way changed the way you look at or handle matters regarding energy
saving?
8.2 Follow-Up Interview guide
Respondent: Lars Andersson, environmental manager, Pilkington, Halmstad, Sweden.
Information sharing between companies
You mentioned earlier that communication between companies was not allowed within the
glassmaking industry.
- Is this a rule or policy of some kind? Or is it some kind of agreement?
- Is it only in the Swedish market? Other markets?
- Has there always been such a rule/policy?
- Is there anywhere else we can read more about this?
Payback time
You said that payback times for new investments were 1 year (3 years for improvement
within electrical equipment), is that correct?
- Why such a short amount of time?
- Who makes the decisions about payback times?
- Has the payback times always been this short?
- Do you find them sufficient in length or is there any reason to believe that they
could have been longer in some occasions?
- Does Pilkington discard all investments that demand a longer payback time than
that?
V. Bergman and P. Lundmark Barriers to energy-efficient investments
29
- Have there been opportunities where you have identified investments that need
longer payback time that you then had to discard due to you presently set payback
times?
Centralized/decentralized
- Who makes the strategic decisions? Japan/Sweden/Halmstad?
- Are you participating in making strategic decisions together with someone higher
up? (such as Japan NSG?) (If yes, how does this collaboration look like)
- Whom do you have collaborations with? Do you share much information within the
whole NSG organization? Do you have any systems that make it easier to share
information?
- Do you have any collaboration with other firms in other industries within the
organization?
- Do you see Pilkington as being the specialist with any certain area? If so, which
one? Is it the product itself you specialize in or is it the production of it?
- Is the production here in Halmstad aimed for the local market or for the global?
- Are all stages of the product finished here or are there any additional steps that are
performed somewhere else?
- Are there any special products that are only produced here in Halmstad? If yes, for
what market are they produced?
- Is the Swedish market strategically important for the global organization?
- Who makes all purchases (raw materials etc.) Halmstad? Sweden? Japan?
Combination?
- Who makes all the decisions concerning the production here in Halmstad?
- What level of pressure would you say is on Pilkington Halmstad to adapt their
production for the Swedish market? High? Medium? Low?
- Is it your belief that Pilkington Halmstad can make strategic decisions on a local
level or do you feel that you are controlled a lot by headquarters? For example: Who
makes decisions concerning:
1. Choice of technology?
2. What products to manufacture?
3. What resources to use (financial, staff etc.)
4. Production related questions?
Preliminary conclusions
We have identified that due to the “law” against information sharing and the technology
(your oven) that your engineers develop on their own, there are probably large differences
between Pilkington and other actors on the market. We also find that the fluctuations in
energy prices and need for reliable technology affects the way in which investments in
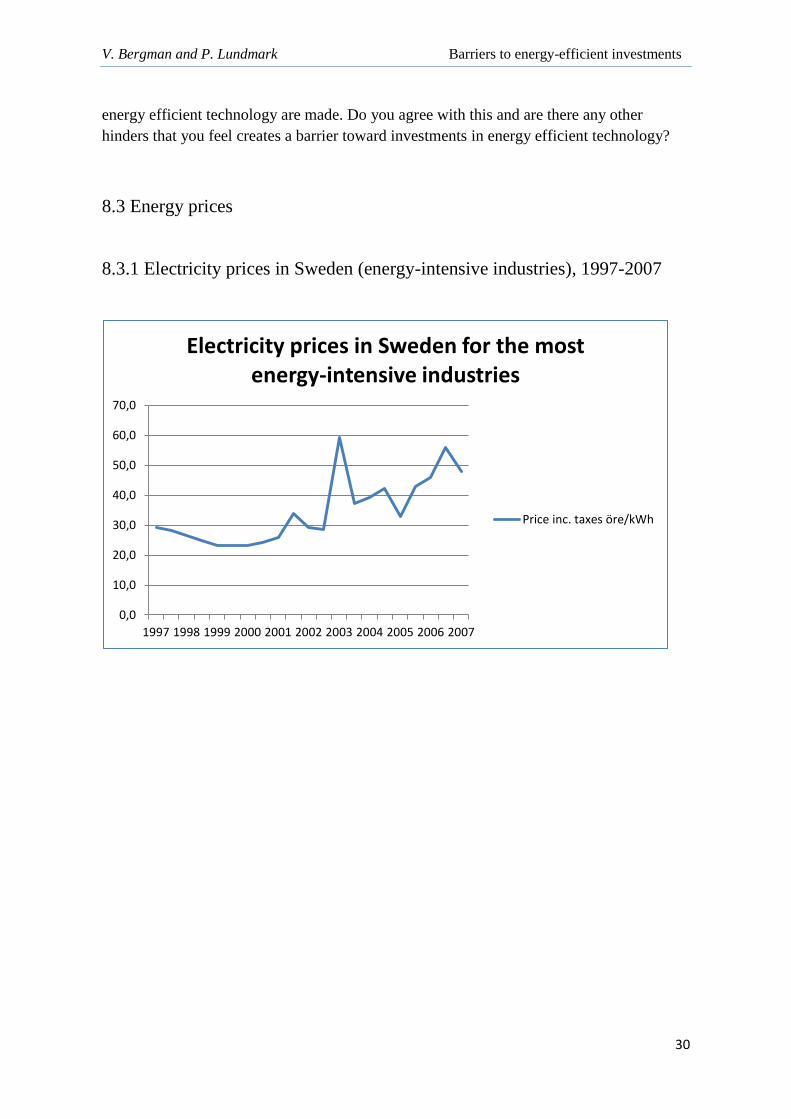
V. Bergman and P. Lundmark Barriers to energy-efficient investments
30
energy efficient technology are made. Do you agree with this and are there any other
hinders that you feel creates a barrier toward investments in energy efficient technology?
8.3 Energy prices
8.3.1 Electricity prices in Sweden (energy-intensive industries), 1997-2007
0,0
10,0
20,0
30,0
40,0
50,0
60,0
70,0
1997 1998 1999 2000 2001 2002 2003 2004 2005 2006 2007
Electricity prices in Sweden for the most energy-intensive industries
Price inc. taxes öre/kWh