barriers to and driving forces for industrial energy efficiency improvements in african industries
TRANSCRIPT

Barriers to and driving forces for industrial
energy efficiency improvements in African
industries: a case study of Ghana's largest
industrial area
Raphael Wentemi Apeaning and Patrik Thollander
Linköping University Post Print
N.B.: When citing this work, cite the original article.
Original Publication:
Raphael Wentemi Apeaning and Patrik Thollander, Barriers to and driving forces for
industrial energy efficiency improvements in African industries: a case study of Ghana's
largest industrial area, 2013, Journal of Cleaner Production, (53), 204-213.
http://dx.doi.org/10.1016/j.jclepro,2013.04.003
Copyright: Elsevier
http://www.elsevier.com/
Postprint available at: Linköping University Electronic Press
http://urn.kb.se/resolve?urn=urn:nbn:se:liu:diva-96168
Barriers to and driving forces for industrial energy
efficiency improvements in African industries – a
case study of Ghana’s largest industrial area
Raphael Wentemi Apeaning *, Patrik Thollander
Department of Management and Engineering, Linköping University, SE-581 83
Linköping, Sweden
______________________________________________________________________________
Abstract
Barriers to industrial energy efficiency improvements in developing countries are more
pronounced due to the existence of factors like weak energy policy frameworks, financial
constraints, weak information systems and many more. This study is an explorative and
qualitative research aimed at enhancing the knowledge of industrial energy efficiency and
management strategies in Ghana, by investigating the barriers to and the driving forces for the
implementation of energy efficiency measures in Ghana's largest industrial area. Results from the
study revealed that energy is poorly managed in the various industries and that there is an energy
efficiency gap resulting from the low implementation of energy efficiency measures. In addition,
the study revealed that the most important factors impeding the implementation of cost effective
energy efficiency technologies in the firms are principally economic (or market) barriers like
“lack of budget funding” and “access to capital”. The study also shows that these economic
barriers are linked to the lack of adequate government framework for industrial energy
efficiency. The study also revealed that market factors related to “cost reductions resulting from
lowered energy use” and “threats of rising energy prices” are the most important drivers for
implementing energy efficiency measures or technologies.
Keywords: Energy efficiency; barriers; drivers; energy management practices; energy efficiency
gap; industry; developing countries; Africa; Ghana.
______________________________________________________________________________
1. Introduction
Unlocking the global industrial energy efficiency potential is considered as a cost effective
means of reducing global fossil fuel consumption, mitigating greenhouse gas emission,
improving energy supply security and ensuring a sustainable industrial development (IPCC,
2007; UNIDO, 2011). Despite the existence of cost effective industrial energy efficiency
measures, studies indicate that these measures are not always implemented, due to the prevalence
of critical limiting factors called barriers (Rohdin et al., 2007). The industrial “energy efficiency
gap1” in developing regions is normally attributed to a combination of market failures and
barriers like informational barriers and financial barriers (UNIDO, 2011; Compton, 2011).
Although these existing barriers (industrial energy efficiency) in developing countries are similar
to developed countries (UNIDO, 2011), the lack of adequate policy frameworks, fragile
economies, poor energy infrastructure, among others, makes the existence of these barriers more
pronounced in developing regions (Compton, 2011).
Ghana's dedication to industrial energy efficiency improvement dates back to 1987, when the
government initiated an “Industrial Energy Rationalization Program” (ESMAP, 1992), in an
effort to boost the industrial sector's resilience to energy supply deficiencies (like the irregular,
unreliable and frequent interruption of energy supply) (EC, 2006a). Since then several other
programs have been initiated with the same aim of improving and building capacity for industrial
energy efficiency improvement in Ghana. However, these efforts to date have not yielded any
sustainable adoption of cost effective industrial energy efficiency practices in Ghana, owing to a
number of barriers in the Ghanaian energy market (MoEn, 2010).
The existence of these barriers offers justification for further intervention from government
authorities and policy makers to bridge the efficiency gap, by formulating more innovative and
comprehensive schemes to boost the energy service market. Nevertheless, for any particular
policy or intervention to succeed, a sound understanding of the barriers and the driving forces
has to be addressed (Golove and Eto, 1996; Trianni et al., 2012; Thollander and Palm, 2012). It
is in this respect that the study was aimed at investigating the barriers and the forces driving
industrial energy efficiency improvements in Ghana by conducting a case study of the country's
largest industrial area, and further analysing its industrial energy management practices. The
research questions pertaining to the study were divided into five major sections:
• Is there an energy efficiency gap in Ghanaian industries?
And if so:
• What are the barriers inhibiting the implementation of cost-effective energy efficiency
measures in Ghanaian industries?
• What are the driving forces stressing the implementation of cost-effective energy
efficiency measures in Ghanaian industries?
• How is energy managed in Ghanaian industries?
• How are the various information sources of energy efficient technologies valued?
This paper is unique in the sense that, to the authors' awareness, no study has so far presented
results on barriers and forces driving industrial energy efficiency and studied energy
management practices in Africa. Thus, the strength of this paper is in the provision of important
knowledge of mechanisms and factors that influence, positively or negatively, the adoption of
industrial energy efficient technologies and measures in Ghana and Africa. Even though the
authors acknowledge that the results of this study cannot be generalised for all African countries,
the study at least provide a good foundation for further studies in Africa.
1.1 Overview of the industrial sector in Ghana
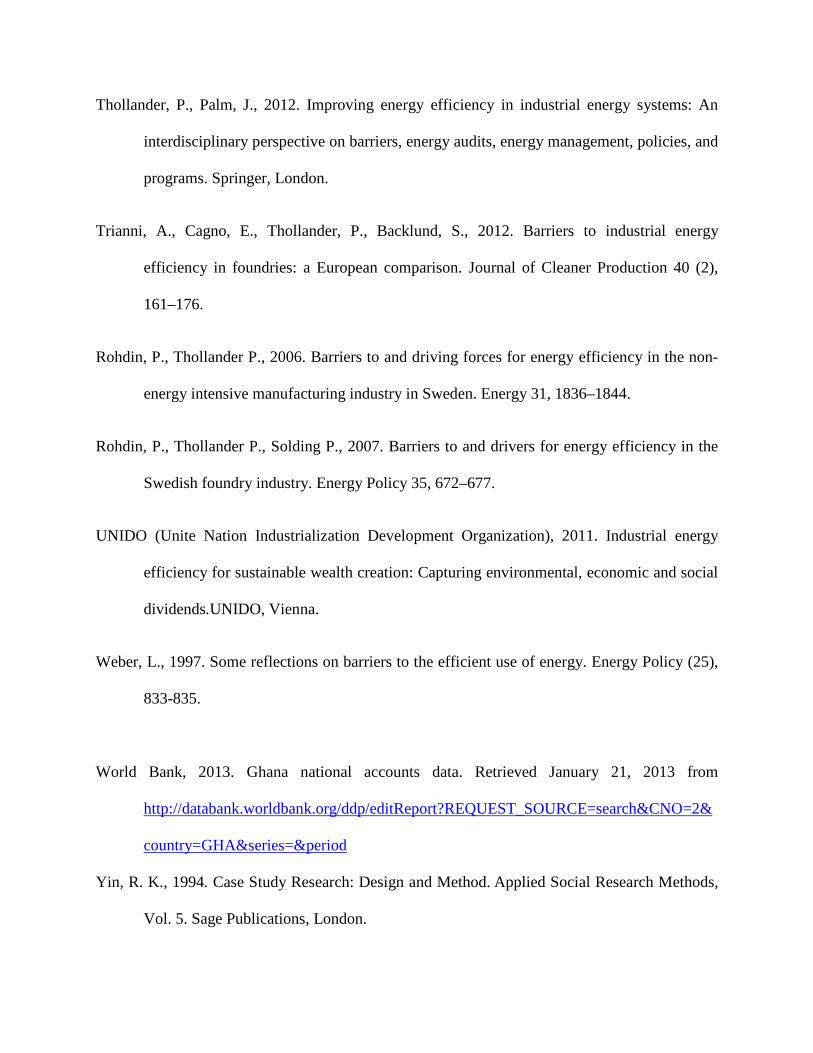
Ghana's industrial sector contributed about 25.9% of the nation's GDP in 2011 (Ghana Statistical
Service) and yielded a net value of about US$ 9.5 billion2 (World Bank, 2013). The
manufacturing subsector (especially the formal sector3) is considered an important engine of
Ghana's socio-economic development, due to its economic linkage to the two major sectors in
Ghana (i.e. Agricultural and Service sectors) (Kolavalli et al., 2012). This subsector contributed
about US$ 2.7 billion2 of Ghana's GDP in 2011 (World Bank, 2013); (see Fig. 1) which represent
about 31% of the industrial sector's value added share (GSS, 2012). The manufacturing subsector
is dominated by agriculture-related activities, including food and wood processing and textiles
(Kolavalli et al., 2012). Despite the importance of the manufacturing subsector, its average
growth rate (3.5%) between 2000 and 2010 was the least among the industrial subsectors.
Factors like high labour cost, high cost of raw materials, the use of obsolete and inefficient
machinery, and energy related factors like unstable energy supply and hikes of energy prices
have contributed to the low performance of this subsector (Kolavalli et al., 2012; CEPA, 2007).
<< Position for Figure 1 >>
The energy requirement of Ghana's industrial sector is primarily met by the supply of
electricity, petroleum products and wood fuels. The predominant petroleum products used in the
industries are diesel and residual fuel oil, where the latter is used as a heating fuel (EC, 2006b).
The manufacturing subsector is the principal consumer of energy in the industrial sector
accounting for over 70% of the sector's energy share (EC, 2006b). Most of the formal
manufacturing firms are energy intensive and are highly reliant on electricity and petroleum
product. The share of electricity and petroleum products used in this formal manufacturing
subsector accounts for about 37–41% and 55–57% respectively, of the total subsector's share
(see Fig. 2). Wood fuel is the major fuel used in the informal manufacturing sector and its share
represents about 70–80% of the subsector's total energy use. As show in Fig. 3, the share of
petroleum products and electricity use in the informal manufacturing subsector ranges between
8–15% and 8–20% respectively, of the subsector's total energy use.
<< Position for Figure 2 >>
<< Position for Figure 3 >>
The city of Tema is the hub of Ghana's industrialization and home to Ghana's largest
industrial area the “Tema industrial area”. This industrial area is home to well over 600
industries which include aluminium and steel smelting industries, fish and food processing
industries, textile industries, chemical industries, cement factories and an oil refinery. The area is
a strategic regional point because it hosts most of the high revenue earning manufacturing
industries in the country. Besides, the industrial area is popularly known for its high energy end-
use. This area also hosts most of the high electricity and petroleum product consuming

manufacturing firms in Ghana (e.g. VALCO, an aluminium smelting company which until 2003
accounted for 16–17% of total national electricity consumption (EC, 2006b)). A number of
studies conducted in the industrial area also indicate that the use of energy is poorly managed
(ESMAP, 1992; CEPA, 2002); as such a large number of these firms exhibit high energy
intensive production processes compared to similar processes in other countries (Ofosu-
Ahenkorah, 2007).
Literature Review
1.2 Barriers to industrial energy efficiency improvement
Though the prospects of increasing energy efficiency are vast, they are usually
overlooked since the potential to implement cost effective energy efficiency solutions are either
shrouded or inhibited by some critical factors. These critical factors are referred to as barriers. In
this context, a barrier can be defined as a postulated mechanism that inhibits investments in
technologies that are both energy-efficient and (apparently) economically efficient (Sorrell et al.,
2004; Rohdin and Thollander, 2006; SPRU, 2000). In order words, a barrier comprises of all
factors that either hamper the adoption of cost-effective energy-efficient technologies or slow
down their diffusion in the market (Fleiter et al., 2011).
The study of energy efficiency barriers is a multi-disciplinary field with contributions
from theoretical backgrounds like, neo-classical economics, organizational economics,
behavioural theory and organizational theory (SPRU, 2000). Based on these theories, energy
efficiency barriers are broadly classified under three main categories namely Economic,
Organizational and Behavioural (Psychological) barriers (Palm and Thollander, 2010; Thollander
and Palm, 2012; Sorrell et al., 2004; SPRU, 2000).
As shown in literature, the nature of these barriers vary widely depending on the
technology adopted, sectors and regional conditions (SPRU, 2000; Rohdin and Thollander, 2006;
Thollander and Ottosson, 2008). These variations plus the multi-disciplinary nature of barriers
explain the diversity in empirical approaches to studying energy efficiency barriers. Empirical
barrier studies are aimed at explaining the existence of the energy efficiency gap, by
investigating how barriers exist and operate, the contexts in which they arise and the manner in
which different interventions can be used to bridge the efficiency gap (SPRU, 2000). According
to SPRU (2000), both theoretical and empirical approaches to studying barriers are equally
important and complementary; since “empirical findings are only meaningful when linked to
well-articulated theoretical framework, similarly theoretical assertions are meaningful only if
they stand up to empirical scrutiny” (SPRU, 2000). However, Weber (1997) points outs that
theoretical classifications of empirical barriers are not exclusive, since some barriers can have an
overlapping perspective (Weber, 1997). This means that an empirical barrier can have more than
one theoretical background depending on the perspective of analysis.
1.3 Driving forces for industrial energy efficiency improvement
A driving force might be seen as a factor that can reduce or overcome a barrier, thus in
this context a driving force refers to any factor that motivates or promotes the adoption of cost
effective energy efficient investments (Thollander and Ottosson, 2008). Consequently, a study of
the driving force to energy efficiency outlines and gives a good insight to policy makers on
factors that boost energy efficiency implementation. The rationale behind adopting or improving
energy efficiency in a firm can be motivated by either internal or external forces or a

combination of both. According to Thollander and Ottosson (2008) driving forces to energy
efficiency implementation can be classified into market-related, energy policies related, as well
as organizational and behavioural factors (Thollander and Ottosson, 2008).
Market-related driving forces are subject to the need for a firm to stay competitive in a
market by reducing energy use. Some of the commonly cited market-related driving forces are
“cost reductions resulting from lower energy use” and “threat of rising energy prices”. Both
factors are associated with the need for a firm to increase dividends or secure its future dividends
by reducing energy use and behaviour (de Groot et al., 2001; del Rio Gonzàlez, 2005; Thollander
and Ottosson, 2008).
Government energy efficiency requirements and policy instruments (in the form of
voluntary agreements, energy saving certificates, emission trading schemes, energy and
emissions taxes, information dissemination, investment subsidies and tax exemptions and many
more) are effective promoters of industrial energy efficiency implementation. These instruments
are aimed at building capacity in energy service markets and promoting more efficient energy
use (McKane et al., 2008; UNIDO, 2011).
Behavioural and organizational drivers are mainly internal factors which reflect the
sustainability culture and commitments of a firm. In the advent of current strict environmental
policies and increased environmental consciousness, many firms implement energy efficiency to
green and boost their corporate image. Other forms of internal driving forces include “people
with real ambition” which is closely linked to personal commitment of managers, “long-term
energy strategies” and “environmental management systems (EMS)” (Thollander and Ottosson,
2008).
2. Method
Given that there is a limited amount of literature covering industrial energy efficiency
implementation in Africa, the study is aimed at contributing to this field of research by
investigating the present industrial energy efficiency and management practices in Ghana. In
addition, the study incorporates the investigation of barriers and drivers for industrial energy
efficiency implementation in Ghana, to throw light on the rationale for both the adoption and
non-adoption of cost effective industrial energy efficient technologies.
The methods used in this research are exploratory and qualitative, tailored to answer and
satisfy both the aims and research questions. Information collection in this study comprises of
three major parts namely: (1) a literature review of relevant theories, (barriers and forces driving
energy efficiency implementation); (2) a semi-structured interview of firms within the case study
(Tema industrial area); and (3) a semi-structured interview with energy efficiency stakeholders.
Inspired by Yin (1994), the study regards Ghana's largest industrial area (the Tema industrial
area) as a case study because, the area is a good representation of Ghana's industrial energy
culture.
The selections of the firms were done at random based on the Tema Department of Factories
Inspectorates list of registered companies. A total of 76 companies were visited, but due to
bureaucracy and poor communication only 34 agreed to participate in the study (which
represents about 45% response rate). The respondents who participated in the study were
reluctant to provide vital information like the annual turnover of their firm, even when the
confidentiality of the information was assured. None of the firms involved in the study had an
energy manager, so the interviews were conducted with the middle managers (or technical

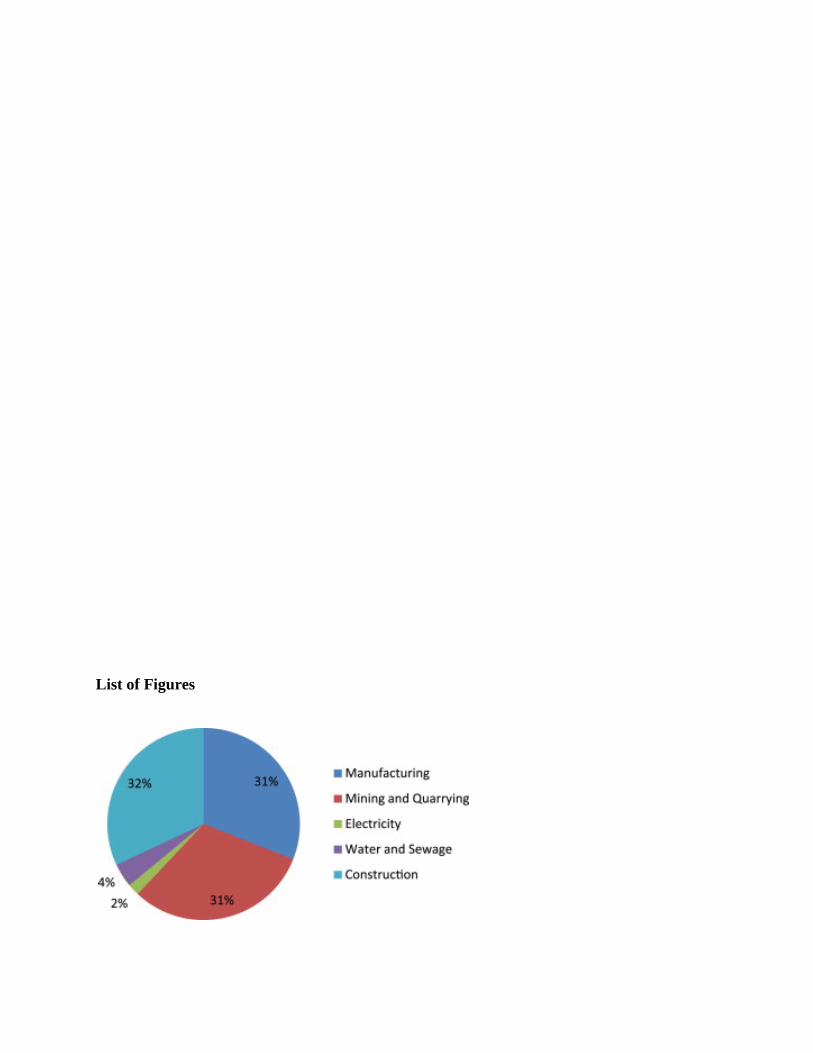
directors) and engineering staffs who dealt directly with energy issues in the various firms. Fig. 4
below shows the distribution of the positions of the respondents. A total of 19 technical directors
and managers, and 15 engineering staff were involved in the interview. Exactly 29% of the
industries studied were steel and aluminium firms; this class of industries includes smelters,
roofing sheet and angle rod manufacturers. 23% were food processing firms whiles plastic
product manufacturers took about 21% of the firms; some of the plastic products produced by
these firms include chairs, tables, buckets and canisters. The petrochemical and chemical firms
consist of the only oil refinery in Ghana – Tema Oil Refinery, paint producers and petroleum
product producers. The rest, classified as Others, consist of a cement company, two textile
companies, a compact fluorescent lamp manufacturer and two paper product manufacturers; the
total of which represent 18% of the total respondents (see Fig. 5 below).
<< Position for Figure 4 >>
<< Position for Figure 5 >>
The interview with the firms' respondents was carried in out in two sessions; in the first
session, respondents were asked to describe the energy management strategies used in their
respective firms; also they were asked to express their views on barriers and drivers for energy
efficiency implementation. All interviews were recorded and on the average each interview took
about 40 min. In the second session, respondents were asked to fill out a structured questionnaire
covering the various aspects of the study. All parts of the questionnaire except the driving force
section were originally developed and empirically tested by SPRU (2000). However, slight
modifications were made to the questionnaire to suit the case study. These modifications were
made based on a pilot test of the original questionnaire and a review of industrial energy audits
and surveys (e.g. ESMAP, 1992) carried out in the industrial area. The section on the driving
forces was developed through a literature review of related articles including de Groot et al.
(2001), del Rio González (2005), Rohdin and Thollander (2006), Rohdin et al. (2007), Ottosson
and Peterson (2007), and Thollander and Ottosson (2008). The parts of the questionnaire on the
implementation of energy efficiency measures and technologies, barriers to energy efficiency
improvement and driving forces for energy efficiency improvement applied the use of a scale to
quantify the response of the respondents. To avoid imbalance, these results were initially
classified under two groups; energy intensive and non-energy intensive firms, then the average
score for each response under the groups were calculated and ranked. However, there were no
major distinctions in the ranking of the response between the two groups, so the results were not
categorized in the outline of this paper. It should be noted that, in the quantification processes
large simplifications were made by respondents, thus the result contains several perspective of
issues other than the single score on ranking (Rohdin et al., 2007). Furthermore, it must also be
kept in mind when drawing conclusions from these types of studies that, the respondents'
answers might have some degree of bias (Thollander and Ottosson, 2008).
The semi-structured interview with the stakeholders was conducted with energy experts from
two renowned energy institutes in Ghana namely, Energy Commission, Ghana (EC) and Energy
Foundation, Ghana (EF). EC is a government regulatory body in charge of ensuring that both
energy providers and clients manage energy in an effective and efficient manner, whiles EF is an
Energy Service Company (ESCO) devoted to promoting energy efficiency in Ghana. Two
energy experts were interviewed from EC and one energy expert from EF. These interviews were
conducted to seek information on the current industrial energy efficiency frameworks and
practices existing in Ghana.

3. Results
3.1. Barriers to industrial energy efficiency improvement
With respect to the first research question, respondents were asked to assess the existence
of cost effective energy efficiency opportunities in their firms. All the respondents affirmed the
existence of an efficiency gap in their respective firms, thus providing a rationale for the
existence of barriers to energy efficiency.
To complement the existence of an energy efficiency gap, respondents were asked to rate
the importance of 22 barriers to energy efficiency; using a scale of 0 (not important), 0.5 (often
important) and 1 (very important). Fig. 6 below represents the overall ranking of the barriers. As
already established, empirical barriers can best be interpreted by using a theoretical framework;
thus, Table 1 below highlights barriers considered to be important (i.e. barriers with average
scoring greater than or equal to 0.5) by respondents and their related theoretical backgrounds.
<< Position for Table 1 >>
“Lack of budget funding” was considered as the most important barrier followed by
“access to capital”. These two barriers are theoretically related to “access to capital”. Most of the
respondents cited a lack of access to capital internally or externally as a very important or often
important inhibiting factor to the implementation of energy efficiency in their firms. 12
respondents attributed this limitation to the lack of awareness or interest by top management on
issues related to energy efficiency improvements in their firms. “Other priorities for capital
investment” was ranked as the third highest barrier; according to Rohdin and Thollander (2006)
this barrier can theoretically be linked to hidden cost. The number of respondents who ranked
this barrier as very important stated that energy cost was perceived to be a relatively unimportant
parameter by top managers; as such their top managers tended to ignore energy efficiency
investments and instead allocated capital to other production related investments.
“Technology is inappropriate at this site” and “technical risks such as risk of production
disruptions” were ranked in fourth position. Six respondents claimed the heterogeneity of
technology was a very important factor impeding energy efficiency improvement; one
respondent in particular remarked that the performance of a motor system they had acquired was
below the supplier's assured performance. Additionally, production risks and externalities
associated with change of technology (due to energy efficiency improvement) were stated to be a
very important barrier by five respondents.
“Lack of technical skills” and “conflicts of interest within the company” was ranked in
sixth and seventh position respectively. These two barriers may be related to “imperfect
information” and “split incentives” respectively. Most of the firms interviewed lacked skilled
personnel to evaluate the performance of an energy efficiency technology and also operate the
technology; this limitation inhibited the ability of companies to take up energy efficiency
technology. The inability of the firms to also appropriate the benefits of implementing these
technologies (due to the lack of skilled personnel) developed a “split incentives” between parties
who stand to gain more from the implementation of energy efficiency measures and those who
gain less. This inability also discouraged the uptake of energy efficiency investments in the
firms.
Other hidden cost related barriers such as “lack of time or other priorities” and “cost of
identifying opportunities, analyzing cost effectiveness and tendering” were ranked in eighth
position. Three respondents claimed that the cost involved in contracting experts to identify and
analyze energy efficiency opportunities were very high and as such, management normally
ignored such projects. “Cost of production disruption/hassle/inconvenience” was also ranked in
eighth position; most respondents noted that the disruptions and inconveniences associated with
installing new technologies were often important deterrents to improving energy efficiency,
especially considering the demands of customers that had to be met.
3.2. Driving forces for industrial energy efficiency improvement
Using a scale of 0 (not important), 0.5 (often important) and 1 (very important)
respondents were asked to rate the importance of 17 driving forces. The highest ranked driving
force for energy efficiency improvement was “cost reductions resulting from lowered energy
use” closely followed by “threats of rising energy prices” (see Fig. 7 below). These two drivers
are market related (see Table 2); the respondents pointed out that these driving forces were the
most important rationale for improving energy efficiency in their firms, considering that
investing in energy efficiency could protect their firms from the volatile energy prices and
energy supply deficiencies in Ghana.
Respondents ranked “Energy efficiency requirements by Ghanaian government” as the
third most important driver, even though there were no specific stringent laws or standards with
regard to industrial energy efficiency.
Energy (efficiency) and emissions tax4 are also effective energy policy drivers used all
over the world by governments to promote energy efficiency in firms. The results revealed that
these driving forces were lowly ranked by respondents in ninth and thirteenth position
respectively.
“Environmental company profile” and “environmental management systems” were
ranked in seventh and eight position respectively. These organizational driving forces were
highly ranked by multi-national companies and companies competing on international markets.
<< Position for Figure 7 >>
<< Position for Table 2 >>
3.3. Industrial Energy management and energy efficiency technology adoption
To draw a baseline to assess the energy management profile of the firms, respondents
were asked to answer questions on their energy information systems. The results revealed that 24
firms metered their electricity use at both site and building levels, whiles the remaining metered
electricity use at equipment level. The results also revealed that only six firms used monitoring
and targeting schemes to manage their electricity use, whiles four of the firms had benchmarks to
compare their energy use against, and only five firms had conducted energy audits within the last
10 years. These results infers that the assertion of the energy efficiency gap by respondents were
mostly based on intuition, given that most of the firms had never conducted an energy audit and
also had poor energy information systems. With the baseline set, participants of the questionnaire
were asked questions in relation to their energy management profile.
Even though energy management can help improve levels of energy efficiency in a firm
(Backlund et al., 2012), and eliminate some organizational barriers (McKane et al., 2008), the
results revealed that majority of the firms studied had no standardized energy policy and
management system. Only five firms had subscribed to ISO Standards (ISO 22000, ISO 9001
and ISO 14001); and out of these five firms only two firms had energy policies which formed
part of their ISO 14001 subscription. Respondents from these two firms also stated that the
implementation of the energy policy was not extensively applied in their firms because energy
use was not considered as an environmental hotspot in Ghana. The study also revealed that none
of the studied firms had a personnel specially assigned to manage energy, as such most of the
energy issues were handled by the technical directors and middle managers.
Respondents were asked to assess the extent to which they had adopted various energy
efficient technologies and measures, grouped under various categories (see Table 3), using a
scale of 0 (not adopted) to 1 (extensively adopted). Table 3 below shows that electrical
equipment was ranked as the highest implemented energy efficiency measure; this does not come
as a surprise since most of the industries studied were highly reliant on electricity (Thollander
and Palm, 2012). Power factor correction5 is one of the most cost effective measures dominantly
used in Ghana. The technical director of a steel smelting firm claimed that they had extensively
implemented power factor correction, which had helped reduced the firm's annual electricity bill
by 5–10% since 2001. The results also revealed that 17 firms had not implemented power factor
correction; respondents attributed the non-adoption of this measure to the lack of funds or
ignorance of the benefits. The avoidance of idle operation of pumps, fans conveyers and other
electrical equipment is another effective means of reducing electricity consumption. However,
none of the industries studied had automatic switch-off systems to turn off idle equipment. Two
respondents claimed they had labels and posters on walls to prompt workers on switching off
idle equipment. However, both respondents could not affirm the effectiveness of this measure
because they claimed it had not reflected any significant electricity savings.
<< Position for Table 3 >>
The study revealed that none of the firms had light control systems (occupancy sensors)
to automatically put lights on/off when needed. Most of the firms had extensively replaced

tungsten lamps with CFLs; the reason for this high rate of implementation was attributed the
extensive promotion of CFLs by the government. Most of the firms had extensively optimized
daylight by properly positioning their windows and also using skylight to reduce the use of
artificial lights during the day.
To ensure optimal operation of boilers, 31 respondents claimed they accurately regulated
boiler temperature, pressure, and air/fuel ratio. Only two of these respondents claimed they used
boiler refractory to help reduce fuel consumption. Additionally, only one firm had a heat
recovery system, which was basically used for electricity production.
The use of appropriate and efficient motors to drive compressors and pumps was a major
measure implemented in 33 firms; the use of centrifuge pumps and throttle control was another
measure used by the firms. The study revealed that the inspection and elimination of leaks for
compressors were not being extensively applied due to the poor maintenance culture in most
Ghanaian industries. Three respondents confirmed this fact by saying that most maintenance of
machinery were carried out on rare occasions and only when they were faulty.
3.4. Industrial energy efficiency information source in Ghana
The Electricity Company of Ghana6 (ECG) and EC are the official government bodies
responsible for providing and disseminating energy efficiency information in Ghana. Other
information sources include EF, trade unions, energy consultants, colleagues within firms and
written sources like journals and manuals.
Participants of the study were asked to rank the effectiveness of energy efficiency
information sources in Ghana. An average scoring of the response indicates that information
from the electricity utility company ECG was ranked as the best source (see Fig. 8). Public utility
companies like ECG are well positioned in the energy market to promote industrial energy
efficiency in Ghana, because of their strong energy ties with customer and the technical
familiarity with customer equipment. However, most of the respondents remarked that energy
efficiency programs by ECG and EC were normally intensive when there is an energy crisis in
the country. One respondent confirmed that during the nationwide hydro-electricity crisis in
2002, ECG organized an industrial energy efficiency sensitization exercise which included
seminars and workshops. Information from suppliers of equipment was ranked as the second
most effective source of information, it is important to note that, information from this source
may be imperfect or asymmetric, because energy efficient equipment produced in developed
countries may not suit the conditions in developing countries. Information from EF and EC were
ranked in third and fourth positions respectively; energy efficiency information from EC was
popular among government-owned industries, due to efforts by government to reduce electricity
expenditure in these industries. Information from trade unions (or sector organization) and
regional energy agency were ranked in eleventh and twelfth position respectively, representing
poor sources of information. This can be explained by the fact that the industrial area had no
centralized managing system and as such information sharing among firms in the industrial area
was quite low.
<< Position for Figure 8 >>
4 Discussions
4.1 Lack of policy framework
The results revealed that all the barriers considered to be of high importance were of
economic origin (i.e. theoretically related to economic factors) (see Table 1). Furthermore all of
these barriers except “lack of information” are rational behaviour barriers (or market barriers).
According to UNIDO (2011) rational behavioural changes with regard to energy efficiency
improvement are best influenced by policies with strong implementation mechanisms and
regular evaluation (UNIDO, 2011). Consequently, the prevalence of rational behavioural barriers
in Ghana can be explained as an indication of the lack of policy for industrial energy efficiency
improvement in Ghana. In other words, the prevalence of market barriers as a consequence of the
lack of policy framework for industrial energy efficiency improvement can make firms in Ghana
irrationally downgrade the priority of energy efficiency implementation. As part of efforts by the
Ghanaian government to promote energy efficiency, there are policy instruments which
indirectly promote energy conservation in industrial firms. One of such policy is the
implementation of the efficiency standards and labeling for air conditioners, refrigerators, and
lamps. This policy instrument has been effective in improving energy efficiency on the support
side (processes) of industries rather than the production side.
Additionally, some contextual factors in the form of heavy energy subsidies, low energy
taxes, and lack of emission taxes are currently factors counteracting the improvements of
industrial energy efficiency in Ghana. Ghana's regulated energy market has the government as
sole controller of energy prices. As such efforts by the government to make energy affordable,
attracts heavy subsidies on energy prices (particularly electricity and petroleum products). These
subsidies end up distorting the real cost of energy supplied to industries and in effect sends the
wrong price signal to the industries. As it is well proven, higher energy prices are associated with
significantly higher rates of adoption of industrial energy efficient equipment (UNIDO, 2011).
Thus, the highly subsidized industrial energy prices in Ghana motivates little efficiency
improvements in this sector. The study of driving forces for improving energy efficiency
revealed that “energy tax” and “emission tax” were lowly ranked (in 9th and 13th position
respectively). This result emphasizes the negative impact of the low industrial energy prices on
industrial energy improvement in Ghana. Notably, the driver results also revealed that the 2nd
highest ranked driving force is also related to energy price signals (threats of rising energy
prices); this point highlights the need for government to price energy in a competitive manner to
promote industrial energy efficiency.
Voluntary agreements have proven to be an effective alternative to mandatory policy
instruments especially in developing countries where there are low compliance to laws and
nonexistence of strict energy and environmental laws. The lack of such a policy instrument in
Ghana explains it being ranked as the lowest driving force.
4.2. Lack of access to funds
As highlighted in the results, the two highest ranked barriers are related to financial
limitations; this revelation spells out the importance of access to funds to the improvement of
energy efficiency in Ghana. The highest mentioned barrier is “lack of budgeting”; most of which
respondents attributed to the lack of interest by the top management to improve energy
efficiency. As such energy efficiency investments are not given priority by top management.
Access to external funding for improving energy efficiency in the form of loans was a major
barrier mentioned by most of the respondents. One shortfall in Ghana associated with access to
external funding is the lack of technical capacity and experience of banks or financial institutes
to properly evaluate credit worthiness of firms and risks associated with energy efficiency
projects; this eventually results in the declination of loans for viable energy efficiency projects.
Another shortfall is the high interest rate on loans in Ghana which deter most industries from
going in for loans to undertake energy efficiency projects. This fact was affirmed when two
respondents said that, top management in their firms were reluctant to borrow money to fund
energy efficiency projects because of the high interest rate and the uncertainties associated with
such projects.
4.3. Lack of management awareness
Regardless of the high awareness of energy management and efficiency improvement among
respondents (technical directors and middle managers), most of the respondents confirmed that
the level of awareness among top managers in Ghana, was generally low. This low awareness
level (among top managers) was reflected in the poor energy culture and energy management of
the industries and a root for some of the highly ranked barriers. From the barriers results “other
priorities for capital investment” was considered as a very important barrier (ranked in third
place); this ranking partly stemmed from the low awareness level among top managers. The low
awareness results in top management perceiving energy efficiency improvement issues as
secondary to other investments. A respondent (manager) remarked that top management in his
firm would rather allocate funds for energy equipment like electricity generator (to ensure
reliable supply of electricity), than invest in energy efficiency equipment. The rationale for this
position by top management is linked to the perceived risks associated with energy efficiency
equipment (i.e. risk of production disruptions and heterogeneity of technology) and the ignorance
of top management to the benefits of energy efficiency investments. Most of the respondents
(especially the middle managers and technical directors) confirmed that the lack of awareness of
energy efficiency by top management was also a critical factor inhibiting their efforts to improve
energy efficiency; this contributed to the high ranking of “conflict of interest within the
company”. This conflict emanated from a split in incentives, where top managers were more
focused on increasing production and profits rather than reducing energy cost or emissions. The
lack of awareness among top management can also be associated with other low ranked barriers
like “lack of staff awareness” and “low priority given to energy management”.
5. Conclusions
The results from the energy management part of the questionnaires shows that energy is
poorly managed in the Tema industrial area; with a low implementation of cost effective energy
efficient technologies in the respective firms studied. This low implementation principally stems
from a combination of market barriers linked to the lack of government frameworks for
industrial energy efficiency improvement in Ghana. More so, the results revealed that majority of
the firms studied had neither a standardized energy policy nor an energy management system.
An analytical generalization of these results depicts the fact that Ghana has a vast industrial
energy efficiency gap considering the low implementation of the energy efficiency measures in
the case study.
Additionally, the paper shows that respondents identified internal and external limited
access to funds as the most important obstacle preventing energy efficiency improvements.
Internal access to funds is limited by the low awareness of top management to energy efficiency
improvement measures which in effect results in energy efficiency investments being given a
low priority. External access to funds on the other hand is limited by high interest rates
associated with loans from banks and financial institutes. These facts underscore the importance
of finding means, such as energy policy instruments based on providing financial supports or
incentives to overcome these barriers in Ghanaian industries.
According to the respondents, market related driving forces like “cost reductions
resulting from lowered energy use” and “threats of rising energy prices” are the most important
promoters for implementing energy efficiency measures or technologies. “Government
efficiency requirements” is another important energy efficiency promoter highlighted by
respondents; this particular finding is unique given that it is not high-ranked in any previous
studies from developed countries, (e.g. de Groot et al., 2001; del Rio Gonzàlez, 2005; Rohdin
et al., 2007; Thollander and Ottosson, 2008); this outcome can partly be linked to standards and
labelling scheme for air conditioners, refrigerators and lamps introduced by the Ghanaian
government.
The result from energy information sources reveals that Ghanaian industries place high
credibility in the power companies (ECG). The study also reveals that information dissemination
geared towards increasing industrial energy efficiency is generally very low among top
managers; the study also shows that public campaigns to increase the awareness of industrial
energy efficiency and management are mostly intensified when there is an energy crisis in the
country. The provision of technical and financial support by government bodies (like the EC) to
improve energy efficiency in industries are mostly limited to only government owned firms; this
is due to lack of adequate government funding to extend it to private own firms.
This paper represents a pioneering study revealing factors promoting and inhibiting
energy efficiency improvements in Ghanaian industries. The study presents a good insight for
future policies and government intervention towards industrial energy efficiency improvements
in Ghana and lays a foundation for further studies in Africa. However, the authors recommend

that further studies should incorporate views of external stakeholders like researchers, equipment
dealers, financial organizations, local government, trade associations/unions and many more to
develop a broad base knowledge more suitable for policy implementations.
Acknowledgement
The work was made possible thanks to funding from Ångpanneföreningens
Forskningsstiftelse (ÅForsk). We respectfully acknowledge the assistance of the Tema
Metropolitan Director of Factories Inspectorates and all respondents of the study for giving
freely their time and effort.
References
Backlund, S., Thollander, P., Palm, J., Ottosson, M., 2012. Extending the energy efficiency gap.
Energy Policy 51, 392–396.
CEPA (Center for Policy Analysis, Ghana), 2002. Energy Intensity Survey. Retrieved January
20, 2013 from http://www.cepa.org.gh/researchpapers/Research-Findings-from-Energy-
Intensity-Survey-of-the-Modern-S64.pdf
CEPA, 2007. The Energy Crisis and Growth Performance of the Economy. Selected Economic
Issues No. 15. CEPA, Accra.
Compton, M., 2011. Industrial energy efficiency in developing countries: A background note.
Unite Nation Industrialization Development Organization, Vienna. Retrieved August 19,
2012 from
http://www.unido.org/fileadmin/user_media/Services/Research_and_Statistics/WP03201
1_Ebook.pdf
de Groot, H., Verhoef, E., Nijkamp, P., 2001. Energy saving by firms: Decision-making, barriers
and policies. Energy Economics, 23(6), 717–740.
del Rio Gonzàlez, P., 2005. Analysing the factors influencing clean technology adoption: A
study of the Spanish pulp and paper industry. Business Strategy and the Environment,
14(1), 20–37.
EC (Energy Commission, Ghana), 2006a. Strategic National Energy Plan 2006 – 2020. Main
report. EC, Accra.
EC, 2006b .Strategic National Energy Plan 2006 – 2020, Annex One of Four, Energy Demand
Sectors of the Economy. EC, Accra.
ESMAP (Energy Sector Management Assistance Programme), 1992. Ghana: Industrial Energy
Efficiency Activity. Main Report Phase 1 November, 1992: Report No. 148A92.
Retrieved January 20, 2013 from http://www-
wds.worldbank.org/external/default/WDSContentServer/WDSP/IB/1999/08/15/00000926
5396103190015/Rendered/PDF/multi_page.pdf
Fleiter, T., Worrell, E., Eichhammer, W., 2011. Barriers to energy efficiency in industrial
bottom-up energy demand models. Renewable and Sustainable Energy Review 15, 3009-
3111.
GSS (Ghana Statistical Service), 2012. National Accounts Statistics: Gross Domestic Product
Fourth Quarter 2011. GSS, Accra.

Golove, W. H., Eto, J. H., 1996. Market Barriers to Energy Efficiency: A Critical Reappraisal of
the Rationale for Public Policies to Promote Energy Efficiency. Lawrence Berkeley
Laboratory, Berkeley. Retrieved July 2, 2012 from
http://eetd.lbl.gov/EA/EMP/reports/3809.pdf
Hirst, E., Brown, M., 1990. Closing the efficiency gap: barriers to the efficient use of energy.
Resources, Conservation and Recycling 3, 267-281.
IPCC, 2007. Contribution of Working Group III to the Fourth Assessment Report of the
Intergovernmental Panel on Climate Change. Summary for Policymakers. Retrieved June
8, 2012 from http://www.ipcc.ch/SPM040507.pdf.
Kolavalli, S., Robinson, E., Diao, X., Alpuerto, V., Folledo, R., Slavova, M., Ngeleza, G.K.,
Asante, F., 2012. Economic Transformation in Ghana: Where Will the Path Lead?
International Food Policy Research Institute, Washington. Retrieved February 2, 2012
from http://www.ifpri.org/sites/default/files/publications/ifpridp01161.pdf.
McKane, A., Price, L., de la Rue du Can, S., 2008. Policies for promoting industrial energy
efficiency in developing countries and transition economies. Unite Nation
Industrialization Development Organization, Vienna. Retrieved June 20, 2012 from
http://www.unido.org/fileadmin/media/documents/pdf/Energy_Environment/ind_energy_
efficiencyEbookv2.pdf
MoEn (Ministry of Energy Ghana), 2010. National energy policy 2010. Retrieved January 21,
2013 from http://ghanaoilwatch.org/images/laws/national_energy_policy.pdf
MoEn, 2011. Energy Statistics in Ghana: Facts and figures. Ministry of Energy Ghana
Publication Department, Accra.
Ofosu-Ahenkorah, A. K., 2007. Potential for Energy Savings, In: Energy Crisis in Ghana:
Drought, Technology or Policy? Kwame Nkrumah University of Science and
Technology, Ghana, pp. 16-33.
Ottosson, C., Peterson, K., 2007. First results from the Swedish LTA programme for energy
efficiency in industry. Paper presented at the 2007 European Council for an Energy-
Efficient Economy (ECEEE) summer study “Saving energy – just do it”, Panel 7, 1517–
1525.
Palm, J., Thollander, P., 2010. Interdisciplinary perspective on industrial energy efficiency.
Applied Energy 87(10), 3255-3261.
SPRU (Science and Technology Policy Research), 2000. Reducing barriers to energy efficiency
in public and private organizations. Brighton, UK.
Sorrell, S., O'Malley, E., Schleich, J., Scott, S., 2004. The economics of energy efficiency -
Barriers to cost-effective investment. Edward Elgar, Cheltenham.
Thollander, P., Ottosson, M., 2008. An energy-efficient Swedish pulp and paper industry -
exploring barriers to and driving forces for cost-effective energy efficiency investments.
Energy Efficiency, 1 (1), 21-34.
Thollander, P., Palm, J., 2012. Improving energy efficiency in industrial energy systems: An
interdisciplinary perspective on barriers, energy audits, energy management, policies, and
programs. Springer, London.
Trianni, A., Cagno, E., Thollander, P., Backlund, S., 2012. Barriers to industrial energy
efficiency in foundries: a European comparison. Journal of Cleaner Production 40 (2),
161–176.
Rohdin, P., Thollander P., 2006. Barriers to and driving forces for energy efficiency in the non-
energy intensive manufacturing industry in Sweden. Energy 31, 1836–1844.
Rohdin, P., Thollander P., Solding P., 2007. Barriers to and drivers for energy efficiency in the
Swedish foundry industry. Energy Policy 35, 672–677.
UNIDO (Unite Nation Industrialization Development Organization), 2011. Industrial energy
efficiency for sustainable wealth creation: Capturing environmental, economic and social
dividends.UNIDO, Vienna.
Weber, L., 1997. Some reflections on barriers to the efficient use of energy. Energy Policy (25),
833-835.
World Bank, 2013. Ghana national accounts data. Retrieved January 21, 2013 from
http://databank.worldbank.org/ddp/editReport?REQUEST_SOURCE=search&CNO=2&
country=GHA&series=&period
Yin, R. K., 1994. Case Study Research: Design and Method. Applied Social Research Methods,
Vol. 5. Sage Publications, London.
List of Figures

Fig. 1: Share of each industrial sub-sector from the total GDP produced by industrial sector in
2011(GSS, 2012)
Fig. 2: Formal manufacturing subsector fuel share 2000-2009 (MoEn, 2011)
Fig. 3: Informal manufacturing subsector fuel share 2000-2009 (MoEn, 2011)
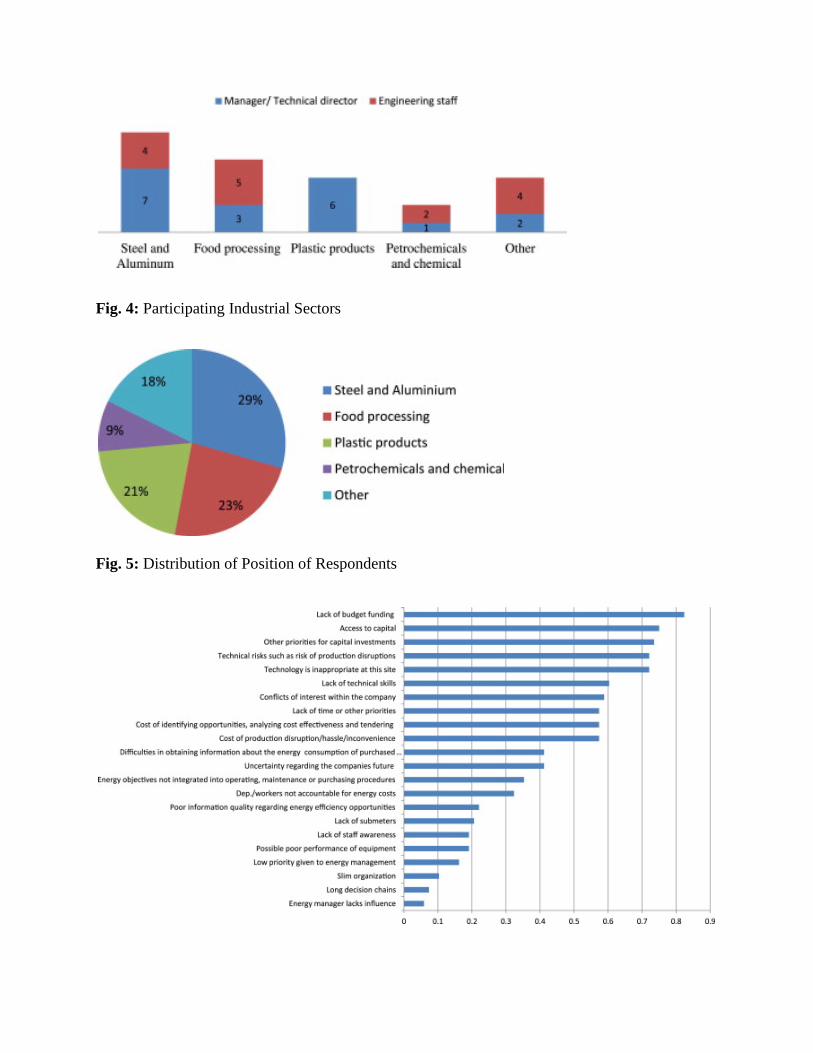
Fig. 4: Participating Industrial Sectors
Fig. 5: Distribution of Position of Respondents

Fig. 6: Ranking results of barriers to improving energy efficiency
Fig. 7: Ranking of driving forces for improving energy efficiency improvement
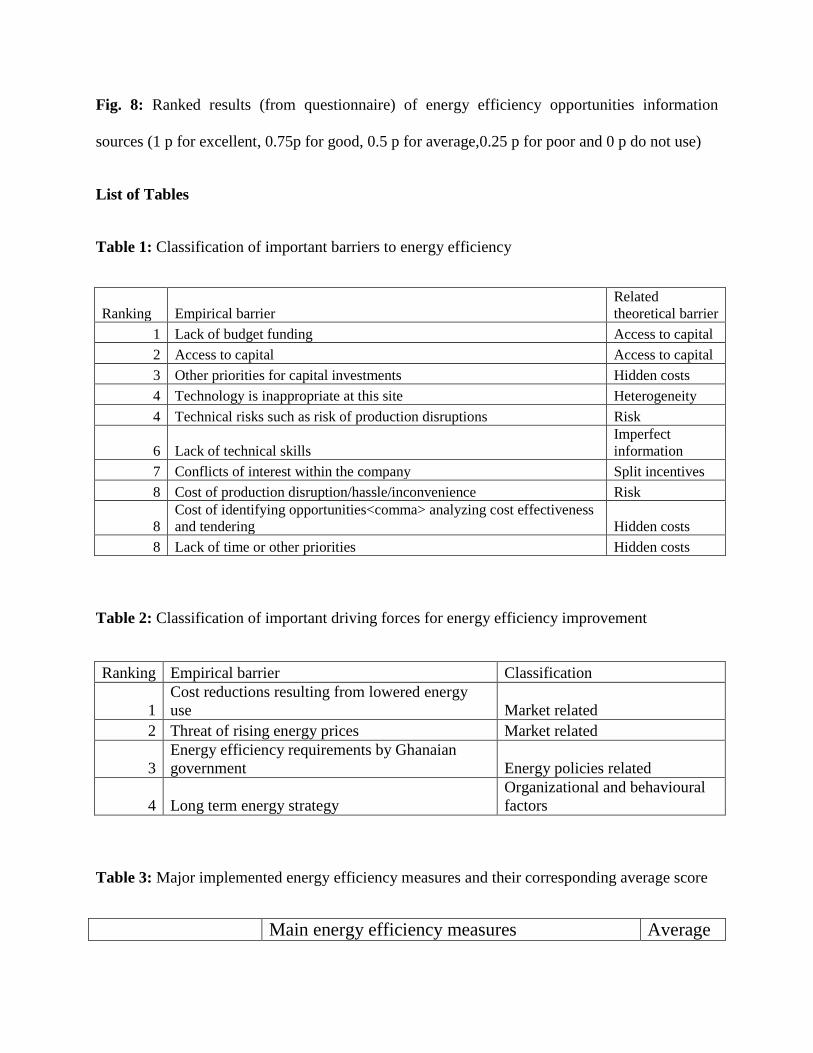
Fig. 8: Ranked results (from questionnaire) of energy efficiency opportunities information
sources (1 p for excellent, 0.75p for good, 0.5 p for average,0.25 p for poor and 0 p do not use)
List of Tables
Table 1: Classification of important barriers to energy efficiency
Ranking Empirical barrier Related theoretical barrier
1 Lack of budget funding Access to capital 2 Access to capital Access to capital 3 Other priorities for capital investments Hidden costs 4 Technology is inappropriate at this site Heterogeneity 4 Technical risks such as risk of production disruptions Risk
6 Lack of technical skills Imperfect information
7 Conflicts of interest within the company Split incentives 8 Cost of production disruption/hassle/inconvenience Risk
8 Cost of identifying opportunities<comma> analyzing cost effectiveness and tendering Hidden costs
8 Lack of time or other priorities Hidden costs
Table 2: Classification of important driving forces for energy efficiency improvement
Ranking Empirical barrier Classification
1 Cost reductions resulting from lowered energy use Market related
2 Threat of rising energy prices Market related
3 Energy efficiency requirements by Ghanaian government Energy policies related
4 Long term energy strategy Organizational and behavioural factors
Table 3: Major implemented energy efficiency measures and their corresponding average score
Main energy efficiency measures Average
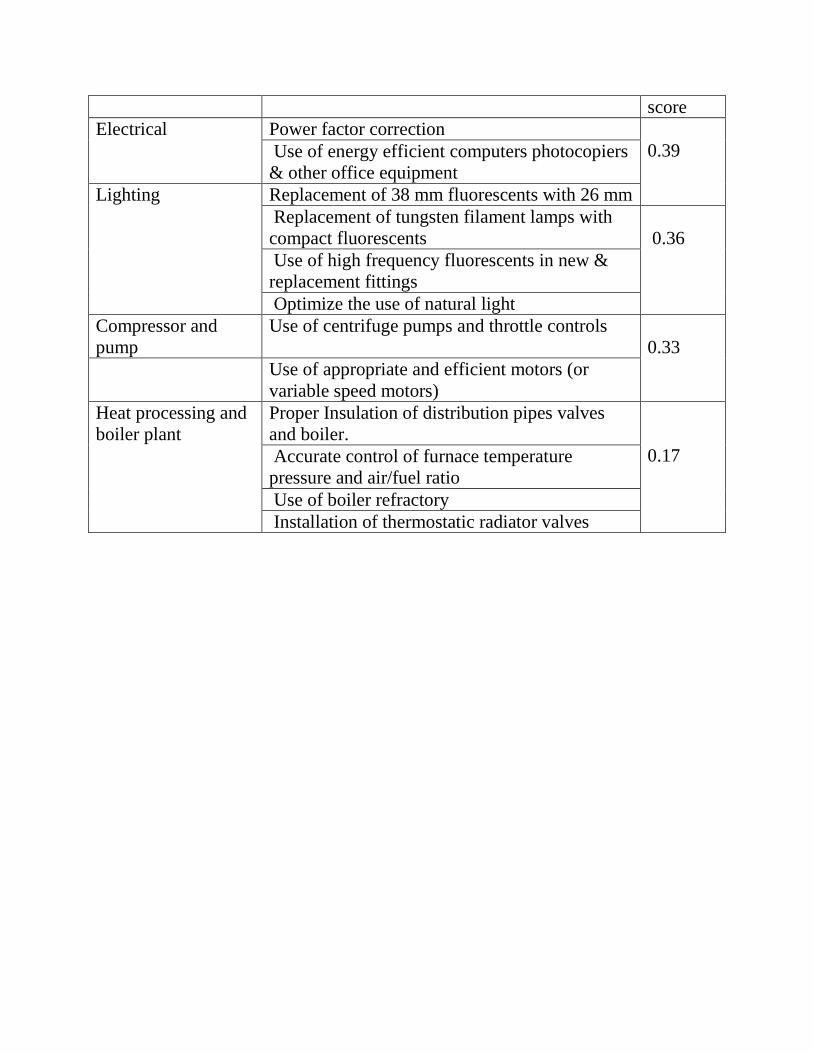
score Electrical Power factor correction
0.39
Use of energy efficient computers photocopiers & other office equipment
Lighting Replacement of 38 mm fluorescents with 26 mm Replacement of tungsten filament lamps with compact fluorescents
0.36 Use of high frequency fluorescents in new &
replacement fittings Optimize the use of natural light
Compressor and pump
Use of centrifuge pumps and throttle controls 0.33
Use of appropriate and efficient motors (or variable speed motors)
Heat processing and boiler plant
Proper Insulation of distribution pipes valves and boiler.
0.17
Accurate control of furnace temperature pressure and air/fuel ratio Use of boiler refractory Installation of thermostatic radiator valves