bargaining power and trade credit - cass business school · we document that with weak bargaining...
TRANSCRIPT

Centre for Banking Research Cass Business School City University London
WORKING PAPER SERIES
WP 03/13
Bargaining Power and Trade Credit
Daniela Fabbri
(Cass Business School, City University London)
Leora F. Klapper
(The World Bank)

Bargaining Power and Trade Credit
Daniela Fabbri Cass Business School
City University London London EC1Y 8TZ, UK
Leora F. Klapper* The World Bank
Development Research Group Washington, DC 20433
1-202-473-8738 [email protected]
May 2013
Abstract: This paper investigates how the supplier’s bargaining power affects trade credit supply. We use a novel firm-level database of Chinese firms with unique information on the amount, terms, and payment history of trade credit extended to customers and detailed information on product market structure and clients-supplier relationships. We document that suppliers with weak bargaining power towards their customers are more likely to extend trade credit, have a larger share of goods sold on credit, and offer a longer payment period before imposing penalties. Important customers extend the payment period beyond what has been offered by their supplier and generate overdue payments. Furthermore, weak bargaining power suppliers are less likely to offer trade credit when credit-constrained by banks. Our findings suggest that suppliers use trade credit as a competitive device in the product market. * Corresponding author. We thank an anonymous referee, Arturo Bris, Vicente Cun͂at, Mariassunta Giannetti, Luc Laeven, Inessa Love, Max Maksimovic, Robert Marquez, Jeffry Netter (the editor), Rohan Williamson, Chris Woodruff, and participants at the 2009 Financial Intermediation Research Society (FIRS) Conference on Banking, Corporate Finance and Intermediation in Prague, the “Small Business Finance–What Works, What Doesn’t?” Conference in Washington, DC, the Second Joint CAF-FIC-SIFR Conference on Emerging Market Finance in Stockholm, and the 4th Csef-Igier Symposium on Economics and Institutions in Capri and the participants to seminar at the EBRD for valuable comments, and Taras Chemsky for excellent research assistance. The opinions expressed do not necessarily represent the views of the World Bank, its Executive Directors, or the countries they represent. The paper was previously circulated with a different title, “Trade Credit and the Supply Chain”.

1
“Large, creditworthy buyers force longer payment terms on less creditworthy suppliers. Large creditworthy suppliers incent less credit worthy SME buyers to pay more quickly”
CFO Magazine, April 2007
1. Introduction
Trade credit is an important source of funds for both small and large firms around the world
(Petersen and Rajan, 1997; Demirguc-Kunt and Maksimovic, 2002). Many firms use trade credit
both to finance their input purchases (accounts payable) and offer financing to their customers
(accounts receivable).
A number of papers have investigated both the demand and supply side of trade credit.
However, we still know very little about important features of trade credit contracts offered and
about whether customers stick to these contract terms. Moreover, there is evidence that small
credit constrained firms do offer trade credit (e.g., McMillan and Woodruff, 1999 and Marotta,
2005), but it is not clear why they would do that.
Anecdotal evidence (CFO Magazine, April 2007), suggests that the bargaining power
between suppliers and customers is an important driver of both the trade credit terms offered by
suppliers and the ones actually used by customers. Bargaining power might also explain why
credit-constrained suppliers still offer trade credit: when they are forced by influential buyers to
allow delayed repayments of goods.
Motivated by the scarce empirical evidence on trade credit terms and bargaining power,
we collect a large and detailed firm-level survey database of Chinese firms. This is a unique
source of data for at least two reasons. First, it provides unique information on trade credit
contracts, including the amount, terms, and payment history of trade credit extended by firms to
their customers (accounts receivable). Second, it provides detailed and rich information about the
product market environment (i.e., number of competitors and main competitor’s share in the
domestic market), the business relation between suppliers and customers and the characteristics
of the goods sold on credit.
Our empirical analysis provides a number of intriguing results. First, we document the
importance of trade credit as a competitive gesture. Specifically, suppliers with weak bargaining
power towards their customers – measured as either the proportion of sales to the largest
customer or the number of suppliers of the firm’s most important customer – are more likely to

2
extend trade credit, have a larger share of goods sold on credit, and offer a longer payment
period before imposing penalties. Similarly, firms facing stronger competition in the product
market – measured either by the degree of sales concentration in the domestic market, by the
introduction of new products, or by lowered product prices in the past year - are more likely to
offer trade credit and provide better credit terms. Evidence on customers’ repayments practices
confirms these findings and suggests that influential customers generate involuntary lending
from their weaker suppliers. Specifically, important customers repay slowly their purchases and
tend to extend the payment period beyond what has been offered, generating overdue payments.
Finally, we look at how firms finance the provision of trade credit. We find that unused
bank credit lines increase credit supply but only for suppliers with weak bargaining power,
suggesting that credit-constrained firms are less able to compete in the product market when they
most need it. All these findings are consistent with the bargaining power story and hold after
controlling for several firm characteristics, including size, ownership, geographical location,
market destination of the products, number of customers, and industry dummies.
Our paper contributes to the literature on trade credit along several dimensions. First, our
data set provides an ideal setting to effectively test three theories that have linked the buyer/seller
bargaining power to trade credit decisions. Specifically, our evidence provides support to the
Wilner’s (2000) argument that a customer obtains more trade credit if he generates a large
percentage of the supplier’s profits. Our evidence is also in line with the prediction of Fisman
and Raturi (2004) that trade credit is larger when the product market is more competitive.
Finally, we do not find significant support for the Cun͂at’s (2007) hypothesis that trade credit is
higher when the good sold is tailored to the buyer specific needs and suppliers and customers are
in a sort of bilateral monopoly because of high switching costs. Interestingly, some of our
proxies of bargaining power are a very close match to the theoretical predictions of the three
models, as we observe the percentage of sales to the largest customer, the degree of sales
concentration in the product market, and the percentage of goods sold tailored to the buyer’s
specific needs.
Our analysis also complements and extends the empirical literature. Extant evidence is
based mainly on the decision to extend trade credit and its link with the degree of competition in
product markets, but presents somewhat conflicting results (McMillan and Woodruff, 1999;
Fisman and Raturi, 2004). We use a comprehensive set of measures on both trade credit terms
3
and bargaining power that allows us to obtain more compelling evidence of a negative relation
between supplier bargaining power and trade credit provision.
Finally, our paper is related to the literature analyzing the role of trade credit in
developing economies (McMillan and Woodruff, 1999; Fisman and Love, 2003; Johnson
McMillan and Woodruff, 2002; Allen, Qian and Qian, 2005; Cull, Xu and Zhu, 2008). The
general idea in this literature is that trade credit can offer a viable substitute for formal bank
credit in countries with low levels of financial development. Cull, Xu and Zhu (2008) do not find
support for this theory in a sample of Chinese firms.1
The remainder of the paper is organized as follows. Section 2 discusses the theoretical
literature and derives our testable hypotheses. Section 3 describes the data. Section 4 presents our
empirical results. Section 5 discusses a series of robustness checks and additional results. Section
6 concludes.
Rather, they argue that the high growth
rate in China is fueled by a growing private sector with increasing competitive pressure, which is
likely to be an important motivation for the use of trade credit. Our results are in line with their
argument.
2. Related literature and testable hypotheses
The traditional explanation for the existence of trade credit is that trade credit plays a
nonfinancial role. That is, trade credit reduces transaction costs (Ferris, 1981), allows price
discrimination between customers with different credit-worthiness (Brennan, Maksimovic, and
Zechner, 1988), fosters long-term relations with customers (Summers and Wilson, 2002), and
even provides a warranty for quality when customers cannot observe product characteristics
(Long, Malitz and Ravid, 1993). More recently, financial theories argue that suppliers have a
lending advantage over financial institutions, due to better information (Biais and Gollier, 1997),
lower borrower’s opportunism (Burkart and Ellingsen, 2004), or a liquidation advantage (Fabbri
and Menichini, 2010). This paper focuses on those theories that link the decision to offer trade
credit to the strength of the supplier/customer relation. For example, Wilner (2000) builds on a
simple intuition that if a buyer depends a lot on a seller, the seller is in a better position to force
immediate payment. And vice-versa, if a seller depends strongly on a buyer’s purchase, the
1 They focus on differences in ownership structures, since in China it is not so much the lack of a formal financial system but rather its institutional bias in favor of state-owned enterprises that could give rise to trade credit among viable firms with restricted or no access to credit from state-owned banks.

4
buyer could delay payment more often. In particular, Wilner’s (2000) model predicts higher
trade credit when the customer’s purchases count for a larger share of the firm’s profits, i.e.
when the supplier’s bargaining power is low. The implications of this theory, extended to include
trade credit terms, generate the following prediction:
HP1: When customer’s purchase count for a larger share of supplier’s sales, the supplier
is more likely to offer trade credit, the amount of goods sold on credit is higher, and the offered
trade credit terms are better.
The supplier’s bargaining power might depend on the degree of competition in the
product market. When the product market is very competitive because many firms supply
homogenous goods, profit margins are low. Each supplier of the good is in a weak position to
enforce payments and is eager to allow delayed repayments to attract new customers, or to
prevent existing customers from switching to a different supplier. The opposite is true when the
supplier is a monopolist. It follows that supplier’s market power is negatively associated with
trade credit provision. Fisman and Raturi (2004) obtain this prediction in a setting where
customers have to take specific up-front investments to establish their creditworthiness for the
credit to be provided. It follows that in less competitive markets, customers have less incentive to
do that, because of holdup problems in the future, and thus less trade credit is provided. The
implications of this theory, extended to include trade credit terms, generate the following
prediction:
HP2: When the product market is more competitive, the supplier is more likely to offer
trade credit, the amount of goods sold on credit is higher, and the offered trade credit terms are
better.
Cun͂at (2007) proposes another theory, which is related to the bargaining power
hypothesis. His model predicts higher levels of trade credit when both buyers and suppliers are in
a sort of bilateral monopoly (e.g., low competition), due to the higher switching costs on both
sides. According to Cun͂at (2007), intermediate goods tailored to the specific needs of the buyer
make both suppliers and customers difficult to substitute. This theory has two implications for
our analysis: First, it shows that product characteristics, like standardization, can affect the
degree of effective competition faced by the supplier and, more generally, the bargaining power
5
of the supplier vis-à-vis the customer. Second, this theory predicts higher trade credit when both
suppliers and customers have strong bargaining power (or competition is low). The implications
of Cun͂at (2007), extended to trade credit terms, generate the following prediction:
HP3: When intermediate goods are tailored to the specific needs of the buyer, the
supplier is more likely to offer trade credit, the amount of goods sold on credit is higher, and the
trade credit terms are better.
By offering credit to its customers, the firm postpones its receipt of cash payments and
needs to finance its own provision of credit. Firms can use bank credit, if they have access to
external finance. Existing literature provides both evidence (Petersen and Rajan, 1997) and
theoretical explanations (e.g., Burkart and Ellingsen, 2004; Bias and Gollier, 1997) for larger
trade credit demand by credit-constrained firms. In contrast, there is no clear-cut evidence that
credit constraints affect trade credit supply. For example, Giannetti, Burkart and Ellingsen
(2011) find that the availability of a line of credit does not affect the amount of trade credit
offered. We argue that financial constraints might have a differential effect on trade credit,
depending on whether firms are in need or not to offer trade credit. If the supplier is dealing with
an important customer (or faces high competition in the product market), she has a stronger need
to finance the supply of trade credit. However, credit constraints not necessarily affect trade
credit supply in less competitive markets. We thus test the following prediction:
HP4: When firms with weak bargaining power are credit constrained, they are less likely
to supply trade credit, allow a smaller share of goods to be paid on account, and offer worse
credit terms.
3. Data and Summary Statistics
We use firm-level data on about 2,500 Chinese firms, which was collected as part of the
World Bank Enterprise Surveys conducted by the World Bank with partners in 76 developed and
developing countries. The dataset includes a large, randomly selected sample of firms across 12
two-digit manufacturing and service sectors. The surveys include both quantitative and
qualitative information on barriers to growth, including sources of finance, regulatory burdens,
innovations, access to infrastructure services, legal difficulties, and corruption. One limitation of
the database is that only limited accounting (balance sheet) data is surveyed. In addition, in

6
many countries (including China) the survey excludes firms with less than four years of age, in
order to complete questions on firm performance and behavior relative to three-years earlier.
We use the 2003 World Bank Enterprise Survey for China2
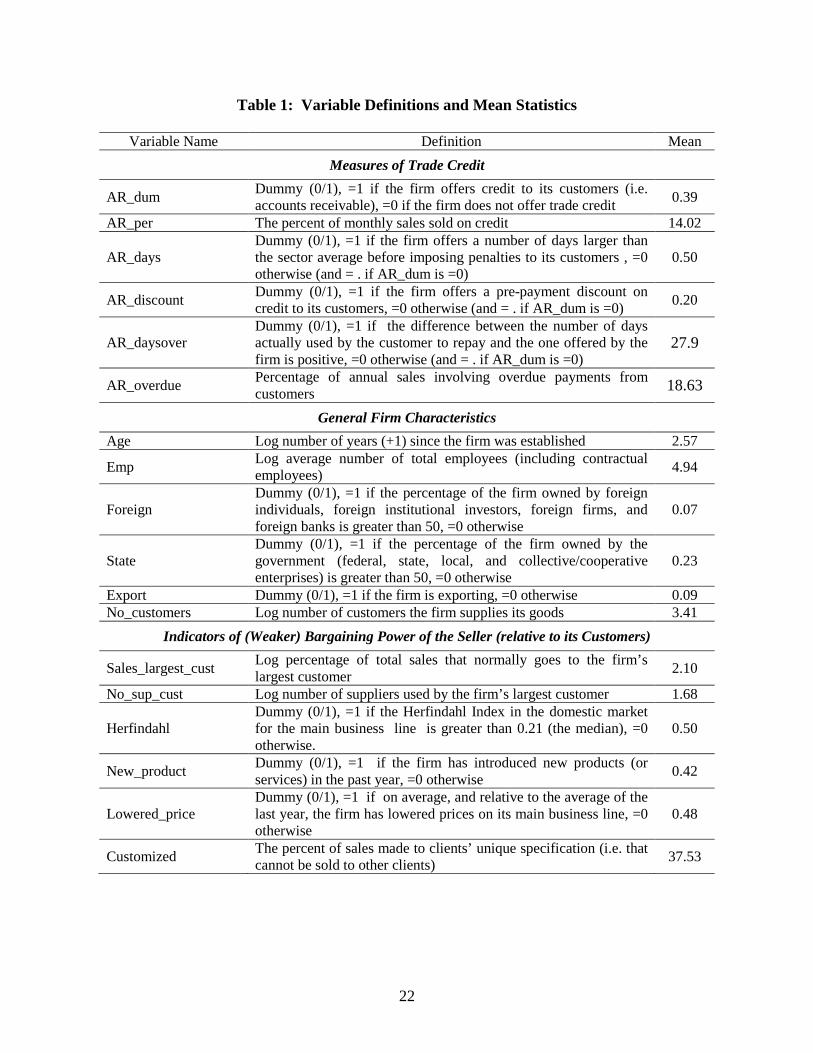
Table 1 shows the variable definitions and their means. We include measures of trade
credit, general firm characteristics, indicators of market power of the firm relative to its
customers, access to bank financing, length of the supplier-customer relation, and product
characteristics of the goods sold on credit. Detailed summary statistics are shown in Table 2 for
the full sample. Table 3 divides the sample in two groups, firms that offer trade credit
(AR_dum=1) and firms that do not offer trade credit (AR_dum=0), and shows the mean
difference and its statistical significance for all our explanatory variables, including firm’s
characteristics (Panel A) and our proxies of bargaining power (Panel B). Table 4 breaks down
one proxy of bargaining power between firms offering and not offering trade credit, across all
sectors and the main firm’s characteristics. Finally, Table 5 shows correlation matrices for all
variables.
, which is the only country
survey to include detailed questions on trade credit contract terms offered, as well as additional
questions on the product market environment - the number and importance of customers, the
number of competitors and their market shares - and on the characteristics of supplier-customer
relation. For the purpose of our analysis, the key questions regard the extension and terms of
trade credit. Importantly, the survey asks, (i) whether firms offer trade credit to customers, (ii)
the percentage of monthly sales sold on credit, (iii) whether firms offer discount to customers
who pay in cash, (iv) how long firms allow customer to use trade credit, (v) on average, how fast
suppliers get the actual payments, and finally, (vi) what percentage of annual sales involves
overdue payments from customers. In our sample, about 90% of firms report whether or not they
extend trade credit to their customers.
3.1 Trade credit variables
Our main dependent variable is a dummy variable equal to one if the firm offers trade
credit (accounts receivable), and zero otherwise (AR_d). We find that 39% of the firms in our
sample offer trade credit and that the full-sample average percentage of goods sold on credit is
14% (AR_per), increasing to 35% for the subsample of firms that offer trade credit. On average,
2 For additional information on the World Bank Enterprise Survey for China, see Ayyagari, et al. (2010).

7
firms that extend trade credit offer customers about one month to pay, with clustering on some
payment periods. For example, 37% of the suppliers offer a payment period of 30 days, 16%
offer 60 days, 18% offer 90 days, and 9% offer 180 days. Since sector characteristics affect
offered payment periods (Ng, Smith, and Smith, 1997), we use a dummy variable equal to one if
the firm offers a payment period longer than the sector average, and zero otherwise (AR_days).
Finally, we find that 20% of firms that offer trade credit offer a prepayment discount
(AR_discount).
Our data set also allows us to examine the payment performance of customers (i.e., the
collection of accounts receivables). First, we construct a dummy variable (AR_daysover) equal to
one if the days actually used to repay are greater than the days offered by suppliers (customers
pay late); the dummy is equal to 0 otherwise, i.e., when customers pay on time or prepay. In our
sample, 28% of the firms receive late payments, 35% of firms receive early payments, and 37%
receive timely payments. Next, we compute the percentage of annual sales that involve overdue
payments (AR_overdue). We find that on average 19% of the annual sales involve overdue
payments.
3.1.1 Sample comparisons
We perform a number of empirical tests to verify that our sample is representative of
China at the national level and we compare the use of trade credit in China versus other
developing and developed economies. First, Cull et al. (2008) use a large data set of over
100,000 industrial private Chinese firms and find an average percentage of sales financed by
accounts receivable of 18%.3
We also find that the use of trade credit in China is comparable to other countries. For
example, using the complete World Bank Enterprise Survey database of over 100 developed and
developing countries, we find that the average number of firms using trade credit for working
capital or investment purposes (the only comparative variable available across countries) is 45%
in our China sample, and 51% for the complete set of countries. In addition, the average
percentage of trade credit used for working capital purposes (averaged across firms that use trade
credit) is 48% of total working capital financing in China, versus 44% for the complete sample.
This compares well to the 14% in our sample of firms (AR_per),
suggesting that our random sample of Chinese firms is indeed nationally representative.
3 Cull et al. (2008) data set is for 2003 and does not include additional contract information on accounts payables.
8
There are some differences on the use of trade credit in comparison to the U.S..
According to the Federal Reserve Survey of Small Business Financing (SSBF) database of U.S.
firms, about 65% of firms use trade credit (account payables) to finance supplier purchases, as
opposed to 45% in our sample of Chinese firms. Furthermore, the percentage of purchases
financed by trade credit is 20% among U.S. SMEs that take trade credit from suppliers (versus
10% in our sample of Chinese firms) and 20% of firms that use trade credit are offered an early
payment discount from their suppliers (in comparison to 7% in our sample of Chinese firms).4
In
summary, the Chinese trade credit data is representative of the country, highly comparable to the
average in developed and developing countries, and not too different compared to the U.S.
3.2 Firm and industry characteristics
We include in all regressions some general firm characteristics that are likely to be
associated with trade credit. First, the number of years since the firm was established in
logarithm (Age). Second, the number of total employees (including contractual employees) in log
(Emp), as a proxy for firm size. All our empirical results are robust to using alternative measures
of firm size, such as dummies indicating small, medium, and large firms. Likewise, we get
similar results if we replace the log of total employment with the log of total sales, although we
are less comfortable using accounting data because of the large number of missing observations
and unaudited firms in our sample. Third, we include the log of the number of customers the
supplier is dealing with (No_customers), to account for any mechanical relation between the
number of customers and the likelihood to offer trade credit or the amount offered. Fourth, we
include a dummy variable equal to one if the percentage of the firm owned by foreign
individuals, foreign investors, foreign firms, and foreign banks is greater than 50%, and equal to
zero otherwise (Foreign). Fifth, we include a dummy variable equal to one if the percentage of
the firm owned by the government (national, state, and local government, and
cooperative/collective enterprises) is greater than 50% (State). We include these ownership
dummy variables to control for possible preferential access to financing from foreign and state-
owned banks, respectively. It might also be the case that foreign and state-owned firms have
preferential foreign and government product markets, respectively, and are not as sensitive to
4 These comparisons refer to accounts payable. All the U.S. firm statistics are from Giannetti, Burkart, and Ellingsen (2011).

9
market competition. In our sample, 7% of firms are foreign-owned, while 23% are state-owned.
All results are robust to using a 30% cutoff (instead of 50% cutoff) to identify foreign and state
ownership. Sixth, we include a dummy variable equal to one if the firm sells its products abroad
and equal to zero otherwise (Export). We include this variable to control for possible differences
in trade credit use among national and foreign customers. In our sample, 9% of firms are
identified as exporters.
Next, we control for the firm’s liquidity, using the percentage of unused lines of credit
(LC_unused). This variable is equal to zero if the firm does not have a line of bank credit. The
average percentage of unused credit line is 7% in our sample. However, less than 30% of the
firms have access to a line of credit from the banking sector and of these firms’ lines of credit,
26% are unused. The low-level of financial access to the formal credit market suggests that many
Chinese firms are likely to be credit-constrained.
Table 3 shows that firms that extend trade credit (with AR_dum=1) are significantly more
likely to be mature, larger, foreign and state-owned firms, export firms and firms with a larger
unused line of credit than firms that do not offer any trade credit (with AR_dum=0).
All regressions also include 17 city dummies and 12 industry dummies that corresponds
to 2-digit NACE codes, which is the finest level of available sector classification.5 Industry
dummies are supposed to control for the role of “industry standards” in setting trade credit
contract terms.6
5 Similarly, Giannetti, et al. (2011) use a 2-digit industry classification to identify product specificity.
Additional detailed information is available on the firm’s “main business” line.
However, this information cannot be used in our regression analysis, as there are 1,818 different
classifications and 99% of them include only one firm. Nevertheless, we study trade credit
patterns of firms within a few classifications that include more than 10 firms. For instance, 33
firms are classified as “dress manufacturing”, which is a subsector of the 2-digit sector “Garment
and Leather Products”. On average, 31% of dress manufacturing firms extend trade credit
(versus 34% of the larger 2-digit sector they belong to). For the 11 firms that extend trade credit
to their customers, the percentage of sales offered ranges from 10% to 100% (the median is
20%); terms offered include 3, 4, 10, 30, 40, and 90 days; and three firms (27%) offer a discount.
These statistics are very similar to the overarching 2-digit sector, where the median percentage of
goods sold on credit is 18% and 22% offer a discount. When we look at other narrow industry
6 We exclude from our sample 157 firms that provide financial services.

10
classifications, we find similar patterns. This small exercise suggests that our 2-digit industry
classification is appropriate to control for the role of industry standards in setting trade credit
terms.
3.3 Measures of Bargaining Power
Our next set of explanatory variables concerns the bargaining power of the firm with
respect to its customers. First, we measure the importance of the firm’s largest customer using
the percentage of total sales that normally goes to the firm’s largest customer
(Sales_largest_cust). On average, 25% of total sales go to the firm’s largest customer. A larger
share implies a more important customer and thus a weaker supplier’s bargaining power.
Second, we measure the firm’s bargaining power with the number of suppliers (including
the firm itself) used by its largest customer (No_supl_cust). If the main customer uses many
suppliers, it is less dependent on the firm – i.e., ending the relationship poses less of a risk of a
holdup problem – and consequently this implies less market power for the firm, relative to its
customer. Half of the firms in our sample deal with customers that have less than six suppliers
and the average number of suppliers used by the firm’s largest customer is nine. Only 10% of
firms have customers dealing with more than 20 suppliers.
Third, we construct a Herfindahl Index to measure the degree of competition in the
domestic market. Specifically, for the main business line we have information on the percentage
of total sales in the domestic market supplied by the firm and by its main competitor and the total
number of competitors in this market. This information is only available for a sub-sample of
firms. Given that we do not know the market shares of all the competitors (but the main one), we
assume that they are all equal.7
7
The Herfindahl index is calculated as follows: Herfindahl =(x/100)2+(y/100)2 + (Ncomp)*[(100-x-y)/(100*Ncomp)]2, where x and y are the firm’s and the main competitor’s market share, respectively. Ncomp is the total number of competitors but the main one.
This assumption implies that our continuous variable is a very
noisy measure of sales’ concentration in the domestic market. As a result, we use a dummy
variable (Herfindahl) equal to one if the concentration index is larger than the median value
(0.21) and zero otherwise. A higher value of the concentration index implies a less competitive
product market and therefore a stronger bargaining power of suppliers relative to their customers.

11
As a measure of bargaining power, we also include a dummy variable equal to one if the
firm has introduced a new product, or service, or business line, in the past year, assuming that
this event would require the firm to compete with a new product (New_product). Moreover, we
proxy for broader changes in the competitive landscape with a dummy equal to one if, relative to
the average of the previous year, the firm has lowered average prices on its main business line
(Lowered_price). We implicitly assume this was a response to greater competitive pressures in
the market. In our sample, 42% of suppliers have introduced a new product or service and 48%
have lowered their prices. Finally, product characteristics can affect the seller-buyer relationship
and thus the relative bargaining power. Following Cun͂at (2007), we measure the strength of the
seller-buyer relationship with the percentage of sales made to the clients’ unique specification
(Customized). The distribution of this variable is highly skewed. Half of the firms in our sample
have less than 10% of customized sales, but the average percentage of sales made to clients’
unique specification is 37%.
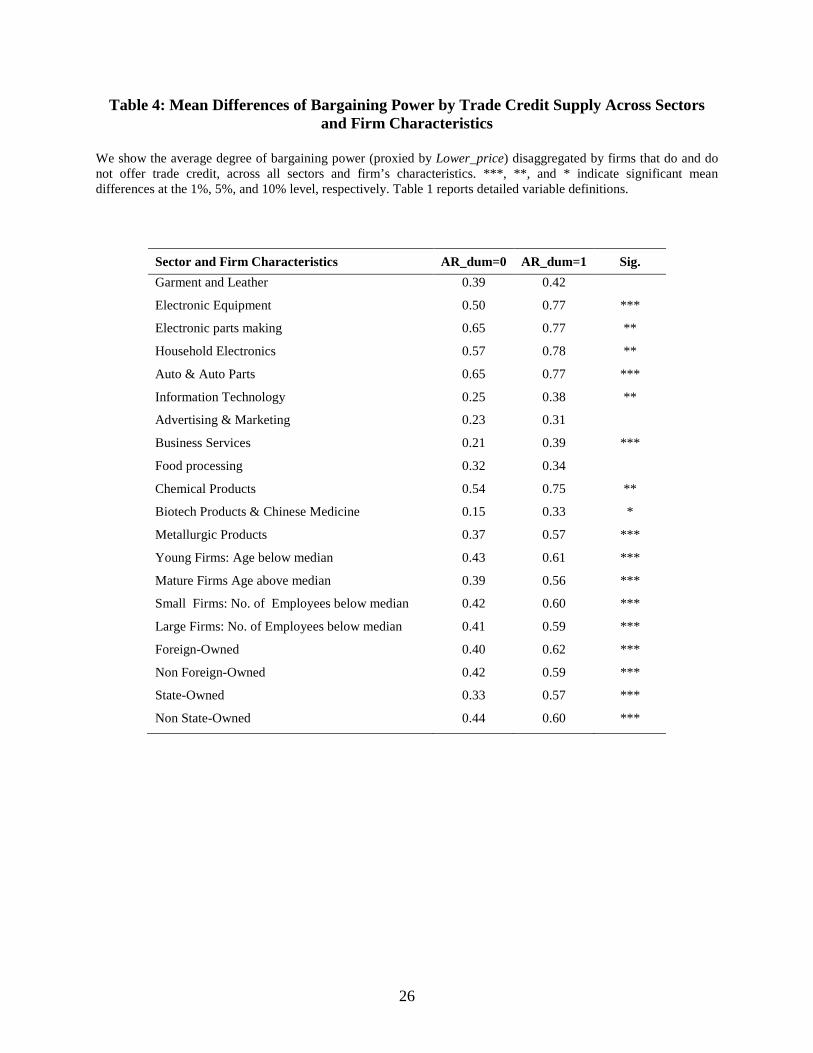
Tables 3 and 4 provide preliminary evidence of a positive relation between weaker
bargaining power and trade credit supply. Table 3, Panel B shows that firms extending trade
credit (with AR_dum=1) have a weaker bargaining power than firms that do not offer trade credit
(with AR_d=0), using all our proxies of market power, except the percentage of sales made to the
clients’ unique specification. Table 4 breaks down the information in Table 3, Panel B and
reports the mean value of Lower_price for firms that do and do not offer trade credit,
disaggregated by sectors and firm’s characteristics. Table 4 strengthens our previous findings.
Specifically, firms offering trade credit are more likely to operate in competitive markets than
firms that do not offer trade credit in all sectors, and significantly so in nine sectors out of 12.
Moreover, both young and mature firms, small and large firms, foreign and non foreign-
controlled firms, state and non state-controlled firms that offer trade credit are all more likely to
operate in competitive markets than firms that do not offer trade credit. We obtain very similar
results if we replace AR_dum with the percentage of goods sold of credit (AR_per) below and
above the median as an indicator of trade credit supply.
12
4. Results
In this section, we first investigate the relation between different aspects of trade credit and
the supplier’s bargaining power. We then examine how bank credit constraints interact with the
supply of trade credit with different degrees of bargaining power.
4.1 Trade credit provision and the supplier’s bargaining power
Table 6 shows the results of a set of regressions where the dependent variable is the
decision to offer trade credit, which represents the traditional dependent variable used in the
literature. In Table 7, we exploit the richness of our data and look at the determinants of other
trade credit terms. All regressions control for general firm characteristics, for 12 industry fixed-
effects, and for 17 city fixed-effects.
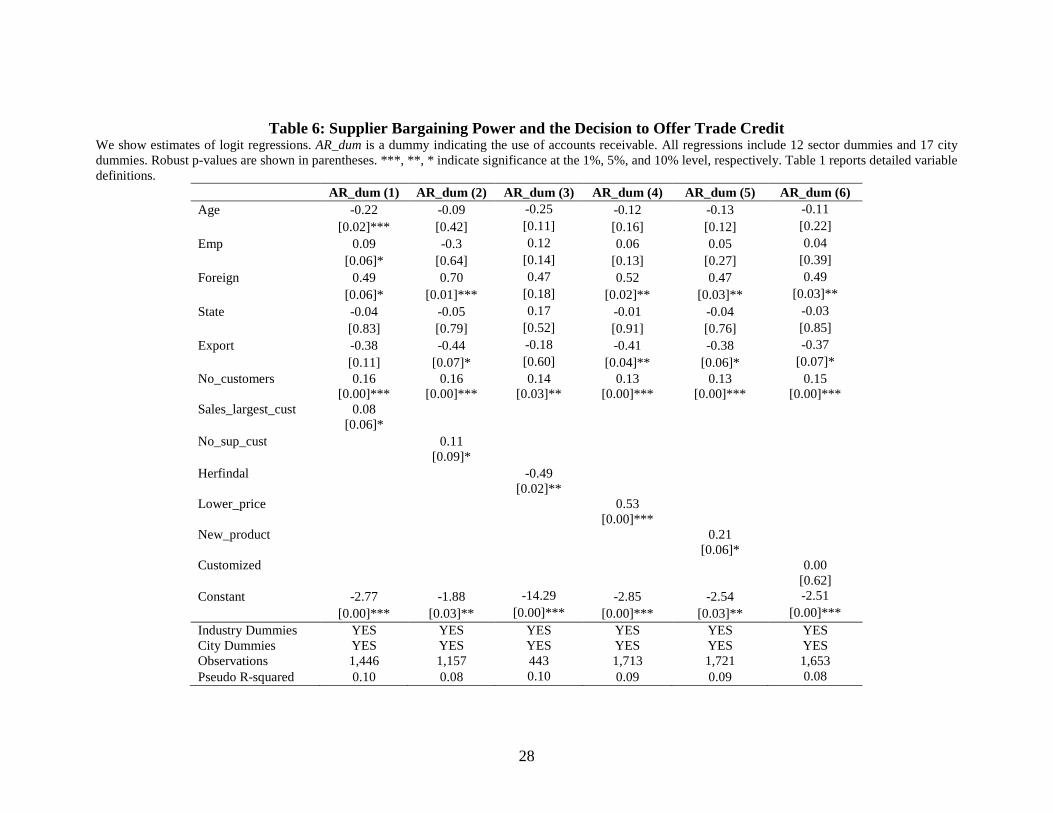
Table 6 shows consistent evidence that a weaker supplier’s bargaining power has a
positive and statistically significant effect on the supplier’s decision to offer trade credit. For
instance in Column 1, the larger the percentage of sales to the largest customer, the more likely
firms are to extend trade credit, in line with our first testable hypothesis in Section 2. Moreover,
the degree of competition faced by the supplier in the product market affects the decision to offer
trade credit, in line with Fisman and Raturi (2004) and our second testable hypothesis: the larger
the number of suppliers of the firm’s most important customer (Column 2), or the lower the
degree of sale concentration in the domestic market (Column 3), the more likely firms are to
extend trade credit. In addition, firms that have lowered prices in the past year (Column 4) or
introduced new products (Column 5) are more likely to extend trade credit. Finally, we include
the percentage of sales made to clients’ unique specification (Column 6) to test our third
hypothesis. We find that selling a larger proportion of customized goods does not have a
significant effect on the decision to offer trade credit.
As for the other firm characteristics, there is some evidence that younger firms are more
likely to offer trade credit (Column 1). The negative relation between firm’s age and trade credit
supply could depend on the stronger competition that new firms face when entering the product
market. Moreover, larger firms are more likely to extend trade credit (Column 1), which might
be related to their longer and more established customer and supplier relationships. Our finding
that larger and younger firms offer more trade credit is not necessarily counterintuitive in a
developing country context, where firms often remain small over time (and fail to grow as they

13
age); for instance, the correlation between firm size and age in our sample is only 0.30 percent.8
Table 7 extends the analysis to the effect of bargaining power on the other trade credit
terms. The dependent variable is either the percentage of goods sold on credit (AR_per), or the
offered payment period (AR_days), or the decision to offer a prepayment discount
(AR_discount). We also look at the customers’ payment history including the difference between
the number of days used versus offered to repay (AR_daysover), and the share of overdue
payments (AR_overdue).
There is consistent evidence that firms with important foreign equity ownership and firms with a
large number of customers have a higher probability to offer trade credit (Columns 1 to 6). In
general, we find no significant relationship between the decision to offer trade credit and state
ownership. Finally, there is some evidence that exporting firms have a lower probability of
offering trade credit (Columns 2 and 4 to 6), which might be explained by the difficulty in
collecting late payments overseas or litigating in a foreign court.
9 Specifically, Table 7 shows that our proxies of low bargaining power,
namely suppliers dealing with important customers (Panel A) and facing increased competition
in the product market (Panel B), are associated with a larger share of goods sold on account and
longer payment periods offered before imposing penalties. We do not find evidence that the
supplier’s bargaining power affects the likelihood to offer a prepayment discount. This is
consistent with the finding of Klapper, Laeven and Rajan (2012) that discounts for early payment
are offered to riskier buyers to limit their potential non-payment risk. Table 7 also shows that
important customers actually extend the payment period beyond what has been offered to them
and their suppliers have a larger percentage of sales involving overdue payments. We obtain
similar results (not shown) if we measure the bargaining power of the supplier with the number
of total suppliers used by the main customer (No_supl_cust) or with a dummy indicating whether
the firm has introduced a new product (New_product).10
When we look at the other firm’s characteristics, Table 7 shows that larger firms have
more goods sold on credit and a lower share of overdue payments (Columns 1 and 5 in Panels A
and B). We do not find significant relationships between foreign ownership and credit terms.
8 For additional discussion, see Klapper, et al. (2006), which shows that the relationship between age and size (measured by value added) is smaller in countries with weaker business environments. 9 Note that the dependent variables AR_days, AR_discount, AR_daysover, and AR_overdue are constructed using only firms that offer trade credit (i.e., AR_d=1). 10 These results are not shown to save space, but are available upon request.

14
State-owned firms are associated with customers extending the payment period beyond what has
been offered by their suppliers (Column 4 in both panels).
Overall our findings provide empirical support for our testable hypotheses 1 and 2 and are
consistent with the idea that trade credit might be used as a competitive device to reduce actual
competition, prevent entry, attract new customers or avoid losing the existing ones. In all these
cases, trade credit can become crucial for the survival of the firm. For example, a one-standard
deviation positive shock to product market competition (measured by Sales_largest_cust)
increases the likelihood to offer trade credit (AR_dum) by about 0.14 percentage points, which
represents 36% of the average likelihood. The same shock also increases the share of goods sold
on credit (AR_per) by about 3%, which corresponds to about 20% of the average amount of trade
credit offered. Both figures suggest that the effect of competition on trade credit supply is
economically very relevant. The economic significance is even stronger when we use other
measures of bargaining power like Lower_price or New_product.
4.2 How do suppliers in competitive market finance trade credit provision?
In our sample, 847 firms offer trade credit and 81% of them have no credit lines.
Suppliers offering trade credit are more likely to have a larger unused credit line (LC_unused), as
shown in Table 3. Overall this preliminary evidence suggests that the lack of bank financing is
likely to affect trade credit decisions. However, when we control for unused bank credit lines in a
regression analysis, we do not find any significant effect on trade credit supply, in line with
previous evidence (i.e., Giannetti, et al., 2011).11
More specifically, Table 8 shows the effect of the variable LC_unused on the likelihood
to offer trade credit (AR_d) and on the percentage of sales financed by trade credit (AR_per), in
sub-samples of firms with low and high bargaining power, measured with different proxies of
bargaining power: top/bottom quartile of sales to the largest customer (Panel A), top /bottom
quartile of the number of suppliers used by the largest customer (Panel B), firms that have
This section explores further the relation among
suppliers’ credits constraints and the decision to offer trade credit, conditioning on the supplier’s
bargaining power.
11 We do not report these results to save space, but they are available on request.

15
lowered prices with respect to the previous year (Panel C), and firms that have introduced a new
product (Panel D).
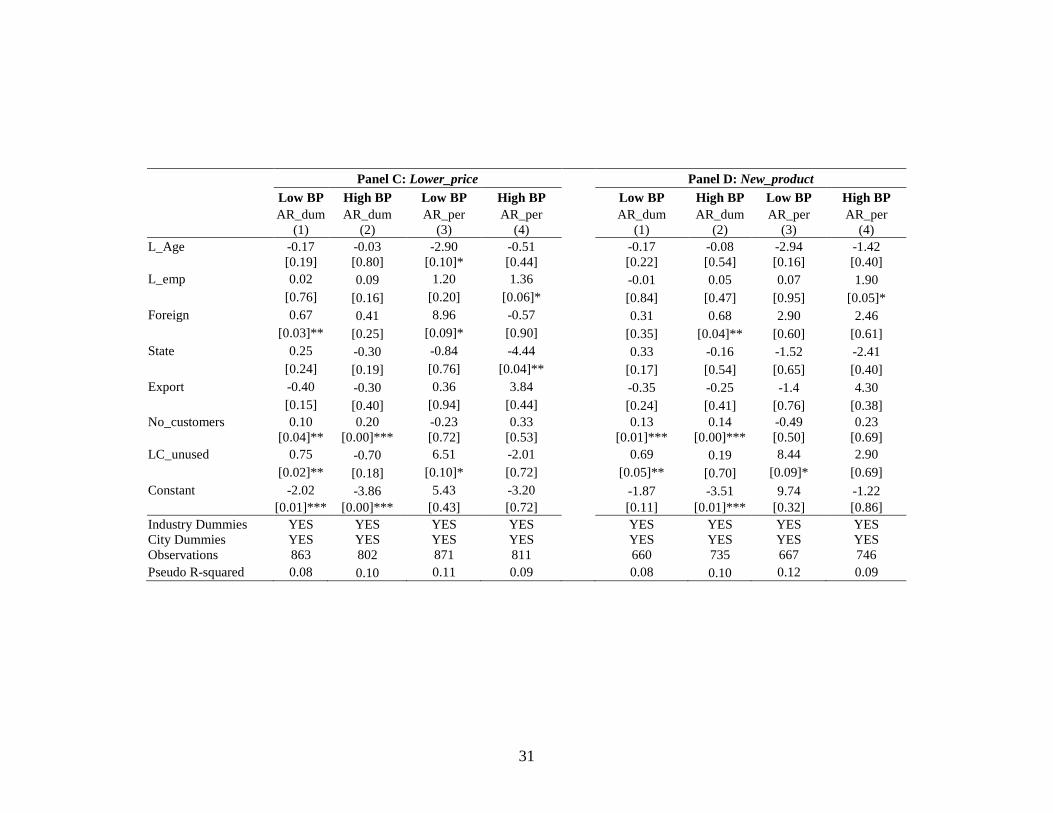
Table 8 documents that bank credit constraints reduce trade credit supply of firms dealing
with important customers or facing stronger competition in the product market. In contrast,
having an unused credit line has no effect on trade credit decisions when suppliers have stronger
bargaining power towards their customers. For example, the firms whose most important
customer relies on more than 10 input providers are more likely to offer trade credit and sell a
larger share of goods on account when they hold a larger proportion of unused credit lines
(Columns 1 and 3 of Panel B). Similarly, the firms that reduced prices or introduced a new
product are more likely to offer trade credit and sell a larger share of goods on account when
they have a larger percentage of unused credit lines (Columns 1 and 3 of Panels C and D).
Overall, these findings provide empirical support to our testable Hypothesis 4.
5. Robustness Checks
In this section, we present several robustness checks. We first investigate whether our
findings can be consistent with the supplier’s information advantage hypothesis and with the
warrantee for product quality theory. We then show that our results still hold when we replicate
our analysis for some selected industries and subsamples of firms.
5.1 Bargaining power versus information advantage
One could argue that the percentage of sales to the biggest customer (Sales_largest_cust)
could also capture an advantage in information requisition by the supplier, which leads him to
provide credit to his customer, as theoretically shown by Bias and Gollier (1997) or Burkart and
Ellingsen (2004). If this is the case, we should find that our proxy of bargaining power is not
significant anymore, once we control for the supplier having some information advantages over
the buyer’s project quality, or about the buyer’s deception of other firms.
We measure the supplier’s information advantage in three different ways. First, our survey
asks the supplier whether he would be able to find out if one of his main clients deceives another
firm. We use this survey question to construct a dummy variable that takes value equal to one for
a positive answer and zero otherwise (Info_adv). Our second and third proxies are based on the
idea that the supplier’s information advantage is a natural by-product of its business. Suppliers
16
are often in the same industry as their clients and they often visit their customers’ premises.
Therefore the information advantage is likely to depend on the proximity between buyers and
suppliers and on the length of their relationship. Our survey provides information on the
percentage of sales to customers located in five different areas: in the same district as the
supplier’s plant, outside the same district but within the same city, outside the same city but
within the same province, outside the same province by within the same country or overseas. We
measure customer’s proximity by the percentage of sales going to customers located in the local
market, i.e., in the same district or in the same city (Local_market). Finally, we use the average
length of the buyer-supplier relation as a proxy of information advantage (Age_rel_customer).
Panel A, B and C of Table 9 show the results of these robustness tests for the decision to offer
trade credit (AR_dum), the percentage of goods sold on credit (AR_per), and the offered payment
period (AR_days). Our proxies of supplier’s information advantage have a positive and
statistically significant effect on the percentage of goods sold on credit (column 2 of panel A and
C) and on the offered payment period (column 3), suggesting that suppliers with better
information about customers are indeed more likely to offer trade credit and extend longer
payment period, in line with the supplier’s information advantage theory. However, these
significant findings do not drive out the explanatory power of bargaining power, which has a
positive and statistically significant coefficient in all the regressions. Similar results (not shown)
hold for the other dependent variables, such as the payment period actually used by customers
(AR_daysover) and the percentage of overdue payments (AR_overdue).
5.2 Bargaining power versus product quality
The finding that firms introducing new products are more likely to extend trade credit
could also be interpreted as evidence of the warranty for product quality check theory, as
suggested by Long, Malitz and Ravid (1993) and Klapper, Laeven, and Rajan (2012). Since a
new product involves quality uncertainty, trade credit could be offered to give the buyer the
possibility to check the product quality before the payment is due. Alternatively, in line with Lee
and Stowe (1993), the New_product variable could be interpreted as a proxy for complexity,
suggesting that product risk and asymmetric information on the product market that increase
with complexity could explain why firms offer trade credit.

17
We can control for these alternative interpretations using the percentage of sales carrying
a warrantee (Warranty) and the percentage of products that are certified (Certified). When
products are sold with a warranty, the buyer can return the good without incurring in extra costs,
if the quality of the good does not meets the expected standards. Similarly, if the product sold is
certified, product risk and asymmetric information should be lower. Thus, if the New_product
variable proxies for quality checking needs or for the degree of complexity and uncertainty,
rather than for bargaining power, it should not be statistically significant once we control for the
provision of the warranty and the certification. Table 10 shows that the variable New_product is
indeed still significant with the expected sign in all the regressions, while the percentage of sales
carrying a warrantee and the percentage of certified products do not seem to significantly affect
the decision to offer trade credit, the proportion of goods sold on credit, or the offered payment
periods.
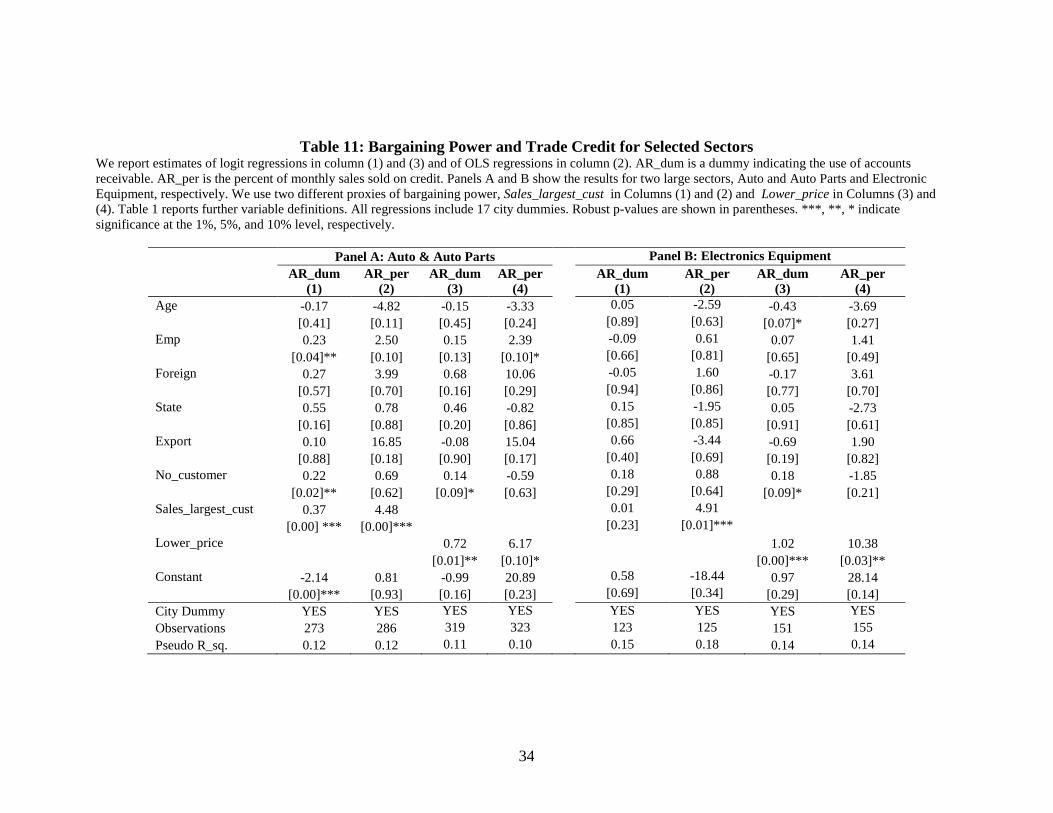
5.3 Bargaining power and cross-sectional variation
Our identification strategy exploits cross-sectional variation in trade credit supply and
proxies of bargaining power. Table 4 provides descriptive evidence of a positive correlation
between trade credit supply and bargaining power across most of the sectors in our sample and
across firm’s characteristics. These preliminary findings are confirmed in our regression
analysis, where we control for firm’s characteristics and 12 sector dummies. To provide further
evidence that trade credit terms offered are not only exclusively driven by industry standards, in
Table 11, we replicate the analysis of Table 6 (AR_dum) and Table 7 (AR_per) within two of the
largest sectors: Auto & Auto Parts and Electronic Equipment. All our previous results are
confirmed. Weaker supplier’s bargaining power (measured by Salelargest and Lower_price) is
positively related to the decision to offer trade credit and to the percentage of goods sold on
credit. Moreover, our results are confirmed when we restrict the sample to firms with state
ownership below 50% (State=0), or to non-exporter firms (Export=0). Our results are also robust
to the inclusion of a dummy variable equal to one if the firm belongs to a government sponsored
industrial park, science park, or Export Promotion Zone (EPZ).12
Finally, although our data does not allow us to exploit the time-series variability of trade
credit supply and bargaining power variables, some questions in the survey refer to past firm
12 Regression results are not reported here, but are available upon request.

18
activity and limited accounting information is available, both for the current and the previous
three years. We use this limited time-series information to control for potential idiosyncratic
shocks at the firm level. For example, we construct a set of dummy variables to control for
whether the firm increased sales, fixed assets, or the number of total employees in the past three
years. These dummies are insignificant and do not affect our main results.
6. Conclusion
This paper uses firm-level data on about 2,500 Chinese firms to study trade credit terms
offered by suppliers and the payment history of customers. Supplier financing is often
overlooked in the capital structure literature, although it is arguably the most important source of
financing for small and medium sized enterprises, particularly in countries with less developed
financial markets. We show that firms use trade credit as a competitive gesture. More
specifically, suppliers are more likely to offer trade credit and better credit terms to powerful and
important customers, who also are more likely to force payment periods longer than the ones
offered and to generate overdue payments. Being credit constrained by banks prevents weaker
suppliers from offering trade credit and thus reduces their ability to compete in the product
market.
If competition is one of the main drivers of the decision to offer trade credit, why do
firms not simply reduce the product price instead of offering a trade credit discount? A price
reduction is not necessarily simpler than offering trade credit. A price reduction is observable by
competitors and can trigger their immediate reaction by causing a price war that can be
detrimental for the full industry. Trade credit is a less aggressive and more flexible instrument.
Moreover, the two instruments – price reduction and trade credit - could also be used as
complement strategies. In our analysis, we use the variable Lower_price as an indicator of
competition and find that firms that lowered their prices relative to the previous year are more
likely to offer trade credit. This finding could be interpreted indeed as evidence of
complementarity.
We believe that our results shed light on trade credit behavior more broadly than the
Chinese market. Unique features of the Chinese economy – such as the bias towards state-owned
banks and state-owned firms – have been decreasing since 2001 (two years before our survey
takes place) and we control for potential biases. Moreover, there are no country-specific

19
regulations on inter-firm financing. Finally, this paper focuses on the role of competition on trade
credit decisions. While competition is relatively new in China, it is a widespread common feature
of developed and market-based economies.
20
References Ayyagari, Meghana, Asli Demirguc-Kunt, and Voijslav Maksimovic, 2010. Formal versus
Informal Finance: Evidence from China. Review of Financial Studies 23, 3048-3097. Allen, Franklin, Jun Qian, and Meijaun Quian, 2005. Law, Finance and Economic Growth in
China. Journal of Financial Economics 77, 57-116. Bias, Bruno and Christian Gollier, 1997. Trade Credit and Credit Rationing. Review of Financial Studies, 10, 903-937. Brennan, Michael, Vojislav Maksimovic and Josef Zechner, 1988. Vendor Financing. Journal
of Finance 43, 1127-1141. Burkart, Mike and Tore Ellingsen (2004), In-Kind Finance: A Theory of Trade Credit. American
Economic Review, 94, 569-590. Cull, Robert, Lixin Colin Xu, and Tian Zhu, 2008. Formal Finance and Trade Credit during
China’s Transition. Journal of Financial Intermediation 18, 173-192. Cun͂at, Vicente, 2007. Trade Credit: Suppliers as Debt Collectors and Insurance Providers,
Review of Financial Studies, 20, 491-527. Demirguc-Kunt, Asli, and Vojislav Maksimovic, 2002. Firms as Financial Intermediaries:
Evidence from Trade Credit Data, World Bank, Working Paper. Fabbri, Daniela and Annamaria Menichini, 2010. Trade Credit, Collateral Liquidation and
Borrowing Constraints. Journal of Financial Economics, 96, 413-432. Ferris, J. Stephen, 1981. A Transaction Theory of Trade Credit Use. Quarterly Journal of Economics, 96, 247-270. Fisman, Raymond and Inessa Love, 2003. Trade Credit, Financial Intermediary Development,
and Industry Growth, Journal of Finance 58, 353-374. Fisman, R., and M. Raturi, 2004. Does Competition Encourage Credit Provision? Evidence
from African Trade Credit Relationships. Review of Economics and Statistics 86, 345-352. Giannetti, Mariassunta, Burkart, Mike and Tore Ellingsen, 2011. What You Sell is What You
Lend? Explaining Trade Credit Contracts. Review of Financial Studies, 24, 1261-1298.

21
Johnson, Simon, John McMillan and Christopher Woodruff, 2002. Courts and Relational
Contracts. Journal of Law, Economics and Organization18, 221-277. Klapper, Leora, Luc Laeven, and Raghu Rajan, 2012. Trade Credit Contracts. Review of
Financial Studies, 25, 838-867. Klapper, Leora, Sarria-Allende, Virginia and Zaidi, Rida, 2006. A Firm-level analysis of small
and medium size enterprise financing in Poland. Policy Research Working paper Series 3984, The World Bank.
Lee, Yul W. and John D. Stowe, 1993. Product Risk, Asymmetric Information, and Trade Credit,
Journal of Financial and Quantitative Analysis 28, 285–300. Long, Michael S., Ileen B. Malitz and S. Abraham Ravid, 1993. Trade Credit, Quality Guarantees, and Product Marketability. Financial Management 22, 117-127. Marotta, Giuseppe, 2005. Is Trade Credit More Expensive than Bank Credit Loans? Evidence
from Italian Firm-Level Data. Applied Economics 37(4), 403-416. McMillan, John and Christopher Woodruff, 1999. Interfirm Relationships and Informal Credit
in Vietnam, The Quarterly Journal of Economics 114, 1285-1320. Petersen, Mitchell A. and Raghuram G. Rajan, 1997. Trade Credit: Theory and Evidence. Review
of Financial Studies, 10 (3), 661-691. Summers, Barbara and Nicholas Wilson, 2002. Trade Credit Terms Offered by Small Firms:
Survey Evidence and Empirical Analysis. Journal of Business and Finance Accounting 29, 317-335.
Wilner, Benjamin S. 2000. The Exploitation of Relationships in Financial Distress: The Case of
Trade Credit. The Journal of Finance 55, 153-178.
22
Table 1: Variable Definitions and Mean Statistics
Variable Name Definition Mean
Measures of Trade Credit
AR_dum Dummy (0/1), =1 if the firm offers credit to its customers (i.e. accounts receivable), =0 if the firm does not offer trade credit 0.39
AR_per The percent of monthly sales sold on credit 14.02
AR_days Dummy (0/1), =1 if the firm offers a number of days larger than the sector average before imposing penalties to its customers , =0 otherwise (and = . if AR_dum is =0)
0.50
AR_discount Dummy (0/1), =1 if the firm offers a pre-payment discount on credit to its customers, =0 otherwise (and = . if AR_dum is =0) 0.20
AR_daysover Dummy (0/1), =1 if the difference between the number of days actually used by the customer to repay and the one offered by the firm is positive, =0 otherwise (and = . if AR_dum is =0)
27.9
AR_overdue Percentage of annual sales involving overdue payments from customers 18.63
General Firm Characteristics
Age Log number of years (+1) since the firm was established 2.57 Emp Log average number of total employees (including contractual
employees) 4.94
Foreign Dummy (0/1), =1 if the percentage of the firm owned by foreign individuals, foreign institutional investors, foreign firms, and foreign banks is greater than 50, =0 otherwise
0.07
State Dummy (0/1), =1 if the percentage of the firm owned by the government (federal, state, local, and collective/cooperative enterprises) is greater than 50, =0 otherwise
0.23
Export Dummy (0/1), =1 if the firm is exporting, =0 otherwise 0.09 No_customers Log number of customers the firm supplies its goods 3.41
Indicators of (Weaker) Bargaining Power of the Seller (relative to its Customers)
Sales_largest_cust Log percentage of total sales that normally goes to the firm’s largest customer 2.10
No_sup_cust Log number of suppliers used by the firm’s largest customer 1.68
Herfindahl Dummy (0/1), =1 if the Herfindahl Index in the domestic market for the main business line is greater than 0.21 (the median), =0 otherwise.
0.50
New_product Dummy (0/1), =1 if the firm has introduced new products (or services) in the past year, =0 otherwise 0.42
Lowered_price Dummy (0/1), =1 if on average, and relative to the average of the last year, the firm has lowered prices on its main business line, =0 otherwise
0.48
Customized The percent of sales made to clients’ unique specification (i.e. that cannot be sold to other clients) 37.53

23
Other Firm Characteristics
LC_unused The percent of the firm’s line of credit or overdraft facility that is currently unused (=0 if the firm does not have a line of credit or overdraft facility)
0.07
Info_adv Dummy (0/1), =1 if the firm is able to find out when one of his main clients deceives another firm, =0 otherwise
Age_customer_rel Number of years the firm has done business with its clients in its main business line. 4.10
Local_market Dummy (0/1), =1 if at least 50% of the supplier’s products in its main business line are sold to customers located in the same district or outside the district but in the same city as the supplier’s plant, =0 otherwise
0.41
Warrantee The percentage of sales carrying a warrantee 90.7 Certified The percent of the number of the firm’s products that are certified 46.57

24
Table 2: Summary Statistics
We show summary statistics for all the variables used in the empirical analysis and defined in Table 1.
Variable Name Obs. Mean Std. Dev. Min Max
AR_dum 2,157 0.39 0.49 0.00 1.00
AR_per 2,184 14.02 27.97 0.00 100.00
AR_days 818 0.36 0.50 0.00 1.00
AR_discount 823 0.20 0.40 0.00 1.00
AR_daysover 809 0.28 0.45 0.00 1.00
AR_overdue 813 18.63 20.47 0.00 100.00
Age 2,243 2.57 0.74 1.39 3.99
Emp 2,239 4.94 1.48 0.00 11.16
Foreign 2,242 0.07 0.26 0.00 1.00
State 2,242 0.23 0.42 0.00 1.00
Export 2,265 0.09 0.28 0.00 1.00 No_customers 1,874 3.41 1.75 0.00 14.31 Sales_largest_cust 1,814 2.10 1.74 0.00 4.60
No_sup_cust 1,580 1.68 1.02 0.00 4.59
Herfindahl 541 0.50 0.50 0.01 1.00
Lower_price 2,222 0.48 0.50 0.00 1.00
New_product 2,223 0.42 0.49 0.00 1.00
Customized 2,047 37.53 42.05 0.00 100.00
LC_unused 2,152 0.07 0.21 0.00 1.00
Info_adv 2,102 0.24 0.43 0.00 1.00
Age_customer_rel 2,201 4.10 1.27 1.00 5.00
Local_market 2,173 0.41 0.49 0.00 1.00
Warrantee 2,138 90.70 25.17 0.00 100.00
Certified 2,065 46.57 45.79 0.00 100.00

25
Table 3: Mean Differences of Firm Characteristics by Trade Credit Supply
We show the means of firm characteristics (Panel A) and bargaining power measures (Panel B), disaggregated by firms that do and do not offer trade credit. ***, **, and * indicate significant mean differences at the 1%, 5%, and 10% level, respectively. Table 1 reports detailed variable definitions.
Variable Name AR_dum=0 AR_dum=1 Significance Panel A
Age 2.60 2.51 ***
Emp 4.84 5.11 ***
Foreign 0.06 0.10 ***
State 0.24 0.19 ***
Export 0.09 0.11 *
No_customers 3.22 3.68 ***
LC_unused 0.06 0.09 ***
Info_adv 0.22 0.26 **
Age_customer_rel 4.04 4.18 ***
Local_market 0.44 0.34 ***
Warrantee 89.43 93.46 ***
Certified 41.42 54.99 ***
Panel B Sales_largest_cust 2.02 2.29 ***
No_sup_cust 1.61 1.79 *
Herfindahl 0.31 0.24 ***
Lower_price 0.41 0.60 ***
New_product 0.36 0.51 ***
Customized 37.45 37.60
26
Table 4: Mean Differences of Bargaining Power by Trade Credit Supply Across Sectors and Firm Characteristics
We show the average degree of bargaining power (proxied by Lower_price) disaggregated by firms that do and do not offer trade credit, across all sectors and firm’s characteristics. ***, **, and * indicate significant mean differences at the 1%, 5%, and 10% level, respectively. Table 1 reports detailed variable definitions.
Sector and Firm Characteristics AR_dum=0 AR_dum=1 Sig. Garment and Leather 0.39 0.42
Electronic Equipment 0.50 0.77 ***
Electronic parts making 0.65 0.77 **
Household Electronics 0.57 0.78 **
Auto & Auto Parts 0.65 0.77 ***
Information Technology 0.25 0.38 **
Advertising & Marketing 0.23 0.31
Business Services 0.21 0.39 ***
Food processing 0.32 0.34
Chemical Products 0.54 0.75 **
Biotech Products & Chinese Medicine 0.15 0.33 *
Metallurgic Products 0.37 0.57 ***
Young Firms: Age below median 0.43 0.61 ***
Mature Firms Age above median 0.39 0.56 ***
Small Firms: No. of Employees below median 0.42 0.60 ***
Large Firms: No. of Employees below median 0.41 0.59 ***
Foreign-Owned 0.40 0.62 ***
Non Foreign-Owned 0.42 0.59 ***
State-Owned 0.33 0.57 ***
Non State-Owned 0.44 0.60 ***
27
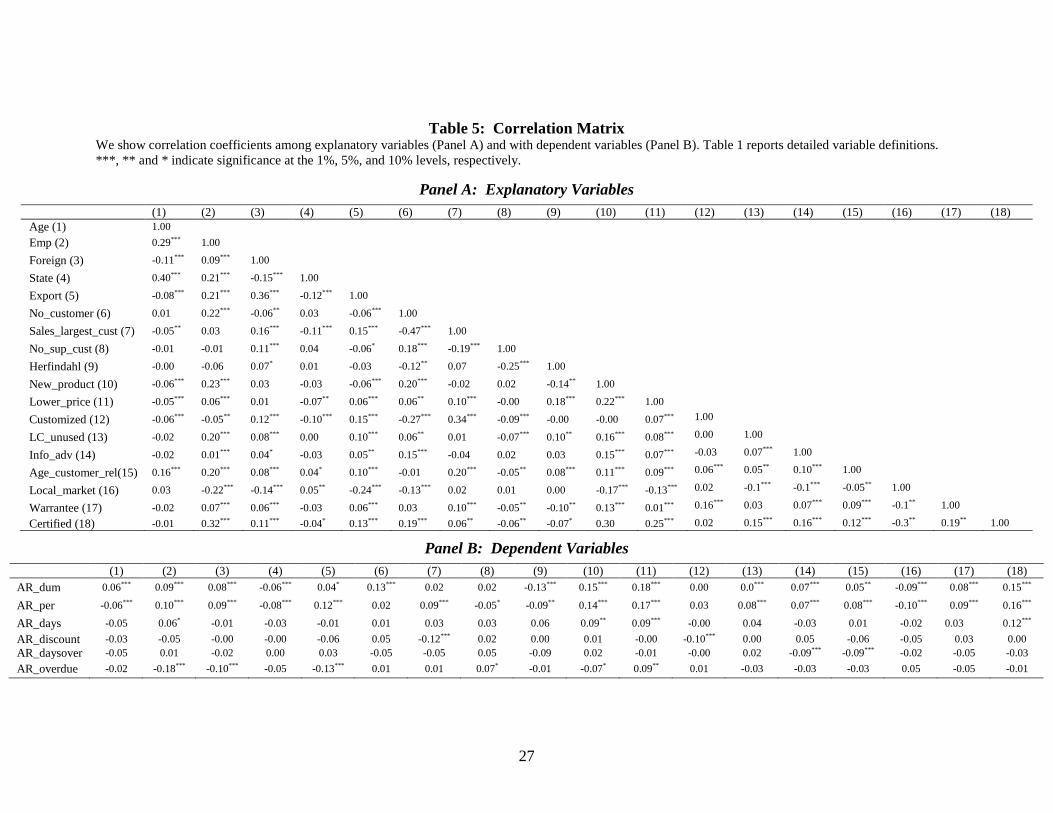
Table 5: Correlation Matrix We show correlation coefficients among explanatory variables (Panel A) and with dependent variables (Panel B). Table 1 reports detailed variable definitions. ***, ** and * indicate significance at the 1%, 5%, and 10% levels, respectively.
Panel A: Explanatory Variables
(1) (2) (3) (4) (5) (6) (7) (8) (9) (10) (11) (12) (13) (14) (15) (16) (17) (18) Age (1) 1.00 Emp (2) 0.29*** 1.00
Foreign (3) -0.11*** 0.09*** 1.00
State (4) 0.40*** 0.21*** -0.15*** 1.00
Export (5) -0.08*** 0.21*** 0.36*** -0.12*** 1.00
No_customer (6) 0.01 0.22*** -0.06** 0.03 -0.06*** 1.00
Sales_largest_cust (7) -0.05** 0.03 0.16*** -0.11*** 0.15*** -0.47*** 1.00
No_sup_cust (8) -0.01 -0.01 0.11*** 0.04 -0.06* 0.18*** -0.19*** 1.00
Herfindahl (9) -0.00 -0.06 0.07* 0.01 -0.03 -0.12** 0.07 -0.25*** 1.00
New_product (10) -0.06*** 0.23*** 0.03 -0.03 -0.06*** 0.20*** -0.02 0.02 -0.14** 1.00
Lower_price (11) -0.05*** 0.06*** 0.01 -0.07** 0.06*** 0.06** 0.10*** -0.00 0.18*** 0.22*** 1.00
Customized (12) -0.06*** -0.05** 0.12*** -0.10*** 0.15*** -0.27*** 0.34*** -0.09*** -0.00 -0.00 0.07*** 1.00
LC_unused (13) -0.02 0.20*** 0.08*** 0.00 0.10*** 0.06** 0.01 -0.07*** 0.10** 0.16*** 0.08*** 0.00 1.00
Info_adv (14) -0.02 0.01*** 0.04* -0.03 0.05** 0.15*** -0.04 0.02 0.03 0.15*** 0.07*** -0.03 0.07*** 1.00
Age_customer_rel(15) 0.16*** 0.20*** 0.08*** 0.04* 0.10*** -0.01 0.20*** -0.05** 0.08*** 0.11*** 0.09*** 0.06*** 0.05** 0.10*** 1.00
Local_market (16) 0.03 -0.22*** -0.14*** 0.05** -0.24*** -0.13*** 0.02 0.01 0.00 -0.17*** -0.13*** 0.02 -0.1*** -0.1*** -0.05** 1.00
Warrantee (17) -0.02 0.07*** 0.06*** -0.03 0.06*** 0.03 0.10*** -0.05** -0.10** 0.13*** 0.01*** 0.16*** 0.03 0.07*** 0.09*** -0.1** 1.00
Certified (18) -0.01 0.32*** 0.11*** -0.04* 0.13*** 0.19*** 0.06** -0.06** -0.07* 0.30 0.25*** 0.02 0.15*** 0.16*** 0.12*** -0.3** 0.19** 1.00
Panel B: Dependent Variables
(1) (2) (3) (4) (5) (6) (7) (8) (9) (10) (11) (12) (13) (14) (15) (16) (17) (18) AR_dum 0.06*** 0.09*** 0.08*** -0.06*** 0.04* 0.13*** 0.02 0.02 -0.13*** 0.15*** 0.18*** 0.00 0.0*** 0.07*** 0.05** -0.09*** 0.08*** 0.15***
AR_per -0.06*** 0.10*** 0.09*** -0.08*** 0.12*** 0.02 0.09*** -0.05* -0.09** 0.14*** 0.17*** 0.03 0.08*** 0.07*** 0.08*** -0.10*** 0.09*** 0.16***
AR_days -0.05 0.06* -0.01 -0.03 -0.01 0.01 0.03 0.03 0.06 0.09** 0.09*** -0.00 0.04 -0.03 0.01 -0.02 0.03 0.12*** AR_discount -0.03 -0.05 -0.00 -0.00 -0.06 0.05 -0.12*** 0.02 0.00 0.01 -0.00 -0.10*** 0.00 0.05 -0.06 -0.05 0.03 0.00 AR_daysover -0.05 0.01 -0.02 0.00 0.03 -0.05 -0.05 0.05 -0.09 0.02 -0.01 -0.00 0.02 -0.09*** -0.09*** -0.02 -0.05 -0.03 AR_overdue -0.02 -0.18*** -0.10*** -0.05 -0.13*** 0.01 0.01 0.07* -0.01 -0.07* 0.09** 0.01 -0.03 -0.03 -0.03 0.05 -0.05 -0.01
28
Table 6: Supplier Bargaining Power and the Decision to Offer Trade Credit We show estimates of logit regressions. AR_dum is a dummy indicating the use of accounts receivable. All regressions include 12 sector dummies and 17 city dummies. Robust p-values are shown in parentheses. ***, **, * indicate significance at the 1%, 5%, and 10% level, respectively. Table 1 reports detailed variable definitions.
AR_dum (1) AR_dum (2) AR_dum (3) AR_dum (4) AR_dum (5) AR_dum (6) Age -0.22 -0.09 -0.25 -0.12 -0.13 -0.11 [0.02]*** [0.42] [0.11] [0.16] [0.12] [0.22] Emp 0.09 -0.3 0.12 0.06 0.05 0.04 [0.06]* [0.64] [0.14] [0.13] [0.27] [0.39] Foreign 0.49 0.70 0.47 0.52 0.47 0.49 [0.06]* [0.01]*** [0.18] [0.02]** [0.03]** [0.03]** State -0.04 -0.05 0.17 -0.01 -0.04 -0.03 [0.83] [0.79] [0.52] [0.91] [0.76] [0.85] Export -0.38 -0.44 -0.18 -0.41 -0.38 -0.37 [0.11] [0.07]* [0.60] [0.04]** [0.06]* [0.07]* No_customers
0.16 [0.00]***
0.16 [0.00]***
0.14 [0.03]**
0.13 [0.00]***
0.13 [0.00]***
0.15 [0.00]***
Sales_largest_cust
0.08 [0.06]*
No_sup_cust 0.11
[0.09]*
Herfindal
-0.49
[0.02]**
Lower_price 0.53
[0.00]***
New_product 0.21
[0.06]*
Customized
0.00
[0.62] Constant -2.77 -1.88 -14.29 -2.85 -2.54 -2.51 [0.00]*** [0.03]** [0.00]*** [0.00]*** [0.03]** [0.00]*** Industry Dummies City Dummies Observations
YES YES 1,446
YES YES 1,157
YES YES 443
YES YES 1,713
YES YES 1,721
YES YES 1,653
Pseudo R-squared 0.10 0.08 0.10 0.09 0.09 0.08

29
Table 7: Supplier Bargaining Power and Trade Credit Terms We show estimates of OLS regressions in columns (1) and (5) and logit regressions in columns (2) - (4). AR_per is the percent of monthly sales sold on credit. AR_days is a dummy indicating if the firm offers to its customers a number of days larger than the sector average before imposing penalties. AR_discount is a dummy indicating if the firm offers a pre-payment discount on credit to its customers. AR_daysover is a dummy equal to one when the number of days used to repay are larger than the days offered. AR_overdue is the percentage of annual sales that involves overdue payment. Table 1 reports further variable definitions. We use Sales_largest_cust (Panel A) and Lower_price (Panel B) as measures of supplier bargaining power. Regressions include 12 sector dummies and 17 city dummies. Robust p-values are shown in parentheses. ***, **, * indicate significance at the 1%, 5%, and 10% level, respectively.
Panel A: Sales_largest_cust Panel B: Lower_price (1) (2) (3) (4) (5) (1) (2) (3) (4) (5) AR_per AR_days AR_discount AR_daysover AR_overdue AR_per AR_days AR_discount AR_daysover AR_overdue Age -2.42 -0.2 -0.02 0.27 0.46 -1.62 -0.15 -0.06 0.26 0.60 [0.03]** [0.19] [0.92] [0.31] [0.74] [0.11] [0.26] [0.72] [0.24] [0.70] Emp 1.63 0.12 -0.15 -0.15 -1.51 1.30 0.10 -0.12 -0.17 -1.39 [0.00]*** [0.12] [0.19] [0.31] [0.02]** [0.02]** [0.14] [0.24] [0.20] [0.03]** Foreign 3.12 -0.39 -0.28 0.36 -4.34 4.41 -0.21 -0.06 0.40 -3.25 [0.41] [0.29] [0.62] [0.59] [0.09]* [0.20] [0.47] [0.89] [0.50] [0.19] State -2.15 -0.12 -0.29 0.78 -2.02 -2.40 -0.12 -0.24 0.73 -3.06 [0.23] [0.67] [0.40] [0.10]* [0.40] [0.15] [0.66] [0.43] [0.09]* [0.16] Export 0.73 -0.48 -0.25 -1.55 -5.29 2.45 -0.03 -0.40 -1.82 -7.17 [0.83] [0.25] [0.66] [0.08]* [0.03] [0.44] [0.92] [0.35] [0.06]* [0.01]** No_customers
0.39 [0.35]
-0.01 [0.82]
0.06 [0.45]
0.05 [0.57]
0.59 [0.24]
0.04 [0.92]
-0.07 [0.21]
0.09 [0.19]
-0.10 [0.27]
-0.49 [0.28]
Sales_largest_cust 1.53 0.01 -8.36e-03 0.32 1.65 [0.00]*** [0.07]* [0.12] [0.01]** [0.01]*** Lowerprice
5.64 [0.00]***
0.32 [0.08]*
0.15 [0.53]
0.37 [0.25]
2.95 [0.10]*
Constant -0.30
[0.95] -0.32 [0.77]
0.12 [0.92]
-15.40 [0.00]***
25.07
[0.00]***
0.31
[0.95]
-0.07 [0.95]
0.22
[0.86]
-14.24
[0.00]***
31.83
[0.01]*** Industry Dummies City Dummies Observations
YES YES 1,459
NO YES 566
YES YES 550
YES YES 433
YES YES 561
YES YES 1,733
NO YES 691
YES YES 674
YES YES 535
YES YES 687
Pseudo R-squared 0.10 0.06 0.13 0.17 0.14 0.10 0.04 0.12 0.14 0.14

30
Table 8: How Do Firms With Low Bargaining Power Finance Trade Credit Provision? We report estimates of logit regressions in Columns (1) and (2) and OLS regressions in Columns (3) and (4). AR_dum is a dummy indicating the use of accounts receivable. AR_per is the proportion of monthly sales sold on credit. Table 1 reports further variable definitions. We use Sales_largest_cust (Panel A), No_sup_cust (Panel B), Lower_price (Panel C), and New_product (Panel D), as measures of supplier bargaining power. All regressions include 12 sector dummies and 17 city dummies. Robust p-values are shown in parentheses. ***, **, * indicate significance at the 1%, 5%, and 10% level, respectively.
Panel A: Sales_largest_cust Panel B: No_Sup_ cust Low BP High BP Low BP High BP Low BP High BP Low BP High BP
AR_dum (1)
AR_dum (2)
AR_per (3)
AR_per (4)
AR_dum (1)
AR_dum (2)
AR_per (3)
AR_per (4)
L_Age -0.14 -0.09 -6.61 -0.34 0.09 -0.40 1.15 -4.42 [0.46] [0.92] [0.02]** [0.81] [0.65] [0.01]*** [0.56] [0.05]** L_emp 0.02 0.12 2.57 1.39 -0.10 0.05 -0.68 1.11 [0.82] [0.22] [0.06]* [0.11] [0.29] [0.55] [0.49] [0.39] Foreign 0.76 -0.25 -2.43 -4.85 1.26 0.90 3.53 5.58 [0.05]** [0.71] [0.71] [0.37] [0.06] [0.02]** [0.53] [0.38] State -0.08 -0.17 -1.00 -1.68 0.32 0.09 -0.69 0.26 [0.81] [0.61] [0.82] [0.49] [0.30] [0.76] [0.83] [0.94] Export -0.50 0.06 0.21 -0.47 0.05 -0.32 -3.33 9.62 [0.24] [0.92] [0.97] [0.08]* [0.92] [0.38] [0.58] [0.11] No_customers
0.17 [0.04]**
0.19 [0.00]***
1.32 [0.19]
14.03 [0.10]*
0.07 [0.37]
0.25 [0.00]***
-0.04 [0.96]
0.47 [0.60]
LC_unused 0.60 0.12 17.27 -4.37 2.42 -0.52 20.39 1.58 [0.29] [0.87] [0.08]* [0.28] [0.00]*** [0.20] [0.02]** [0.80] Constant -14.97 -3.76 2.62 1.09 -2.70 -2.06 -1.73 34.19 [0.00]*** [0.00]*** [0.73] [0.90] [0.00]*** [0.17] [0.77] [0.15] Industry Dummies City Dummies Observations
YES YES 399
YES YES 449
YES YES 406
YES YES 476
YES YES 421
YES YES 515
YES YES 427
YES YES 517
Pseudo R-squared 0.12 0.15 0.14 0.15 0.12 0.13 0.13 0.17
31
Panel C: Lower_price Panel D: New_product Low BP High BP Low BP High BP Low BP High BP Low BP High BP
AR_dum (1)
AR_dum (2)
AR_per (3)
AR_per (4)
AR_dum (1)
AR_dum (2)
AR_per (3)
AR_per (4)
L_Age
-0.17 [0.19]
-0.03 [0.80]
-2.90 [0.10]*
-0.51 [0.44]
-0.17 [0.22]
-0.08 [0.54]
-2.94 [0.16]
-1.42 [0.40]
L_emp 0.02 0.09 1.20 1.36 -0.01 0.05 0.07 1.90 [0.76] [0.16] [0.20] [0.06]* [0.84] [0.47] [0.95] [0.05]* Foreign 0.67 0.41 8.96 -0.57 0.31 0.68 2.90 2.46 [0.03]** [0.25] [0.09]* [0.90] [0.35] [0.04]** [0.60] [0.61] State 0.25 -0.30 -0.84 -4.44 0.33 -0.16 -1.52 -2.41 [0.24] [0.19] [0.76] [0.04]** [0.17] [0.54] [0.65] [0.40] Export -0.40 -0.30 0.36 3.84 -0.35 -0.25 -1.4 4.30 [0.15] [0.40] [0.94] [0.44] [0.24] [0.41] [0.76] [0.38] No_customers
0.10 [0.04]**
0.20 [0.00]***
-0.23 [0.72]
0.33 [0.53]
0.13 [0.01]***
0.14 [0.00]***
-0.49 [0.50]
0.23 [0.69]
LC_unused 0.75 -0.70 6.51 -2.01 0.69 0.19 8.44 2.90 [0.02]** [0.18] [0.10]* [0.72] [0.05]** [0.70] [0.09]* [0.69] Constant -2.02 -3.86 5.43 -3.20 -1.87 -3.51 9.74 -1.22 [0.01]*** [0.00]*** [0.43] [0.72] [0.11] [0.01]*** [0.32] [0.86] Industry Dummies City Dummies Observations
YES YES 863
YES YES 802
YES YES 871
YES YES 811
YES YES 660
YES YES 735
YES YES 667
YES YES 746
Pseudo R-squared 0.08 0.10 0.11 0.09 0.08 0.10 0.12 0.09

32
Table 9: Bargaining Power versus Information Advantage We report estimates of logit regressions in Columns (1) and (3), and of OLS regressions in Column (2). AR_dum is a dummy indicating the use of accounts receivable. AR_per is the percent of monthly sales sold on credit. AR_days is a dummy indicating if the firm offers to its customers a number of days larger than 30 before imposing penalties. Panel A, B, and C control for whether the supplier has information on customer’s deception (Info_adv), for the proximity of customers (Local_market), and for the age of the supplier/customer relation (Age_customer_rel), respectively. Table 1 reports further variable definitions. All regressions include 12 sector dummies and 17 city dummies. Robust p-values are shown in parentheses, ***, **, * indicate significance at the 1%, 5%, and 10% level, respectively.
Panel A Panel B Panel C
AR_dum (1)
AR_per (2)
AR_days (3)
AR_dum (1)
AR_per (2)
AR_days (3)
AR_dum (1)
AR_per (2)
AR_days (3)
Age -0.21 -2.30 -0.49 -0.23 -2.44 -0.64 -0.23 -2.64 -0.64 [0.03]** [0.04]** [0.26] [0.02]** [0.03]** [0.14] [0.02]** [0.02]** [0.14] Emp 0.09 1.63 -0.26 0.09 1.66 -0.21 0.09 1.56 -0.21 [0.06]* [0.00]*** [0.10]* [0.08]* [0.00]*** [0.20] [0.07]* [0.01]*** [0.20] Foreign 0.50 3.62 0.14 0.50 3.32 0.11 0.49 3.01 0.11 [0.05]* [0.35] [0.09]* [0.05]** [0.39] [0.17] [0.06]* [0.43] [0.7] State -0.04 -2.02 -0.32 -0.02 -2.10 -0.41 -0.04 -2.23 -0.41 [0.80] [0.27] [0.40] [0.92] [0.30] [0.26] [0.80] [0.21] [0.26] Export -0.37 1.18 -0.16 -0.40 1.01 -0.12 -0.37 0.56 -0.12 [0.13] [0.75] [0.59] [0.11] [0.78] [0.70] [0.12] [0.87] [0.70] No_customers
0.15 [0.00]***
0.35 [0.42]
-0.01 [0.83]
0.16 [0.00]***
0.42 [0.33]
-0.02 [0.76]
0.16 [0.00]***
0.36 [0.40]
-0.02 [0.76]
Sales_largest_cust 0.08 1.54 0.001 0.08 1.55 0.01 0.07 1.41 0.01 [0.07]* [0.00]*** [0.10]* [0.05]* [0.00]*** [0.04]** [0.07]* [0.00]*** [0.04]** Info_adv 0.16 2.39 0.47 [0.18] [0.10]* [0.02]** Local_market -0.10 0.45 0.54 [0.40] [0.77] [0.02]** Age_customer_rel 0.04 0.91 0.54 [0.43] [0.07]* [0.02]** Constant -2.82 -1.63 0.09 -2.51 -0.44 0.09 -2.30 -3.32 0.01 [0.00]*** [0.77] [0.94] [0.00]*** [0.94] [0.943] [0.00]*** [0.57] [0.94] Ind. Dummies City Dummies Observations
YES YES 1,432
YES YES 1,443
NO YES 517
YES YES 1,443
YES YES 1,456
NO YES 520
YES YES 1,439
YES YES 1,452
NO YES 520
Pseudo R-sq. 0.10 0.11 0.08 0.10 0.10 0.07 0.10 0.11 0.07

33
Table 10: Bargaining Power versus Product Quality We report estimates of logit regressions in columns (1) and (3) and of OLS regressions in column (2). AR_dum is a dummy indicating the use of accounts receivable. AR_per is the percent of monthly sales sold on credit. AR_days is a dummy indicating if the firm offers to its customers a number of days larger than 30 before imposing penalties. Panels A and B control for the percentage of goods carrying a warrantee (Warrantee) and for the proportion of firm’s products that are certified (Certified), respectively. Table 1 reports further variable definitions. All regressions include 12 sector dummies and 17 city dummies. Robust p-values are shown in parentheses, ***, **, * indicate significance at the 1%, 5%, and 10% level, respectively.
Panel A Panel B
AR_dum (1)
AR_per (2)
AR_days (3)
AR_dum (1)
AR_per (2)
AR_days (3)
Age -0.11 -2.14 0.07 -0.09 -1.99 0.08 [0.16] [0.06]* [0.86] [0.30] [0.11] [0.85] Emp 0.04 1.31 -0.11 0.04 1.04 -0.09 [0.36] [0.04]** [0.47] [0.33] [0.14] [0.60] Foreign 0.48 4.13 0.09 0.50 7.93 0.02 [0.02]** [0.32] [0.22] [0.03]** [0.11] [0.77] State -0.03 -3.30 -0.14 0.01 -2.93 0.12 [0.79] [0.08]* [0.65] [0.94] [0.15] [0.73] Export -0.37 6.33 -0.08 -0.36 4.37 -0.01 [0.06]* [0.14] [0.78] [0.07]* [0.38] [0.97] No_customers
0.13 [0.00]***
-0.34 [0.44]
-0.05 [0.39]
0.13 [0.00]***
-0.28 [0.58]
-0.09 [0.13]
New_product
0.21 [0.06]*
2.67 [0.10]*
0.21 [0.07]*
0.20 [0.09]*
3.38 [0.07]*
0.41 [0.06]*
Warrantee
0.001 [0.66]
0.02 [0.59]
-0.00 [0.42]
Certified
0.4e-03 [0.76]
0.01 [0.68]
0.05** [0.05]
Constant -2.57 3.59 0.52 -2.72 1.96 0.20 [0.00]*** [0.57] [0.54] [0.00]*** [0.73] [0.81] Ind.Dummies City Dummies Observations
YES YES 1,701
YES YES 1,446
NO YES 589
YES YES 1,610
YES YES 1,214
NO YES 488
Pseudo R-sq. 0.08 0.11 0.06 0.08 0.11 0.06
34
Table 11: Bargaining Power and Trade Credit for Selected Sectors
We report estimates of logit regressions in column (1) and (3) and of OLS regressions in column (2). AR_dum is a dummy indicating the use of accounts receivable. AR_per is the percent of monthly sales sold on credit. Panels A and B show the results for two large sectors, Auto and Auto Parts and Electronic Equipment, respectively. We use two different proxies of bargaining power, Sales_largest_cust in Columns (1) and (2) and Lower_price in Columns (3) and (4). Table 1 reports further variable definitions. All regressions include 17 city dummies. Robust p-values are shown in parentheses. ***, **, * indicate significance at the 1%, 5%, and 10% level, respectively.
Panel A: Auto & Auto Parts Panel B: Electronics Equipment
AR_dum (1)
AR_per (2)
AR_dum (3)
AR_per (4)
AR_dum (1)
AR_per (2)
AR_dum (3)
AR_per (4)
Age -0.17 -4.82 -0.15 -3.33 0.05 -2.59 -0.43 -3.69 [0.41] [0.11] [0.45] [0.24] [0.89] [0.63] [0.07]* [0.27] Emp 0.23 2.50 0.15 2.39 -0.09 0.61 0.07 1.41 [0.04]** [0.10] [0.13] [0.10]* [0.66] [0.81] [0.65] [0.49] Foreign 0.27 3.99 0.68 10.06 -0.05 1.60 -0.17 3.61 [0.57] [0.70] [0.16] [0.29] [0.94] [0.86] [0.77] [0.70] State 0.55 0.78 0.46 -0.82 0.15 -1.95 0.05 -2.73 [0.16] [0.88] [0.20] [0.86] [0.85] [0.85] [0.91] [0.61] Export 0.10 16.85 -0.08 15.04 0.66 -3.44 -0.69 1.90 [0.88] [0.18] [0.90] [0.17] [0.40] [0.69] [0.19] [0.82] No_customer 0.22 0.69 0.14 -0.59 0.18 0.88 0.18 -1.85 [0.02]** [0.62] [0.09]* [0.63] [0.29] [0.64] [0.09]* [0.21] Sales_largest_cust 0.37 4.48 0.01 4.91 [0.00] *** [0.00]*** [0.23] [0.01]*** Lower_price 0.72 6.17 1.02 10.38 [0.01]** [0.10]* [0.00]*** [0.03]** Constant -2.14 0.81 -0.99 20.89 0.58 -18.44 0.97 28.14 [0.00]*** [0.93] [0.16] [0.23] [0.69] [0.34] [0.29] [0.14] City Dummy YES YES YES YES YES YES YES YES Observations 273 286 319 323 123 125 151 155 Pseudo R_sq. 0.12 0.12 0.11 0.10 0.15 0.18 0.14 0.14