banning ads from public tv: lessons from...
TRANSCRIPT
1
BANNING ADS FROM PUBLIC TV:
LESSONS FROM FRANCE
Lapo Filistrucchia, Luigi Luini
b, Andrea Mangani
c
Preliminary and Incomplete
This Draft: 30 March 2012
Abstractd
We analyse the effects of the advertising ban on French public television, which came
into effect on the 5th
of January 2009. The ban forbid commercial advertising on public
TV in the time slot 20.00-6.00.
We focus our analysis on the advertising market, using a difference in difference
approach. Preliminary evidence suggests that advertising which was previously
broadcasted on public TV in the time slot 20.00-6.00 did not switch to private channels
in the same time slot (nor did the price in that time slot on private channels rise). Rather
advertising partly switched to public TV in the time slot 6.00-20.00 and only slowly
migrated towards digital TV channels. The common expectation that the ban would
favour private TV channels at the expense of public ones was therefore wrong.
Interestingly, the relative audience of public to private TV did not tilt in favour of
public TV. Possible explanations for the findings are explored.
JEL Classification: L82, D18, M7.
Keywords: two-sided markets, media markets, advertising caps. advertising ban, public
television
a Corresponding author: Department of Economics, CentER and TILEC, Tilburg University and
Department of Economics, University of Florence; [email protected]; [email protected] b Department of Economics, University of Siena
c Department of Economics, University of Pisa
d We thank seminar participants at the PRIN 2007 meeting on “Two-Sided Markets” in Bergamo in 2010, at the 2nd
TILEC Workshop on Law and Economics of Media and Communications, at the 2011 ICT conference in Paris in
2011 and at the 2nd ICT conference in Munich. Dries De Smet and Philippe Gagnepain provided useful comments.
Pauline Affeldt provided extraordinary research assistance. The project was started thanks to a 2007 PRIN grant of
the Italian Ministery of University and Scientific Research. In addition, Lapo Filistrucchi acknowledges financial
support from a Microsoft grant to TILEC. Such a grant was provided in accordance with the KNAW Declaration of
Scientific Independence. The views expressed in this paper are not necessarily the ones of the Microsoft corporation.
All remaining errors are of course ours.
2
1. Introduction
Whether public TV should be financed by licence fees and public transfers only or also
by commercial advertising is a long lasting debate in many countries. Supporters of a
public TV financed only by licence fees and public transfers claim that this would
guarantee a higher quality of the programs by freeing public TV stations from the
interests of advertisers. It would also allow public TV stations to pursue a different and
nobler objective than audience maximization, as for instance education. Those against
claim on the contrary that the resulting loss in advertising revenues will lower the
ability of TV stations to invest in quality and thus lead to programs of lower quality.
Moreover, a complete dependence on public funding would facilitate political control of
media.
Whereas the BBC is a well-known and successful example of a public TV financed only
by licence fees and public transfers, whose quality is often taken as an example of
success, in most other European countries commercial advertising revenues constitute a
substantial part of the budget of public TVs. Another exception has however been
Germany, where advertising on public TV after 20.00 has been forbidden since 1991.1
We do not address here the debate of whether public TV should or should not be
financed by advertising. We focus instead on the impact of a regulatory intervention
banning ads on public TV starting from a situation where public TV was financing itself
also and therefore potentially competing with private commercial TV not only on the
audience side but also on the advertising side of the market.
Following the earlier German example, the French government decided to ban
commercial advertisements on State controlled TV stations starting from January 5,
2009. The ban initially applies to programs broadcasted between 20.00 and 6.00 and it
is planned that it will be gradually extended to all broadcasting time.2
1 The ban was confirmed also in 2010. See Rundfunkstaatsvertrag, 1991, and Rundfunkstaatsvertrag,
2010. Note however that it is still allowed to sponsor programs broadcasted after 20h. Recently proposals
have been put forward to ban also sponsoring after 20h on public TV stations except for sport events, and
to ban advertising from public TV stations even before 20h. 2 Ministère de la culture et de la communication, 2009
3
The ban, announced by President Sarkozy in a press conference held on 8 January 2008,
came completely as a surprise to both the French government and the management of
French public TV3 and the general perception was that President Sarkozy was doing a
favour to private TV channels at the expense of public ones. For example the Economist
stated “the new plan was unexpectedly proposed by President Nicolas Sarkozy”. The
Economist also raised the question of who would gain from the ban: “If the
beneficiaries of the ban on advertising are not necessarily the viewers, who gains?
Unsurprisingly, France's commercial channels are delighted at the prospect of extra ad
revenue coming their way.” “TF1's biggest shareholder is Bouygues, a conglomerate,
whose boss, Martin Bouygues, just happens to be a close friend of Mr Sarkozy's and
godfather to one of his sons.” “Another bigwig who will benefit is Vincent Bolloré, a
media magnate who launched a television channel, Direct 8, in 2005. Mr Sarkozy has
borrowed Mr Bolloré's yacht and private jet for two holidays since his election last May.”
“His opponents grumble that his new plan will mainly benefit his friends.” (all citations
from The Economist, A fuzzy picture, February 21, 2008).
The Guardian shared the Economist’s opinion by stating that “Sarkozy, who moves in a
circle of wealthy television owners and press barons and counts "Télépresident" among
his numerous nicknames, surprised even his own culture minister this week when he
announced that adverts should be eliminated from France's five state TV stations”.
According to the Guardian, “[s]crapping adverts from state TV would mean €800m
(£600m) in advertising revenues immediately transferring to private stations” and “[t]he
Socialist party fumed that the immediate beneficiaries of the shift in advertising would
be Sarkozy's own media tycoon friends.” (all citations from The Guardian, Sarkozy to
ban advertizing from state television, January 10, 2008).
The current paper will use this “natural experiment” to estimate the impact of the
regulatory change on the advertising market, by analysing how quantity, price and
advertising revenues have changed on both public and private TV channels. The first
3 According to Le Monde Diplomatique (2008), the announcement of President Sarkozy was completely
unexpected. Neither the prime minister Francois Fillon, Mrs Christine Albanel (ministre de l’audiovisuel
public) nor Patrick de Carolis (president of France Télévisions) knew anything about this decision.
According to the article only Henri Guaino (who apparently writes the TV speeches for Sarkozy) and
Alain Minc (consultant of the industrialist Vincent Bolloré) were informed about Sarkozy’s plans. The
last one is supposed to be involved in the development of Sarkozy’s plan. Also according to Le Canard
enchaîné (2008) and The Economist (2008) the announcement of the advertising ban on public television
was unexpected. According to the Guardian (2008) states the announcement was unexpected and even
the culture minister did not know anything about the plan.
4
objective is to analyse the impact of such an advertising ban on competition between
public and private TV channels. Since theoretically the impact of such a regulatory
intervention is likely to depend on the features of competition in the market, the analysis
is also likely to shed some light also on these features. As such it might provide some
guidance on the most appropriate methods of financing the vanishing of advertising
revenues for State-controlled channels. More generally, it might have policy
implications for regulatory interventions on the media market which aim at setting
limits to advertising concentration in a given media product (e.g. the EU Audiovisual
Media services directive) or aim at defending pluralism by setting limits to
concentration in the advertising market.
The regulation of the maximum amount of advertising during television programming
in the EU is decided by the European Commission through the Directive “Television
without Frontiers”, implemented by each Member State. The Directive4
imposes
advertising floors of 12 minutes per hour and 3 hours per day.5 However, single
Member States are free to adopt stricter rules. In this context, even before President
Sarkozy’s decision, France had one of the most restrictive legislations in Europe.
Probably in order to prepare the advertising ban on public TV stations, the decree
approved on December 19th
, 2008 and coming into force on the 1st of January 2009,
established the extension of the average daily length of advertising from 6 to 9 minutes
per hour for the most important private channels TF1 and M6 (however, the rule
regarded also cable, satellite and DTT stations).6 As of 1
st of January 2009, the average
length of advertising decreased from 8 to 6 minutes per hour for the public television
channels (France 2, France 3, France 5).7 Furthermore, the decree established the shift
from the “glissante” to the “exact” hour as the reference to calculate the maximum
advertising time permitted in an hour, which remained at 12 minutes.8 These new
constraints conformed to the new European Directive, “Audiovisual Media Services”9,
which had partially modified the previous one. It abolished in particular the daily limit
4 See http://ec.europa.eu/avpolicy/reg/tvwf/index_en.htm
5 Ministère de la culture et de la communication, 2008
6 Légifrance, 2010
7 SNPTV, 2010
8 SNPTV, 2010
9 See http://eur-lex.europa.eu/LexUriServ/site/fr/oj/2007/l_332/l_33220071218fr00270045.pdf
5
of 3 hours of advertising but kept the established hourly limit of 12 minutes for
advertising and teleshopping spots.10
As already mentioned above, the first step of the reform consisted of banning
commercial advertisements on public French TV stations (France 2, France 3, France 4,
France 5 and others, all controlled by France Televisions) between 20pm and 6am
starting from January 5th
, 2009.11
The very same reform includes setting at zero the
advertising in all time slots of France Télévisions by the end of 2011.
Also the Spanish government decided to follow the German and French examples
announcing a drastic reduction in advertising on public TV (RTVE) on April 14, 2009
and on May 8 proposing the complete ban of advertising. The law banning ads from
public TV on all time slots was approved by the Spanish parliament on July 29 of 2009.
This law came into effect as of September 1, 2009 but allowed Spanish public TV to
broadcast until the end of 2009 the advertising contracted before this date. As from the
first of January of 2010, advertising is banned, except for self-promotion advertising,
corporate communications campaigns and informational campaigns with social
purposes. Moreover, RTVE is not allowed to charge for these exceptional ads. To
finance its operations, the public corporation would continue receiving state subsidies,
in addition to proceeds from new specific taxes to private television stations and
telecommunications companies, and an important percentage of the revenues from the
fee on airwaves usage.
The modalities of the gradual phase out of advertising on France Télévisions are laid
out in the new law on the reform of French public television adopted in March 2009.12
From a strictly arithmetical viewpoint and considering only the daily average duration
of advertising interruptions, private stations (TF1 and M6) could take up completely the
advertisers’ demand in the 20pm-6am time slot, because of the increase of advertising
time from 6 to 9 minutes per hour as mentioned above13
. However, taking into account
the advertising time across different slots, the slots 12am-14pm and 19pm-22pm show
10
European Commission, 2008 11
SNPTV, 2010 12
Ministère de la culture et de la communication, 2009 and Journal Officiel de la République Française,
2009 13
Conseil Supérieur de l’Audiovisuel, 2009
6
that the advertising time on private stations was close to the maximum allowed (12
minutes), because of the consumption habits of French viewers.14
These informal observations can be combined with theoretical predictions based on
previous analytical work on the theme. This will be done in Section 3, while the next
section briefly reviews those studies that deal with advertising caps in media markets.
Section 4 describes the data while Section 5 shows the results of the empirical analysis.
Section 6 concludes discussing the policy implications of our main results.
2. Related literature
Following the seminal works by Steiner (1952), Corden (1953) and Reddaway (1963) ,
quite a rich theoretical literature developed on the media markets, e.g. Spence and Owen
(1977) and Beebe (1977). These studies have in the recent years merged into the wider
literature on two-sided markets, as first defined by Parker & Van Alstyne (2002),
Rochet & Tirole (2003, 2006) and Armstrong (2006). As discussed in detail in
Anderson and Gabszewicz (2005), in a two-sided market a media firm typically sells
content to readers/viewers/listeners and advertising space to advertisers and it knows
that the number (and possibly the characteristics) of viewers/readers/listeners influences
the demand for advertising space/time while, on the other hand, the quantity (or
concentration) of advertising slots affects the demand from readers/viewers/listeners. In
other words, a media firm recognises and internalizes the existence of indirect network
effects between the two-sides of the market as it knows that in such a market the viable
business strategy requires bringing “both sides on board”. Whereas clearly the higher
the number of readers/listeners/viewers the higher the demand for ads all else equal,
vice versa it is not clearly established what is the attitude of readers/listeners/viewers
towards advertising.
Most advanced countries regulate the maximum amount (e.g., minutes per hour of
programming) of TV advertising, In addition, policy makers believe that some (de)merit
goods must not be advertised and paternalistic considerations suggest advertising bans
14
Conseil Supérieur de l’Audiovisuel, 2009
7
on specific products. Rather surprisingly, economic scholars focused the second point,
while the economic analysis on advertising ceilings is extremely thin15
.
Anderson (2007) uses a two-sided market model to investigate the effects of advertising
caps on social welfare. The disutility that consumers as readers or viewers derive from
advertising may be particularly high with respect to the benefits accruing to advertisers.
With high ad aversion the level of advertising in equilibrium may be excessive with
respect to the social optimum. The opposite circumstance of over provision of
advertising takes place if the advertising nuisance for consumers is lower than the return
for advertisers. Therefore, an advertising cap is socially beneficial in the first case and
harmful in the second. Anderson (2007) studies the advertising choice of a monopolist
platform. With low advertising nuisance, the monopolist determines a level of
advertising which is below the optimal level. Under this circumstance, the effect of an
advertising cap is a further reduction of social welfare. If we consider the opposite
scenario with high advertising nuisance, the level of advertising is over the social
optimum. This means that an advertising cap will increase social welfare. However, the
monopolist profits will fall as well, and this may reduce the incentives for other firms to
enter the market and increase the variety of programming.
Although these results are quite reasonable, they refer to a monopolist platform/editor.
In case of more than one firm in the market, strategic considerations play a major role in
shaping the equilibrium outcome. In addition, the equilibrium changes according the
assumptions on viewers’ behaviour, profit functions of media outlets and advertising
demand function. Anderson (2007) also studies the effects of advertising caps on the
quality of programming and on the degree of diversity between competing platforms.
The results in terms of content quality and variety are mixed and, once more, related to
a monopoly market.
In Australia television advertising was deregulated in September 1987 (with the aim of
reducing the rate of interruption to programs) by allowing stations more flexibility in
their scheduling of ad time. Wright (1994) claims that deregulation caused an increase
in the amount of non-program content. To explore this issue, Wright (1994) puts
forward a duopoly model where commercial TV stations compete and shows that the
15
A correct and complete evaluation of the effects of advertising caps on producers, consumers and
media should include a broad discussion about the role of advertising in modern economies. See
Anderson (2007).
8
regulation of the number of advertisements per unit of time both below the joint profit
maximizing level (for appropriate parameters) and below the Nash equilibrium level
(for different appropriate parameters) can reduce program quality. Therefore, depending
on the parameters of the model, fostering competition may be preferable to regulating
the amount of advertisements per unit of time.
Finally, Stuhmeier and Wenzel (2010) analyse the effects of advertising bans. The main
assumptions of their theoretical model are the following: two TV channels, horizontal
program differentiation, a continuum of TV viewers. They assume that there is a
continuum of advertisers with measure 1, with a utility function given by
)2(2
1)( 21
22
2121 abaaaaaAU
where A is the size of the advertising market and ai is the demand of advertising on
channel i. This assumption leads to an indirect demand of advertising given by
jii baaAp
where pi is the price of an advertising unit and the parameter b measures the
differentiation of the channels in the eyes of the advertisers. Stuhmeier and Wenzel
(2010) stress that this approach allows for a correct description of “pecuniary
externalities”, that is, the effect on the advertising price caused by the advertising
decisions of each media outlet16
. The main objective of Stuhmeier and Wenzel (2010) is
to explore the effect of an asymmetric advertising cap, that is, un upper bound imposed
only to the advertising time of a single broadcaster. The model of Stuhmeier and
Wenzel (2010) predicts that and advertising cap will have the following effects: i) the
unregulated channel will increase its advertising level if advertising is a strategic
substitute and decreases its advertising level if advertising is a strategic complement; ii)
strengthening the cap will make the price of advertising rise on both TV channels; iii)
after the introduction of the advertising cap, the unregulated TV station gain higher
profits if the degree of differentiation in the eye of advertisers is over a given level;
otherwise, the profits of the unregulated private channel decrease; iv) for moderate
levels of regulation, the profit of the regulated channel may increase after the
introduction of advertising caps.
16
However, the utility of advertisers is not affected by the number or characteristics of each channel’s
viewers; in other words, they abstract from indirect network effects that typically characterize two sided
markets.
9
The theoretical approach of Stuhmeier and Wenzel (2010) is very close to the theme
that this paper wants to investigate empirically. Thus, the next section will try to
generalize the results of Stuhmeier and Wenzel (2010) and other authors in order to
propose a theoretical background for the empirical analysis described in the fourth and
fifth Section.
3. Theoretical background
Although this paper deals with two-sided markets, the theoretical and empirical analysis
will focus on the advertising market. In fact, broadcasting televisions derive the bulk of
their revenues from selling advertising time, given the nature of public good of TV
programs on the viewers’ side17
. We first formalize a theoretical argument in general
terms, then we apply the very same argument to the total suppression of advertising on a
single TV station. In particular, we study the effects produced by a change of the level
of advertising of a single TV station. In the rest of the section we assume a duopoly
market, with a public station competing with a private station. In particular, we assume
a public TV station which reduces its level of advertising because of an advertising cap;
in other words, we have a “regulated” public station competing with an “unregulated”
private station. The reduction of advertising of the public TV station will produce the
following effects.
1) The first effect derives from cross network externalities. If we assume viewers
adverse to advertising18
, the audience of the public station raises and, ceteris
paribus, the audience of the private station decreases. This effect increases the
demand for advertising of the public station or, in other words, the willingness to
pay of advertisers to advertise on the public TV increases.
2) The second effect is sometimes described “pecuniary externalities” (Reisinger et
al., 2009) and goes in the opposite direction, at least partially: the reduction of
17
In many countries a possession fee is levied to finance the TV channels controlled by the State. 18
Most contributions of media economics, for example Anderson (2005); Mangani (2003), Anderson and
Coate (2005); Ambrus and Reisinger (2005); Choi (2006); Crampes et al. (2004); Gabszewicz et al.
(2004); Kind et al. (2009); Kohlschein (2004); Kremhelmer and Zenger (2008); Peitz and Valetti (2008)
assume that consumers dislike advertising. Exceptions are Hackner and Nyberg (2000), who assume that
readers like advertising in print media, and Sonnac (2000), who considers feedbacks from advertising to
circulation under the two alternative assumptions of consumer advertising aversion and advertising
appreciation. Also Armstrong (2005), considers alternative scenarios, characterized by aversion, love or
indifference towards advertising.
10
advertising on the public station determines a reduction of total supply of
advertising. If we assume an inverse demand function for advertising taking the
form of pA=f(W) with f’<0, where pA is the price per viewer-time and W is the
total supply of viewers-time units, the price of advertising will increase after an
advertising ban.19
There are two crucial points in the pecuniary externalities argument. First, the price of
advertising needs to be unique. This contrasts with the causal observations of frequent
price differentiation in the advertising market. Second, the economic rationale behind
the argument may not hold when a TV station decreases its advertising level. Here, the
competitor has no interest in stabilizing the increasing advertising price.
Broadly speaking, the reduction of advertising quantity determines ambiguous effects
on the price of advertising. These effects depend on the structure of the market (namely,
the number of broadcasting firms), the degree of product differentiation across media
outlets (Reisinger et al., 2009), etc.
The relative importance of network and/or pecuniary effects affects the definition of
advertising levels as strategic substitutes or strategic complements. Since advertising is
an implicit price for viewers, the levels of advertising can be seen as strategic
complements: when a TV station increases the advertising quantity, the other does the
same, and the other way round. However, when we consider pecuniary externalities, the
picture is more complex. In fact, when a (public) TV station increases the level of
advertising, the price of advertising decreases. As a reaction, the competitor has an
incentive to reduce its level of advertising to stabilize the price; from this perspective,
the advertising levels may be seen as strategic substitutes.
The decision to ban advertising completely in a given time slot is an extreme case of
this theoretical framework. In fact, when a broadcaster eliminates advertising in a given
time slot it substantially exits the market, because the “effective” market of
broadcasting television is on the side of advertisers. The competitor becomes a
monopolist on the advertisers’ side, although it may finds itself without a relevant
19
The “modern” studies on media markets focus on the first effect to highlight the importance of cross
network externalities. Only Reisinger et al (2009) and Stuhmeier and Wenzel (2010) treat explicitly the
pecuniary externalities. In reality, Masson et al. (1990) analyzed the second and direct effect of
“advertising supply” on price, and then showed the importance of advertising aversion and network
externalities for the market equilibrium.
11
audience that has shift to the station without advertising. Potentially, this circumstance
creates a large inefficiency. The market outcome is therefore ambiguous. For example,
if the degree of program differentiation is relatively large with respect to advertising
aversion, the absence of advertising on a single TV station will not shift the audience
from its competitor. If the pecuniary effect prevails upon the cross network effects, the
private/monopolist/unregulated broadcaster keeps positive levels of advertising and
increase its revenues. Conversely, if advertising aversion prevails upon program
differentiation, viewers may abandon the private and unregulated TV channel which,
although monopolist on the advertisers’ side, cannot exploit its market power.
Advertising aversion of TV viewers and product differentiation between media outlets
are difficult to estimate directly. Therefore, the empirical analysis regarding the French
experience has the objective to explore these issues by focusing on the consequences of
the ban in the advertising market.
4. Data
The dataset contains data on quantity of advertising (number of spots and seconds) and
advertising revenues per channel (aerial, satellite, cable and digital) for each week in the
seasons 2007-2008 and 2008-2009 (excluding the summer months, i.e. July and
August)20
. We are therefore able to calculate the average price per spot and price per
second, in addition to the length of a spot. As already mentioned, starting from the 6th
of January 2009, advertising was banned on public aerial television (“hertziennes
channels”) in the time period 20.00-6.00, which includes prime-time. We have data both
before and after the ban in the season 2008-2009.
Figure 1 reports summary statistics. Note that we have data on 42 weeks for 2 time slots
during the day for 2 seasons for 91 channels, which implies a maximum number of
observations equal to 15288.
20
The data were obtained from TNS France.
12
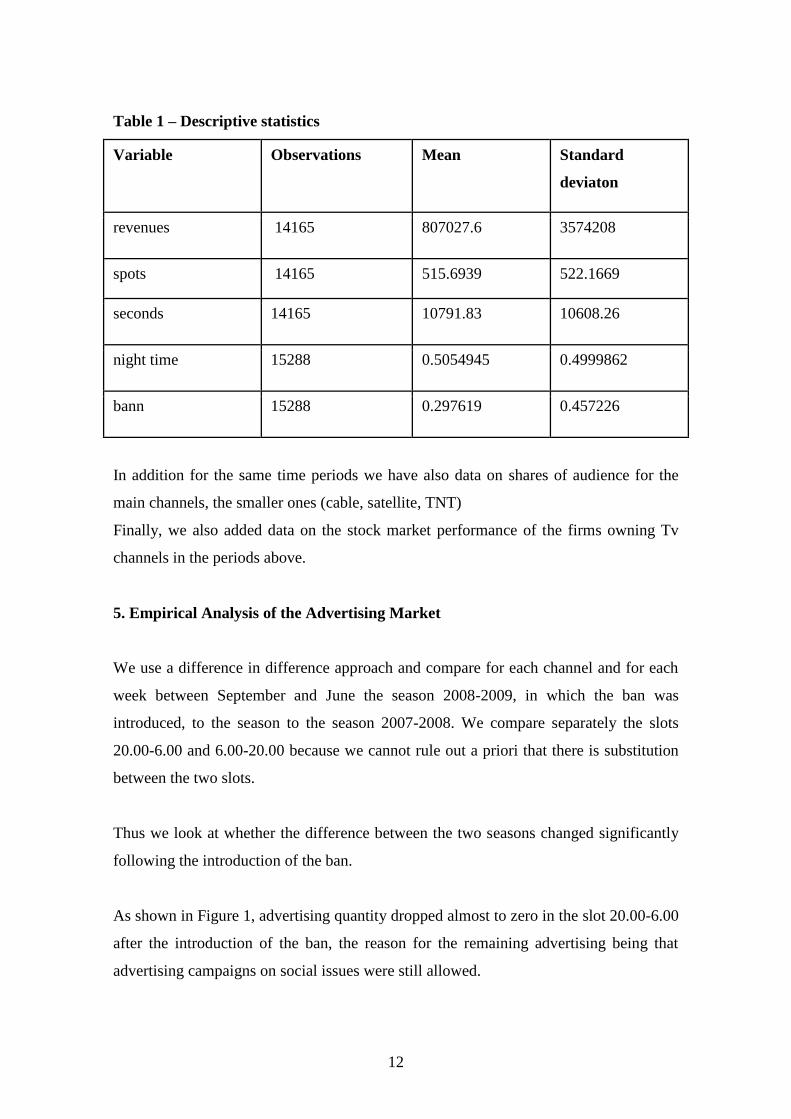
Table 1 – Descriptive statistics
Variable Observations Mean Standard
deviaton
revenues 14165 807027.6 3574208
spots 14165 515.6939 522.1669
seconds 14165 10791.83 10608.26
night time 15288 0.5054945 0.4999862
bann 15288 0.297619 0.457226
In addition for the same time periods we have also data on shares of audience for the
main channels, the smaller ones (cable, satellite, TNT)
Finally, we also added data on the stock market performance of the firms owning Tv
channels in the periods above.
5. Empirical Analysis of the Advertising Market
We use a difference in difference approach and compare for each channel and for each
week between September and June the season 2008-2009, in which the ban was
introduced, to the season to the season 2007-2008. We compare separately the slots
20.00-6.00 and 6.00-20.00 because we cannot rule out a priori that there is substitution
between the two slots.
Thus we look at whether the difference between the two seasons changed significantly
following the introduction of the ban.
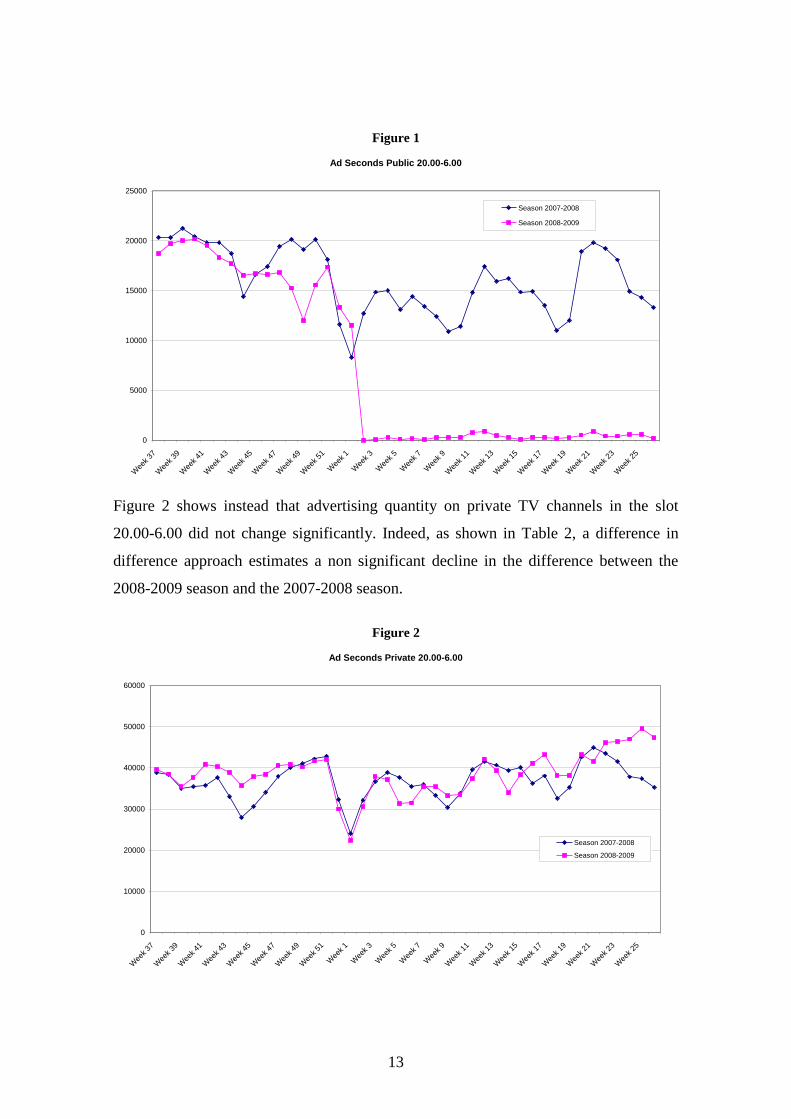
As shown in Figure 1, advertising quantity dropped almost to zero in the slot 20.00-6.00
after the introduction of the ban, the reason for the remaining advertising being that
advertising campaigns on social issues were still allowed.
13
Figure 1
Figure 2 shows instead that advertising quantity on private TV channels in the slot
20.00-6.00 did not change significantly. Indeed, as shown in Table 2, a difference in
difference approach estimates a non significant decline in the difference between the
2008-2009 season and the 2007-2008 season.
Figure 2
Ad Seconds Public 20.00-6.00
0
5000
10000
15000
20000
25000
Wee
k 37
Wee
k 39
Wee
k 41
Wee
k 43
Wee
k 45
Wee
k 47
Wee
k 49
Wee
k 51
Wee
k 1
Wee
k 3
Wee
k 5
Wee
k 7
Wee
k 9
Wee
k 11
Wee
k 13
Wee
k 15
Wee
k 17
Wee
k 19
Wee
k 21
Wee
k 23
Wee
k 25
Season 2007-2008
Season 2008-2009
Ad Seconds Private 20.00-6.00
0
10000
20000
30000
40000
50000
60000
Wee
k 37
Wee
k 39
Wee
k 41
Wee
k 43
Wee
k 45
Wee
k 47
Wee
k 49
Wee
k 51
Wee
k 1
Wee
k 3
Wee
k 5
Wee
k 7
Wee
k 9
Wee
k 11
Wee
k 13
Wee
k 15
Wee
k 17
Wee
k 19
Wee
k 21
Wee
k 23
Wee
k 25
Season 2007-2008
Season 2008-2009
14
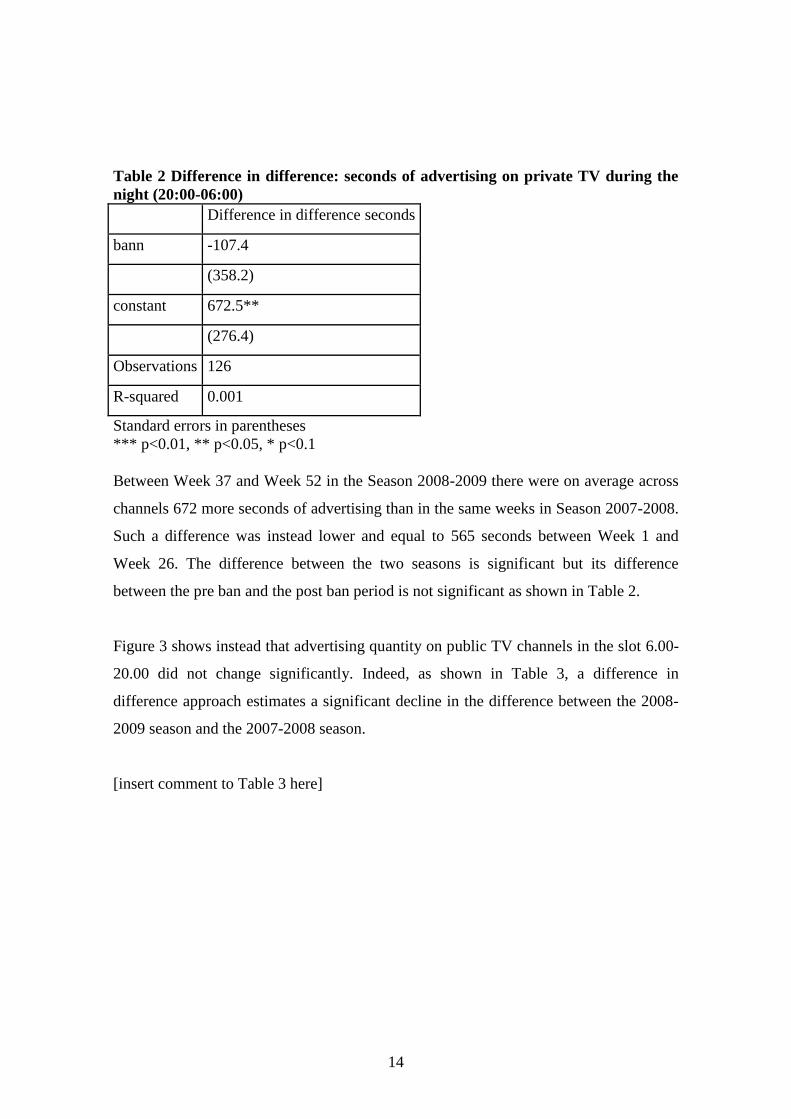
Table 2 Difference in difference: seconds of advertising on private TV during the
night (20:00-06:00)
Difference in difference seconds
bann -107.4
(358.2)
constant 672.5**
(276.4)
Observations 126
R-squared 0.001
Standard errors in parentheses
*** p<0.01, ** p<0.05, * p<0.1
Between Week 37 and Week 52 in the Season 2008-2009 there were on average across
channels 672 more seconds of advertising than in the same weeks in Season 2007-2008.
Such a difference was instead lower and equal to 565 seconds between Week 1 and
Week 26. The difference between the two seasons is significant but its difference
between the pre ban and the post ban period is not significant as shown in Table 2.
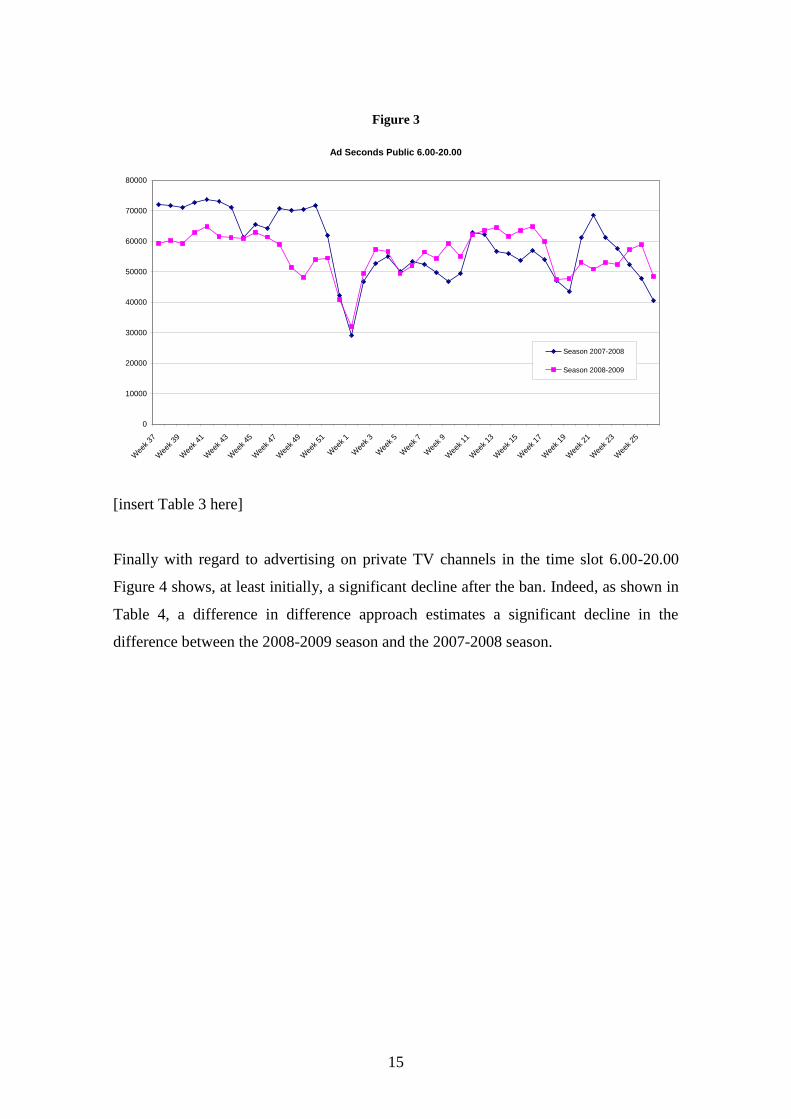
Figure 3 shows instead that advertising quantity on public TV channels in the slot 6.00-
20.00 did not change significantly. Indeed, as shown in Table 3, a difference in
difference approach estimates a significant decline in the difference between the 2008-
2009 season and the 2007-2008 season.
[insert comment to Table 3 here]
15
Figure 3
[insert Table 3 here]
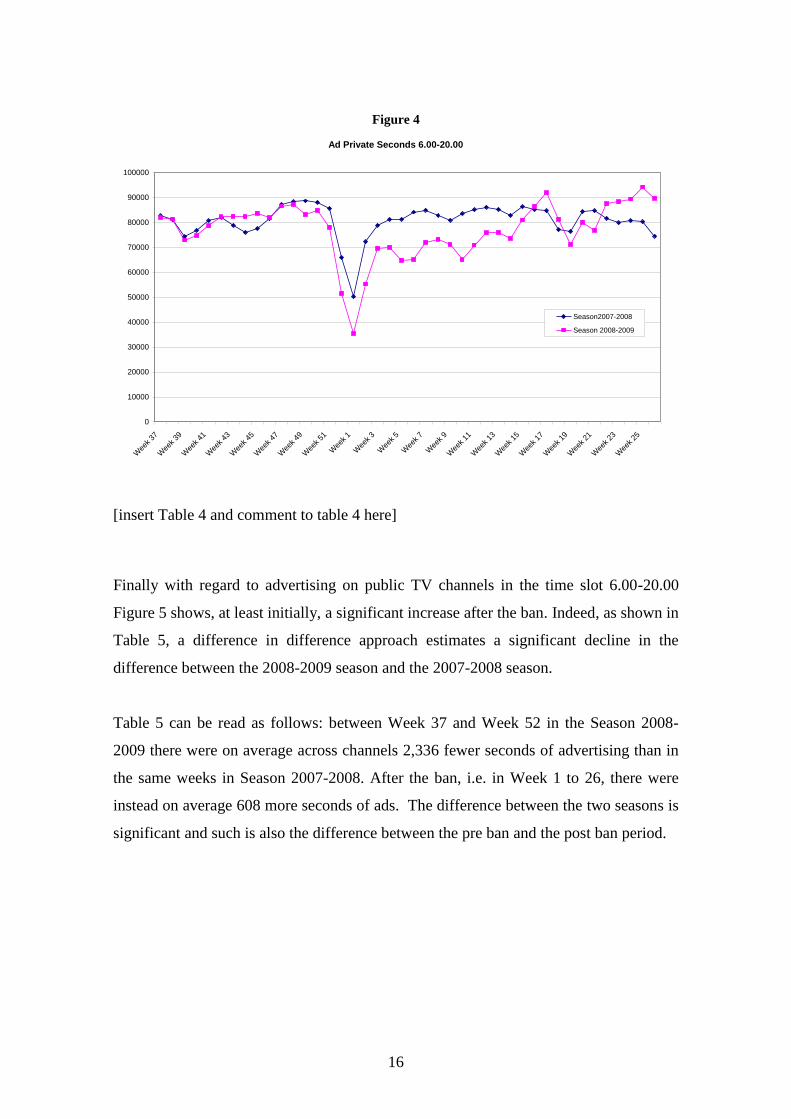
Finally with regard to advertising on private TV channels in the time slot 6.00-20.00
Figure 4 shows, at least initially, a significant decline after the ban. Indeed, as shown in
Table 4, a difference in difference approach estimates a significant decline in the
difference between the 2008-2009 season and the 2007-2008 season.
Ad Seconds Public 6.00-20.00
0
10000
20000
30000
40000
50000
60000
70000
80000
Wee
k 37
Wee
k 39
Wee
k 41
Wee
k 43
Wee
k 45
Wee
k 47
Wee
k 49
Wee
k 51
Wee
k 1
Wee
k 3
Wee
k 5
Wee
k 7
Wee
k 9
Wee
k 11
Wee
k 13
Wee
k 15
Wee
k 17
Wee
k 19
Wee
k 21
Wee
k 23
Wee
k 25
Season 2007-2008
Season 2008-2009
16
Figure 4
[insert Table 4 and comment to table 4 here]
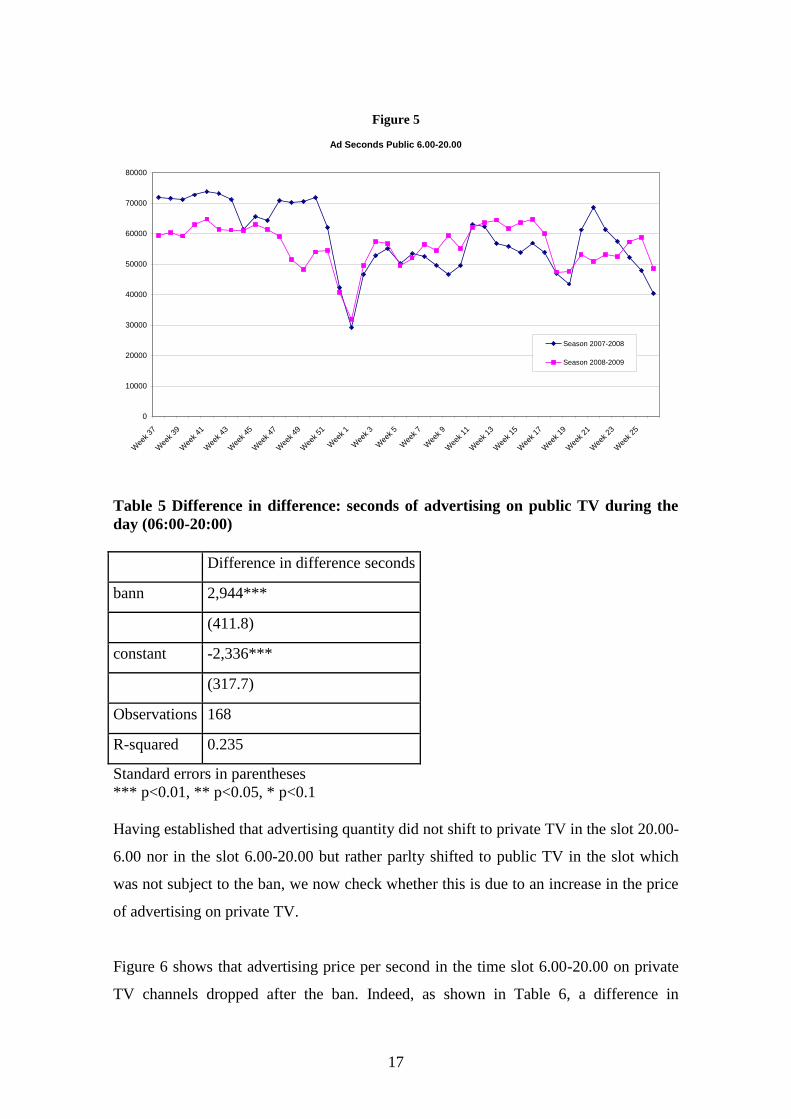
Finally with regard to advertising on public TV channels in the time slot 6.00-20.00
Figure 5 shows, at least initially, a significant increase after the ban. Indeed, as shown in
Table 5, a difference in difference approach estimates a significant decline in the
difference between the 2008-2009 season and the 2007-2008 season.
Table 5 can be read as follows: between Week 37 and Week 52 in the Season 2008-
2009 there were on average across channels 2,336 fewer seconds of advertising than in
the same weeks in Season 2007-2008. After the ban, i.e. in Week 1 to 26, there were
instead on average 608 more seconds of ads. The difference between the two seasons is
significant and such is also the difference between the pre ban and the post ban period.
Ad Private Seconds 6.00-20.00
0
10000
20000
30000
40000
50000
60000
70000
80000
90000
100000
Wee
k 37
Wee
k 39
Wee
k 41
Wee
k 43
Wee
k 45
Wee
k 47
Wee
k 49
Wee
k 51
Wee
k 1
Wee
k 3
Wee
k 5
Wee
k 7
Wee
k 9
Wee
k 11
Wee
k 13
Wee
k 15
Wee
k 17
Wee
k 19
Wee
k 21
Wee
k 23
Wee
k 25
Season2007-2008
Season 2008-2009
17
Figure 5
Table 5 Difference in difference: seconds of advertising on public TV during the
day (06:00-20:00)
Difference in difference seconds
bann 2,944***
(411.8)
constant -2,336***
(317.7)
Observations 168
R-squared 0.235
Standard errors in parentheses
*** p<0.01, ** p<0.05, * p<0.1
Having established that advertising quantity did not shift to private TV in the slot 20.00-
6.00 nor in the slot 6.00-20.00 but rather parlty shifted to public TV in the slot which
was not subject to the ban, we now check whether this is due to an increase in the price
of advertising on private TV.
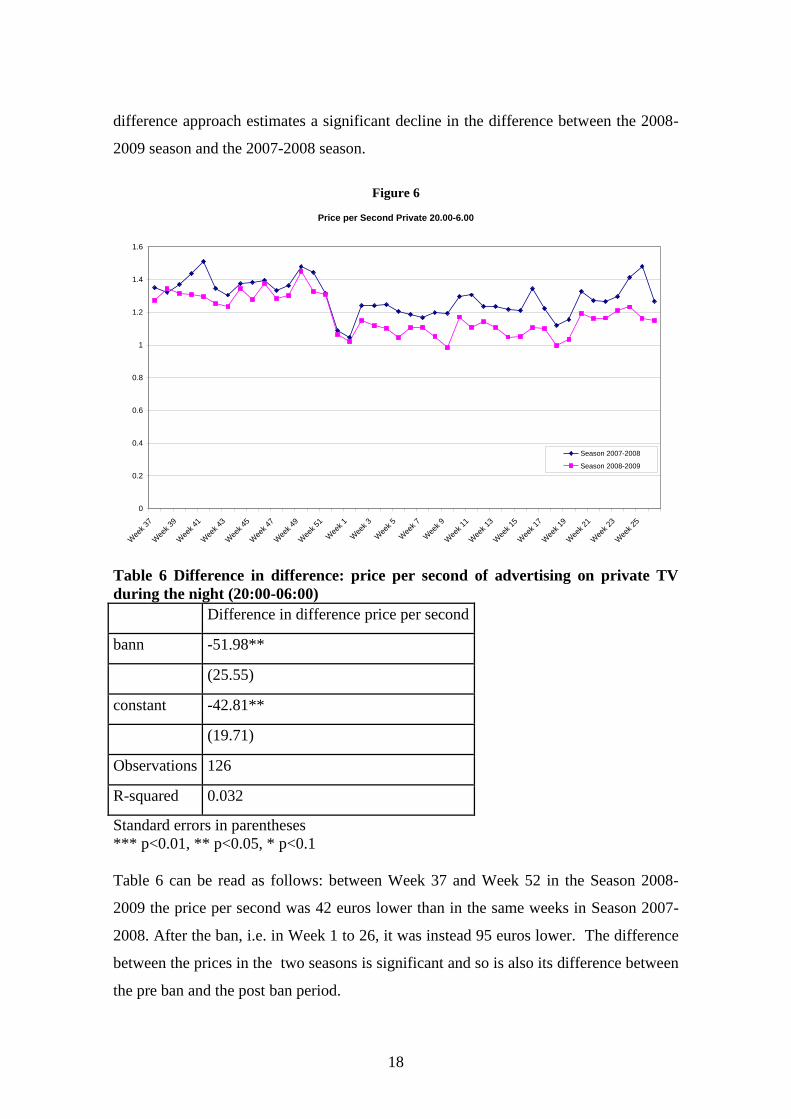
Figure 6 shows that advertising price per second in the time slot 6.00-20.00 on private
TV channels dropped after the ban. Indeed, as shown in Table 6, a difference in
Ad Seconds Public 6.00-20.00
0
10000
20000
30000
40000
50000
60000
70000
80000
Wee
k 37
Wee
k 39
Wee
k 41
Wee
k 43
Wee
k 45
Wee
k 47
Wee
k 49
Wee
k 51
Wee
k 1
Wee
k 3
Wee
k 5
Wee
k 7
Wee
k 9
Wee
k 11
Wee
k 13
Wee
k 15
Wee
k 17
Wee
k 19
Wee
k 21
Wee
k 23
Wee
k 25
Season 2007-2008
Season 2008-2009
18
difference approach estimates a significant decline in the difference between the 2008-
2009 season and the 2007-2008 season.
Figure 6
Table 6 Difference in difference: price per second of advertising on private TV
during the night (20:00-06:00)
Difference in difference price per second
bann -51.98**
(25.55)
constant -42.81**
(19.71)
Observations 126
R-squared 0.032
Standard errors in parentheses
*** p<0.01, ** p<0.05, * p<0.1
Table 6 can be read as follows: between Week 37 and Week 52 in the Season 2008-
2009 the price per second was 42 euros lower than in the same weeks in Season 2007-
2008. After the ban, i.e. in Week 1 to 26, it was instead 95 euros lower. The difference
between the prices in the two seasons is significant and so is also its difference between
the pre ban and the post ban period.
Price per Second Private 20.00-6.00
0
0.2
0.4
0.6
0.8
1
1.2
1.4
1.6
Wee
k 37
Wee
k 39
Wee
k 41
Wee
k 43
Wee
k 45
Wee
k 47
Wee
k 49
Wee
k 51
Wee
k 1
Wee
k 3
Wee
k 5
Wee
k 7
Wee
k 9
Wee
k 11
Wee
k 13
Wee
k 15
Wee
k 17
Wee
k 19
Wee
k 21
Wee
k 23
Wee
k 25
Season 2007-2008
Season 2008-2009
19
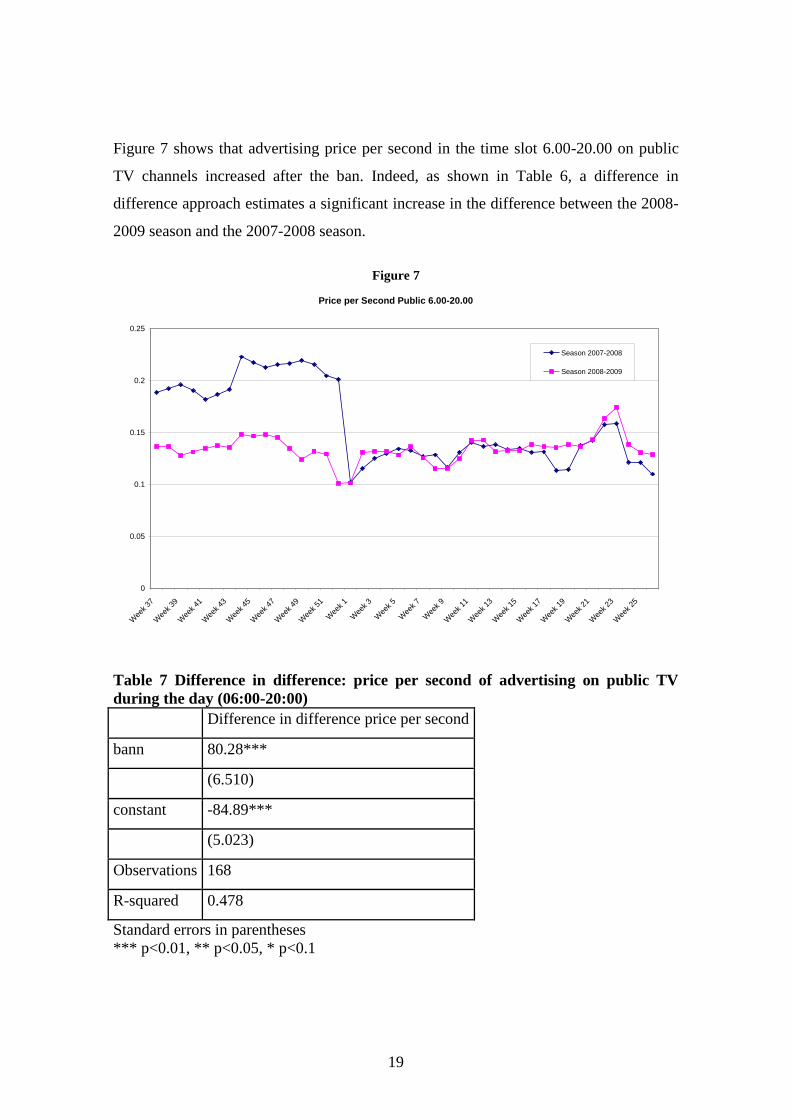
Figure 7 shows that advertising price per second in the time slot 6.00-20.00 on public
TV channels increased after the ban. Indeed, as shown in Table 6, a difference in
difference approach estimates a significant increase in the difference between the 2008-
2009 season and the 2007-2008 season.
Figure 7
Table 7 Difference in difference: price per second of advertising on public TV
during the day (06:00-20:00)
Difference in difference price per second
bann 80.28***
(6.510)
constant -84.89***
(5.023)
Observations 168
R-squared 0.478
Standard errors in parentheses
*** p<0.01, ** p<0.05, * p<0.1
Price per Second Public 6.00-20.00
0
0.05
0.1
0.15
0.2
0.25
Wee
k 37
Wee
k 39
Wee
k 41
Wee
k 43
Wee
k 45
Wee
k 47
Wee
k 49
Wee
k 51
Wee
k 1
Wee
k 3
Wee
k 5
Wee
k 7
Wee
k 9
Wee
k 11
Wee
k 13
Wee
k 15
Wee
k 17
Wee
k 19
Wee
k 21
Wee
k 23
Wee
k 25
Season 2007-2008
Season 2008-2009
20
Table 7 can be read as follows: between Week 37 and Week 52 in the Season 2008-
2009 the price per second was 84 euros lower than in the same weeks in Season 2007-
2008. After the ban, i.e. in Week 1 to 26, it was instead 4 euros higher. The difference
between the prices in the two seasons is significant and so is also its difference between
the pre ban and the post ban period. Note however that as of January 2008 (one year
before the ban) public TV had changed the way it charged for advertising and
advertising prices on public TV had de facto substantially dropped. After the reduction
advertising prices on Public TV remained more or less stable.
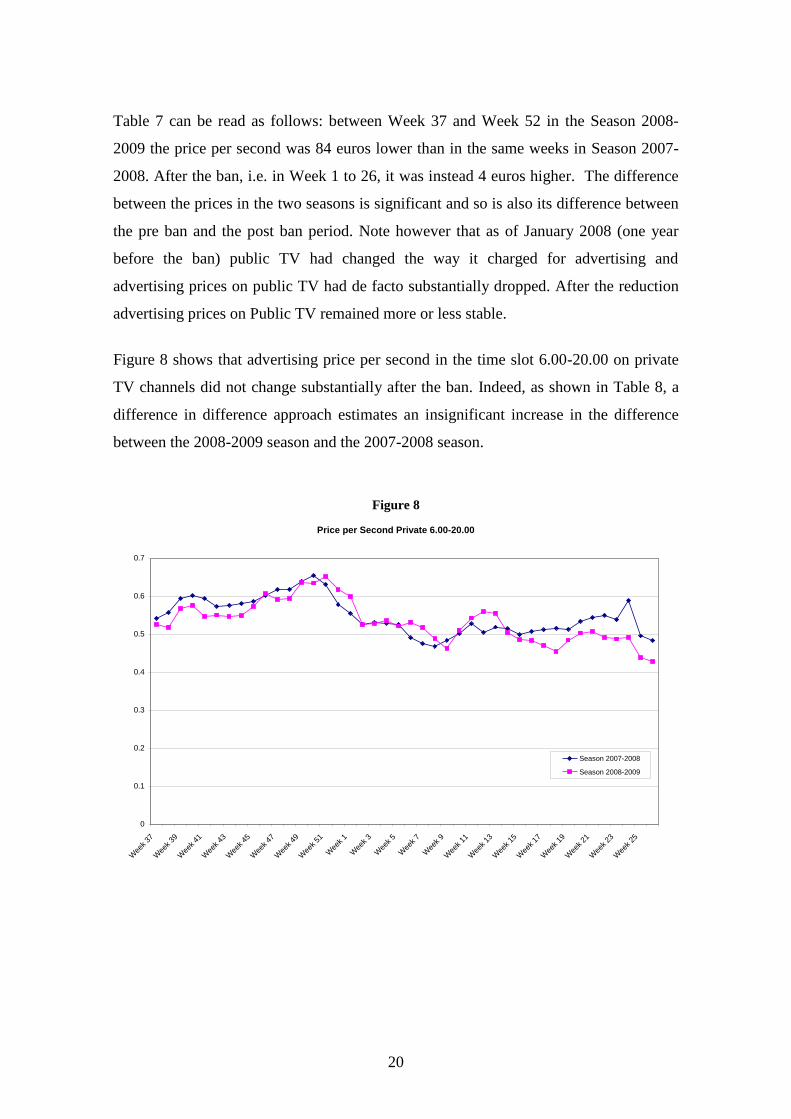
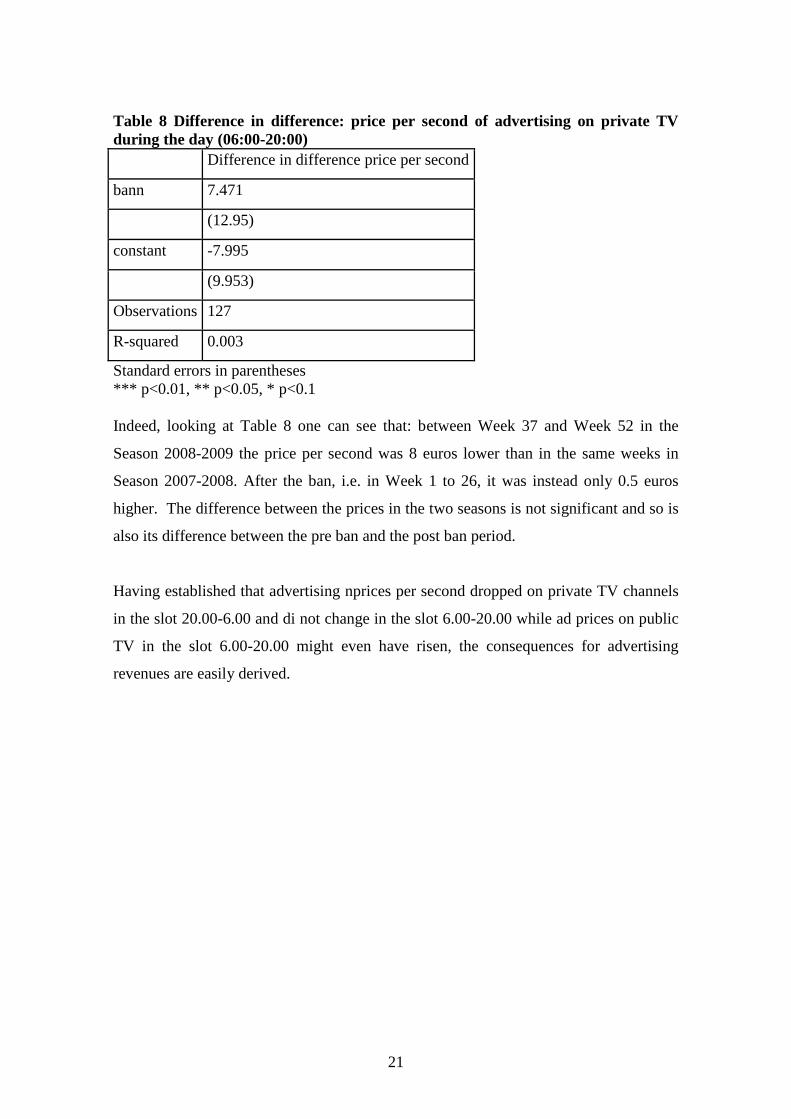
Figure 8 shows that advertising price per second in the time slot 6.00-20.00 on private
TV channels did not change substantially after the ban. Indeed, as shown in Table 8, a
difference in difference approach estimates an insignificant increase in the difference
between the 2008-2009 season and the 2007-2008 season.
Figure 8
Price per Second Private 6.00-20.00
0
0.1
0.2
0.3
0.4
0.5
0.6
0.7
Wee
k 37
Wee
k 39
Wee
k 41
Wee
k 43
Wee
k 45
Wee
k 47
Wee
k 49
Wee
k 51
Wee
k 1
Wee
k 3
Wee
k 5
Wee
k 7
Wee
k 9
Wee
k 11
Wee
k 13
Wee
k 15
Wee
k 17
Wee
k 19
Wee
k 21
Wee
k 23
Wee
k 25
Season 2007-2008
Season 2008-2009
21
Table 8 Difference in difference: price per second of advertising on private TV
during the day (06:00-20:00)
Difference in difference price per second
bann 7.471
(12.95)
constant -7.995
(9.953)
Observations 127
R-squared 0.003
Standard errors in parentheses
*** p<0.01, ** p<0.05, * p<0.1
Indeed, looking at Table 8 one can see that: between Week 37 and Week 52 in the
Season 2008-2009 the price per second was 8 euros lower than in the same weeks in
Season 2007-2008. After the ban, i.e. in Week 1 to 26, it was instead only 0.5 euros
higher. The difference between the prices in the two seasons is not significant and so is
also its difference between the pre ban and the post ban period.
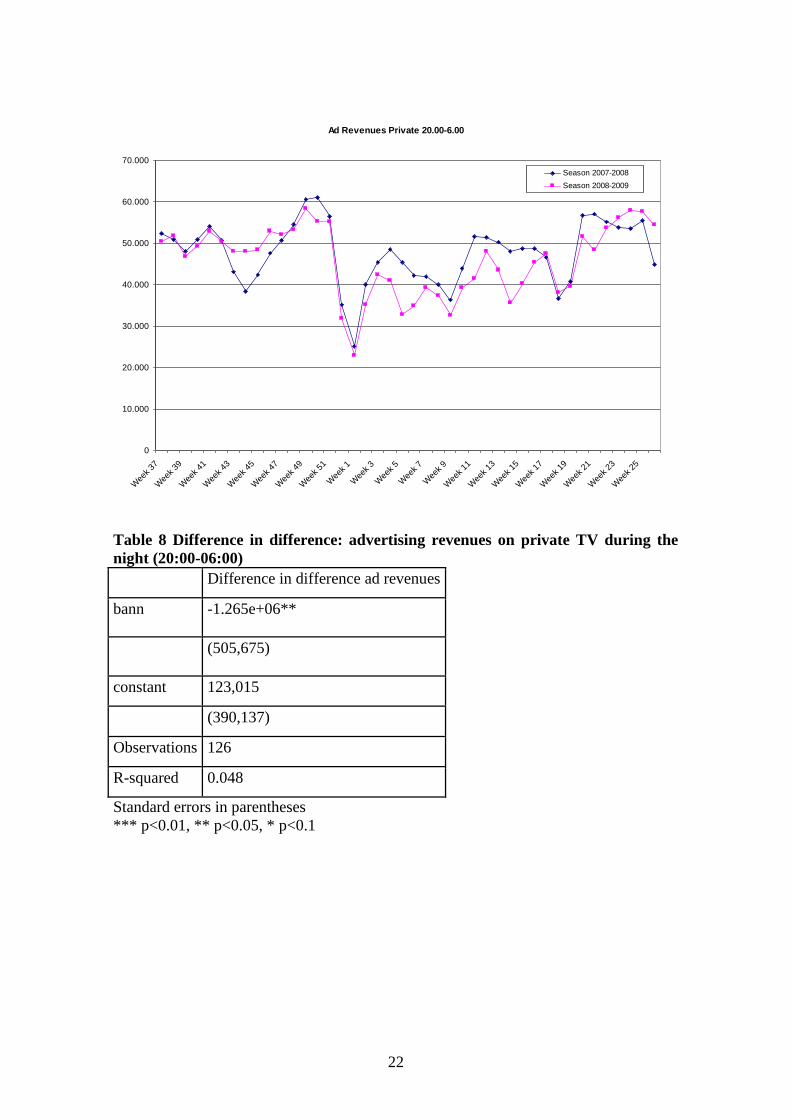
Having established that advertising nprices per second dropped on private TV channels
in the slot 20.00-6.00 and di not change in the slot 6.00-20.00 while ad prices on public
TV in the slot 6.00-20.00 might even have risen, the consequences for advertising
revenues are easily derived.
22
Table 8 Difference in difference: advertising revenues on private TV during the
night (20:00-06:00)
Difference in difference ad revenues
bann -1.265e+06**
(505,675)
constant 123,015
(390,137)
Observations 126
R-squared 0.048
Standard errors in parentheses
*** p<0.01, ** p<0.05, * p<0.1
Ad Revenues Private 20.00-6.00
0
10.000
20.000
30.000
40.000
50.000
60.000
70.000
Wee
k 37
Wee
k 39
Wee
k 41
Wee
k 43
Wee
k 45
Wee
k 47
Wee
k 49
Wee
k 51
Wee
k 1
Wee
k 3
Wee
k 5
Wee
k 7
Wee
k 9
Wee
k 11
Wee
k 13
Wee
k 15
Wee
k 17
Wee
k 19
Wee
k 21
Wee
k 23
Wee
k 25
Season 2007-2008
Season 2008-2009
23
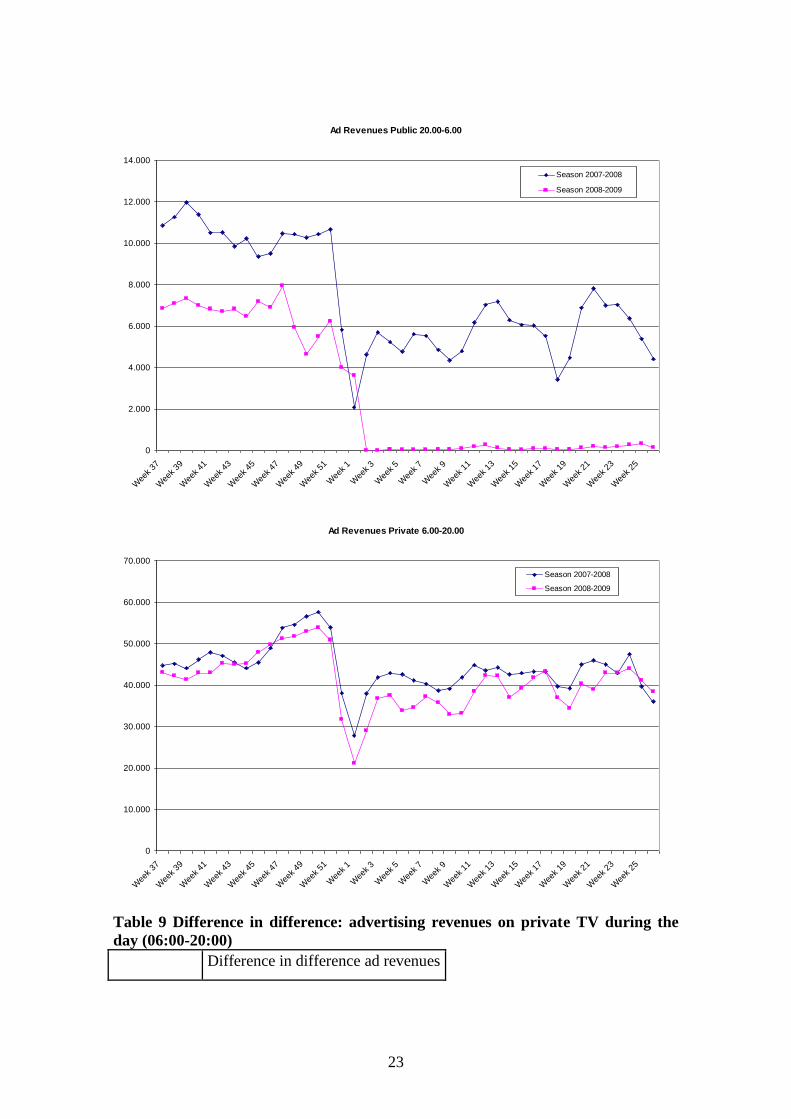
Table 9 Difference in difference: advertising revenues on private TV during the
day (06:00-20:00)
Difference in difference ad revenues
Ad Revenues Public 20.00-6.00
0
2.000
4.000
6.000
8.000
10.000
12.000
14.000
Wee
k 37
Wee
k 39
Wee
k 41
Wee
k 43
Wee
k 45
Wee
k 47
Wee
k 49
Wee
k 51
Wee
k 1
Wee
k 3
Wee
k 5
Wee
k 7
Wee
k 9
Wee
k 11
Wee
k 13
Wee
k 15
Wee
k 17
Wee
k 19
Wee
k 21
Wee
k 23
Wee
k 25
Season 2007-2008
Season 2008-2009
Ad Revenues Private 6.00-20.00
0
10.000
20.000
30.000
40.000
50.000
60.000
70.000
Wee
k 37
Wee
k 39
Wee
k 41
Wee
k 43
Wee
k 45
Wee
k 47
Wee
k 49
Wee
k 51
Wee
k 1
Wee
k 3
Wee
k 5
Wee
k 7
Wee
k 9
Wee
k 11
Wee
k 13
Wee
k 15
Wee
k 17
Wee
k 19
Wee
k 21
Wee
k 23
Wee
k 25
Season 2007-2008
Season 2008-2009
24
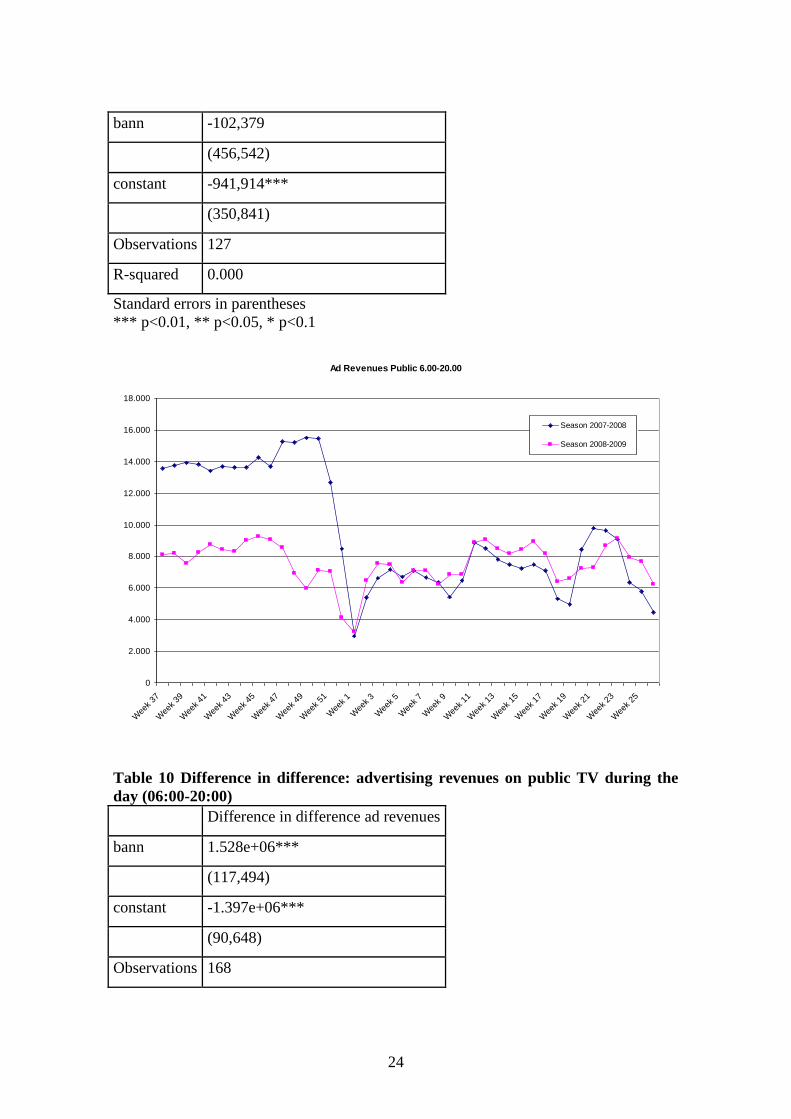
bann -102,379
(456,542)
constant -941,914***
(350,841)
Observations 127
R-squared 0.000
Standard errors in parentheses
*** p<0.01, ** p<0.05, * p<0.1
Table 10 Difference in difference: advertising revenues on public TV during the
day (06:00-20:00)
Difference in difference ad revenues
bann 1.528e+06***
(117,494)
constant -1.397e+06***
(90,648)
Observations 168
Ad Revenues Public 6.00-20.00
0
2.000
4.000
6.000
8.000
10.000
12.000
14.000
16.000
18.000
Wee
k 37
Wee
k 39
Wee
k 41
Wee
k 43
Wee
k 45
Wee
k 47
Wee
k 49
Wee
k 51
Wee
k 1
Wee
k 3
Wee
k 5
Wee
k 7
Wee
k 9
Wee
k 11
Wee
k 13
Wee
k 15
Wee
k 17
Wee
k 19
Wee
k 21
Wee
k 23
Wee
k 25
Season 2007-2008
Season 2008-2009
25
R-squared 0.505
Standard errors in parentheses
*** p<0.01, ** p<0.05, * p<0.1
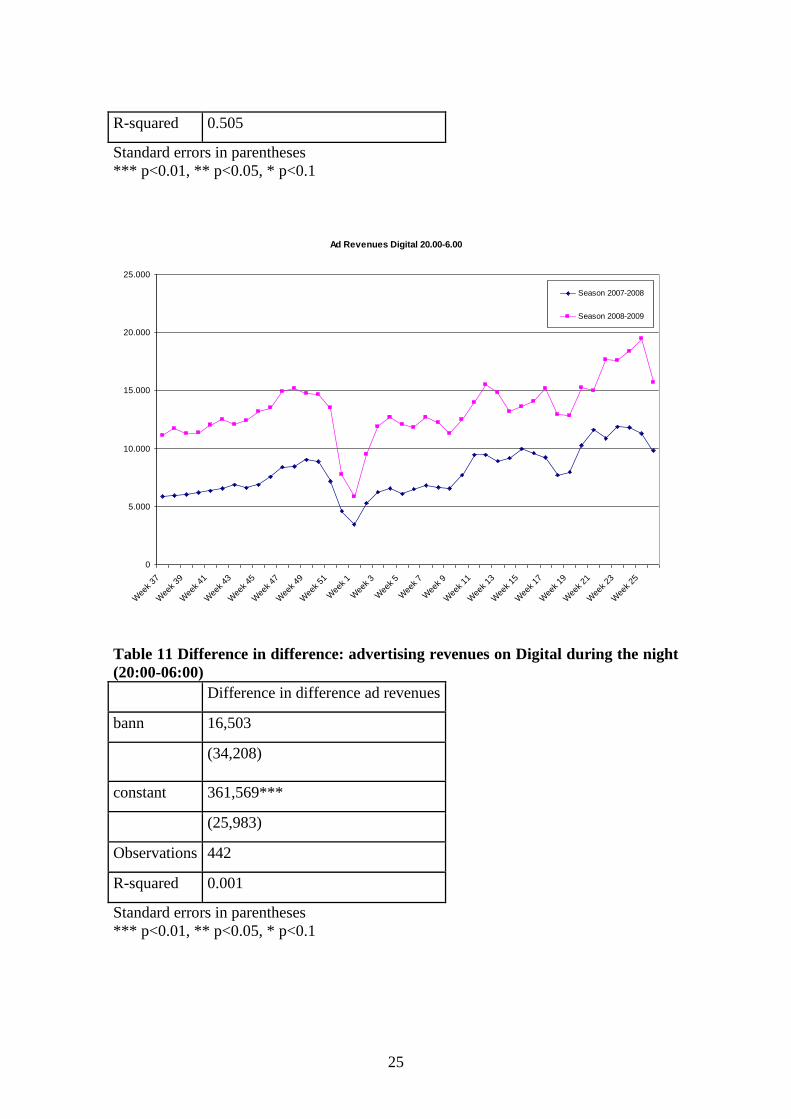
Table 11 Difference in difference: advertising revenues on Digital during the night
(20:00-06:00)
Difference in difference ad revenues
bann 16,503
(34,208)
constant 361,569***
(25,983)
Observations 442
R-squared 0.001
Standard errors in parentheses
*** p<0.01, ** p<0.05, * p<0.1
Ad Revenues Digital 20.00-6.00
0
5.000
10.000
15.000
20.000
25.000
Wee
k 37
Wee
k 39
Wee
k 41
Wee
k 43
Wee
k 45
Wee
k 47
Wee
k 49
Wee
k 51
Wee
k 1
Wee
k 3
Wee
k 5
Wee
k 7
Wee
k 9
Wee
k 11
Wee
k 13
Wee
k 15
Wee
k 17
Wee
k 19
Wee
k 21
Wee
k 23
Wee
k 25
Season 2007-2008
Season 2008-2009
26
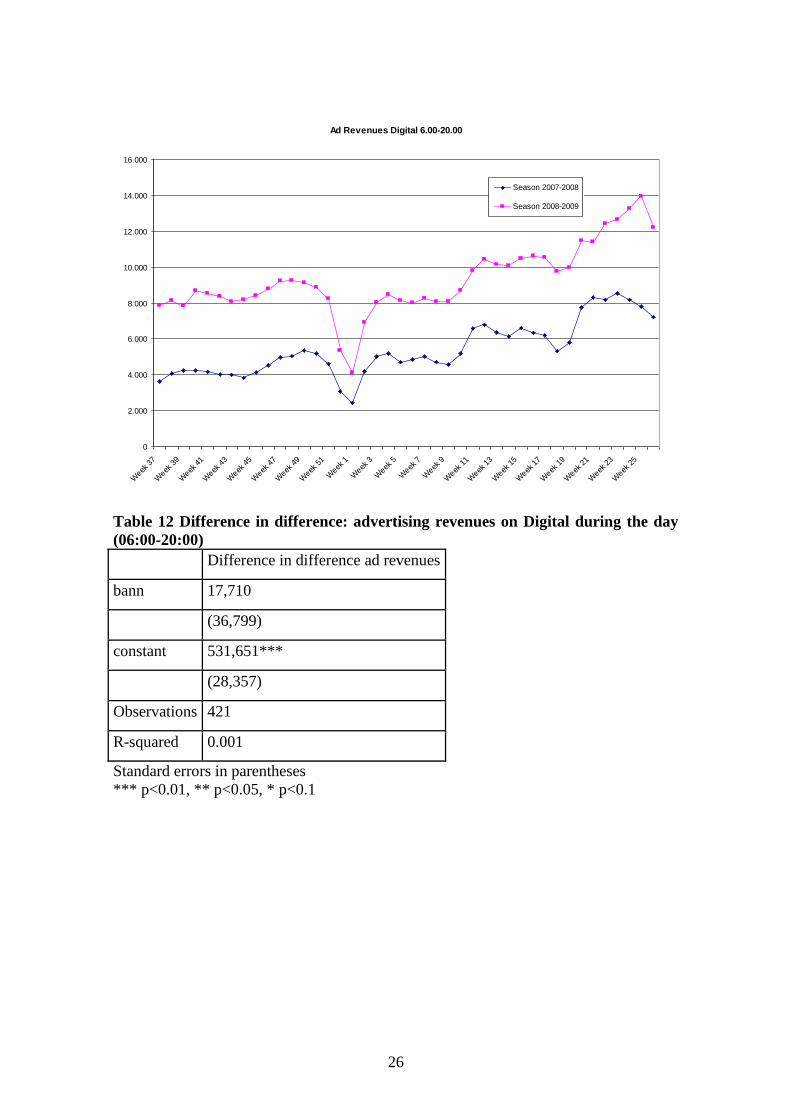
Table 12 Difference in difference: advertising revenues on Digital during the day
(06:00-20:00)
Difference in difference ad revenues
bann 17,710
(36,799)
constant 531,651***
(28,357)
Observations 421
R-squared 0.001
Standard errors in parentheses
*** p<0.01, ** p<0.05, * p<0.1
Ad Revenues Digital 6.00-20.00
0
2.000
4.000
6.000
8.000
10.000
12.000
14.000
16.000
Week
37
Week
39
Week
41
Week
43
Week
45
Week
47
Week
49
Week
51
Week
1
Week
3
Week
5
Week
7
Week
9
Week
11
Week
13
Week
15
Week
17
Week
19
Week
21
Week
23
Week
25
Season 2007-2008
Season 2008-2009
27
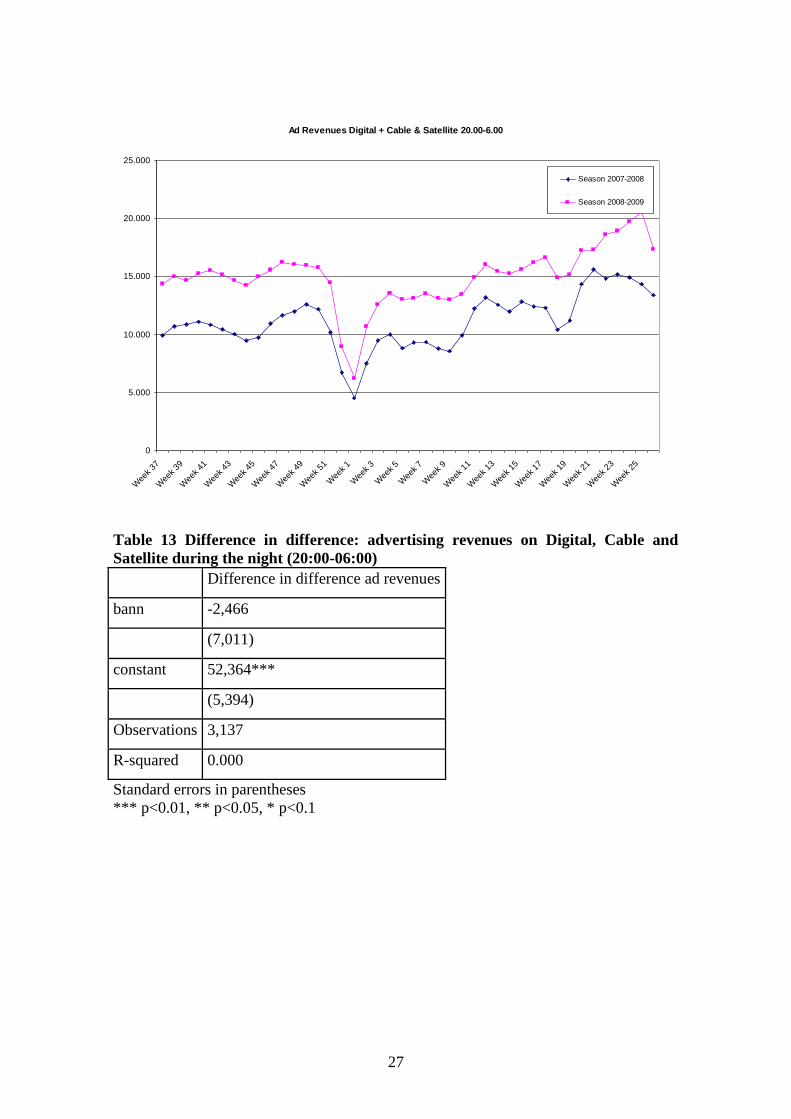
Table 13 Difference in difference: advertising revenues on Digital, Cable and
Satellite during the night (20:00-06:00)
Difference in difference ad revenues
bann -2,466
(7,011)
constant 52,364***
(5,394)
Observations 3,137
R-squared 0.000
Standard errors in parentheses
*** p<0.01, ** p<0.05, * p<0.1
Ad Revenues Digital + Cable & Satellite 20.00-6.00
0
5.000
10.000
15.000
20.000
25.000
Wee
k 37
Wee
k 39
Wee
k 41
Wee
k 43
Wee
k 45
Wee
k 47
Wee
k 49
Wee
k 51
Wee
k 1
Wee
k 3
Wee
k 5
Wee
k 7
Wee
k 9
Wee
k 11
Wee
k 13
Wee
k 15
Wee
k 17
Wee
k 19
Wee
k 21
Wee
k 23
Wee
k 25
Season 2007-2008
Season 2008-2009
28
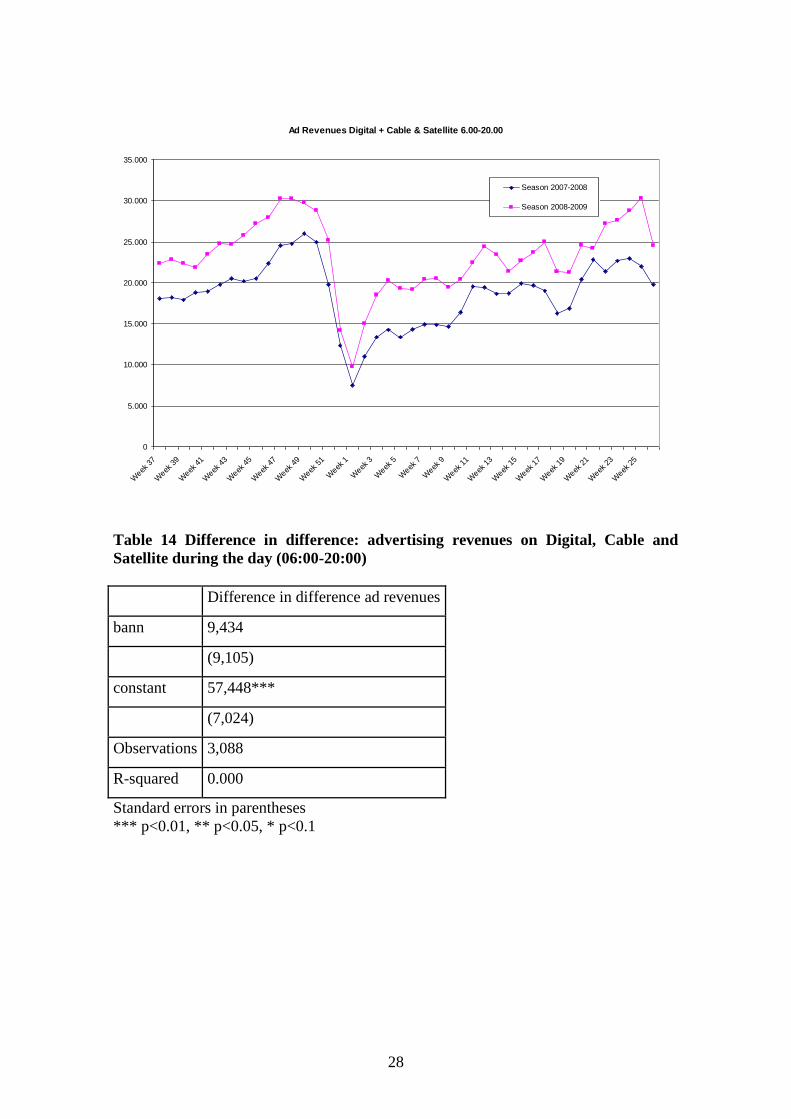
Table 14 Difference in difference: advertising revenues on Digital, Cable and
Satellite during the day (06:00-20:00)
Difference in difference ad revenues
bann 9,434
(9,105)
constant 57,448***
(7,024)
Observations 3,088
R-squared 0.000
Standard errors in parentheses
*** p<0.01, ** p<0.05, * p<0.1
Ad Revenues Digital + Cable & Satellite 6.00-20.00
0
5.000
10.000
15.000
20.000
25.000
30.000
35.000
Week
37
Week
39
Week
41
Week
43
Week
45
Week
47
Week
49
Week
51
Week
1
Week
3
Week
5
Week
7
Week
9
Week
11
Week
13
Week
15
Week
17
Week
19
Week
21
Week
23
Week
25
Season 2007-2008
Season 2008-2009
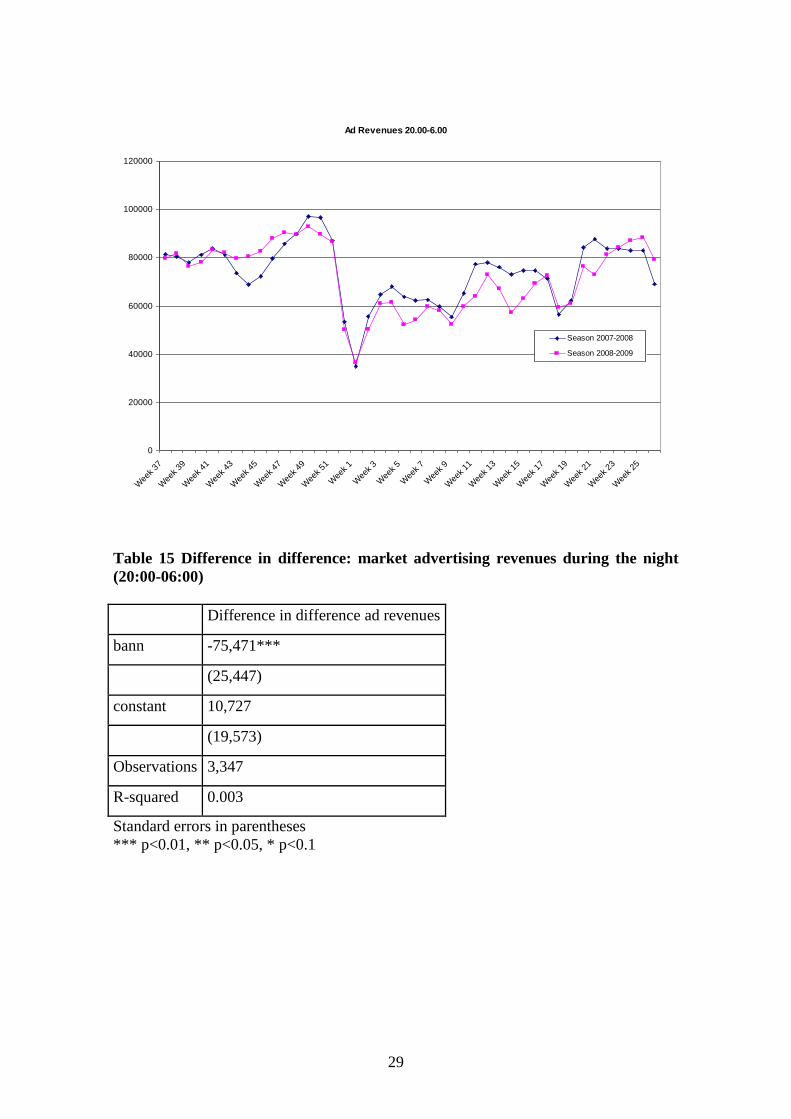
29
Table 15 Difference in difference: market advertising revenues during the night
(20:00-06:00)
Difference in difference ad revenues
bann -75,471***
(25,447)
constant 10,727
(19,573)
Observations 3,347
R-squared 0.003
Standard errors in parentheses
*** p<0.01, ** p<0.05, * p<0.1
Ad Revenues 20.00-6.00
0
20000
40000
60000
80000
100000
120000
Wee
k 37
Wee
k 39
Wee
k 41
Wee
k 43
Wee
k 45
Wee
k 47
Wee
k 49
Wee
k 51
Wee
k 1
Wee
k 3
Wee
k 5
Wee
k 7
Wee
k 9
Wee
k 11
Wee
k 13
Wee
k 15
Wee
k 17
Wee
k 19
Wee
k 21
Wee
k 23
Wee
k 25
Season 2007-2008
Season 2008-2009
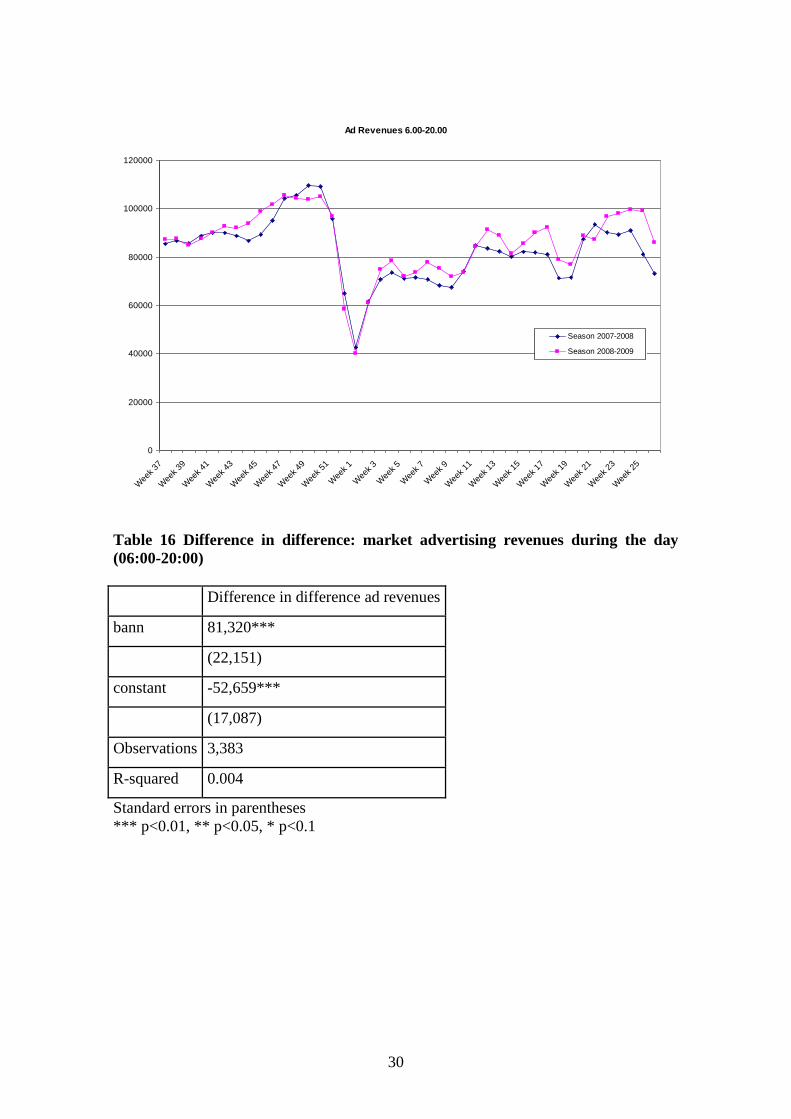
30
Table 16 Difference in difference: market advertising revenues during the day
(06:00-20:00)
Difference in difference ad revenues
bann 81,320***
(22,151)
constant -52,659***
(17,087)
Observations 3,383
R-squared 0.004
Standard errors in parentheses
*** p<0.01, ** p<0.05, * p<0.1
Ad Revenues 6.00-20.00
0
20000
40000
60000
80000
100000
120000
Wee
k 37
Wee
k 39
Wee
k 41
Wee
k 43
Wee
k 45
Wee
k 47
Wee
k 49
Wee
k 51
Wee
k 1
Wee
k 3
Wee
k 5
Wee
k 7
Wee
k 9
Wee
k 11
Wee
k 13
Wee
k 15
Wee
k 17
Wee
k 19
Wee
k 21
Wee
k 23
Wee
k 25
Season 2007-2008
Season 2008-2009
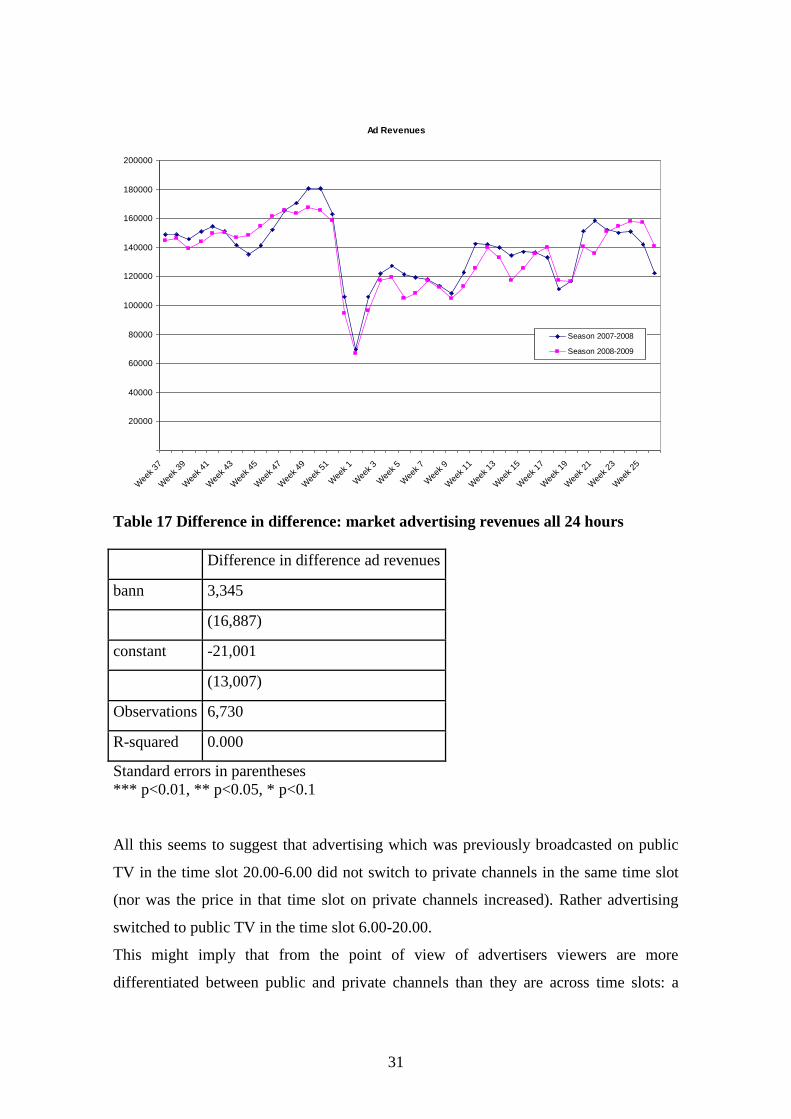
31
Table 17 Difference in difference: market advertising revenues all 24 hours
Difference in difference ad revenues
bann 3,345
(16,887)
constant -21,001
(13,007)
Observations 6,730
R-squared 0.000
Standard errors in parentheses
*** p<0.01, ** p<0.05, * p<0.1
All this seems to suggest that advertising which was previously broadcasted on public
TV in the time slot 20.00-6.00 did not switch to private channels in the same time slot
(nor was the price in that time slot on private channels increased). Rather advertising
switched to public TV in the time slot 6.00-20.00.
This might imply that from the point of view of advertisers viewers are more
differentiated between public and private channels than they are across time slots: a
Ad Revenues
20000
40000
60000
80000
100000
120000
140000
160000
180000
200000
Wee
k 37
Wee
k 39
Wee
k 41
Wee
k 43
Wee
k 45
Wee
k 47
Wee
k 49
Wee
k 51
Wee
k 1
Wee
k 3
Wee
k 5
Wee
k 7
Wee
k 9
Wee
k 11
Wee
k 13
Wee
k 15
Wee
k 17
Wee
k 19
Wee
k 21
Wee
k 23
Wee
k 25
Season 2007-2008
Season 2008-2009
32
person watching public TV in the 6.00-20.00 time slot is a better subistitute for one who
watches public TV in the time slot 20-00-6.00 than one who watches TV on a private
channel.
All in all, the preliminary evidence shown above would seem to suggest that the
common expectation that the ban would favour private TV channels at the expense of
public ones was not fulfilled.
The empirical evidence above also seems to suggest that, while advertising on digital
television is growing, its growth has not been affected by the ban coming into effect on
January 6th. Similarly, advertising does not seem to have switched to cable and satellite.
It would thus seem justified to focus our attention on the competition between public
and private aerial TV channels when approaching the other side of the two-sided market
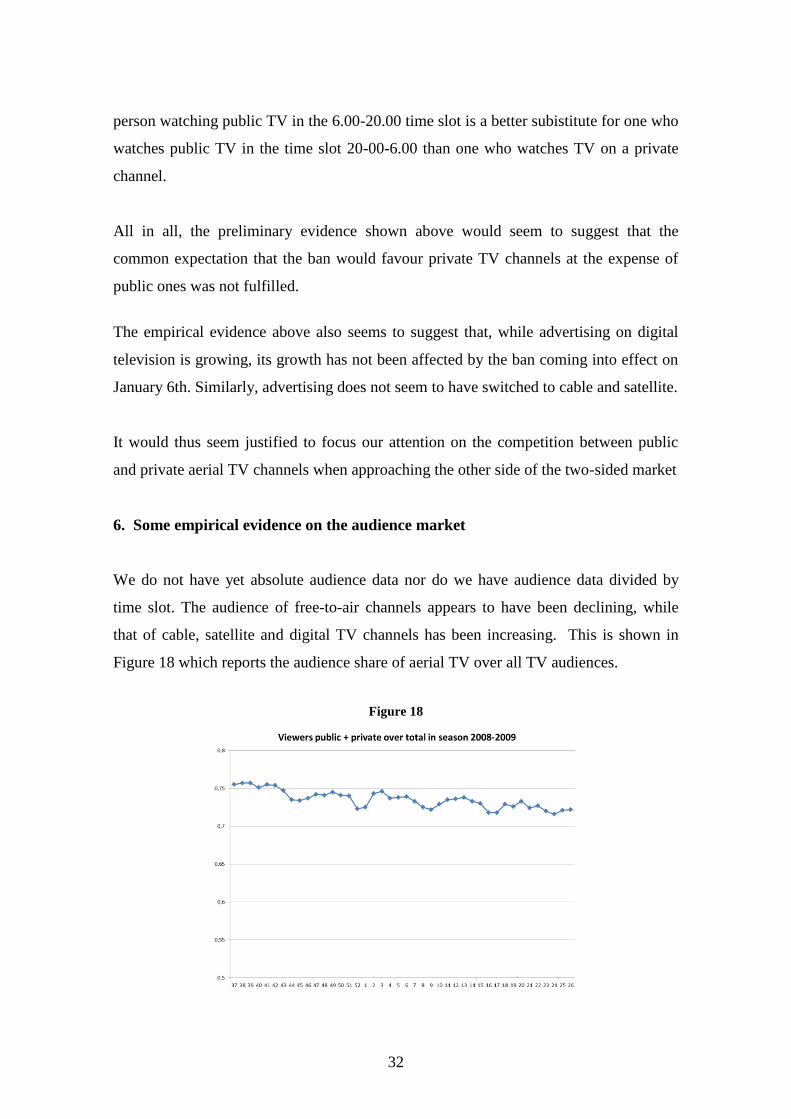
6. Some empirical evidence on the audience market
We do not have yet absolute audience data nor do we have audience data divided by
time slot. The audience of free-to-air channels appears to have been declining, while
that of cable, satellite and digital TV channels has been increasing. This is shown in
Figure 18 which reports the audience share of aerial TV over all TV audiences.
Figure 18
33
The presence of a linear trend is confirmed by the regression in Table 18.
[insert Table 18 here]
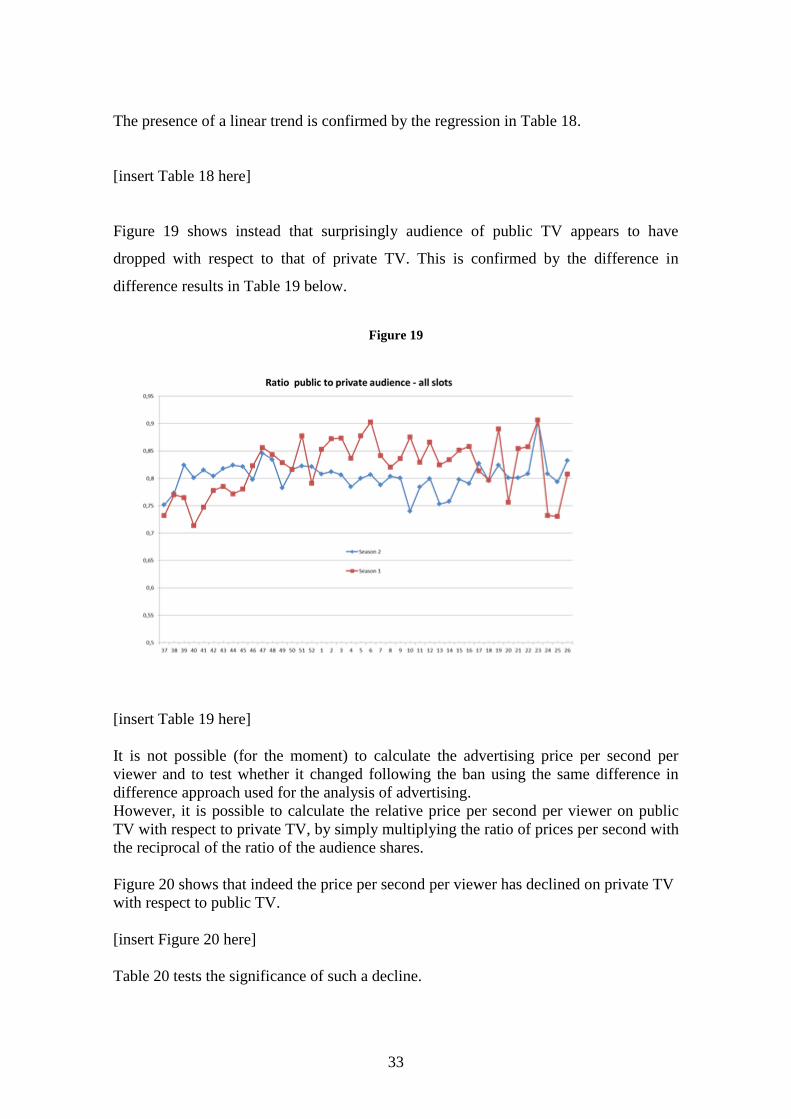
Figure 19 shows instead that surprisingly audience of public TV appears to have
dropped with respect to that of private TV. This is confirmed by the difference in
difference results in Table 19 below.
Figure 19
[insert Table 19 here]
It is not possible (for the moment) to calculate the advertising price per second per
viewer and to test whether it changed following the ban using the same difference in
difference approach used for the analysis of advertising.
However, it is possible to calculate the relative price per second per viewer on public
TV with respect to private TV, by simply multiplying the ratio of prices per second with
the reciprocal of the ratio of the audience shares.
Figure 20 shows that indeed the price per second per viewer has declined on private TV
with respect to public TV.
[insert Figure 20 here]
Table 20 tests the significance of such a decline.
34
[insert Table 20 here]
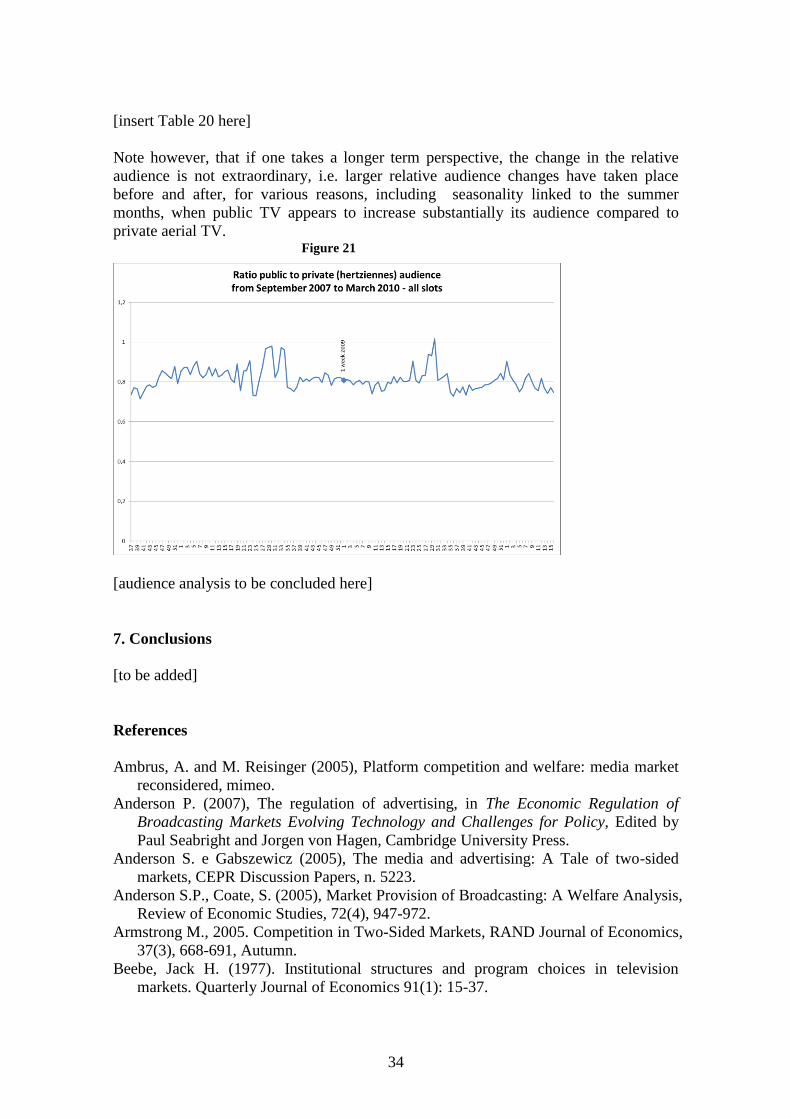
Note however, that if one takes a longer term perspective, the change in the relative
audience is not extraordinary, i.e. larger relative audience changes have taken place
before and after, for various reasons, including seasonality linked to the summer
months, when public TV appears to increase substantially its audience compared to
private aerial TV. Figure 21
[audience analysis to be concluded here]
7. Conclusions
[to be added]
References
Ambrus, A. and M. Reisinger (2005), Platform competition and welfare: media market
reconsidered, mimeo.
Anderson P. (2007), The regulation of advertising, in The Economic Regulation of
Broadcasting Markets Evolving Technology and Challenges for Policy, Edited by
Paul Seabright and Jorgen von Hagen, Cambridge University Press.
Anderson S. e Gabszewicz (2005), The media and advertising: A Tale of two-sided
markets, CEPR Discussion Papers, n. 5223.
Anderson S.P., Coate, S. (2005), Market Provision of Broadcasting: A Welfare Analysis,
Review of Economic Studies, 72(4), 947-972.
Armstrong M., 2005. Competition in Two-Sided Markets, RAND Journal of Economics,
37(3), 668-691, Autumn.
Beebe, Jack H. (1977). Institutional structures and program choices in television
markets. Quarterly Journal of Economics 91(1): 15-37.
35
Choi, J.P., Broadcast Competition and Advertising with Free Entry: Subscription vs.
Free-to-Air; Information Economics and Policy, June 2006, 18, 2, 181-96.
Crampes C., Haritchabalet C., Jullien B. (2009), Advertising, competition and entry in
media industries, Journal of Industrial Economics, 57 (1), 7-31.
Gabszewicz, J.J., D. Laussel and N. Sonnac (2004), Programming and advertising
competition in the broadcasting industry, Journal of Economics and Management
Strategy 12, 291-335.
Häckner J, Nyberg S. 2000. Price Competition, Advertising and Media Market
Concentration, Stockholm University, Department of Economics Research Papers in
Economics 2000-3.
Kind H.J., Nilssen T., Sorgard L. (2009), Business models for media firms: Does
competition matter for how they raise revenue? Marketing Science, 28(6), 1112-
1128.
Kohlschein, I. (2004) Economic Distortions Caused by Public Funding of Broadcasting
in Europe, WP.
Kremhelmer, Susanne; Zenger, Hans Advertising and the Screening Role of Mass
Media Information Economics and Policy, June 2008, 20(2), 107-19.
Mangani, A. (2003), Profit and audience maximization in broadcasting markets,
Information Economics and Policy, 15(3), 305-315.
Masson, R.T., Mudambi, R. and R.J. Reynolds, 1990, Oligopoly in advertiser-supported
media, Quarterly Review of Economics and Business 30, pp. 3-16.
Parker GG, & Van Alstyne MV. 2002. Two-Sided Network Effects: A Theory of
Information Product Design, Management Science, 51(10):1494–1504.
Peitz, M. and Valletti, T.M., Content and Advertising in the Media: Pay-TV versus
Free-to-Air, International Journal of Industrial Organization, July 2008, 26(4), 949-
65.
Reisinger, M., Ressner, L., and Schmidtke, R. (2009). Two-sided markets with
pecuniary and participation externalities. Journal of Industrial Economics, 57(1):32-
57.
Rochet J.-C. and Tirole J. (2006), Two-sided markets: a progress report, Rand Journal
of Economics, 37, 3, 645-667.
Rochet, J.-C. and Tirole, J. (2003). Platform competition in two-sided markets. Journal
of the European Economic Association, 1:990-1029.
Sonnac, N. (2000), Readers Attitudes Towards Press Advertising: Are They Ad-Lovers
or Ad-Averse? Journal of Media Economics 13(4), 249-259.
Spence, Michael A. and Owen, Bruce (1977). Television programming, monopolistic
competition and welfare. Quarterly Journal of Economics 91: 103-126.
Steiner, Peter (1952). Program patterns and preferences, and the workability of
competition in radio broadcasting. Quarterly Journal of Economics 66:194-223.
Stuhmeier T. and T. Wenzel (2010), Regulating Advertising in the Presence of Public
Service Broadcasting, WP, Dusseldorf Institute for Competition Economics.
Wright, D.J. (1994),Television Advertising Regulation and Program Quality, The
Economic Record, 70. 211, 361-367.
Le Canard enchaîné (2008), Audiovisuel publique: pourquoi Nicolas Sarkozy veut-il
supprimer la publicité ?, 19 janvier 2008, available at
http://www.politique.net/2008011902-audiovisuel-public-pourquoi-sarkozy-supprime-
pub.htm
36
Le Monde Diplomatique (2008), La télévision publique libérée de ses chaînes ?,
February, 2008, par Marie Bénilde, available at http://www.monde-
diplomatique.fr/2008/02/BENILDE/15587
The Ecnomist (2008), A fuzzy picture – Plans to abolish advertising on public
televisions are proving unpopular, 21 February 2008, available at
http://www.economist.com/node/10727792
The Guardian (2008), Sarkozy to ban advertizing from state television, Angelique
Chrisafis, 10 January 2008, available at
http://www.guardian.co.uk/world/2008/jan/10/france.advertising
Conseil Supérieur de l’Audiovisuel (2009), Le marché publicitaire télévisuel français
en 2009 : (r)évulotion ?, Février 2009, available at
http://www.csa.fr/upload/publication/CoproVpublicationv12-07publie.pdf
European Commission (2008), TV, online, on demand – Modern Rules for Audiovisual
Europe, Fact Sheet, October 2008, available at
http://ec.europa.eu/avpolicy/docs/reg/avmsd/fact_sheet_en.pdf
Journal Officiel de la République française (2009), Cahier des charges de la société
nationale de programme France Télévisions, Decret no 2009-796 du 23 juin 2009,
published 25 June 2009, available at
http://www.csa.fr/upload/dossier/cahier%20des%20charges.pdf
Légifrance (2010), Rapport relatif au décret n° 2008-1392 du 19 décembre 2008,
available
at http://www.legifrance.gouv.fr/affichTexte.do;jsessionid=DECC6A7055BE90CF007
A7173B3A3D86A.tpdjo03v_2?cidTexte=JORFTEXT000019986589&dateTexte=&old
Action=rechJO&categorieLien=id
Ministère de la culture et de la communication (2009), Loi n°2009-258 du 5 mars 2009
relative à la communication audiovisuelle et au nouveau service publique de la
télévision, La réforme de l’audiovisuel public, mise à jour le 03/08/2009, available at
http://www.ddm.gouv.fr/article.php3?id_article=1447
Ministère de la culture et de la communication (2008), La directive services de médias
audiovisuels (SMA), mise à jour le 10/03/2008, available at
http://www.ddm.gouv.fr/rubrique.php3?id_rubrique=143
SNPTV (2010), Syndicat National de la Publicité Télévisée, Reglementations, available
at http://www.snptv.org/generalites/faq.php?theme=1, accessed 14/09/2010
Rudfunkstaatsvertrag (2010), Institut für Urheber- und Medienrechte, available at
http://www.alm.de/fileadmin/Download/Gesetze/RStV_aktuell.pdf

37
Rundfunkstaatsvertrag (1991), Institut für Urheber und Medienrechte, available at
http://www.urheberrecht.org/law/normen/rstv/RStV-00b-1991/text/1991_02.php3
W&V (2010a), ARD/ZDF: Kurt Beck macht Ernst mit Werbeverbot, Werben und
Verkaufen, 15.03.2010, available at:
http://www.wuv.de/nachrichten/medien/ard_zdf_kurt_beck_macht_ernst_mit_werbever
bot
W&V(2010b), Werbeverbot für ARD und ZDF rutscht von der Tagesordnung, Werben
und Verkaufen, 07.06.2010, available at:
http://www.wuv.de/nachrichten/medien/werbeverbot_fuer_ard_und_zdf_rutscht_von_d
er_tagesordnung