bank of ireland group › app › uploads › prelim-2002.pdfcontinuing focus on ireland? undisputed...
TRANSCRIPT

Bank of Ireland Group
Year End Results to31 March 2002

2
Today’s Agenda
? The results in detail John O’Donovan
? Our strategy in the UK Jeff Warren
? An overview of Group Strategy Mike Soden

3
Superior Performance
? A new record profit figure in each of the last ten years
? Average return on equity of 25% for each of the last
nine years
? Top quartile shareholder returns for one, five and ten
years

4
A Financial Services Company
? Diversified earnings and good geographic spread of
profit sources
? RoI and UK retail businesses equal in size
? Substantial earnings from Wholesale, Funds
Management, Life Assurance and Pensions

5
Strong Domestic Franchise
? Continuing focus on Ireland
? Undisputed No.1 Financial Services Provider
? Good economic backdrop
? 3.5% growth this year, 5% plus next year

6
Features of the 01/02 Results
? Strong volume growth in Ireland
? Modest margin erosion in Ireland and UK
? Intense competition and business transition in GB
? Buoyancy in Life and Pensions
? Strong Funds inflow in Asset Management
? Continuing very low bad debts
? Top quartile return on equity

7
Costs in Focus
? Adverse costs trend will be reversed
? Problem areas identified and remedial action underway
? €85 million annual savings from Group Transformation
Programme
? Gap between cost and income growth reduced from 10%
at the half year to 3% for the full year

8
Clear Growth Strategy
? Organic growth where we have room to grow
? Tactical acquisitions where we can get and add value
? New business development to exploit gaps in the
market

9
Iridian
? $177 - 198 million for 61% stake
? $11 billion manager of US equities
? Excellent fit for BIAM
? Staged purchase incorporating performance incentives
? Quality earnings and good business synergies
? Matches the Group’s acquisition criteria

10
Financial Review

11
Financial Highlights
* Excluding transformation programme costs €37m (€30m post tax), (€93m (€72m post tax) in March 01) ; March 01 restated on the adoption of UITF 33 (€3m)** Excluding Goodwill Amortisation €15m (€7m in Mar 01) and Exceptional Item above (plus Deposit Interest Retention Tax €35m in March 01) ; March 01 restated on the adoption of FRS 19 Deferred Tax (€6m).
Mar 02 Mar 01 %
€m €m Change
Profit on Ordinary Activities
before Exceptional Item(s)* 1,122 1,085 3
Alternative EPS** (Cent) 93.4 84.5 11
Dividend (Cent) 33.0 29.0 14
Shareholder Value Added 551 510 8
Return on Equity 23.5% 24.5%

12
Strong Capital BasePreference Share Buyback €261m September 2001
Sept 01 % 1.1 Return on Average Assets* 4.2 Equity / Assets 7.4 Tier 1 Capital 11.5 Total Capital 81 Equity Element of Tier 1
Mar 02 Mar 01 % % 1.1 1.1 4.4 4.3 7.6 7.8 11.5 12.4
81 77
€bn %
Growth
Total Assets 87 11
Risk Weighted Assets 53 13
* Pre Exceptional Item(s)& Goodwill Amortisation

13
Group Balance Sheet Sept 01 Mar 02 Mar 01 €bn Assets €bn €bn 7.5 Bank Loans 8.4 8.1 54.8 Customer Loans 56.6 51.1 9.7 Debt Securities 10.9 8.5 6.8 Other 5.8 6.2 78.8 81.7 73.9 4.9 Life Assurance 5.6 5.0 83.7 87.3 78.9
Liabilities 11.2 Bank Deposits 12.6 11.7 50.0 Customer Deposits 51.1 45.6 5.0 Debt Securities In Issue 6.4 5.0 8.7 Other* 7.4 7.8 3.9 Stockholders Funds 4.2 3.8 78.8 81.7 73.9 4.9 Life Assurance 5.6 5.0 83.7 87.3 78.9
* Includes subordinated liabilities €2.5bn (Mar 01 €2.5bn)
14
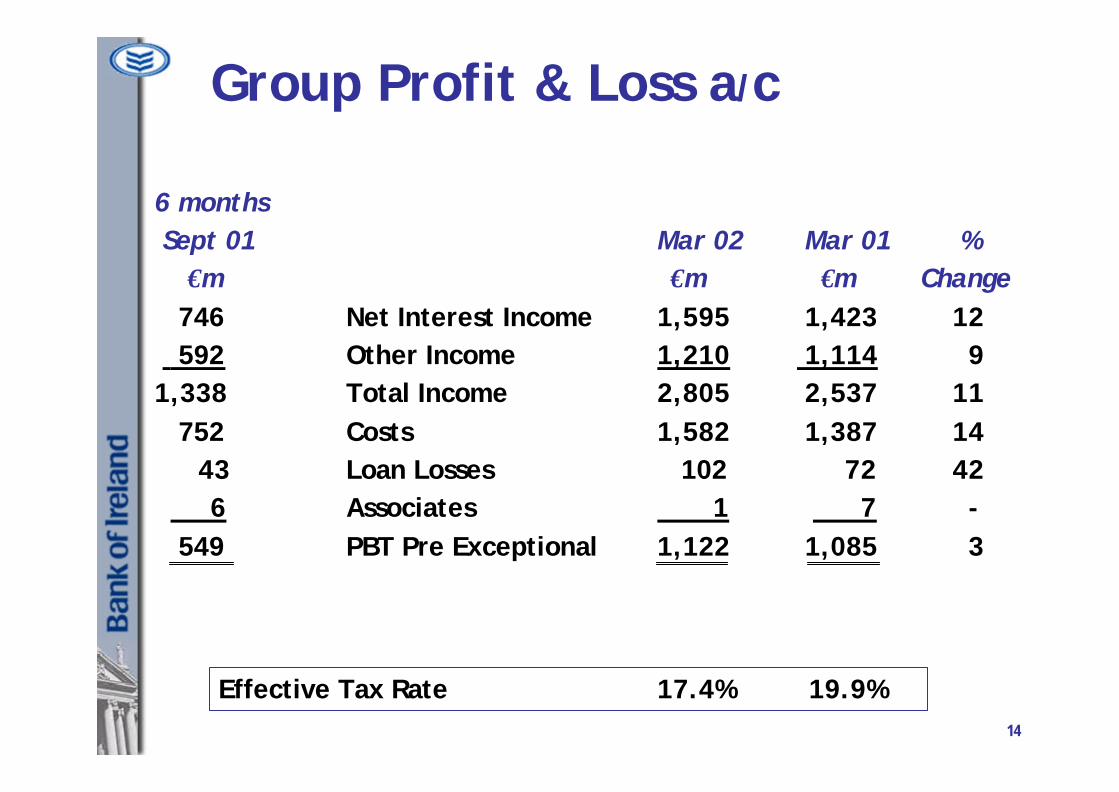
Group Profit & Loss a/c
6 months Sept 01 €m 746 Net Interest Income 592 Other Income1,338 Total Income 752 Costs
43 Loan Losses 6 Associates 549 PBT Pre Exceptional
Mar 02 Mar 01 % €m €m Change1,595 1,423 121,210 1,114 92,805 2,537 111,582 1,387 14 102 72 42 1 7 -1,122 1,085 3
Effective Tax Rate 17.4% 19.9%

15
Net Interest Income +12%
? Volume (+€195m) 13%
? Margin (-€23m) -1%

16
Margin Effect
Basis Points
Mar 02 Mar 01 Change
Group Margin 2.27 2.30 -3
Main Influencers
UK Financial Services -3
Retail Republic of Ireland -2
Mix Element +2

17
Other Income +9%43% of Total Income
? Life Businesses Sales (APE +34%)
? Fees
? First Rate
? Davy
? Impact of volatility in Equity Markets
? UK Acquisitions

18
Group Costs
6 months
Sept 01
€m
434 Staff
243 Administrative
68 Depreciation
7 Goodwill
752
Mar 02 Mar 01 %
€m €m Change
908 773 17
519 484 7
140 123 14
15 7 -
1,582 1,387 14

19
Cost / Income RatiosGroup & Divisional Trends
Mar 02 Mar 01
% %
Group* 55.8 54.2
Retail Republic of Ireland 63.6 64.4
Asset & Wealth Management 44.7 41.4
Wholesale Financial Serv. 39.1 41.8
UK Financial Services* 56.7 54.7
UK Fin. Servs. excl. Acqs* 49.6 50.9
Bristol & West excl. Acqs* 43.0 46.3
* Excluding Goodwill Amortisation

20
Group Credit Risk8TH consecutive year 20 basis points (bps)
€m* bps** €m* bps**
? Group Total 102 19 72 15
? Specific 89 16 59 12
? General 7 1 22 4
? Non Designated Specific Provision 25 5 8 2
? Recoveries (19) (3) (17) (3)
Mar 02 Mar 01
* Loan Loss Charge (€m)
** Charge/Average Loans (bps)

21
Group Credit RiskExcellent Credit Quality
Sept 01
€302m
€453m
150%
0.8%
Mar 02 Mar 01 % Change
Balances under Provisions (BUP’s) €331m €315m 5
Loan Loss Provisions (LLP’s)* €500m €430m 16
Coverage Ratio (LLP/BUP) 151% 137%
LLP’s as a % of Loans 0.9% 0.8%
* Includes non designated specific provision (NDSP) €174m (€147m 01)

22
Business Review

23
Profit Before Tax by Division
6 months
Sept 01
€m
168 Retail Republic of Ireland
44 Bank of Ireland Life
146 UK Financial Services
178 Wholesale Financial Services
60 Asset & Wealth Mgmt.
(25) Group & Central Costs
571
(22) Grossing up
549 Pre Exceptional Profit beforeTax
Mar 02 Mar 01 % Constant
€m €m Change Currency %
321 290 11 11
122 131 (7) (7)
318 324 (2) 1
355 283 25 25
126 133 (5) (5)
(64) (30) - -
1,178 1,131 4 5
(56) (46) - -
1,122 1,085 3 4

24
Retail Republic of Ireland27% of Group Profits
6 months
Sept 01
€m
387 Net Interest Income
108 Other Income
495 Total Income
307 Operating Costs
20 Loan Loss Provision
168 Profit before Tax
Mar 02 Mar 01 %
€m €m Change
787 704 12
228 206 11
1,015 910 12
646 586 10
48 34 41
321 290 11

25
? Good Volume Growth
? Resources +16%
? Mortgages +23%
? Other Lending +8%
? Market Share Gains
? 273K SSIAs/SSIPs to 30 April 02; €3.5bn Maturity Value
? Relationship Management Advanced
Retail Republic of IrelandStrong Growth in Net Interest Income +12%

26
? Key Drivers
? Credit Card Turnover
? Branch Transaction Volumes
? General Insurance
? FX Income Lower
Retail Republic of IrelandSolid Growth in Other Income +11%

27
? Costs Growth +10%
Key Drivers:
? Euro Implementation +3%
? Higher Pay & Employer Taxes +5%
? Usage of Direct Channels
? Banking 365 Telephone +60% to 8m calls
? Banking 365 Online +75% to 4m TX
? ATMs +15% to 59m TX
Retail Republic of IrelandGood Cost Management

28
Retail Republic of IrelandSatisfactory Asset Quality
? Increase in Loan Loss Charge of €14m to €48m;
mainly Consumer Lending
? Loan Loss of 30 Basis Points (25bps Mar 01)
? Strong Quality Profile
29
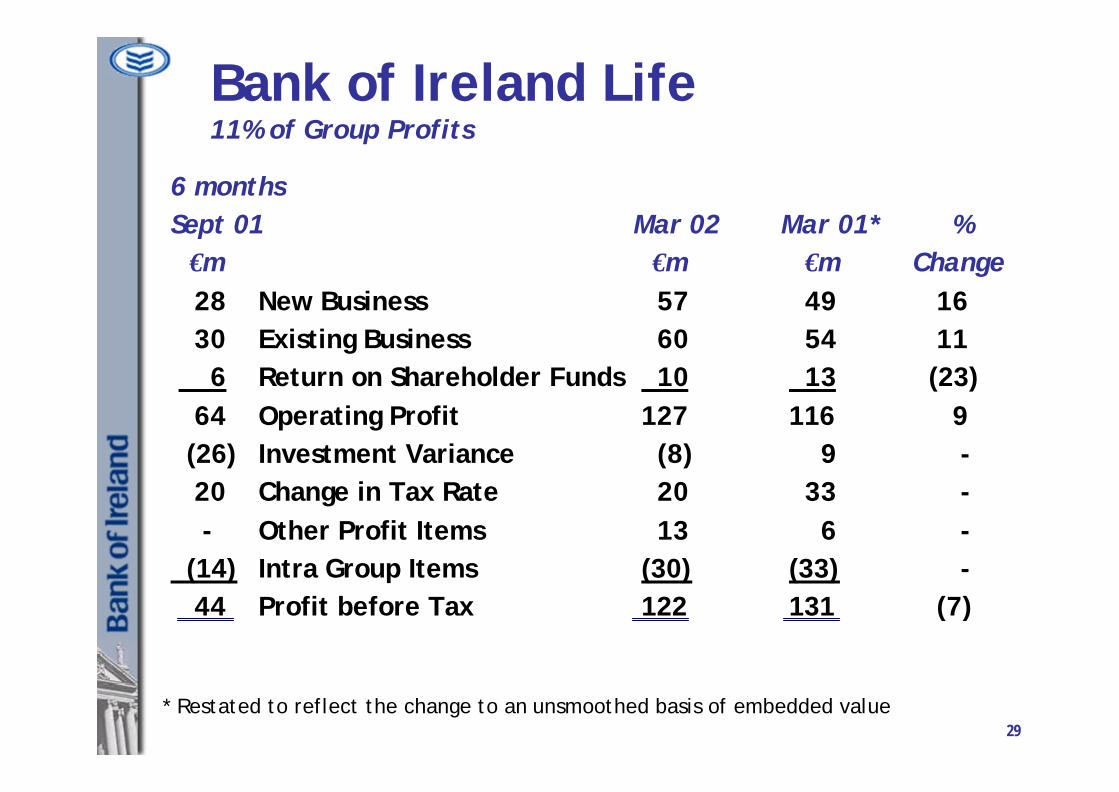
Bank of Ireland Life11% of Group Profits
6 months Sept 01 €m 28 New Business 30 Existing Business 6 Return on Shareholder Funds 64 Operating Profit (26) Investment Variance 20 Change in Tax Rate - Other Profit Items (14) Intra Group Items 44 Profit before Tax
Mar 02 Mar 01* % €m €m Change 57 49 16 60 54 11 10 13 (23) 127 116 9 (8) 9 - 20 33 - 13 6 - (30) (33) - 122 131 (7)
* Restated to reflect the change to an unsmoothed basis of embedded value

30
Bank of Ireland LifeNew Business Market Share 19%
? Annual Premium Equivalent Sales +34%
? Equity Related Special Savings Incentive Accounts
? Embedded Value Impact (-€26m Sept 01) -€8m
? Successful Amalgamation of Lifetime and New Ireland
? Free Asset / Solvency Ratio 337%
(71,000 SSIP accounts opened by 30 April 2002)

31
UK Financial Services (Sterling)27% of Group Profits
6 monthsSept 01 Stg£m 161 Net Interest Income
90 Other Income 251 Total Income
146 Costs* 9 Loan Losses
96 Profit before Tax
Mar 02 Mar 01 % Stg£m Stg£m Change 350 327 7
179 151 19 529 478 11
300 262 15 19 13 46
210 203 3
* Pre Goodwill Amortisation of Stg£9m Mar 02, Stg£4m Mar 01 & Stg£4m Sept 01

32
UK Financial Services (Sterling)54% of Group Loans & Advances to Customers (€30bn)
Sept 01
Stg£bn
B&W Residential Mortgages
12.1 - Standard
1.6 - Specialised
1.2 B&W Commercial Mortgages
3.5 Bank of Ireland GB & NI
18.4 Loan Book
13.1 Resources
Mar 02 Mar 01 %
Stg£bn Stg£bn Change
11.5 12.0 -4
2.2 0.8 175
1.3 1.1 18
3.7 3.3 12
18.7 17.2 9
12.2 11.8 3

33
UK Financial ServicesBusiness Trends
? Income +11%
? 44% of Income from Specialised Lending & Advice Based
Businesses (from 25% in 1999)
? Fee Income % Total Income 34%
? Costs +15%
Key Driver:
? Full Year Costs of Acquisitions 11%
? Asset Quality
? Loan Loss of 10 basis points (8 bps Mar 01)

34
Wholesale Financial Services30% of Group Profits
6 months
Sept 01
€m
135 Net Interest Income*
37 Dealing Profits*
132 Other Income
304 Operating Income
118 Operating Costs
8 Loan Loss Provision
178 Profit before Tax
Mar 02 Mar 01 %
€m €m Change
306 216 42
64 95 (32)
253 204 24
623 515 21
243 215 13
25 17 47
355 283 25
* €50m exceptional trading gains (€25m Mar 01)

35
Wholesale Financial ServicesProfit Before Tax Analysis
6 months Sept 01 €m
51 Corporate Banking
84 Treasury & Intl
43 Other*
178
Mar 02 Mar 01 %
€m €m Change
113 93 22
170 133 28
72 57 26
355 283 25
* Includes Davy, Private Banking, IBI Corporate Finance and First Rate Enterprises

36
Wholesale Financial Services
Income +21%
? Strong Growth in International Lending
? Exceptional performance in Treasury & InternationalBanking
? Excellent performance in Institutional Bonds and Equities by
Davy
? Expansion of First Rate’s UK Operations
Costs +13%
? Includes expansion costs for International Finance & First
Rate
? Successful integration of Treasury and International Banking
? Full Merger of Banking Operations in Isle of Man and Jersey

37
Wholesale Financial Services 16% of Group Loan & Advances to Customers (€9bn)
Risk Management
? Strong Asset Quality
? Loan Loss of 20 basis points (16 bps Mar 01)
? Modest Proprietary Trading
? Sound Governance, Controls & Risk Culture

38
Asset & Wealth Management*11% of Group Profits
6 monthsSept 01 €m
2 Net Interest Income
108 Fee Income
110 Operating Income
50 Operating Costs
- Loan Loss Provision
60 Profit before Tax
Mar 02 Mar 01 % €m €m Change
4 7 (43)
224 220 2
228 227 -
102 94 9
- - -
126 133 (5)
* Includes Asset Management and Securities Services

39
Asset & Wealth ManagementIncome Impacted by Equity Markets
Asset Management
? Assets under Management €49.8bn to €57.1bn +15%
? Record New Business €8bn
? Relative Investment Performance has been strong
Securities Services
Assets under Custody & Administration €121bn to €137bn

40
Asset & Wealth ManagementAssets Under Management
6 months 6 months 12 months Sept 01 Mar 02 Mar 02
€bn €bn €bn
Opening AUM 49.8 46.8 49.8
Net Cashflow 3.6 4.6 8.2
Performance (6.6) 5.7 (0.9)
Closing AUM 46.8 57.1 57.1

41
Strategy

42
What is UK FS?
? A financial services organisation operating in 4 defined
market sectors
? Based on segmentation, not brand
? Businesses based on skill not scale
? An Organisation with PBT Stg £210m*
* Pre Goodwill

43
UKFS Targets 4 Market Segments
1. Business Financial Services Targeting selected niches of the business banking and SME business market in GB
2. Bank of Ireland A product manufacturing businessPersonal Lending producing loans for the
intermediary market
3. Bank of Ireland An integrated business and(Northern Ireland) personal bank within Northern
Ireland
4. Financial Advice & Savings Distribution of investment andother products, supported byadvice and a targeted savingsbusiness

44
Key Business Characteristics
? Business Financial Services
? Medium Cost Income ratio, mix of balance sheet and feegenerating activities
? A strategic opportunity and challenge
? Lending? Low Cost Income ratio, high capital requirement
? Re-positioning now in 3rd year? Northern Ireland
? Medium Cost Income ratio, integrated retail banking? Strong market share and proposition, attractive market
? Financial Advice & Savings? High Cost Income ratio, high ROE
? High level of regulatory and market change

45
UK Priorities
? Market leadership in non standard, higher
margin/return, residential mortgage lending
? Develop niches of the business banking market
? Realise the potential in financial advice and savings
propositions
? Growth
? Active management to improve corporate
flexibility and increase strategic options

46
Group Strategy - Summary
? Growth in Britain - organically and through selective
acquisition
? Exploit further strong growth potential in Ireland
? Continuing diversification of income streams
? Growing internationalisation of profit sources
? Active capital management
? Highest standards in risk management
? Strong focus on costs

47
And Finally……….
? A new profits record
? Growth in volumes and market share
? Good start to the current year
? Encouraging prospects for 02/03

48
Supplementary Information

49
Index - Supplementary
? Economic Outlook
? New Accounting Issues
? Volume Growth
? Group Loan Composition
? Asset Quality
? Group Transformation Programme
? UK Financial Services (Euro)
? Bristol & West (Stg/Euro)

50
Economic Outlook – IrelandIreland likely to Exceed European Average
% Growth
GDP
Consumption
Exports
Inflation
Unemployment
2001 2002 2003
5.9 3.5 5.0
4.8 4.2 4.5
8.4 4.5 8.0
4.9 4.2 3.5
3.8 4.4 4.4
Actual Forecast
Source: Consensus

51
New Accounting Issues
? FRS 19 - Deferred Tax
March 2001 Restated - Tax -€6m - Profit Attributable +€6m - Alternative EPS +0.6c
? UITF 33 - Obligations in Capital Instruments
Interest on Preferred Securities now included in Interest Payable
March 2001 Restated - Interest Payable -€3m- Profit Attributable No change
? FRS 17 – Pensions
Phased Transitional Basis

52
Volume Growth: Constant Currency
Group
Republic of Ireland
UK
P.I.T. Average P.I.T. Average % % % %Increase Increase Increase Increase
10 14 11 18
11 14 15 14
7 12 4 15
Lending Resources

53
Group Loan Composition at March 2002 - €57bn
Residential MortgagesBusiness & Other ServicesPersonal LendingConstruction & PropertyManufacturingOther LendingCommercial MortgagesTMTAgriculture
Total
Group R.O.I. UK International % % % %
53 13 40 - 10 6 2 2
9 7 2 - 7 2 4 1 6 3 1 2 6 3 1 2 4 - 4 -
3 2 - 1 2 2 - -
100 38 54 8

54
Asset Quality
Balances under Provision? Ireland? UK? International
Loan Loss Provision? Ireland? UK? International
As % of BUPsAs % of LoansP&L Annual Charge/Ave Loans
Residential Other Total Mortgages LendingMar 02 Mar 01 Mar 02 Mar 01 Mar 02 Mar 01€m €m €m €m €m €m 2 3 209 137 211 14058 95 57 66 115 161 - - 5 14 5 1460 98 271 217 331 315
8 5 241 185 249 190113 104 114 107 227 211 - - 24 29 24 29121 109 379 321 500 430
200% 111% 140% 148% 151% 137%0.4% 0.4% 1.3% 1.2% 0.9% 0.8%0.03% 0.00% 0.35% 0.26% 0.19% 0.15%

55
Asset QualityLoan to Value
Residential Mortgages: Republic of Ireland
Average Loan to Value
? Owner Occupied 61%
? Investors 63%
Mark to Market Loan to Value 33%
Residential Mortgages: Bristol & West
Average Loan to Value
? Standard 69%
? Specialised 71%

56
Republic of Ireland ResidentialMortgages
Arrears Balance Profile2002 (%)2001 (%)
New Business LTV’s2002 (%)2001 (%)
Book LTV’s2002 (%)2001 (%)
1-6 mths 6-12 mths 12+ mths Total 1.2 0.3 0.2 1.7 1.0 0.2 0.2 1.4
<75% 75-90% >90% 59 33 9 62 32 6
<75% 75-90% >90% 69 27 4 69 27 4
% Growth 2000 2001 2002 2003 2004
House prices 17 9 5 5 8

57
UK Residential Mortgages
Arrears Balance Profile
2002 (%)
2001 (%)
New Business LTV’s
2002 (%)
2001 (%)
Book LTV’s
2002 (%)
2001 (%)
1-6 mths 6-12 mths 12+ mths Total
1.5 0.2 0.2 1.9
1.8 0.3 0.2 2.3
<75% 75-90% >90%
58 34 8
54 28 17
<75% 75-90% >90%
49 30 20
47 28 25

58
Group TransformationProgrammeAnnual Savings €85m from April 2003
Savings (€m)
Staff Reductions (cumulative)
Branch Closures (cumulative)
Mar 01 Mar 02 Mar 03
Achieved Achieved Forecast
22 55 75
440 790 1,000
15 28 35
Total Exceptional Costs €130m

59
UK Financial Services (Euro)
6 months Sept 01 €m
255 Net Interest Income
144 Other Income
399 Total Income
231 Costs*
15 Loan Losses
153 Profit before Tax
Mar 02 Mar 01 % €m €m Change
554 532 4
284 247 15
838 779 8
475 427 11
30 21 43
333 331 1
* Excludes Goodwill €15m Mar 02, €7m Mar 01 & €7m Sept 01

60
Bristol & West (Sterling)
6 months
Sept 01
Stg£m
92 Net Interest Income
69 Other Income
161 Total Income
91 Costs*
3 Loan Losses
67 Profit before Tax
Mar 02 Mar 01 %
Stg£m Stg£m Change
211 199 6
133 108 23
344 307 12
188 161 17
6 2 -
150 144 4
* Excludes Goodwill of Stg£9m Mar 02, Stg£4m Mar 01 & Stg£4m Sept 01

61
Bristol & West (Euro)
6 months Sept 01 €m
146 Net Interest Income
109 Other Income
255 Total Income
143 Costs*
5 Loan Losses
107 Profit before Tax
Mar 02 Mar 01 % €m €m Change
333 325 2
212 175 21
545 500 9
298 263 13
9 2 -
238 235 1
* Excludes Goodwill of €15m Mar 02, €7m Mar 01 & €7m Sept 01

62
For Further InformationPlease Contact
Mary KingHead of Group Investor Relations
Tel: +3531 604 3501Fax: +3531 661 5105Email: [email protected]: www.bankofireland.ie/investor