bank of america merrill lynch power and gas leaders conference
TRANSCRIPT

Bank of America Merrill LynchPower and Gas Leaders ConferenceSeptember 21, 2011
®
®

2
Forward-Looking Statements & Supplemental Information
Forward-Looking Statements Certain expectations and projections regarding our future performance referenced in this presentation, in other reports or statements we file with the SEC or otherwise release to the public, and on our website, are forward-looking statements. Senior officers and other employees may also make verbal statements to analysts, investors, regulators, the media and others that are forward-looking. Forward-looking statements involve matters that are not historical facts, such as statements regarding our future operations, prospects, strategies, financial condition, economic performance (including growth and earnings), industry conditions and demand for our products and services. Because these statements involve anticipated events or conditions, forward-looking statements often include words such as "anticipate," "assume," "believe," "can," "could," "estimate," "expect," "forecast," "future," "goal," "indicate," "intend," "may," "outlook," "plan," "potential," "predict," "project," "seek," "should," "target," "would," or similar expressions. Forward-looking statements contained in this presentation include, without limitation, statements regarding future earnings per share, dividend growth and EBIT contribution, our priorities for 2011 and the proposed merger with Nicor Inc. Our expectations are not guarantees and are based on currently available competitive, financial and economic data along with our operating plans. While we believe our expectations are reasonable in view of the currently available information, our expectations are subject to future events, risks and uncertainties, and there are several factors -many beyond our control - that could cause results to differ significantly from our expectations.
Such events, risks and uncertainties include, but are not limited to, changes in price, supply and demand for natural gas and related products; the impact of changes in state and federal legislation and regulation including changes related to climate change; actions taken by government agencies on rates and other matters; concentration of credit risk; utility and energy industry consolidation; the impact on cost and timeliness of construction projects by government and other approvals, development project delays, adequacy of supply of diversified vendors, unexpected change in project costs, including the cost of funds to finance these projects; the impact of acquisitions and divestitures; direct or indirect effects on our business, financial condition or liquidity resulting from a change in our credit ratings or the credit ratings of our counterparties or competitors; interest rate fluctuations; financial market conditions, including recent disruptions in the capital markets and lending environment and the current economic downturn; general economic conditions; uncertainties about environmental issues and the related impact of such issues; the impact of changes in weather, including climate change, on the temperature-sensitive portions of our business; the impact of natural disasters such as hurricanes on the supply and price of natural gas; acts of war or terrorism; and other factors which are provided in detail in our filings with the Securities and Exchange Commission. Forward-looking statements are only as of the date they are made, and we do not undertake to update these statements to reflect subsequent changes.
Supplemental InformationCompany management evaluates segment financial performance based on earnings before interest and taxes (EBIT), which includes the effects of corporate expense allocations and on operating margin. EBIT is a non-GAAP (accounting principles generally accepted in the United States of America) financial measure that includes operating income, other income and expenses. Items that are not included in EBIT are financing costs, including debt and interest expense and income taxes. The company evaluates each of these items on a consolidated level and believes EBIT is a useful measurement of our performance because it provides information that can be used to evaluate the effectiveness of our businesses from an operational perspective, exclusive of the costs to finance those activities and exclusive of income taxes, neither of which is directly relevant to the efficiency of those operations. Operating margin is a non-GAAP measure calculated as operating revenues minus cost of gas, excluding operation and maintenance expense, depreciation and amortization, and taxes other than income taxes. These items are included in the company's calculation of operating income. The company believes operating margin is a better indicator than operating revenues of the contribution resulting from customer growth, since cost of gas is generally passed directly through to customers. In addition, in this presentation, the company has presented its earnings per share excluding expenses incurred with respect to the proposed Nicor merger. As the company does not routinely engage in transactions of the magnitude of the proposed Nicor merger, and consequently does not regularly incur transaction related expenses with correlative size, the company believes presenting EPS excluding Nicor merger expenses provides investors with an additional measure of the company’s core operating performance. EBIT, operating margin and EPS excluding merger expenses should not be considered as alternatives to, or more meaningful indicators of, the company's operating performance than operating income, net income attributable to AGL Resources Inc. or EPS as determined in accordance with GAAP. In addition, the company's EBIT, operating margin and non-GAAP EPS may not be comparable to similarly titled measures of another company. We also present certain non-GAAP financial measures excluding the effects of our proposed merger with Nicor. Because we complete material mergers and acquisitions only occasionally, we believe excluding these effects from certain measures is useful because they allow investors to more easily evaluate and compare the performance of the Company's core businesses from period to period. Reconciliations of non-GAAP financial measures referenced in this presentation are available on the company’s Web site at www.aglresources.com
®

AGL Resources 1H11 Highlights
3
Note: Please review the AGL Resources 10-Q as filed with the SEC on 8/3/11 for detailed information. EBIT, Adjusted Net Income and Adjusted EPS are non-GAAP measures. Please see the appendix to this presentation or visit the investor relations section of www.aglresources.com for a reconciliation to GAAP.(1) Adjusted net income and adjusted EPS exclude Nicor-related merger costs of approximately $11 million, net of tax.
®
in millions, except per share amounts6-mos 2011
6-m
6-mos 2010 Change
Operating Margin 664$ 650$ 2%
Total Operating Expenses 366 349 5%(excluding Cost of Gas)
Operating Income 298 301 (1)%
EBIT 301 303 (1)%
Interest Expense, net 61 54 13%
Income Tax Expense 87 90 (3)%
Net Income Attributable to AGLR 142$ 148$ (4)%
Adj. Net Income Attributable to AGLR1 153$ 148$ 3%
EPS (Diluted) 1.82$ 1.90$ (4)%
Adj. EPS (Diluted)1 1.96$ 1.90$ 3%
Dividend per Share 0.90$ 0.88$ 2%
• 1H11 GAAP EPS of $1.82 per diluted share• Adjusted diluted EPS of $1.96, excluding
approximately $11 million in after-tax costs related to Nicor merger
• Distribution segment EBIT up 6% in 1H11 vs. 1H10• Retail business performance stable• Wholesale performance solid in 1H11, but low
volatility and reduced spreads create challenging market conditions for remainder of year
• 2011 EPS estimate remains $3.10-$3.20 per diluted share, excluding all effects from the proposed merger with Nicor
• Nicor merger process on track• Aside from Illinois Commerce Commission (ICC), all
major regulatory approvals have been received• ICC process ongoing, with proposed order due from
Administrative Law Judge 9/29/11• Long-term financing secured for cash consideration• Expect closing in back half of 2011

4
AGL Resources 2011 Priorities
• Close Nicor transaction in second half of 2011• Develop and implement integration plan
• Continue safe and efficient operations at our distribution businesses• Complete rate case at Virginia Natural Gas
• Seeking $25 million increase; mitigation plan proposes rates to be phased in over three years• VNG customers have not seen an increase in their approved base rates since 1996
• Continue to pursue responsible growth opportunities in retail and wholesale businesses
M&A
Distribution
Retail & Wholesale
Energy Investments
Policy
Expense & Balance Sheet
Discipline
• Increase contracted capacity at Golden Triangle Storage• Work toward completion of Cavern 2 in early 2012
• Effectively control expenses and focus on capital discipline in each of our business segments
• Maintain strong balance sheet and liquidity profile
• Continue to actively manage issues related to energy and environmental policy and regulation
®

5
AGL Consistent EPS and Dividend Growth
$1.40 $1.67
$1.82 $2.01
$2.28 $2.48
$2.72 $2.72 $2.84 $2.88 $3.05
$3.20
$1.08 $1.08 $1.08 $1.11 $1.15 $1.30
$1.48 $1.64 $1.68 $1.72 $1.76 $1.80
77% 65% 59% 55% 50% 52% 54% 60% 59% 60% 59%
Dividend Payout Ratio
Diluted EPS Growth Dividend Growth
2011 EPS Guidance:$3.10-$3.20 per diluted share
Dividend increase of $0.04 approved by Board of Directors for 2011
(1)$3.00 diluted GAAP EPS; $3.05 adjusted, excluding Nicor merger costs. Please see the appendix to this presentation or visit the investor relations section of www.aglresources.com for a reconciliation to GAAP.
(2) Estimate excludes all effects from the proposed merger with Nicor.
$3.10-$3.20
®

$(50)
$-
$50
$100
$150
$200
$250
2Q10 3Q10 4Q10 1Q11 2Q11
Distribution Retail Wholesale Energy Investments
$-
$100
$200
$300
$400
$500
2006 2007 2008 2009 2010 6-mos 2011
Distribution Retail Wholesale Energy Investments
66
AGL EBIT by Operating Segment
Distribution
Retail
Wholesale
Energy Investments
<1%
69%
9%
22%
Annual EBIT by Operating Segment
1H11 EBIT Contribution
NOTE: EBIT is a non-GAAP measure. Please see the appendix to this presentation or the investor relations section of www.aglresources.com for a reconciliation to GAAP.
Quarterly EBIT by Operating Segment
®
mill
ions
mill
ions

Combination of AGL Resources & Nicor Creates a Leading Gas Distribution Business
Note: Map excludes Nicor Tropical Shipping business and Central Valley natural gas storage facility under construction in California.
• Increased scale benefits customers over time
• Best practices shared across distribution territories and retail businesses
• Limited exposure to commodity prices, weather and bad debt expense for the combined company (through cost recovery and other regulatory mechanisms)
• Non-utility storage capabilities significantly increased
88
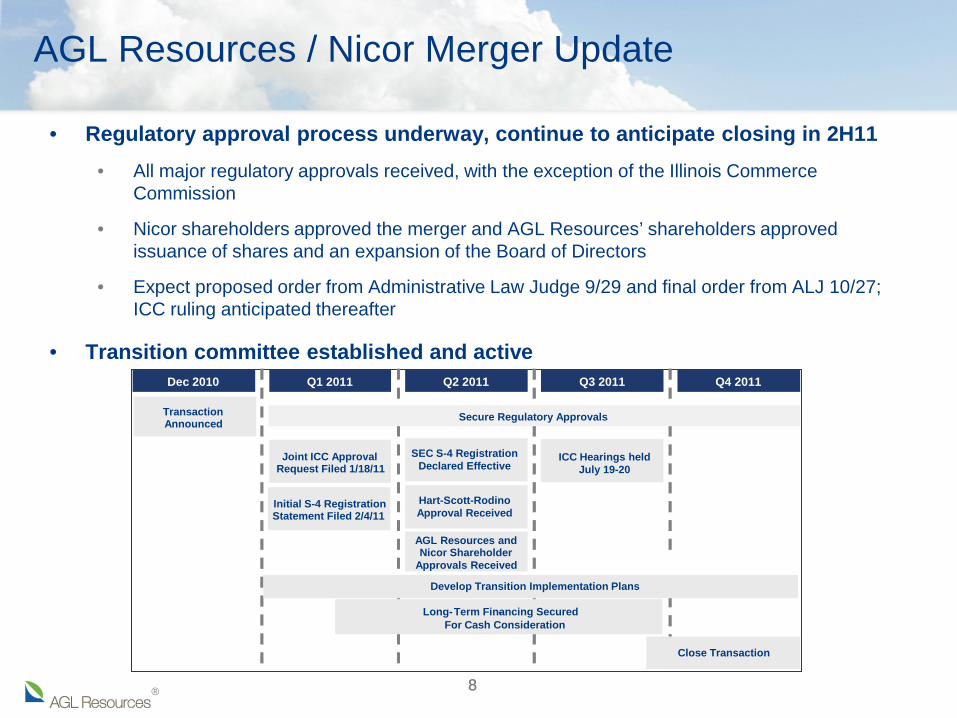
AGL Resources / Nicor Merger Update
• Regulatory approval process underway, continue to anticipate closing in 2H11• All major regulatory approvals received, with the exception of the Illinois Commerce
Commission
• Nicor shareholders approved the merger and AGL Resources’ shareholders approved issuance of shares and an expansion of the Board of Directors
• Expect proposed order from Administrative Law Judge 9/29 and final order from ALJ 10/27; ICC ruling anticipated thereafter
• Transition committee established and activeDec 2010 Q1 2011 Q2 2011 Q3 2011 Q4 2011
Transaction Announced
Joint ICC Approval Request Filed 1/18/11
Secure Regulatory Approvals
AGL Resources and Nicor Shareholder
Approvals Received
Develop Transition Implementation Plans
Close Transaction
Long- -Term Financing SecuredFor Cash Consideration
Initial S-4 Registration Statement Filed 2/4/11
Hart-Scott-Rodino Approval Received
ICC Hearings held July 19-20
SEC S-4 Registration Declared Effective
®

9
AGL Resources 2011 Capital Allocation & EBIT
71%
28%
1%
Distribution Rider & Rate Base Programs Wholesale & Retail Energy Investments/Other
2011 Capital Allocation* 2011 EBIT*
*2011 Capital Allocation based on budgeted amounts; 2011 EBIT based on EBIT projections as detailed in AGL’s 2011 Analyst Day Presentation dated 5/6/11.
Rider programs: 42%Rate base programs: 42%
84%
1%
15%
1010
Utility and Non-Utility Infrastructure Programs
• AGL Resources has robust regulated infrastructure improvement and replacement programs across all of its jurisdictions
• 50% of all distribution capex is under rider or other accelerated recovery programs
• Through 2010, AGL has replaced over 2,800 miles of pipe
• Under existing rider and rate base programs, an additional 250 miles are planned for replacement in 2011, with a further 280 miles planned for 2012 and beyond
• AGL has also spent over $400 million to purchase and/or construct 20 Bcf of non-utility storage facilities in Louisiana and Texas
• Jefferson Island Storage and Hub (JISH) was purchased by AGL in 2004 for $90 million
− Two existing caverns with combined 7 Bcf of storage capacity
− Two additional caverns in the permitting phase, adding 12 Bcf of capacity
• Golden Triangle Storage (GTS) was constructed by AGL and Cavern 1 began commercial service at the end of 2010
− Caverns 1 & 2 have combined storage capacity of 13 Bcf with a construction cost of ~$325 million
− Significant expansion potential if market conditions improve®

AGL Additional Resources
11
Company resources• www.aglresources.com• Sarah Stashak
Director, Investor [email protected]
Industry resources• www.aga.org• www.eia.doe.gov
®

Appendix & GAAP Reconciliations
®

AGL Resources 2Q11 Highlights
• 2Q11 GAAP EPS of $0.23 per diluted share• Adjusted diluted EPS of $0.33, excluding
approximately $8 million in after-tax costs related to Nicor merger
• Distribution segment EBIT up 10% in 2Q11 vs. 2Q10• Continued improvement in wholesale commercial
activity
• 1H11 GAAP EPS of $1.82 per diluted share• Adjusted diluted EPS of $1.96, excluding
approximately $11 million in after-tax costs related to Nicor merger
• 2011 EPS estimate remains $3.10-$3.20 per diluted share, excluding all effects from the proposed merger with Nicor
• Nicor merger process on track
13
Note: Please review the AGL Resources 10-Q as filed with the SEC on 8/3/11 for detailed information. EBIT, Adjusted Net Income and Adjusted EPS are non-GAAP measures. Please see the appendix to this presentation or visit the investor relations section of www.aglresources.com for a reconciliation to GAAP.(1) Adjusted net income and adjusted EPS exclude Nicor-related merger costs of approximately $8 million, net of tax.
®
in millions, except per share amounts 2Q11 2Q10 Change
Operating Margin 241$ 218$ 11%
Total Operating Expenses 181 170 6%(excluding Cost of Gas)
Operating Income 60 48 25%
EBIT 62 48 29%
Interest Expense, net 32 26 23%
Income Tax Expense 11 8 38%
Net Income Attributable to AGLR 18$ 14$ 29%
Adj. Net Income Attributable to AGLR1 26$ 14$ 86%
EPS (Diluted) 0.23$ 0.17$ 35%
Adj. EPS (Diluted)1 0.33$ 0.17$ 94%
Dividend per Share 0.45$ 0.44$ 2%

1414
VNG Rate Case Update
• Virginia Natural Gas filed a rate case with the Virginia State Corporation Commission (VSCC) on February 8, 2011
• Seeking $25 million increase
• Mitigation plan proposes rates to be phased in over three years
• ~$15 million related to Hampton Roads Crossing pipeline construction (completed in 2010), which has been recovered via AFUDC to date
• ~$10 million related to base operating expenses
• Rates effective October 1, 2011, subject to refund
• Final Commission order expected May 2012
Rate Case Filed2/8/11
Testimony 8/23/11-10/11/11
Hearings10/25/11
Hearing Examiner’s
ReportMarch 2012
FinalCommission
OrderMay 2012
Rates Effective
Subject to Refund 10/1/11
®

AGL Detailed Utility Profile as of 12/31/10
15
State
Rate Base
(mm)% of Total
Authorized Return on Rate Base
Est. 2010 Return on Rate Base
Authorized Return on
Equity
Est. 2010 Return on
EquityCustomers
(mm)% of Total Regulatory Attributes
Georgia $1,312 52% 8.10% 7.26% 10.75% 9.10% 1.5 68%Decoupling, Regulatory
Infrastructure Program Rates, M&A Synergy Sharing
New Jersey 435 17% 7.64% 7.87% 10.30% 10.76% 0.3 12%Weather Normalization,
Regulatory Infrastructure Program Rates
Virginia 502 20% 9.24% 8.24% 10.90% 9.62% 0.3 12% Decoupling, Weather Normalization
Florida 164 7% 7.36% 5.04% 11.25% 6.22% 0.1 5% Negotiated Rates Over 5-yr Period
Tennessee 91 4% 7.41% 8.98% 10.05% 13.45% 0.1 3% Revenue Normalization
Total $ 2,504 100% NA NA NA NA 2.3 100%
Note: Please review the AGL Resources 10-K as filed with the SEC on 2/9/11 for detailed information.
®

16
The following table sets forth a reconciliation of AGL Resources’ operating margin to operating income and earnings before interest and taxes (EBIT) to earnings before income taxes and net income to net income attributable to AGL – as reported and net income attributable to AGL – as adjusted, for the three and six months ended June 30, 2011 and 2010.
AGL Resources GAAP Reconciliation
®
In millions 2011 2010 2011 2010Operating revenues $375 $359 $1,253 $1,362Cost of gas (COG) 134 141 589 712Operating margin 241 218 664 650Operating expenses
Operation and maintenance 127 119 258 244Depreciation and amortization 42 39 83 79Taxes other than income 12 12 25 26
Total operating expenses, exc. COG 181 170 366 349Operating Income 60 48 298 301Other income 2 - 3 2EBIT 62 48 301 303Interest expense, net 32 26 61 54Earnings before income taxes 30 22 240 249Income tax expense 11 8 87 90Net income 19 14 153 159
1 - 11 1118 14 142 1488 - 11 -
Net income attributable to AGL - as adjusted $26 $14 $153 $148Impact of Nicor transaction costs, net of tax
Six months ended June 30,
Three months ended June 30,
Less: net income attributable to the noncontrolling interestNet income attributable to AGL - as reported

17
AGL Resources GAAP ReconciliationThe following tables set forth a reconciliation of AGL Resources’ Statement of Income to earnings before interest and taxes (EBIT) by segment for the quarters ended June 30, 2011 and 2010.
®
2Q11
in millionsOperating Revenues 237$ 117$ 9$ 10$ 2$ 375$ Intersegment Revenues 41 - - - (41) - Total Operating Revenues 278 117 9 10 (39) 375
Cost of Gas (COG) 70 100 1 2 (39) 134 Operating Margin 208 17 8 8 - 241 Operating Expenses Operation & Maintenance 89 15 12 3 8 127 Depreciation & Amortization 35 - 1 3 3 42 Taxes Other Than Income 9 1 - 1 1 12
Total Operating Expenses, exc. COG 133 16 13 7 12 181 Operating Income (loss) 75 1 (5) 1 (12) 60 Other income (expense) 1 - - - 1 2 EBIT 76$ 1$ (5)$ 1$ (11)$ 62$
Distribution operations
Retail energy
operationsWholesale services
Energy investments
Corporate and intercompany eliminations
Consolidated AGL
Resources
2Q10
in millionsOperating Revenues 226$ 117$ (8)$ 23$ 1$ 359$ Intersegment Revenues 34 - - - (34) - Total Operating Revenues 260 117 (8) 23 (33) 359
Cost of Gas (COG) 62 99 1 11 (32) 141 Operating Margin 198 18 (9) 12 (1) 218 Operating Expenses Operation & Maintenance 86 17 9 9 (2) 119 Depreciation & Amortization 34 - 1 1 3 39 Taxes Other Than Income 10 - 1 1 - 12
Total Operating Expenses, exc. COG 130 17 11 11 1 170 Operating Income (loss) 68 1 (20) 1 (2) 48 Other income (expense) 1 - - (1) - - EBIT 69$ 1$ (20)$ -$ (2)$ 48$
Distribution operations
Retail energy
operationsWholesale services
Energy investments
Corporate and intercompany eliminations
Consolidated AGL
Resources

18
AGL Resources GAAP ReconciliationThe following tables set forth a reconciliation of AGL Resources’ Statement of Income to earnings before interest and taxes (EBIT) by segment for the six months ended June 30, 2011 and 2010.
®
6-Months Ended 6/30/11
in millionsOperating Revenues 742$ 407$ 62$ 40$ 2$ 1,253$ Intersegment Revenues 79 - - - (79) - Total Operating Revenues 821 407 62 40 (77) 1,253
Cost of Gas (COG) 338 301 4 23 (77) 589 Operating Margin 483 106 58 17 - 664 Operating Expenses Operation & Maintenance 179 35 28 8 8 258 Depreciation & Amortization 71 1 1 5 5 83 Taxes Other Than Income 18 1 1 2 3 25 Total Operating Expenses, exc. COG 268 37 30 15 16 366 Operating Income (loss) 215 69 28 2 (16) 298 Other income 2 - - - 1 3 EBIT 217$ 69$ 28$ 2$ (15)$ 301$
6-Months Ended 6/30/10
in millionsOperating Revenues 754$ 510$ 59$ 37$ 2$ 1,362$ Intersegment Revenues 72 - - - (72) - Total Operating Revenues 826 510 59 37 (70) 1,362
Cost of Gas (COG) 364 396 9 13 (70) 712 Operating Margin 462 114 50 24 - 650 Operating Expenses Operation & Maintenance 173 37 24 15 (5) 244 Depreciation & Amortization 68 1 1 3 6 79 Taxes Other Than Income 19 1 2 2 2 26 Total Operating Expenses, exc. COG 260 39 27 20 3 349 Operating Income (loss) 202 75 23 4 (3) 301 Other income 3 - - (1) - 2 EBIT 205$ 75$ 23$ 3$ (3)$ 303$
Distribution operations
Distribution operations
Retail energy
operationsWholesale services
Energy investments
Corporate and intercompany eliminations
Consolidated AGL Resources
Retail energy
operationsWholesale services
Energy investments
Corporate and intercompany eliminations
Consolidated AGL Resources
19
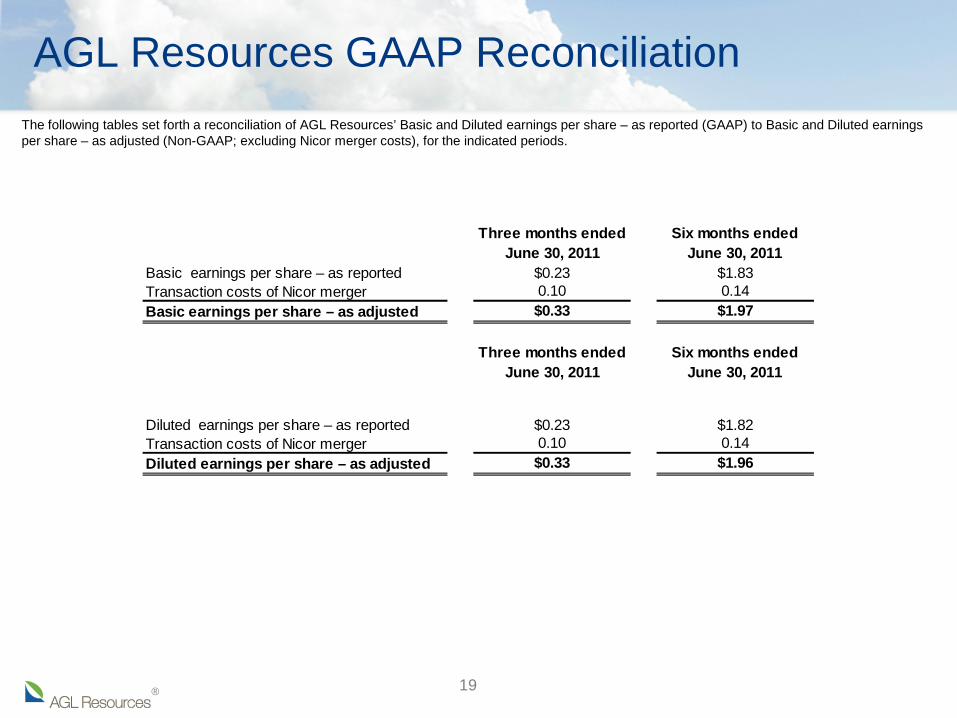
AGL Resources GAAP ReconciliationThe following tables set forth a reconciliation of AGL Resources’ Basic and Diluted earnings per share – as reported (GAAP) to Basic and Diluted earnings per share – as adjusted (Non-GAAP; excluding Nicor merger costs), for the indicated periods.
®
Three months ended June 30, 2011
Six months ended June 30, 2011
$0.23 $1.83 0.10 0.14 $0.33 $1.97
Three months ended June 30, 2011
Six months ended June 30, 2011
$0.23 $1.82 0.10 0.14 $0.33 $1.96
Basic earnings per share – as reported Transaction costs of Nicor merger
Transaction costs of Nicor merger Diluted earnings per share – as adjusted
Basic earnings per share – as adjusted
Diluted earnings per share – as reported

20
AGL Resources GAAP Reconciliation
Reconciliations of operating margin, EBIT by segment and EPS excluding merger expenses are available in our quarterly reports (Form 10-Q) and annual reports (Form 10-K) filed with the Securities and Exchange Commission.
Our management evaluates segment financial performance based on EBIT, which includes the effects of corporate expense allocations. EBIT is a non-GAAP (accounting principles generally accepted in the United States of America) financial measure. Items that are not included in EBIT are financing costs, including debt and interest expense and income taxes. We evaluate each of these items on a consolidated level and believe EBIT is a useful measurement of our performance because it provides information that can be used to evaluate the effectiveness of our businesses from an operational perspective, exclusive of the costs to finance those activities and exclusive of income taxes, neither of which is directly relevant to the efficiency of those operations.
We also use EBIT internally to measure performance against budget and in reports for management and the Board of Directors. Projections of forward-looking EBIT are used in our internal budgeting process, and those projections are used in providing forward-looking business segment EBIT projections to investors. We are unable to reconcile our forward-looking EBIT business segment guidance to GAAP net income, because we do not predict the future impact of unusual items and mark-to-market gains or losses on energy contracts. The impact of these items could be material to our operating results reported in accordance with GAAP.
Operating margin is a non-GAAP measure calculated as revenues minus cost of gas, excluding operation and maintenance expense, depreciation and amortization, taxes other than income taxes, and the gain or loss on the sale of our assets. These items are included in our calculation of operating income. We believe operating margin is a better indicator than operating revenues of the contribution resulting from customer growth, since cost of gas is generally passed directly through to customers.
We present our EPS excluding expenses incurred with respect to the proposed merger with Nicor. As we do not routinely engage in transactions of the magnitude of the proposed Nicor merger, and consequently do not regularly incur transaction related expenses of correlative size, we believe presenting EPS excluding Nicor merger expenses provides investors with an additional measure of our core operating performance.
EBIT, operating margin and EPS excluding merger expenses should not be considered as alternatives to, or more meaningful indicators of, our operating performance than operating income or net income, as determined in accordance with GAAP. In addition, our EBIT, operating margin and non-GAAP EPS may not be comparable to similarly titled measures of another company.
Net income attributable to AGL Resources, as adjusted and Basic and Diluted earnings per share, as adjusted are non-GAAP measures and exclude transaction costs related to the proposed merger with Nicor. We believe these financial measures are useful to investors because they provide an alternative method for assessing the Company’s operating results in a manner that is focused on the performance of the Company’s ongoing operations. The presentation of these financial measures is not meant to be a substitute for financial measures prepared in accordance with GAAP.
®
21
AGL Resources Additional Information
Additional InformationIn connection with the proposed merger, AGL Resources has filed with the SEC a Registration Statement on Form S-4 (Registration No. 333-172084), as amended, which is publicly available, that includes a definitive joint proxy statement of AGL Resources and Nicor that also constitutes a prospectus of AGL Resources. AGL Resources and Nicor mailed the definitive joint proxy statement/prospectus on or about May 10, 2011 to their respective stockholders of record as of April 18, 2011. WE URGE INVESTORS TO READ THE DEFINITIVE JOINT PROXY STATEMENT/PROSPECTUS CAREFULLY, AS WELL AS OTHER DOCUMENTS FILED WITH THE SEC, BECAUSE THEY CONTAIN IMPORTANT INFORMATION ABOUT AGL RESOURCES, NICOR AND THE PROPOSED TRANSACTION. The joint proxy statement/prospectus, as well as other filings containing information about AGL Resources and Nicor, can be obtained free of charge at the website maintained by the SEC at www.sec.gov. You may also obtain these documents, free of charge, from AGL Resources’ website (www.aglresources.com) under the tab Investor Relations/SEC Filings or by directing a request to AGL Resources Inc., P.O. Box 4569, Atlanta, GA, 30302-4569. You may also obtain these documents, free of charge, from Nicor’s website (www.nicor.com) under the tab Investor Information/SEC Filings or by directing a request to Nicor Inc., P.O. Box 3014, Naperville, IL 60566-7014.
The respective directors and executive officers of AGL Resources and Nicor, and other persons, may be deemed to be participants in the solicitation of proxies in respect of the proposed transaction. Information regarding AGL Resources’ directors and executive officers is available in the definitive joint proxy statement/prospectus contained in the above referenced Registration Statement and its definitive proxy statement filed with the SEC by AGL Resources on March 14, 2011, and information regarding Nicor directors and executive officers is available in the definitive joint proxy statement/prospectus contained in the above referenced Registration Statement and its definitive proxy statement filed with the SEC by Nicor on April 19, 2011. These documents can be obtained free of charge from the sources indicated above. Other information regarding the interests of the participants in the proxy solicitation are included in the definitive joint proxy statement/prospectus and other relevant materials filed with the SEC. This communication shall not constitute an offer to sell or the solicitation of an offer to sell or the solicitation of an offer to buy any securities, or a solicitation of any vote or approval, nor shall there be any sale of securities in any jurisdiction in which such offer, solicitation or sale would be unlawful prior to registration or qualification under the securities laws of any such jurisdiction. No offer of securities shall be made except by means of a prospectus meeting the requirements of Section 10 of the Securities Act of 1933, as amended.
®