bangs and meteors from thequietcomet 15p/finlay
TRANSCRIPT
arX
iv:1
510.
0664
5v1
[as
tro-
ph.E
P] 2
2 O
ct 2
015
Bangs and Meteors from the Quiet Comet 15P/Finlay
Quan-Zhi Ye (叶泉志)
Department of Physics and Astronomy, The University of Western Ontario, London,
Ontario N6A 3K7, Canada
Peter G. Brown
Department of Physics and Astronomy, The University of Western Ontario, London,
Ontario N6A 3K7, Canada
Centre for Planetary Science and Exploration, The University of Western Ontario, London,
Ontario N6A 5B8, Canada
Charles Bell
Vicksburg, MS, U.S.A.
Xing Gao (高兴)
No. 1 Senior High School of Urumqi, Urumqi, Xinjiang, China
Martin Masek
Institute of Physics Czech Academy of Sciences, Na Slovance 1999/2, 182 21, Praha, Czech
Republic
and
Man-To Hui (许文韬)
Department of Earth, Planetary and Space Sciences, University of California at Los
Angeles, 595 Charles Young Drive East, Los Angeles, CA 90095-1567, U.S.A.
Received ; accepted
– 2 –
ABSTRACT
Jupiter-family comet 15P/Finlay has been reportedly quiet in activity for over
a century but has harbored two outbursts during its 2014/2015 perihelion pas-
sage. Here we present an analysis of these two outbursts using a set of cometary
observations. The outbursts took place between 2014 Dec. 15.4–16.0 UT and
2015 Jan. 15.5–16.0 UT as constrained by ground-based and spacecraft obser-
vations. We find a characteristic ejection speed of V0 = 300 to 650m · s−1 for
the ejecta of the first outburst and V0 = 550 to 750m · s−1 for that of the second
outburst using a Monte Carlo dust model. The mass of the ejecta is calculated
to be Md = 2 to 3× 10⁵kg for the first outburst and Md = 4 to 5× 10⁵kg for the
second outburst, corresponds to less than 10−7 of the nucleus mass. The specific
energy of the two outbursts is found to be 0.3 to 2× 10⁵J · kg−1. We also revisit
the long-standing puzzle of the non-detection of the hypothetical Finlayid meteor
shower by performing a cued search using the 13-year data from the Canadian
Meteor Orbit Radar, which does not reveal any positives. The Earth will pass
the 2014/2015 outburst ejecta around 2021 Oct. 6 at 22 h UT to Oct. 7 at
1 h UT, with a chance for some significant meteor activity in the radio range,
which may provide further clues to the Finlayid puzzle. A southerly radiant in
the constellation of Ara will favor the observers in the southern tip of Africa.
Subject headings: comets: individual (15P/Finlay), meteorites, meteors, meteoroids.
– 3 –
1. Introduction
Small bodies in the inner solar system are historically classified based on their
appearance. Comet refers to an object with extended appearance and sometimes one or
several tails; while asteroid refers to an object that is much smaller than the major planets
and appears star-like. Classification by orbital dynamics of these bodies shows that the
dynamical characteristics of the two groups of objects differ as well: comets usually possess
highly elliptical, parabolic or hyperbolic orbits, while asteroids usually possess more circular
orbits.
Bodies which deviate from these trends (i.e. comets in asteroidal orbits, or asteorids
in cometary orbits) are of significant interest, as their dynamical evolution and/or physical
properties are apparently exceptional. Although the first such outlier was officially
recognized no later than 1989 (e.g. the case of 95P/(2060) Chiron, c.f. Meech & Belton
1989), most outliers were not found until recently with the commissioning of a number
of near-Earth asteroid searching/follow-up programs. Due to their distinct appearance,
comet-like objects in asteroid-like orbits, or “active asteroids” (Jewitt 2012), are more
straightforward to recognize due to their significant morphological change during the
transition to comet-like state, and so the recognition is usually robust. In contrast,
their counterparts, asteroid-like objects in cometary orbits (ACOs), due to their nature,
are considerably more difficult to identify. From an orbital perspective, ACOs are most
easily interpreted to be comets that have exhausted their volatiles (or have their volatiles
permanently buried by their crusts) so that they appear asteroidal, i.e. they become
“dormant comets”. However, dynamical studies have shown that a significant fraction of
ACOs could be asteroids leaking out from the main-belt that are temporarily residing in
comet-like orbits Tancredi (2014); Fernandez & Sosa (2015), therefore complicating the
effort on disentangle orbital properties from physical properties of these bodies.
– 4 –
One approach to identify dormant comets in the ACO population is to look at comets
at an intermediate state between active comets and dormant comets, sometimes labeled as
comet-asteroid transition objects (CATOs; e.g. Licandro et al. 2007). A handful of such
objects have been suggested, such as 107P/(4015) Wilson-Harrington (Ishiguro et al. 2011),
209P/LINEAR (Ye & Wiegert 2014) and (3552) Don Quixote (Mommert et al. 2014).
However, these objects are usually faint and produce little dust, presenting a challenge for
further investigation of their surface and dust properties.
15P/Finlay, a Jupiter-family comet (JFC), has been reportedly faint and tail-less since
its discovery in 1886 (Kronk 2004, 2008; Kronk & Meyer 2010). The comet has a small
Minimum Orbit Intersection Distance (MOID) of 0.0094 AU to the Earth’s orbit, but has
never been associated with any known meteor shower (Beech et al. 1999). Coupled with
the fact that 15P/Finlay has shown a systematic decrease of maximum brightness at each
perihelion passage in the past century it has been suggested that the comet is approaching
a state of complete dormancy (Kresak & Kresakova 1989).
However, during its current perihelion passage, 15P/Finlay exhibited two outbursts,
each producing a parabolic “shell” around the original coma accompanied by a straight,
freshly-formed “tail” in the anti-sunward direction. This resembles the historic outburst
of 17P/Holmes in 2007 (Buzzi et al. 2007) albeit at a much smaller scale. However, it is
notable that 17P/Holmes’s outbursts took place at a larger heliocentric distance (2.4 AU)
than those of 15P/Finlay (∼ 1.0 AU), therefore the underlying mechanism may not be
necessarily the same although the similarity of their overall appearances is striking.
The outbursts of 15P/Finlay are significant in another context: as an Earth-approaching
comet, the outburst ejecta may find their way to the Earth, creating a meteor outburst.
Previously, numerical simulation by Mikhail Maslov1 has suggested that the material
1http://feraj.narod.ru/Radiants/Predictions/1901-2100eng/Finlayids1901-2100predeng.html,
– 5 –
released in 2014 will have a direct encounter with the Earth in 2021, which may produce a
meteor outburst with Zenith Hourly Rate (ZHR) up to 50. Recent calculation by Mikiya
Sato2 also arrived at similar results. An outburst from the parent comet may result in
a stronger meteor event depending on the ejection velocity and planetary perturbation.
Potential meteor observations allow us to directly sample materials from a dormant comet
candidate without a dedicated space mission, which may help in understanding the comet
itself as well as the dormant comets as a population. In particular, meteor activity from
ACOs can help establish prior periods of activity and constrain the dust production history
of ACOs.
In this work, we present an analysis of the observations of 15P/Finlay taken during the
two 2014/2015 outbursts. The goal is to understand the underlying nature of the outburst
as well as the evolutionary status of the comet. We also examine the yet-to-be-discovered
Finlayid meteor shower and especially the potential 2021 meteor outburst. Non-detection
of the shower places constraints on past dust production history of 15P/Finlay.
2. Observations
2.1. Amalgamation of Outburst Reports
The first outburst of 15P/Finlay took place in the late hours of 2014 Dec. 15, the
timing being constrained by reports from Christopher Wyatt (Walcha, Australia; Dec.
accessed 2015 Jan. 17.
2https://groups.yahoo.com/neo/groups/meteorobs/conversations/messages/44030,
retrieved 2015 Mar. 4.
– 6 –
15.43 UT) and Slooh.com Chile Observatory (La Dehesa, Chile; Dec. 16.04 UT)3. During
the outburst, the comet brightened by about 3 magnitudes and developed a spiky tail. The
tail diluted into the background with the brightness returning to its normal range by Dec.
21–22 (Figure 1a, 2).
The second outburst took place around 2015 Jan. 16.0 UT as noted by Alan
Hale (Cloudcroft, NM) at Jan. 16.07 who noted “very bright, almost star-like central
condensation” that was absent in the earlier observations4. The last negative observation
comes from the Solar Wind ANisotropies all-sky hydrogen Ly-α camera (SWAN) on-board
the Solar and Heliospheric Observatory (SOHO) (Bertaux et al. 1995) around Jan. 15.5
UT5. The outburst was subsequently noted independently by Guo Zheng-Qiang (Shenyang,
China; Jan. 16.43 UT) and Michael Mattiazzo (Swan Hill, Australia; Jan. 16.45 UT)6,
as well as on the SWAN image taken near Jan. 16.5 UT (next to the last non-detection
image). The comet brightened by about 4–5 magnitudes during the second outburst, again
3Wyatt’s observation is accessible through the Comet Observation Database
(COBS), available at http://www.cobs.si; observation from Slooh.com
Chile Observatory was published in the Minor Planet Circular No. 90932
(http://www.minorplanetcenter.net/iau/ECS/MPCArchive/2015/MPC_20150105.pdf).
Both resources were accessed on 2015 Jan. 17.
4https://groups.yahoo.com/neo/groups/comets-ml/conversations/messages/24322,
accessed on 2015 Jul. 17, as well as private communication with Alan Hale.
5http://sohowww.nascom.nasa.gov/data/summary/swan/swan-images.html), ac-
cessed on 2015 Feb. 9.
6Guo’s observation was posted on http://www.astronomy.com.cn/bbs/thread-305185-1-1.html
(in Chinese), Mattiazzo’s report was posted on his Facebook page. Both resources were
accessed on 2015 Jan. 17.
– 7 –
with a freshly-formed tail. The brightness returned to the normal range around Jan. 20
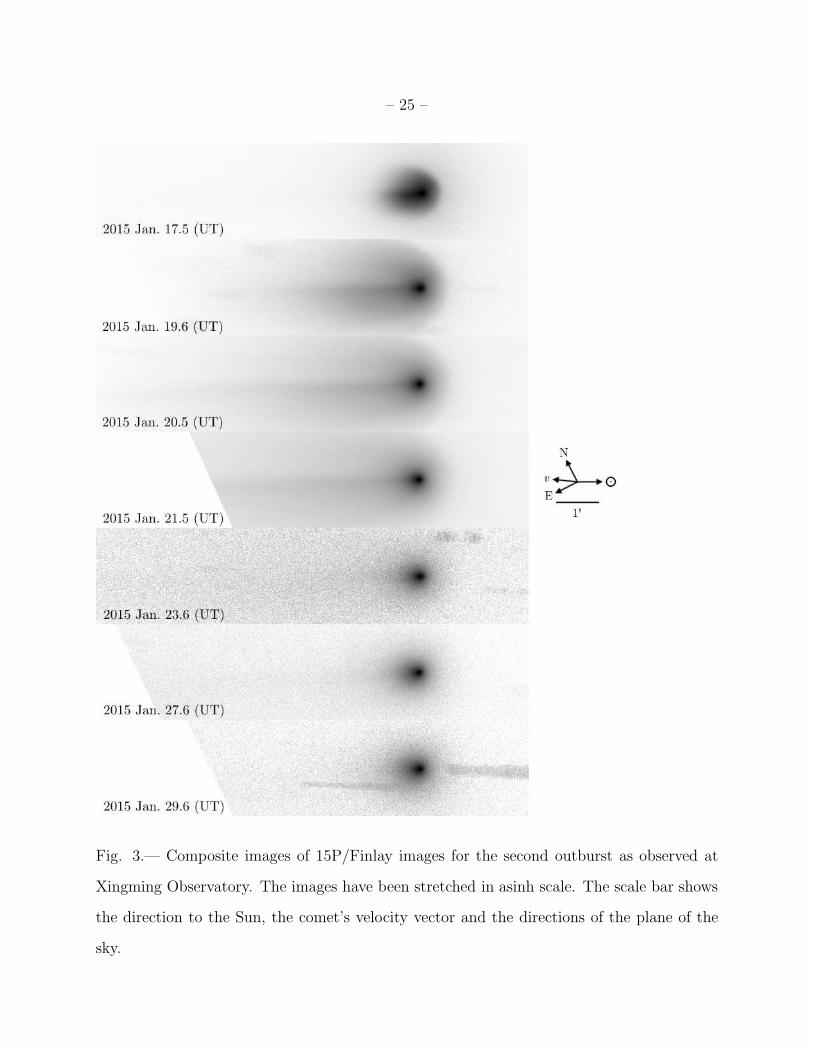
(Figure 1b), but the tail lingered for a few more days until around Jan. 30 (Figure 3).
2.2. Observation and Image Process
After receiving the reports of the outbursts, 15P/Finlay was monitored using the
facilities at F(/Ph)otometric Robotic Atmospheric Monitor (FRAM) located at Pierre
Auger Observatory (Argentina), Xingming Observatory (China) and Vicksburg (U.S.). The
FRAM observations were conducted with a 0.3-m f/6.6 telescope equipped with a Kodak
KAF-1603ME sensor, which gives a resolution of 0.93′′; the Xingming observations were
conducted with a 0.35-m f/6.9 telescope with a Kodak KAF-8300 sensor, images are binned
by 2, which gives a resolution of 1.2′′. The Vicksburg observations were conducted with a
0.3-m f/10 telescope equipped with Kodak KAF-1600 sensor which gives a resolution of
1.87′′.
The observations at FRAM and Vicksburg are intended for dust modeling, as such
they were conducted with a Cousins R filter that blocks flux from major cometary gaseous
emissions (such as CN, C2, C3). The Xingming observations were conducted with wider
temporal coverage but without a filter, intended as a continuous monitor of the development
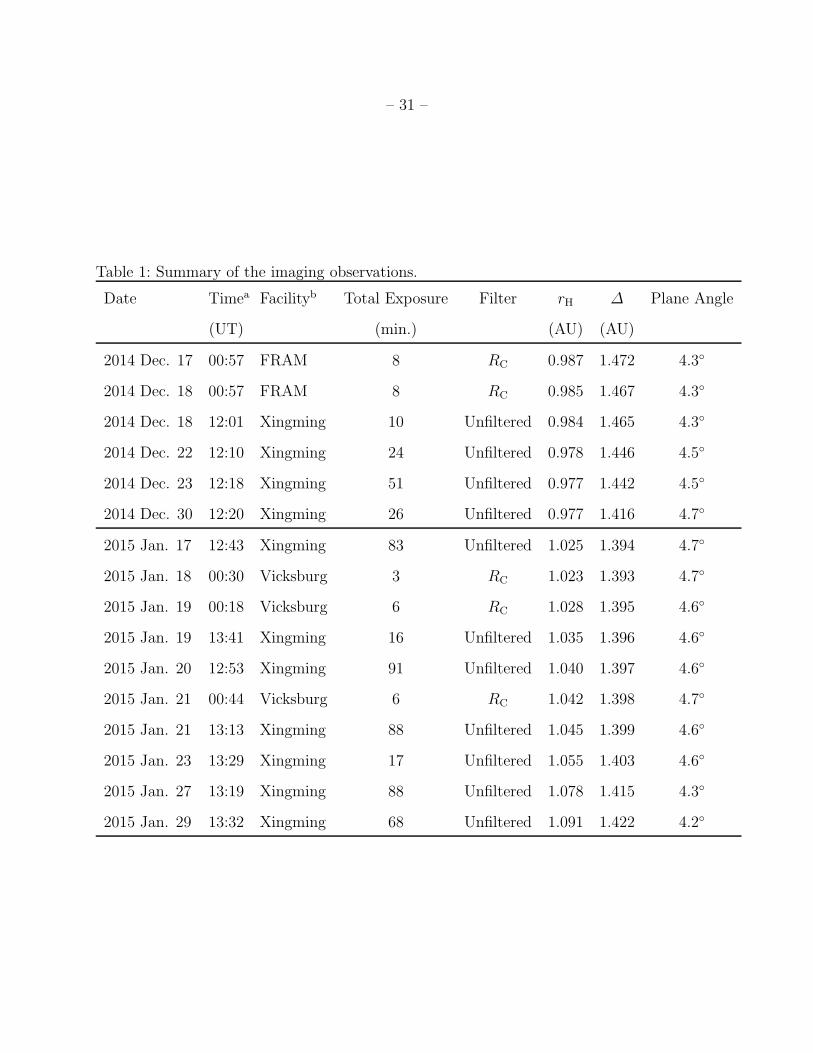
of the outburst. Details of the observations are summarized in Table 1. The images are
processed using standard procedure (bias subtraction, dark subtraction, flat division), with
plate constants solved using UCAC 4 catalog (Zacharias et al. 2013). The images are then
medianly combined following the motion of the comet.
The composite images from FRAM and Vicksburg are collapsed into a 1-dimensional
profile. This is necessary as the considerable irregularities of the near-nucleus dust (i.e.
localized jets) complicate the modeling work. The orbital plane angle at the two outbursts
– 8 –
were also shallow enough (∼ 4) to minimize the information loss during the image collapse.
The 1-dimensional profile is simply derived from averaging a 2′ wide strip along the
Sun-comet axis, with the width of 2′ corresponding to the maximum width of the tail.
3. Analysis
3.1. General Morphology and Evolution of the Outbursts
The composite images from the monitoring observations at Xingming (Figure 2
and 3) show that the morphologies and evolution of both outbursts are comparable: both
outbursts produced a newly-formed dust shell that is slightly asymmetric with respect to
the comet-Sun axis; the dust shell expands as time goes by and fades into the background
within ∼ 1 week.
We perform aperture photometry with the Xingming data. This is motivated by
the considerable scatter shown on the magnitudes provided by the Minor Planet Center
(MPC)7, possibly due to different instrumental and measurement settings adopted by
different observers. Data from FRAM and Vicksburg is not used at this stage to avoid
the complication due to instrumental differences. We use an aperture of ρ = 5000 km
as projected at the distance of the comet centered at the nucleus. Both 0.35-m and
MPC magnitudes are reduced to “normalized” magnitudes at rH = ∆ = 1 AU using
MN = mN − 5 log∆− 2.5n log rH, where MN and mN are normalized and observed nuclear
magnitudes, rH and ∆ are heliocentric and geocentric distances in AU, and n = 4 is
the canonical brightening rate exponent (Everhart 1967). The photometric calibration is
performed using the V-band data from the AAVSO All-Sky Photometric Survey (APASS)
7Available from the MPCObservations Database, http://www.minorplanetcenter.net/db_search,
retrieved 2015 Feb. 3.
– 9 –
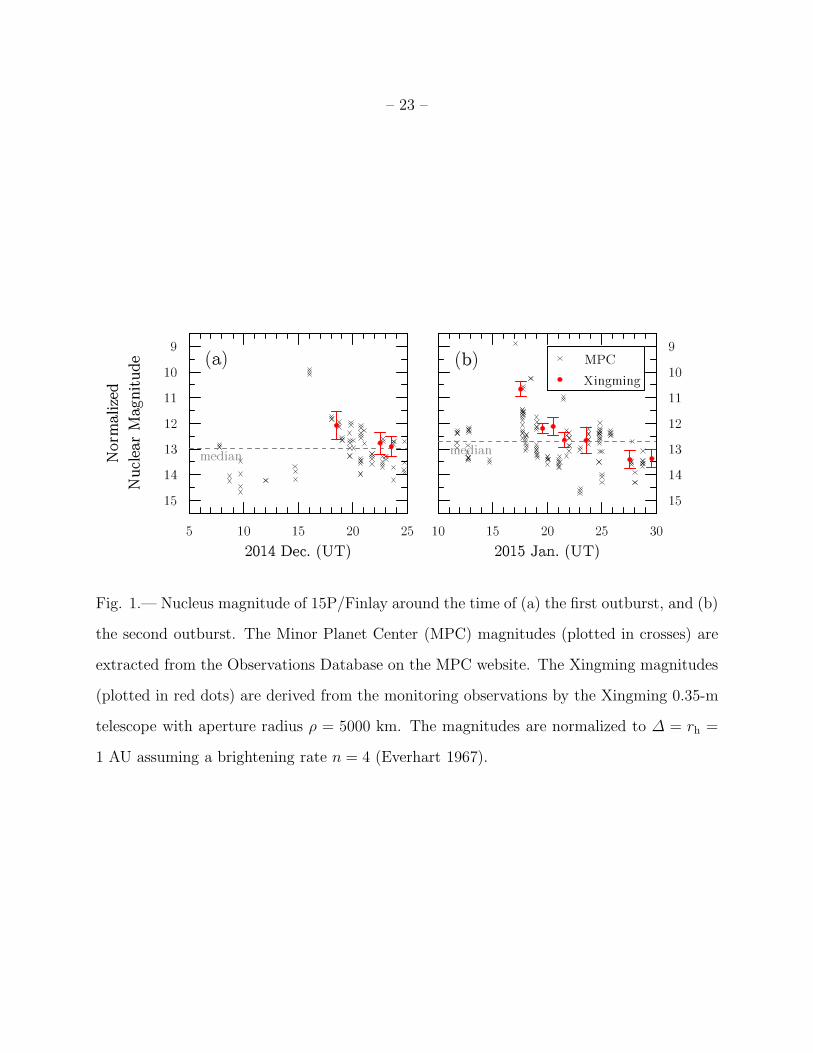
catalog (Henden et al. 2012) as the Xingming system is most sensitive at V-band. As
shown in Figure 1, the characteristic outburst decay time (i.e. the time elapsed from the
peak of the outburst to the point that the brightness reaches 1/e of the peak brightness) is
estimated to be at the order of 1 d.
3.2. Dust Model and Kinematics of the Ejecta
To understand the dust produced by the outburst event, we model the observations
using a Monte Carlo dust model developed in our earlier works (e.g. Ye & Hui 2014;
Ye et al. 2016).
The dynamical evolution of the cometary dust is controlled by the ratio between
radiation pressure and solar gravity, βrp = 5.7 × 10⁻⁴/(ρdad), where ρd is the bulk density
of the dust and ad the diameter of the dust, both in SI units (Wyatt & Whipple 1950), as
well as the initial ejection velocity of the dust. The latter is defined as
vej = V0β1/2rp · ν (1)
where V0 is the mean ejection speed of a dust particle of βrp = 1 and ν follows a Gaussian
probability density function:
P (ν) = N (1, σ2ν) (2)
where σν is the standard deviation of ν, used to account for the physical spread ν due
to the shape of the dusts. In this work we use σν = 0.3 following exploration by, e.g.
Ishiguro et al. (2014); Jewitt et al. (2014) and Ye et al. (2016).
We assume the dust size follows a simple power-law with a differential size index of q,
– 10 –
and the that observed flux is solely contributed by scattered light from the dust particles.
Hence, the dust production rate is expressed as
N(rH, ad)dad = N0
(
ad1 µm
)−q
dad (3)
where N0 is the mean dust production rate of 1 µm particles.
Simulated particles are symmetrically released from the nucleus. For both outbursts,
two possible outburst epochs are tested, each correspond to either the epochs of the last
negative (non-outburst) report or the first positive report. For the first outburst, outburst
epochs of 2014 Dec. 15.4 UT (as indicated by Wyatt’s negative report) and 16.0 UT
(indicated by Slooh.com’s positive report) are tested; for the second outburst, outburst
epochs of 2015 Jan. 15.5 UT (indicated by SOHO/SWAN’s negative report) and 16.0 UT
(indicated by Hale’s positive report) are tested. The production rate peaks at the outburst
epoch and decays exponentially at a characteristic time of 1 d as discussed in § 3.1.
The size distribution is set to the interval of βrp,max = 1 to an upper size limit
constrained by the escape speed vesc =√
2GMN/RG where MN = 43πR3
NρN is the total mass
of the nucleus, ρN = 500 kg ·m−3 the bulk density of the nucleus, RN = 0.92 km the effective
nucleus radius (Fernandez et al. 2013), and RG = 10RN the characteristic distance that gas
drag become negligible (Gombosi et al. 1986). We only consider βrp,max = 1 as (1) optical
observations are most sensitive to βrp ∼ 1 (micron-sized) particles; (2) larger particles
stay closer to the nucleus (as gravitational force dominates), models with βrp,max ≪ 1 are
incompatible with the observations as they are not able to reproduce the obscured extended
dust tails; and (3) complications arise for the dynamics of βrp,max ≫ 1 (submicron-sized)
particles as there are also subjected to Lorentz forces.
We use the MERCURY6 package (Chambers 1999) to integrate particles from the
– 11 –
start epoch (i.e. the outburst epoch) to the observation epoch, using the 15th order
RADAU integrator (Everhart 1985). To accommodate the uncertainty in the exact epoch
of the outburst, multiple outburst epochs, cued by the reports discussed in § 2.1, are
tested in the simulation. The production of simulated particles peaks at the assumed
outburst epoch and decays exponentially afterwards, with a characteristic decay time of
1 d as found earlier in § 3.1. Gravitational perturbations from the eight major planets
(the Earth-Moon system is represented by a single mass at the barycenter of the two
bodies), radiation pressure and Poynting-Robertson effect are included in the integration.
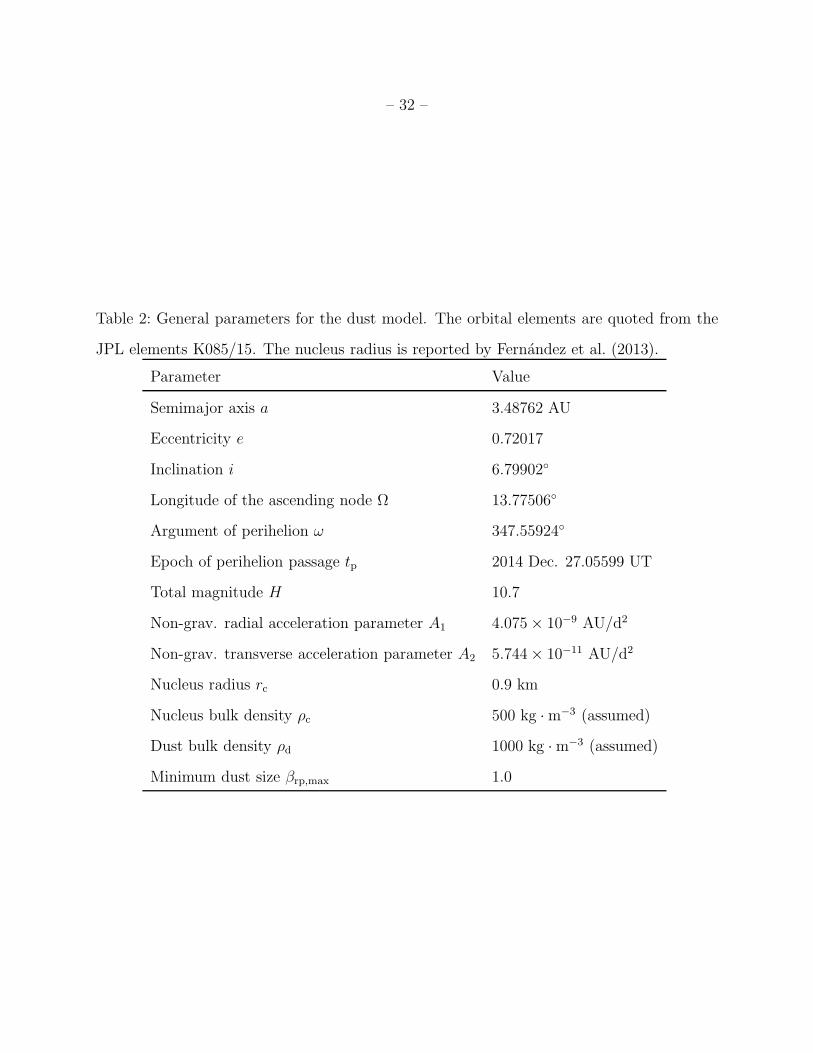
15P/Finlay’s orbital elements are extracted from the JPL small body database elements
K085/15 (http://ssd.jpl.nasa.gov/sbdb.cgi) as listed in Table 2.
The resulting modeled image is convolved with a 2-dimensional Gaussian function
(with FWHM equal to the FWHM of the actual images) to mimic observational effects
such as the instrumental point spread effect and atmospheric seeing. The modeled image is
then collapsed into a 1-dimensional profile as what was done with the observations (§ 2.2).
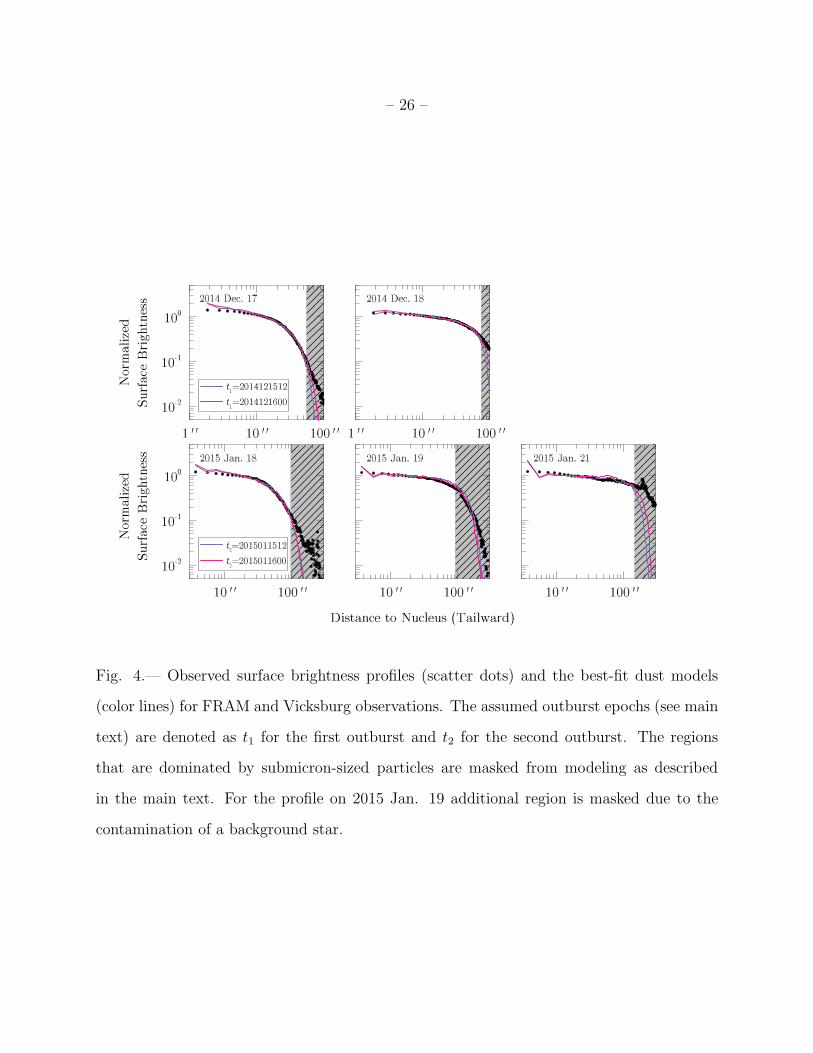
Observed and modeled surface brightness profiles are normalized to 3 FWHMs beyond
the nucleus along the Sun-comet axis. We mask out the region within 1 FWHM from the
nucleus to avoid contamination of the signal from the nucleus. The region that is dominated
by submicron-sized dust (i.e. the tailward region that is too far from the nucleus for > 1 µm
dust to reach) is also masked, as we are focused on µm to mm-sized dust. To evaluate
the degree of similarity between the observed and the modeled profiles, we calculate the
normalized error variance (NEV) as defined by
NEV =1
n
n∑
i=1
√
(Mi −Oi)2
Oi
(4)
where n is the number of pixels, Mi and Oi are the pixel brightness from the modeled and
observed brightness profile respectively. We set the tolerance level of NEV to 10%. The
– 12 –
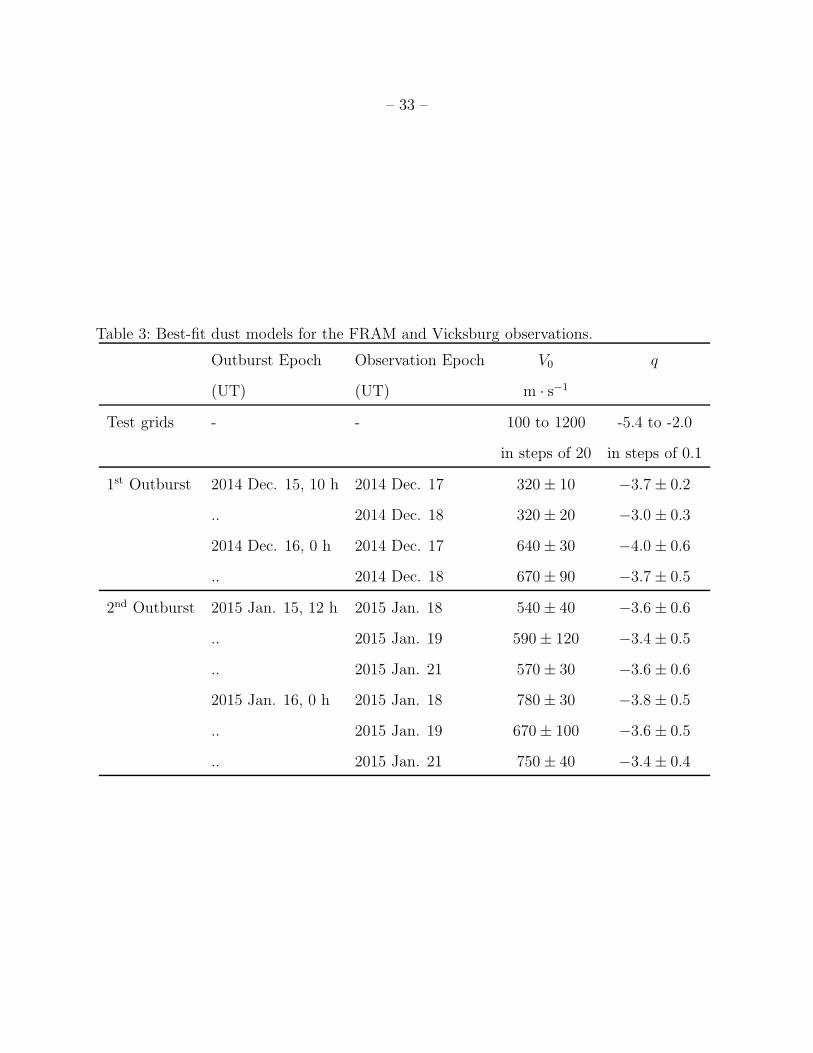
input parameters, test grids and best-fit results are tabulated in Table 2, 3 and Figure 4.
It is encouraging that the best-fit models under the respective outburst epochs are
largely consistent. We conclude that the characteristic ejection speed V0 = 300 to 650 m · s−1
for the ejecta of the first outburst, while V0 = 550 to 750 m · s−1 for the ejecta of the second
outburst. The dust size index is at the range of q ≈ −3.5. The ejection speed is comparable
or is slightly larger than the one derived from the classic Whipple (1950) model (which
gives V0 ∼ 400 m · s−1 in our model), while the size index is comparable to the classic value,
q = −3.6 (Fulle 2004). It also appears that the characteristic ejection speed of the second
outburst is higher than that of the first outburst, which seemingly support the idea that
the second outburst was a more energetic event than the first one.
4. Discussion
4.1. Nature of the Outburst
The total mass of the dust emitted in the two outbursts are related to the effective
scattering cross-section of the materials, Ce, that can be calculated by
Ce =( rH1 AU
)2 π∆2
Aλ(α)100.4(m⊙,λ−mλ) (5)
where Aλ(α), the phase angle corrected geometric albedo, is calculated using the compound
Henyey-Greenstein model by Marcus (2007), assuming Aλ(0) = 0.05, and m⊙,λ, mλ are the
apparent magnitudes of the Sun and the comet. This yields Ce = 7 × 10³ km2 for the first
outburst and Ce = 2×10⁴ km2 for the second outburst, using the photometric measurements
in Figure 1. The total mass of the ejecta can then be calculated via Md = 43ρdadCe, where
the mean dust size ad can be derived from the dust model discussed in § 3.2. Considering
– 13 –
the variances among the best-fit models, we derive Md = 2 to 3 × 10⁵ kg for the first
outburst and Md = 4 to 5× 10⁵ kg for the second outburst (depending on the exact timing
of the individual outburst), corresponding to less than 10−7 of the nucleus mass assuming a
spherical nucleus.
With this mass, the specific energy of the two outbursts is calculated to be
0.3 to 2 × 10⁵ J · kg−1 using the speed component derived from the dust model. This
value is comparable to the value derived for 17P/Holmes’s 2007 outburst (∼ 105 J · kg−1,
c.f. Reach et al. 2010; Li et al. 2011). For the case of 17P/Holmes, the large distance to
the Sun at the time of its outburst, as well as the closeness of the derived specific energy
to the specific energy of the amorphous ice to crystalline, are compatible with the idea
that the comet’s mega-outburst was triggered by the nergy released by the crystallization
of amorphous ice. However, 15P/Finlay was much closer to the Sun at its two outbursts
than 17P/Holmes at its 2007 outburst (1.0 AU versus 2.5 AU) such that solar heat may be
sufficient to drive the outburst to some degree, hence we consider it difficult to assess the
role of crystallization for 15P/Finlay’s outburst at this stage.
4.2. The Finlayid Puzzle Revisited
15P/Finlay is puzzling in the sense that despite its occasional proximity to the Earth’s
orbit, the hypothetical Finlayid meteor shower has never been observed. This matter has
been discussed in depth by Beech et al. (1999), who concluded that the perturbation of
Jupiter has effectively dispersed the meteoroid stream, such that & 99% of the meteoroids
released ∼ 20 orbits ago would end up with distant nodal passages (> 0.01 AU) from the
Earth’s orbit. However, we think that this conclusion is unconvincing as the nodal plane
approximation for Earth impact may not be valid for 15P/Finlay due to its shallow orbital
plane (i = 6.8). Additionally, new astrometric observations of 15P/Finlay in the last
– 14 –
decade has reduced the uncertainty of the orbital elements by an order of magnitude; hence
the issue of the long term evolution of the Finlayid meteoroid stream is worth revisiting.
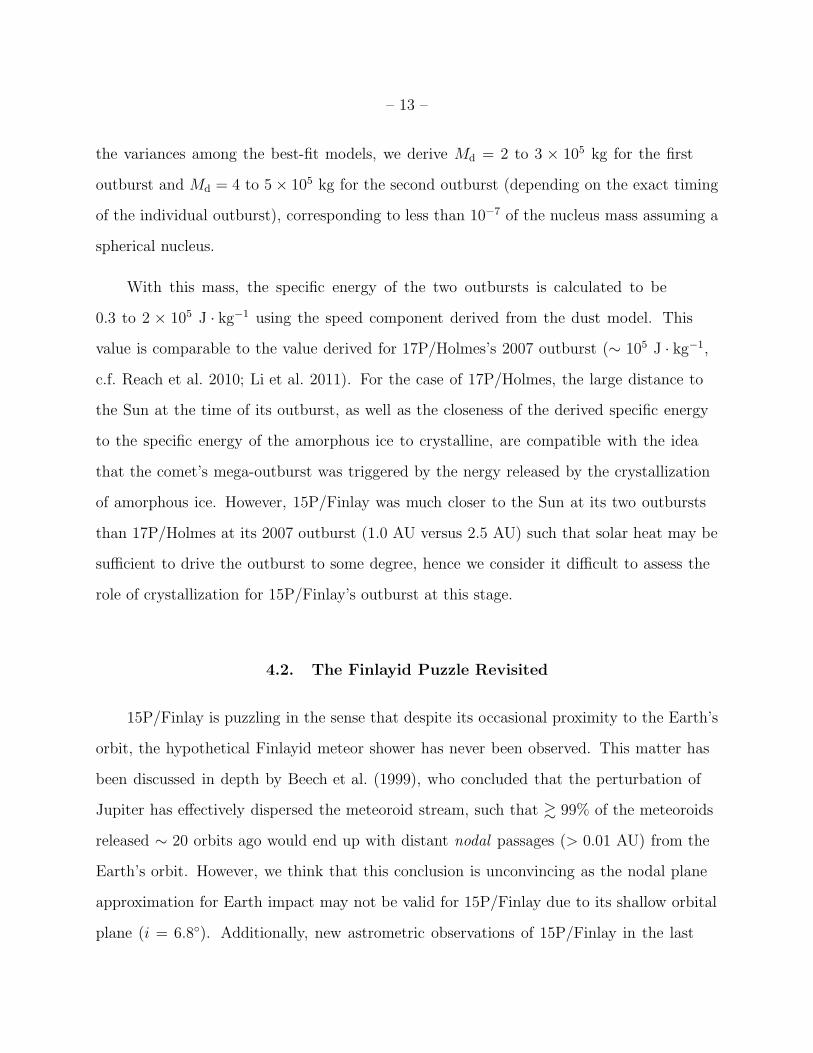
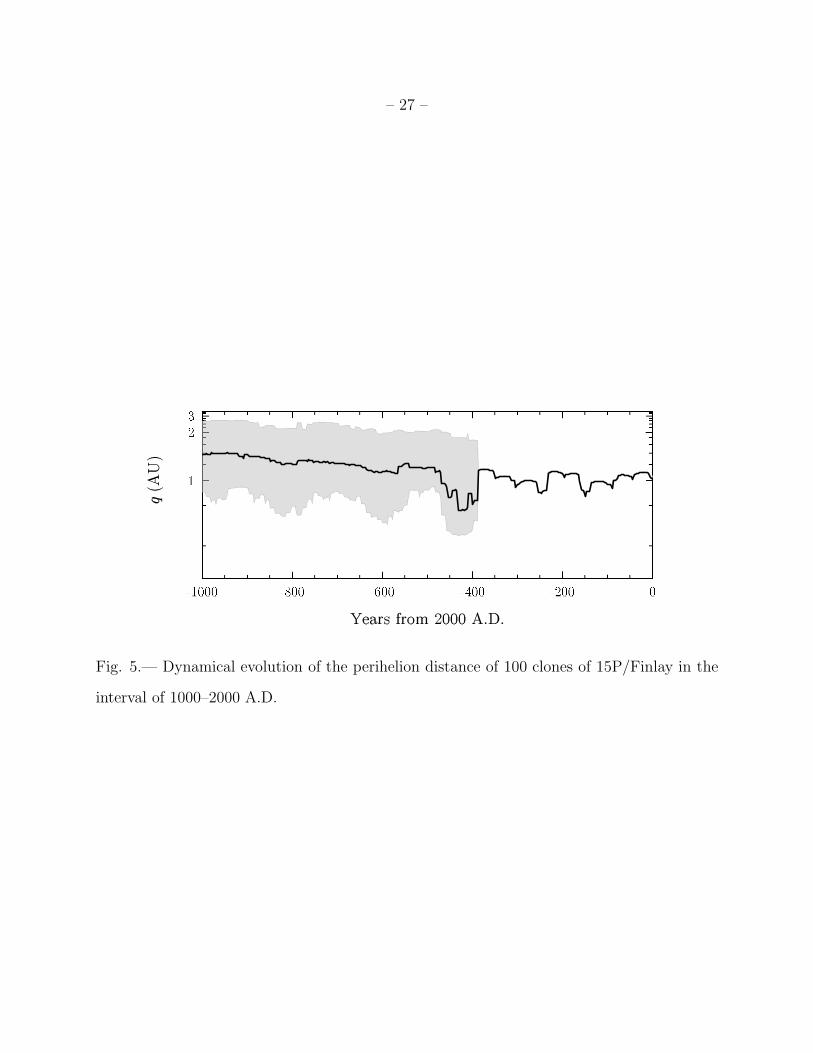
We first investigate the orbital stability of 15P/Finlay. This is done by generating
100 clones of 15P/Finlay using the orbital covariance matrix provided in JPL K085/15, and
integrating all of them 103 yr backwards. The integration is performed with MERCURY6
using the Bulirsch-Stoer integrator. The evolution of the perihelion distance of all clones
is shown in Figure 5. It can be seen that the perihelion distance of the clones are highly
compact until 1613 A.D., when a close encounter (miss distance of the order of 0.1 AU)
between 15P/Finlay and Jupiter occurred. This implies that any backward meteoroid
stream simulation will be physically meaningful only as long as the starting date is after
1613 AD.
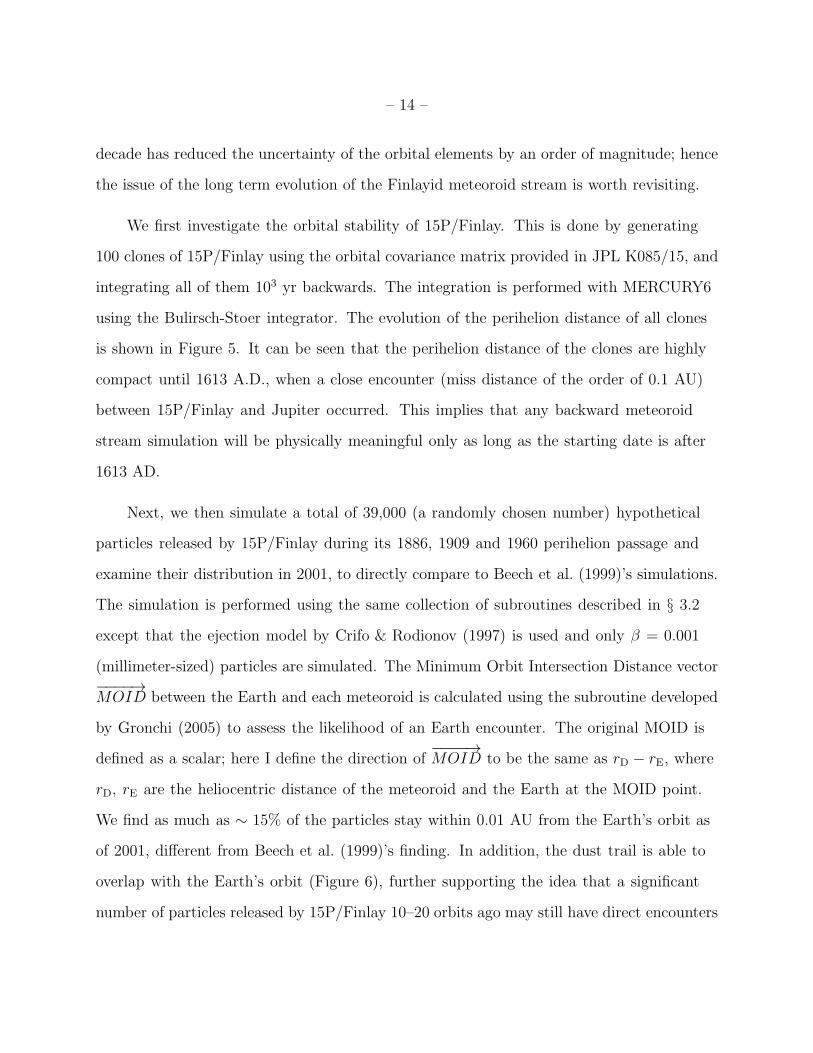
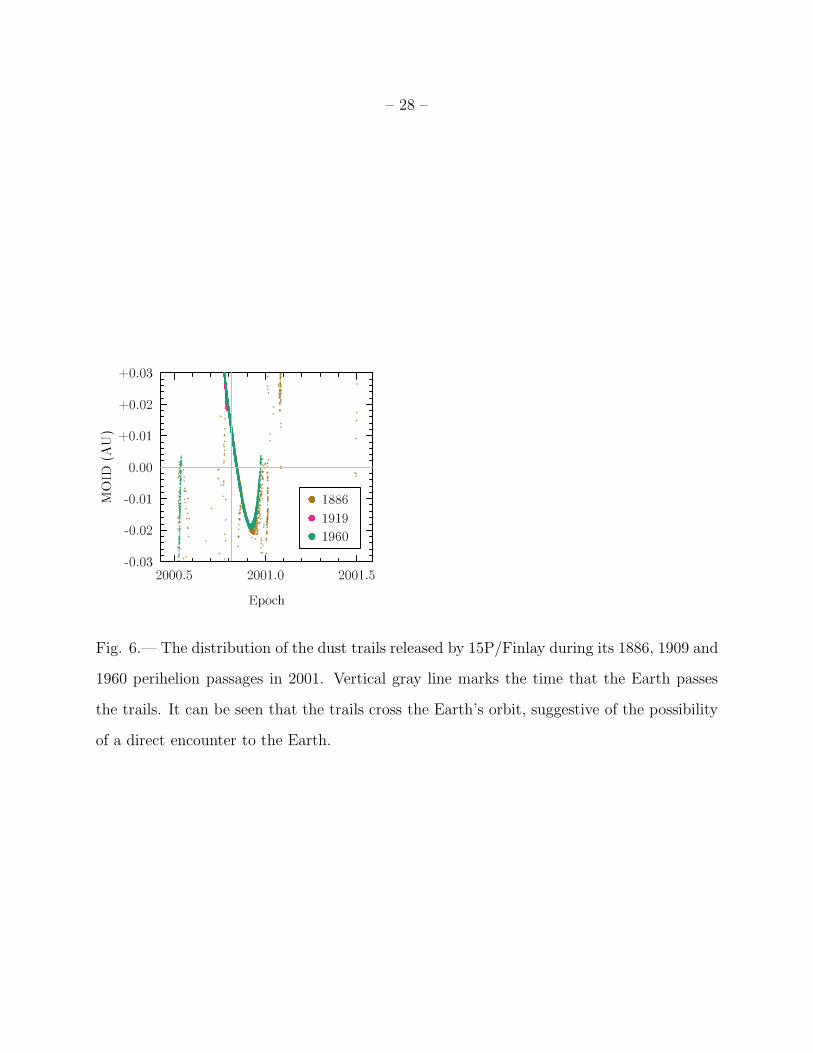
Next, we then simulate a total of 39,000 (a randomly chosen number) hypothetical
particles released by 15P/Finlay during its 1886, 1909 and 1960 perihelion passage and
examine their distribution in 2001, to directly compare to Beech et al. (1999)’s simulations.
The simulation is performed using the same collection of subroutines described in § 3.2
except that the ejection model by Crifo & Rodionov (1997) is used and only β = 0.001
(millimeter-sized) particles are simulated. The Minimum Orbit Intersection Distance vector−−−−→MOID between the Earth and each meteoroid is calculated using the subroutine developed
by Gronchi (2005) to assess the likelihood of an Earth encounter. The original MOID is
defined as a scalar; here I define the direction of−−−−→MOID to be the same as rD − rE, where
rD, rE are the heliocentric distance of the meteoroid and the Earth at the MOID point.
We find as much as ∼ 15% of the particles stay within 0.01 AU from the Earth’s orbit as
of 2001, different from Beech et al. (1999)’s finding. In addition, the dust trail is able to
overlap with the Earth’s orbit (Figure 6), further supporting the idea that a significant
number of particles released by 15P/Finlay 10–20 orbits ago may still have direct encounters
– 15 –
with the Earth.
The background meteoroid flux originating from 15P/Finlay may be estimated in an
order-of-magnitude manner. The absolute magnitude of 15P/Finlay is ∼ 100 times brighter
than low-activity comet 209P/LINEAR for which the meteoroid production capacity has
been measured to be 1014 meteoroids per orbit (Ye et al. 2016). Hence, in 10 orbits,
15P/Finlay would generate 1017 meteoroids. Assuming the meteoroids distribute uniformly
along the orbit with an orbital period of 5 yr, as well as a delivery efficiency of 10% to the
region ±0.01 AU from the Earth’s orbit and a characteristic duration of meteor activity of
1 week, the flux can be calculate by 1017 × 10%× 7 d/5 yr ≈ 0.1 km−2 · hr−1, which should
be detectable by modern meteor survey systems.
To look for any undetected Finlayid activity, we conduct a “cued” search in the
Canadian Meteor Orbit Radar (CMOR) database. CMOR is an interferometric radar array
located near London, Canada operating at 29.85 MHz with a pulse repetition frequency
of 532 Hz (c.f. Jones et al. 2005; Brown et al. 2008; Ye et al. 2013). Since its commission
in 2002, CMOR has measured 12 million meteoroid orbits, making it suitable for the
search for weak meteor showers such as the Finlayids. We first calculate the characteristics
of the hypothetical Finlayid radiant using the simulation results above, which yields
λ− λ⊙ = 66 ± 11, β = −18 ± 9 at Sun-centered ecliptic coordinates, and a geocentric
speed of 13± 3 km · s−1. We then combine 14 years of CMOR data into a stacked “virtual”
year and look for any enhanced activity at the location of the theoretical radiant, using
a wavelet-based search algorithm (Brown et al. 2008, 2010) with probe sizes tuned to
the expected radiant characteristics (radiant probe size σrad = 10, velocity probe size
σv = 3 km · s−1).
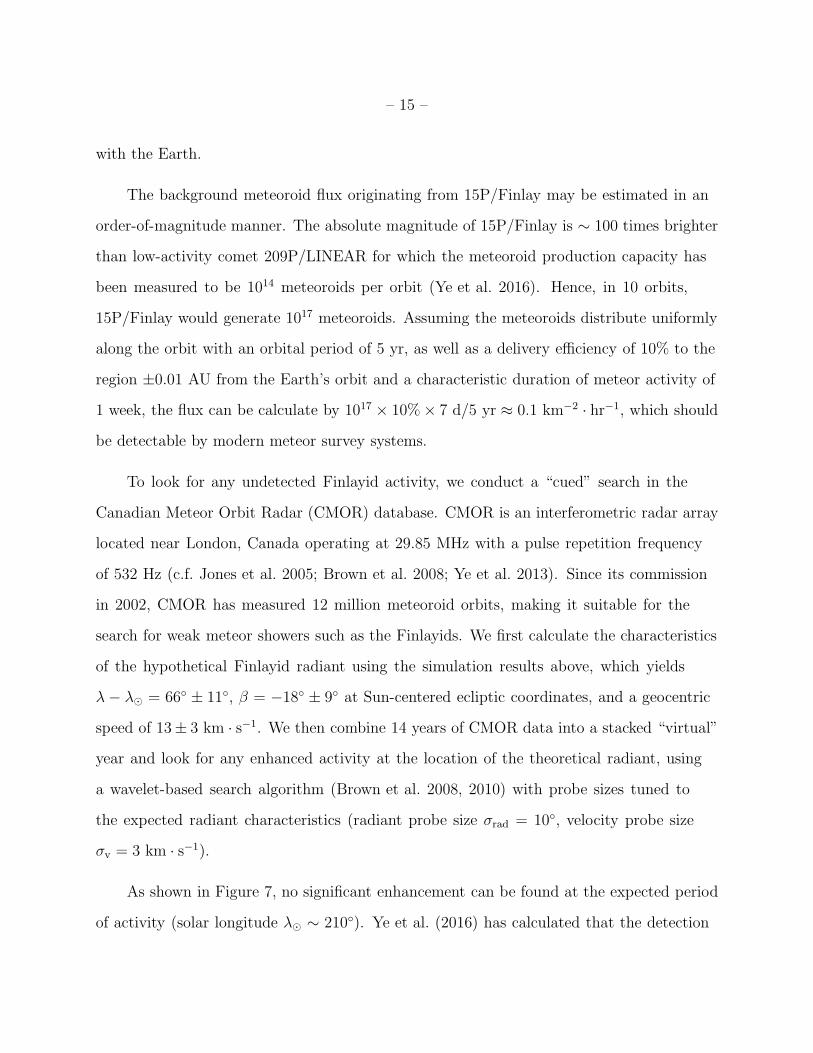
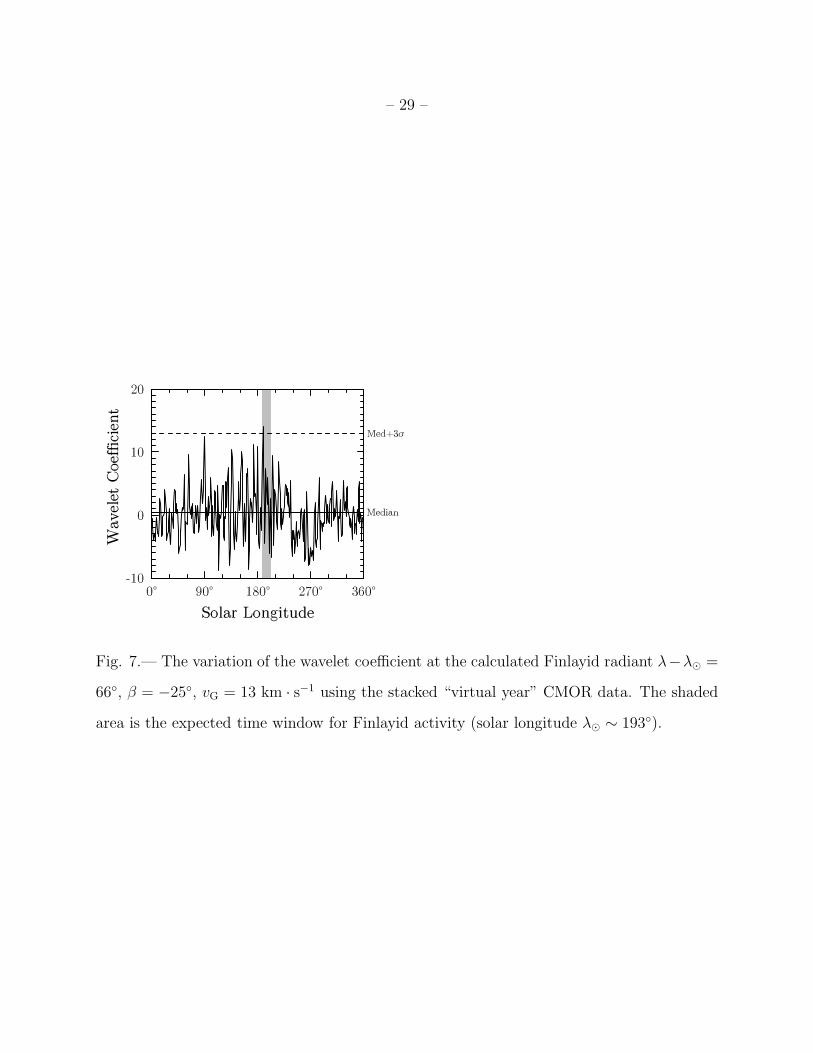
As shown in Figure 7, no significant enhancement can be found at the expected period
of activity (solar longitude λ⊙ ∼ 210). Ye et al. (2016) has calculated that the detection
– 16 –
limit for the wavelet algorithm applied on CMOR is at the order of 0.01 km−2 · hr−1;
however, CMOR sensitivity is also an order of magnitude less at a southerly radiant at
δ = −40 comparing to northerly radiants, so the shower flux limit is probably closer
to 0.1 km−2 · hr−1. Hence, the existence and intensity (or derived upper-limit) of the
Finlayid meteor shower is not definitive, but favors southern hemisphere meteor surveys
(e.g. Younger et al. 2012; Janches et al. 2013).
4.3. The 2021 Earth Encounter of the 2014/2015 Outburst Ejecta
The potential 2021 encounter with the 2014 trail from 15P/Finlay is of particular
interest given the additional dust released from the two outbursts, as it offers an
excellent opportunity to examine 15P/Finlay’s ejecta. The encounter is studied by simply
extending the numerical integration described in § 3.2 to the year of 2021. Similar to the
meteoroid trail model presented in Ye et al. (2016), we assigned a space criterion to select
Earth-approaching meteoroids, defined by
∆X = vrel ×∆T (6)
where vrel is the relative velocity between the meteoroid and the Earth and ∆T and
δT is called the time criterion that is the characteristic duration of the event, typically
∆T = 1 d. Similar to the dust model discussed in § 3.2, we test two sets of outburst epochs
that correspond to either the epochs of the last non-outburst report or the first positive
report.
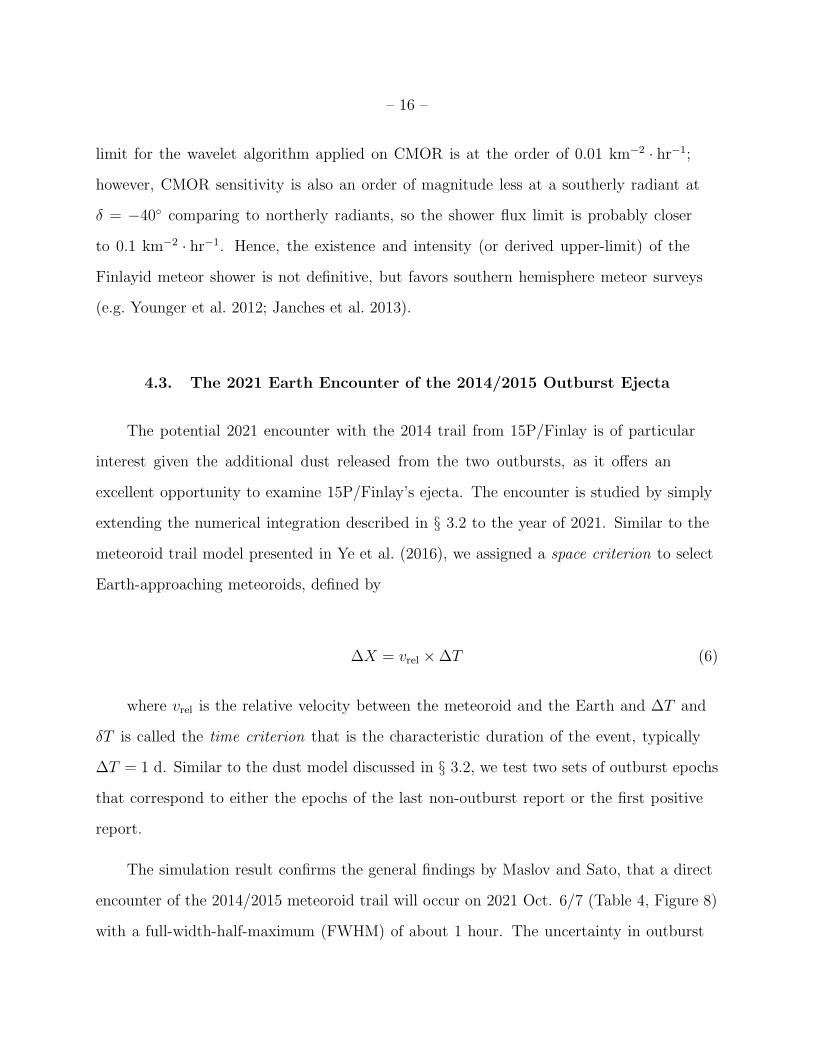
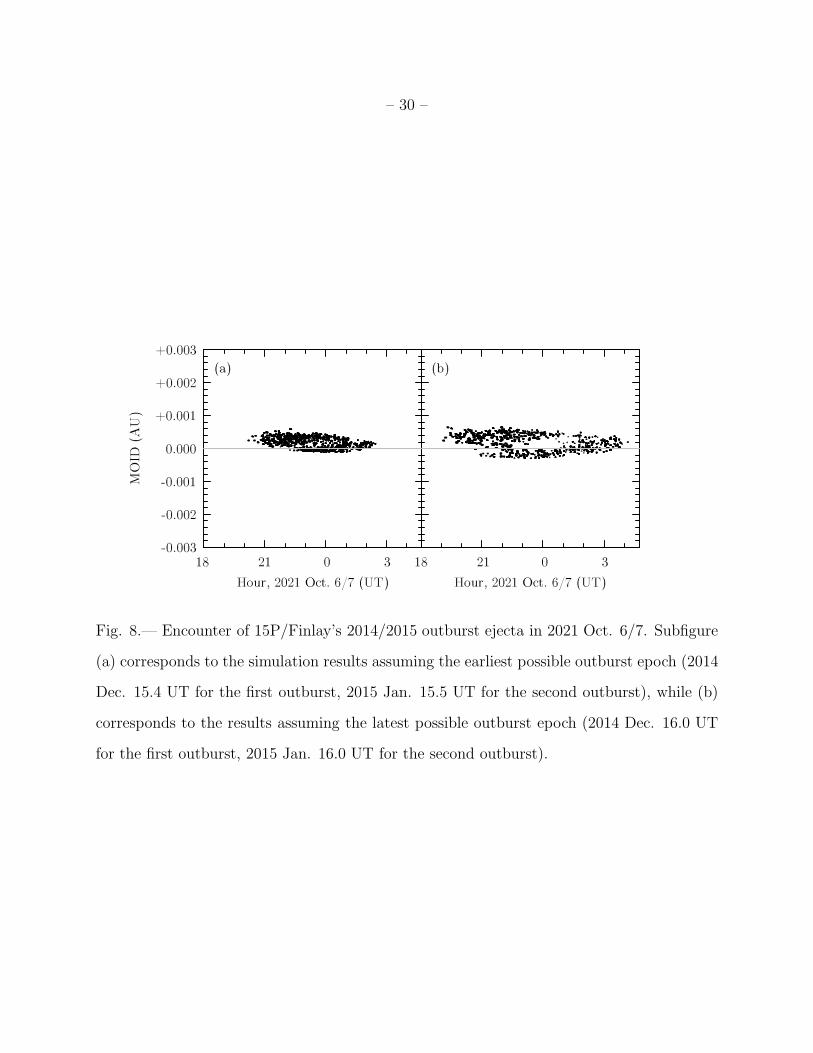
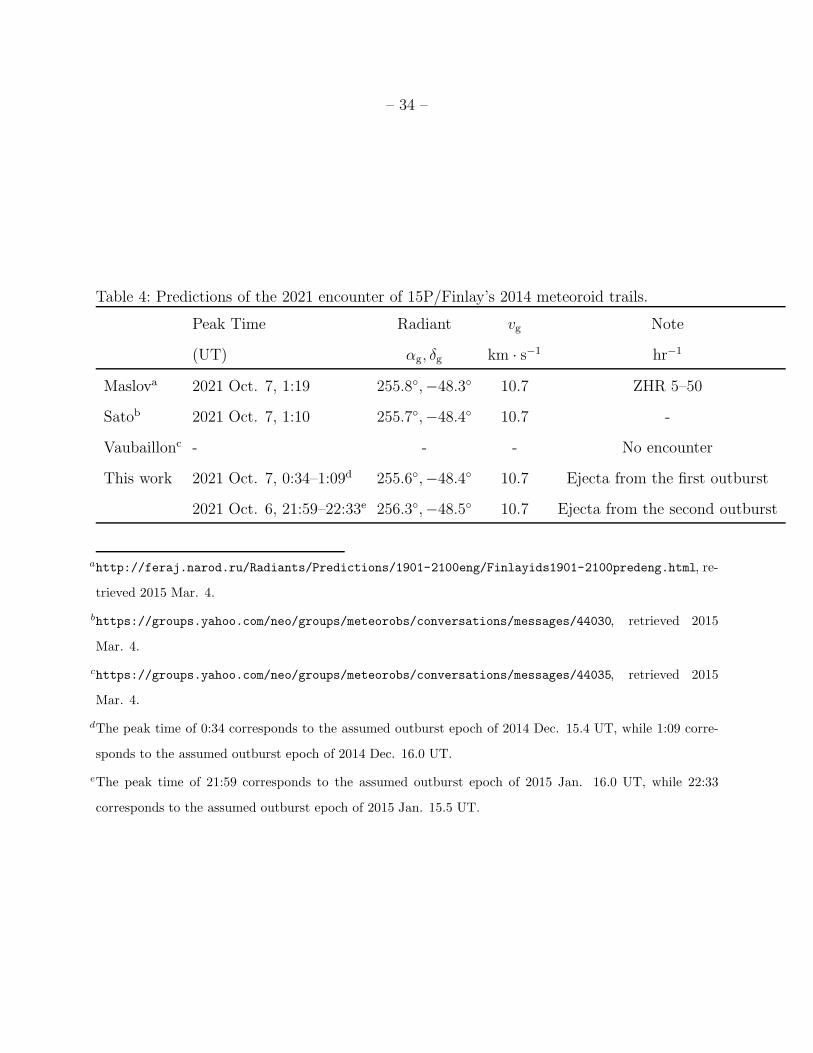
The simulation result confirms the general findings by Maslov and Sato, that a direct
encounter of the 2014/2015 meteoroid trail will occur on 2021 Oct. 6/7 (Table 4, Figure 8)
with a full-width-half-maximum (FWHM) of about 1 hour. The uncertainty in outburst
– 17 –
epochs results in about 0.5 hour uncertainty in the peak time in 2021. The ejecta from
the second outburst are calculated to arrive around 2021 Oct. 6 at 22 h UT, followed by
those from the first outburst which are expected to arrive around 2021 Oct. 7 at 1 h UT.
The radiant is at geocentric equatorial coordinates of αG = 257, δG = −48 or in the
constellation of Ara, favoring the observers in the southern tip of Africa. As 15P/Finlay was
∼ 20 times more active during the two outbursts compared to its normal dust production
level as indicated by Figure 1, the meteor activity may also be significantly stronger than
previously expected. However, we also note that the range of the meteoroid sizes delivered
to the Earth’s vicinity seems to be concentrated at the order of β ∼ 0.001, which translates
to a visual magnitude of +8 (Campbell-Brown & Koschny 2004) considering the very low
encounter speed. This indicates that the meteor activity in 2021 may only be visible to
meteor radars and low-light video cameras.
5. Summary
We present an analysis of the two outbursts of the potentially comet-asteroid transition
object, 15P/Finlay, at its 2014/2015 perihelion passage. These outbursts took place between
2014 Dec. 15.4–16.0 UT and 2015 Jan. 15.5–16.0 UT as constrained by ground-based
and spacecraft observations. As seen in monitoring images, both outbursts produced a
newly-formed dust shell that expands and fades in ∼ 1 week.
The images from five observing nights (two for the first outburst, three for the
second outburst) were studied using a Monte Carlo dust model, and yield a characteristic
ejection speed of V0 = 300 to 650 m · s−1 for the ejecta of the first outburst and
V0 = 550 to 750 m · s−1 for that of the second outburst, taking into account the uncertainty
in the determination of outburst epoch. The dust size index is in the range of q ≈ −3.5.
We derive the mass of the ejecta to be Md = 2 to 3 × 10⁵ kg for the first outburst and
– 18 –
Md = 4 to 5×10⁵ kg for the second outburst, corresponding to less than 10−7 of the nucleus
mass. The specific energy of the two outbursts is calculated to be 0.3 to 2 × 10⁵ J · kg−1,
comparable to the specific energy produced by the crystallization of amorphous ice, but
does not prove the latter as the driving force for 15P/Finlay’s outbursts.
We also revisited the long-standing puzzle of the non-detection of the Finlayids, the
hypothetical meteor shower generated by 15P/Finlay, as well as the future possibility for
meteor activity generated by the 2014/2015 outbursts. We find the efficiency of meteoroid
delivery to the Earth’s orbit is ∼ 10 times higher than previously reported by Beech et al.
(1999). Assuming 15P/Finlay’s recent (last ∼ 20 orbits) activity is comparable to its
contemporary level, the meteoroid flux of the Finlayids should be high enough to be
detected by modern meteor surveys. However, a cued search with the 12 million meteor
orbits gathered by the Canadian Meteor Orbit Radar over the past 13 years does not reveal
any positive detection. The encounter with the 2014/2015 outburst ejecta may provide an
answer to the Finlayid puzzle, as the Earth is expected to pass though the ejecta trails
directly around 2021 Oct. 6 at 22 h UT to Oct. 7 at 1 h UT, with a chance for some
significant meteor activity in the video or radio range. The timing and the southerly radiant
in the constellation of Ara will favor observers in the southern tip of Africa.
The recent outburst episode of 15P/Finlay seems to suggest that the comet, originally
thought to be quiet and largely inactive, does possess the ability for significant activity.
Whether the recent outbursts are the overtures of a resurrection of the comet or a finale
of its career remains to be seen. Cometary observations in the forthcoming perihelion
passage in July 2021, as well as observations during the potential meteor outburst, will
likely provide more information.
We thank an anonymous referee for his/her comments. We also thank Paul Wiegert for
permission to use his computational resource, Margaret Campbell-Brown for her meteoroid
– 19 –
ablation code, Zbigniew Krzeminski, Jason Gill, Robert Weryk and Daniel Wong for helping
with CMOR operations. The operation of the robotic telescope FRAM is supported by
the EU grant GLORIA (No. 283783 in FP7-Capacities program) and by the grant of the
Ministry of Education of the Czech Republic (MSMT-CR LG13007). Funding support
from the NASA Meteoroid Environment Office (cooperative agreement NNX11AB76A) for
CMOR operations is gratefully acknowledged. This work would not be possible without the
inputs from the amateur community and their contributions are gratefully acknowledged.
– 20 –
REFERENCES
Beech, M., Nikolova, S., & Jones, J. 1999, MNRAS, 310, 168
Bertaux, J. L., Kyrola, E., Quemerais, E., et al. 1995, Sol. Phys., 162, 403
Brown, P., Weryk, R. J., Wong, D. K., & Jones, J. 2008, Icarus, 195, 317
Brown, P., Wong, D. K., Weryk, R. J., & Wiegert, P. 2010, Icarus, 207, 66
Buzzi, L., Muler, G., Kidger, M., et al. 2007, IAU Circ., 8886, 1
Campbell-Brown, M. D., & Koschny, D. 2004, A&A, 418, 751
Chambers, J. E. 1999, MNRAS, 304, 793
Crifo, J. F., & Rodionov, A. V. 1997, Icarus, 127, 319
Everhart, E. 1967, AJ, 72, 716
Everhart, E. 1985, in Dynamics of Comets: Their Origin and Evolution, Proceedings of
IAU Colloq. 83, held in Rome, Italy, June 11-15, 1984. Edited by Andrea Carusi and
Giovanni B. Valsecchi. Dordrecht: Reidel, Astrophysics and Space Science Library.
Volume 115, 1985, p.185, ed. A. Carusi & G. B. Valsecchi, 185
Fernandez, J. A., & Sosa, A. 2015, IAU General Assembly, 22, 44024
Fernandez, Y. R., Kelley, M. S., Lamy, P. L., et al. 2013, Icarus, 226, 1138
Fulle, M. 2004, Motion of cometary dust, ed. M. C. Festou, H. U. Keller, & H. A. Weaver,
565–575
Gombosi, T. I., Nagy, A. F., & Cravens, T. E. 1986, Reviews of Geophysics, 24, 667
Gronchi, G. F. 2005, Celestial Mechanics and Dynamical Astronomy, 93, 295
– 21 –
Henden, A. A., Levine, S. E., Terrell, D., Smith, T. C., & Welch, D. 2012, Journal of the
American Association of Variable Star Observers (JAAVSO), 40, 430
Ishiguro, M., Ham, J.-B., Tholen, D. J., et al. 2011, ApJ, 726, 101
Ishiguro, M., Jewitt, D., Hanayama, H., et al. 2014, ApJ, 787, 55
Janches, D., Hormaechea, J. L., Brunini, C., Hocking, W., & Fritts, D. C. 2013, Icarus, 223,
677
Jewitt, D. 2012, AJ, 143, 66
Jewitt, D., Ishiguro, M., Weaver, H., et al. 2014, AJ, 147, 117
Jones, J., Brown, P., Ellis, K. J., et al. 2005, Planet. Space Sci., 53, 413
Kresak, L., & Kresakova, M. 1989, Bulletin of the Astronomical Institutes of Czechoslovakia,
40, 269
Kronk, G. W. 2004, Cometography
—. 2008, Cometography
Kronk, G. W., & Meyer, M. 2010, Cometography . Volume 5, 1960-1982: A Catalog of
Comets
Li, J., Jewitt, D., Clover, J. M., & Jackson, B. V. 2011, ApJ, 728, 31
Licandro, J., Campins, H., Mothe-Diniz, T., Pinilla-Alonso, N., & de Leon, J. 2007, A&A,
461, 751
Marcus, J. N. 2007, International Comet Quarterly, 29, 39
Meech, K. J., & Belton, M. J. S. 1989, IAU Circ., 4770, 1
– 22 –
Mommert, M., Hora, J. L., Harris, A. W., et al. 2014, ApJ, 781, 25
Reach, W. T., Vaubaillon, J., Lisse, C. M., Holloway, M., & Rho, J. 2010, Icarus, 208, 276
Tancredi, G. 2014, Icarus, 234, 66
Whipple, F. L. 1950, ApJ, 111, 375
Wyatt, S. P., & Whipple, F. L. 1950, ApJ, 111, 134
Ye, Q., Brown, P. G., Campbell-Brown, M. D., & Weryk, R. J. 2013, MNRAS, 436, 675
Ye, Q., & Wiegert, P. A. 2014, MNRAS, 437, 3283
Ye, Q.-Z., & Hui, M.-T. 2014, ApJ, 787, 115
Ye, Q.-Z., Hui, M.-T., Brown, P. G., et al. 2016, Icarus, 264, 48
Younger, J. P., Reid, I. M., Vincent, R. A., & Murphy, D. J. 2012, MNRAS, 425, 1473
Zacharias, N., Finch, C. T., Girard, T. M., et al. 2013, AJ, 145, 44
This manuscript was prepared with the AAS LATEX macros v5.2.
– 23 –
Fig. 1.— Nucleus magnitude of 15P/Finlay around the time of (a) the first outburst, and (b)
the second outburst. The Minor Planet Center (MPC) magnitudes (plotted in crosses) are
extracted from the Observations Database on the MPC website. The Xingming magnitudes
(plotted in red dots) are derived from the monitoring observations by the Xingming 0.35-m
telescope with aperture radius ρ = 5000 km. The magnitudes are normalized to ∆ = rh =
1 AU assuming a brightening rate n = 4 (Everhart 1967).
– 24 –
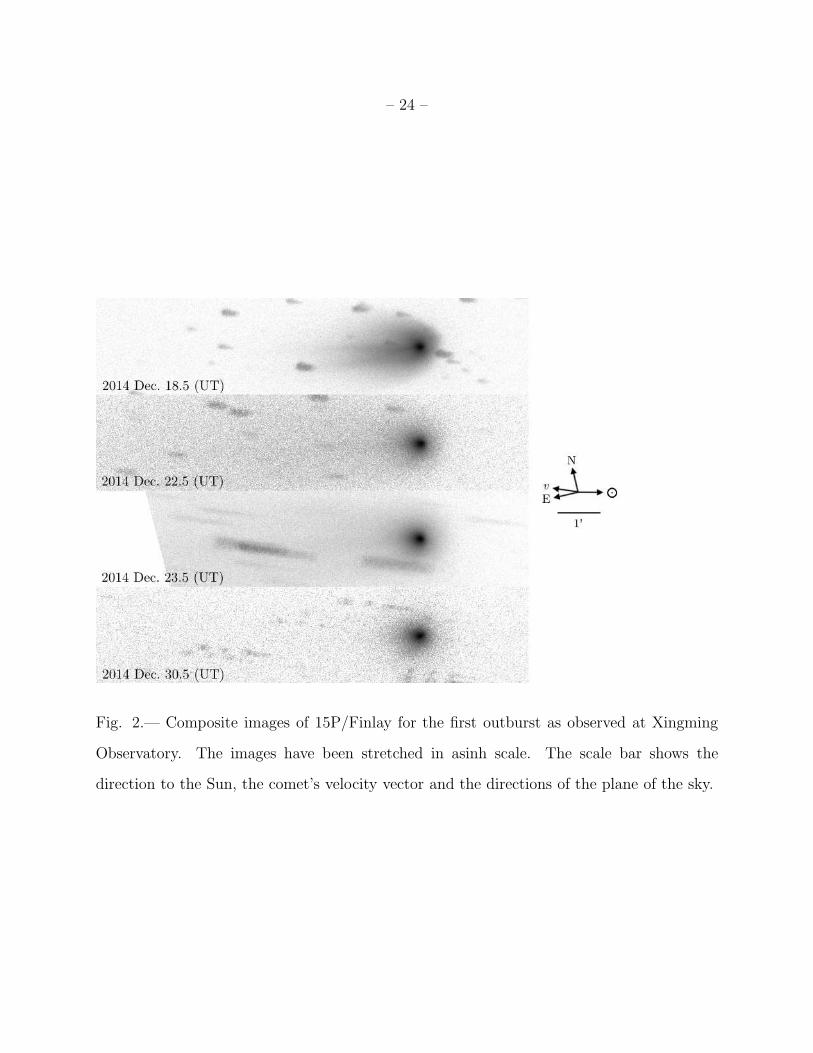
Fig. 2.— Composite images of 15P/Finlay for the first outburst as observed at Xingming
Observatory. The images have been stretched in asinh scale. The scale bar shows the
direction to the Sun, the comet’s velocity vector and the directions of the plane of the sky.
– 25 –
Fig. 3.— Composite images of 15P/Finlay images for the second outburst as observed at
Xingming Observatory. The images have been stretched in asinh scale. The scale bar shows
the direction to the Sun, the comet’s velocity vector and the directions of the plane of the
sky.
– 26 –
Fig. 4.— Observed surface brightness profiles (scatter dots) and the best-fit dust models
(color lines) for FRAM and Vicksburg observations. The assumed outburst epochs (see main
text) are denoted as t1 for the first outburst and t2 for the second outburst. The regions
that are dominated by submicron-sized particles are masked from modeling as described
in the main text. For the profile on 2015 Jan. 19 additional region is masked due to the
contamination of a background star.
– 27 –
Fig. 5.— Dynamical evolution of the perihelion distance of 100 clones of 15P/Finlay in the
interval of 1000–2000 A.D.
– 28 –
Fig. 6.— The distribution of the dust trails released by 15P/Finlay during its 1886, 1909 and
1960 perihelion passages in 2001. Vertical gray line marks the time that the Earth passes
the trails. It can be seen that the trails cross the Earth’s orbit, suggestive of the possibility
of a direct encounter to the Earth.
– 29 –
Fig. 7.— The variation of the wavelet coefficient at the calculated Finlayid radiant λ−λ⊙ =
66, β = −25, vG = 13 km · s−1 using the stacked “virtual year” CMOR data. The shaded
area is the expected time window for Finlayid activity (solar longitude λ⊙ ∼ 193).
– 30 –
Fig. 8.— Encounter of 15P/Finlay’s 2014/2015 outburst ejecta in 2021 Oct. 6/7. Subfigure
(a) corresponds to the simulation results assuming the earliest possible outburst epoch (2014
Dec. 15.4 UT for the first outburst, 2015 Jan. 15.5 UT for the second outburst), while (b)
corresponds to the results assuming the latest possible outburst epoch (2014 Dec. 16.0 UT
for the first outburst, 2015 Jan. 16.0 UT for the second outburst).
– 31 –
Table 1: Summary of the imaging observations.
Date Timea Facilityb Total Exposure Filter rH ∆ Plane Angle
(UT) (min.) (AU) (AU)
2014 Dec. 17 00:57 FRAM 8 RC 0.987 1.472 4.3
2014 Dec. 18 00:57 FRAM 8 RC 0.985 1.467 4.3
2014 Dec. 18 12:01 Xingming 10 Unfiltered 0.984 1.465 4.3
2014 Dec. 22 12:10 Xingming 24 Unfiltered 0.978 1.446 4.5
2014 Dec. 23 12:18 Xingming 51 Unfiltered 0.977 1.442 4.5
2014 Dec. 30 12:20 Xingming 26 Unfiltered 0.977 1.416 4.7
2015 Jan. 17 12:43 Xingming 83 Unfiltered 1.025 1.394 4.7
2015 Jan. 18 00:30 Vicksburg 3 RC 1.023 1.393 4.7
2015 Jan. 19 00:18 Vicksburg 6 RC 1.028 1.395 4.6
2015 Jan. 19 13:41 Xingming 16 Unfiltered 1.035 1.396 4.6
2015 Jan. 20 12:53 Xingming 91 Unfiltered 1.040 1.397 4.6
2015 Jan. 21 00:44 Vicksburg 6 RC 1.042 1.398 4.7
2015 Jan. 21 13:13 Xingming 88 Unfiltered 1.045 1.399 4.6
2015 Jan. 23 13:29 Xingming 17 Unfiltered 1.055 1.403 4.6
2015 Jan. 27 13:19 Xingming 88 Unfiltered 1.078 1.415 4.3
2015 Jan. 29 13:32 Xingming 68 Unfiltered 1.091 1.422 4.2
– 32 –
Table 2: General parameters for the dust model. The orbital elements are quoted from the
JPL elements K085/15. The nucleus radius is reported by Fernandez et al. (2013).
Parameter Value
Semimajor axis a 3.48762 AU
Eccentricity e 0.72017
Inclination i 6.79902
Longitude of the ascending node Ω 13.77506
Argument of perihelion ω 347.55924
Epoch of perihelion passage tp 2014 Dec. 27.05599 UT
Total magnitude H 10.7
Non-grav. radial acceleration parameter A1 4.075× 10⁻⁹ AU/d2
Non-grav. transverse acceleration parameter A2 5.744× 10⁻¹¹ AU/d2
Nucleus radius rc 0.9 km
Nucleus bulk density ρc 500 kg ·m−3 (assumed)
Dust bulk density ρd 1000 kg ·m−3 (assumed)
Minimum dust size βrp,max 1.0
– 33 –
Table 3: Best-fit dust models for the FRAM and Vicksburg observations.
Outburst Epoch Observation Epoch V0 q
(UT) (UT) m · s−1
Test grids - - 100 to 1200 -5.4 to -2.0
in steps of 20 in steps of 0.1
1st Outburst 2014 Dec. 15, 10 h 2014 Dec. 17 320± 10 −3.7 ± 0.2
.. 2014 Dec. 18 320± 20 −3.0 ± 0.3
2014 Dec. 16, 0 h 2014 Dec. 17 640± 30 −4.0 ± 0.6
.. 2014 Dec. 18 670± 90 −3.7 ± 0.5
2nd Outburst 2015 Jan. 15, 12 h 2015 Jan. 18 540± 40 −3.6 ± 0.6
.. 2015 Jan. 19 590± 120 −3.4 ± 0.5
.. 2015 Jan. 21 570± 30 −3.6 ± 0.6
2015 Jan. 16, 0 h 2015 Jan. 18 780± 30 −3.8 ± 0.5
.. 2015 Jan. 19 670± 100 −3.6 ± 0.5
.. 2015 Jan. 21 750± 40 −3.4 ± 0.4
– 34 –
Table 4: Predictions of the 2021 encounter of 15P/Finlay’s 2014 meteoroid trails.
Peak Time Radiant vg Note
(UT) αg, δg km · s−1 hr−1
Maslova 2021 Oct. 7, 1:19 255.8,−48.3 10.7 ZHR 5–50
Satob 2021 Oct. 7, 1:10 255.7,−48.4 10.7 -
Vaubaillonc - - - No encounter
This work 2021 Oct. 7, 0:34–1:09d 255.6,−48.4 10.7 Ejecta from the first outburst
2021 Oct. 6, 21:59–22:33e 256.3,−48.5 10.7 Ejecta from the second outburst
ahttp://feraj.narod.ru/Radiants/Predictions/1901-2100eng/Finlayids1901-2100predeng.html, re-
trieved 2015 Mar. 4.
bhttps://groups.yahoo.com/neo/groups/meteorobs/conversations/messages/44030, retrieved 2015
Mar. 4.
chttps://groups.yahoo.com/neo/groups/meteorobs/conversations/messages/44035, retrieved 2015
Mar. 4.
dThe peak time of 0:34 corresponds to the assumed outburst epoch of 2014 Dec. 15.4 UT, while 1:09 corre-
sponds to the assumed outburst epoch of 2014 Dec. 16.0 UT.
eThe peak time of 21:59 corresponds to the assumed outburst epoch of 2015 Jan. 16.0 UT, while 22:33
corresponds to the assumed outburst epoch of 2015 Jan. 15.5 UT.