bangalore electricity supply company limited...
TRANSCRIPT

Bangalore Electricity Supply Company Limited Truing up for FY-14 and ARR for FY-16
CHAPTER -7
MODIFIED ANNUAL REVENUE REQUIREMENT FOR FY16
6.0 REVISED ERC AND ARR FOR FY16:
6.1 ERC filing for FY16:
BESCOM, in its filing dated 10th Dec 2012, had submitted Annual Revenue Requirement
(ARR) for the control period from FY-14 toFY-16. Commission in its Tariff Order dated
06.05.2013 had approved Annual Revenue Requirement for the control period from FY-14
to FY-16. The details related to FY-16 are shown in the table below:
Sl. No Particulars
FY16 ( Rs. In Crs)As Filed As Appd
A Energy @ Gen Bus 37273 35121B Transmission Losses in % 3.90% 3.90%C Energy @ Interface in MU 35820 33752D Distribution Losses in %Sales in MU 13.40% 13.40%G Sales to other than IPsets and BJ/KJ 24445.18 23070.75F Sales to IP sets and BJ/KJ 6574.72 6158.25G Total Sales 31019.9 29229
Expenditure in Rs Crs1 Power Purchase Cost 13590.06 13808.92 Transmission charges of KPTCL 1522.06 1305.623 SLDC Charges 10.534 Power Purchase Cost including cost of transmission 15112.12 15125.055 Employee Cost 1217.96 Repairs & Maintenance 71.67 Admin & General Expenses 143.38 Total O&M Expenses 1432.8 1161.059 Depreciation 167.07 229.71
Interest & Finance charges10 Interest on Loans 269.73 195.3111 Interest on Working capital 400.04 316.6412 Interest on belated payment on PP Cost 0 013 Interest on consumer deposits 221.66 210.5114 Other Interest & Finance charges 7.63 7.6315 Less interest & other expenses capitalized 0 4016 Total Interest & Finance charges 899.06 690.117 Other Debits 0 018 Net Prior Period19 RoE 123.71 114.9320 Funds towards Consumer Relations/Consumer Education 0 1
21 Other Income 193.96 197.52
Chapter-7 Page 93
Bangalore Electricity Supply Company Limited Truing up for FY-14 and ARR for FY-16
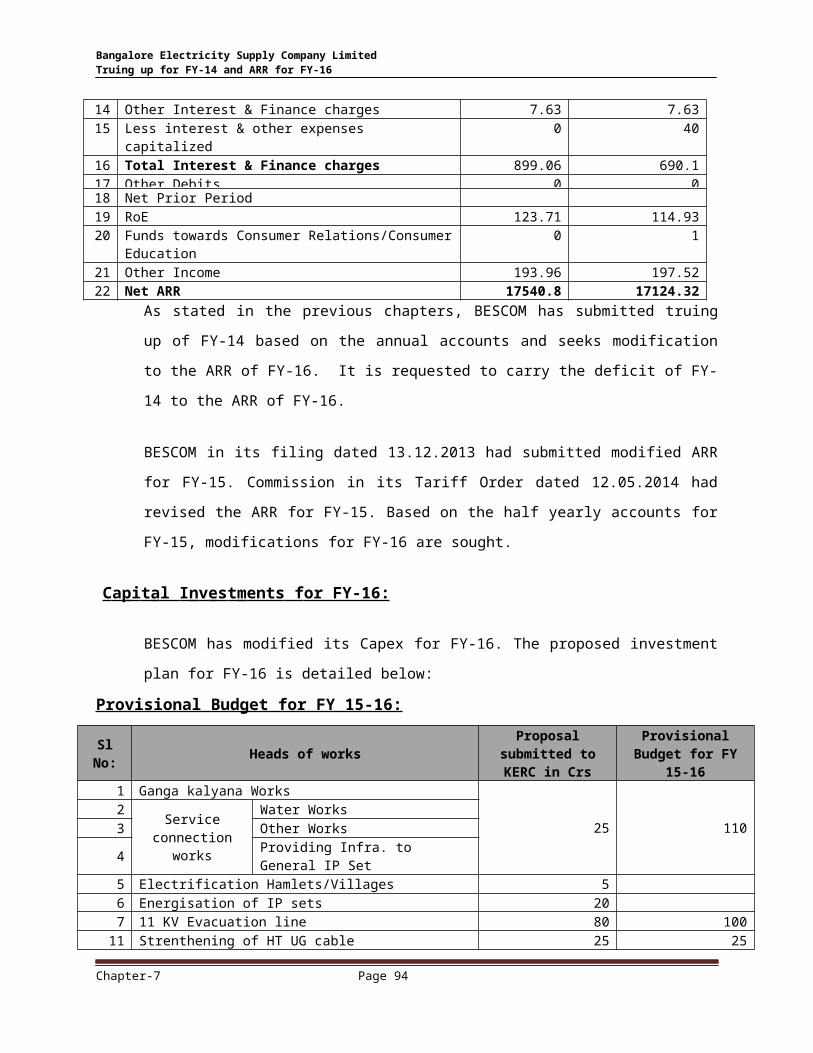
22 Net ARR 17540.8 17124.32As stated in the previous chapters, BESCOM has submitted truing up of FY-14 based on the
annual accounts and seeks modification to the ARR of FY-16. It is requested to carry the
deficit of FY-14 to the ARR of FY-16.
BESCOM in its filing dated 13.12.2013 had submitted modified ARR for FY-15. Commission
in its Tariff Order dated 12.05.2014 had revised the ARR for FY-15. Based on the half yearly
accounts for FY-15, modifications for FY-16 are sought.
C a p i t a l I n v e s t m ents f or FY-16:
BESCOM has modified its Capex for FY-16. The proposed investment plan for FY-16 is
detailed below:
Provisional Budget for FY 15-16:
Sl No: Heads of works Proposal submitted to KERC in Crs
Provisional Budget for FY 15-16
1 Ganga kalyana Works
25 1102
Service connection works
Water Works3 Other Works4 Providing Infra. to General IP Set5 Electrification Hamlets/Villages 56 Energisation of IP sets 207 11 KV Evacuation line 80 100
11 Strenthening of HT UG cable 25 258 Providing Additional DTC's /Enhancement of DTCs 70 45
9Reconductoring of HT lines in No.s/Circuit kms(Bangalore Urban and rural)
50 30
10 Reconductoring of LT lines in No.s/circuit kms 20 2012 Providing AB cable 120 5013 NJY III 0 8018 DSM 5 25
19Replacement of Existing Electromechanical meters by Static meters
20250
20 Smart meter, HT-TOD meter, replacing MNR etc. 3022 Metering of DTCs non RAPDRP area 30 2023 Replacement faulty transformers by New transformers 15 3025 Civil Engineering Works 20 2027 Provding Infrastructure to Un authorised IP sets 60 15029
Local planningOther Works
2045
30 Safety works 2533 Providing Fault Locators 134 Consumer Education 137 Others (Tool & Plant etc.,) 10 10
Spill Over 1000IT initiative 15
Chapter-7 Page 94

Bangalore Electricity Supply Company Limited Truing up for FY-14 and ARR for FY-16
Grand Total627 2050
BESCOM plans to provide budget for FY-16 to an extent of Rs.2050 Crs. Out of Rs.2050.00 budget,
Rs.1000 Cr are set aside for spill over works. Major changes as against the approved capex plan
relates to
a) Providing infrastructure to unauthorized IP sets - Providing infrastructure to unauthorized IP
sets will be undertaken by GoK grants and deposits from farmers.
b) Replacement of Existing Electromechanical meter by Static meter - Loan to an extent of Rs.150
Crs. will be funded by REC. Efforts will be made to get interest concession through National
Electricity Fund.
c) Prioritizing the works related to Drinking water supply, Ganga kalyana and other special
component works – These works will be carried out by grants and funds received from GoK and
Zilla Panchayath.
and
d) Niranthara Jyothi Plan III – The proposal has been posed to Deendayal Upadhya Scheme
sponsored by Government of India.
The investment plan has increased bearing in mind the grants/subsidy/concessions which would
be received from GoI/GoK/ZP etc. Due to this there is no financial closure. However, for
replacement of electromechanical meter by static meters, provision is made for borrowing Rs.250
Crs. from REC.
S a les For e c a s t f or FY 16 :
Based on FY-14 and half yearly FY-15 figures, it can be analyzed that first two years of the 3 rd
control period ie. FY-14 and FY-15 have not reached either the forecast projected by BESCOM
(around 8.19%)or the approved sales of the Commission. Overall sales growth of FY-14 over FY-13
is 1.17% over an increase of 6% of consumers. The half yearly figures of FY-15 also shows bleak
growth rate.
In the MYT filing for 3rd control period, BESCOM revised its sales during Annual Performance
Review under the pretext of increase in the availability of power as estimated by the Nodal agency
or Generating Company. As the State is suffering from electricity shortage, it is presumed that
increase in availability of power will stimulate the growth rate. Thus resulting in an increase in
sales by the Company, this was concurred by the Commission.
Chapter-7 Page 95

Bangalore Electricity Supply Company Limited Truing up for FY-14 and ARR for FY-16
The Company will recover the approved Average Cost of Supply only if the Company is able to
attain the approved sales and the approved sales mix between subsidizing category and subsidized
category. Any variation in the approved sales or the approved sales mix, the Company will not
accomplish the approved Average Cost of Supply. Not achieving the targeted sales mix with small
variation in the ratio between subsidizing and subsidized category are damaging the financials in
two counts. They are
Cross subsidy and
Under recovery of fixed cost
It is very important to mention here that, the deficit of FY-13 and FY-14 are not due to increase in
the expenditure but due to not achieving the sales approved at the approved rates . Hence,
optimistic sales are detrimental to the financial health of BESCOM. Commission is requested to
approve the conservative sales and any profit earned will be shared with the consumers.
Company has already faced the brunt of being optimistic in its sales forecast. Hence, BESCOM has
proposed modification for the sales of FY-16.
Approved sales and installations for FY-16 in Tariff Order dated 06.05.2013 is as under:
Category FY16No. of Instls. Sales in MUs
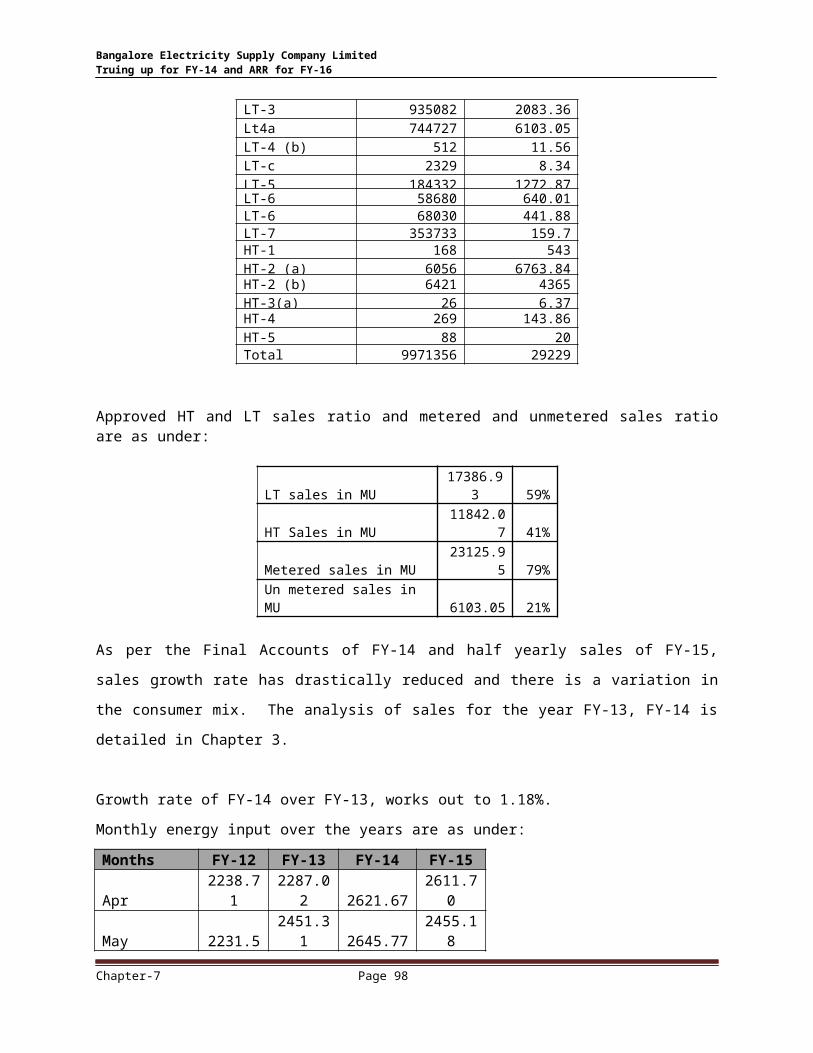
BJ/KJ 507183 55.2LT-2a 7074849 6557.97LT-2b 28871 52.99LT-3 935082 2083.36Lt4a 744727 6103.05LT-4 (b) 512 11.56LT-c 2329 8.34LT-5 184332 1272.87LT-6 58680 640.01LT-6 68030 441.88LT-7 353733 159.7HT-1 168 543HT-2 (a) 6056 6763.84HT-2 (b) 6421 4365HT-3(a) 26 6.37HT-4 269 143.86HT-5 88 20Total 9971356 29229
Chapter-7 Page 96

Bangalore Electricity Supply Company Limited Truing up for FY-14 and ARR for FY-16
Approved HT and LT sales ratio and metered and unmetered sales ratio are as under:
LT sales in MU 17386.93 59%HT Sales in MU 11842.07 41%Metered sales in MU 23125.95 79%Un metered sales in MU 6103.05 21%
As per the Final Accounts of FY-14 and half yearly sales of FY-15, sales growth rate has drastically
reduced and there is a variation in the consumer mix. The analysis of sales for the year FY-13, FY-
14 is detailed in Chapter 3.
Growth rate of FY-14 over FY-13, works out to 1.18%.
Monthly energy input over the years are as under:
Months FY-12 FY-13 FY-14 FY-15Apr 2238.71 2287.02 2621.67 2611.70May 2231.5 2451.31 2645.77 2455.18Jun 1983.92 2449.29 2163.02 2287.54Jul 2089.42 2464.79 2068.21 2334.14Aug 2110.21 2360.10 2099.27 2224.58Sept 2169.35 2229.72 1976.91 2221.00Total of first half
12823.11
14242.22
13574.851
14134.14
% Growth 11.1% -4.7% 4.1%Oct 2080.49 2358.22 2305.23Nov 2184.84 2257.11 2378.55Dec 2495.02 2508.87 2505.36Jan 2562.31 2570.55 2782.49Feb 2566.18 2375.16 2492.86Mar 2817.73 2586.49 2706.62
Total of second half
14706.57
14656.39
15171.11 0
% Growth -0.3% 3.5%Grand Total (without energy balancing)
27529.68
28898.61
28745.961
% Growth 5.0% -0.5%
Chapter-7 Page 97
Bangalore Electricity Supply Company Limited Truing up for FY-14 and ARR for FY-16
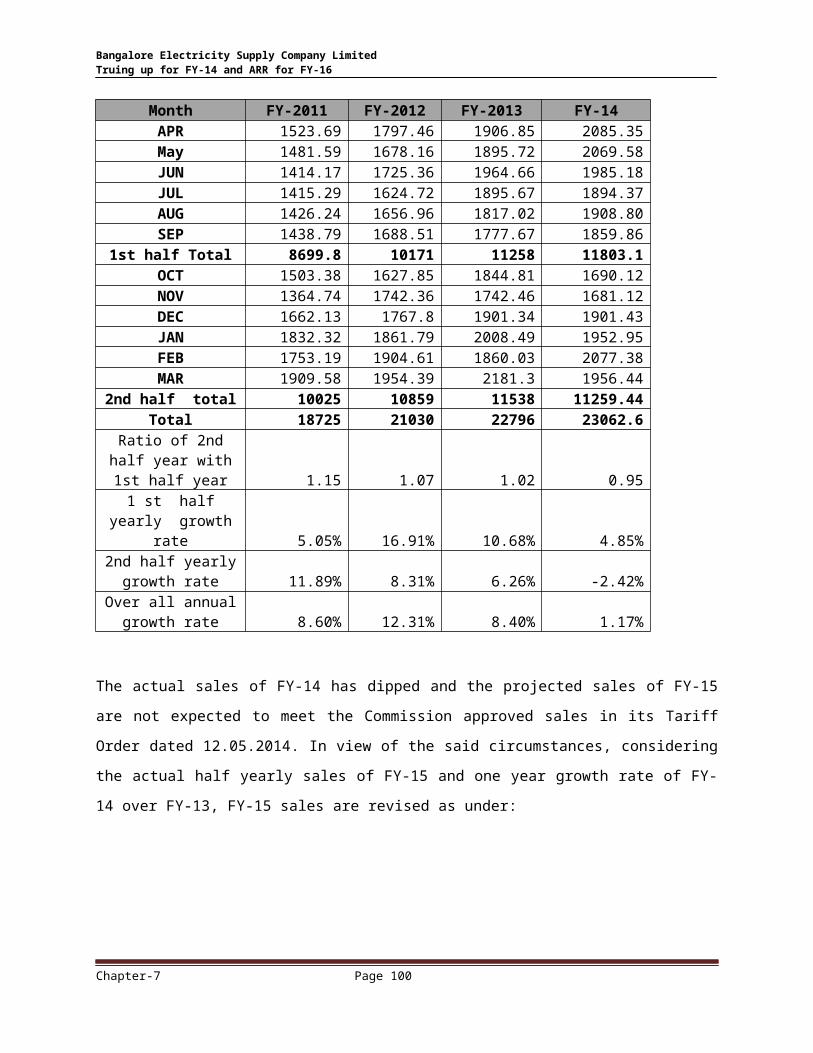
Monthly sales over the years are as under:
Month FY-2011 FY-2012 FY-2013 FY-14APR 1523.69 1797.46 1906.85 2085.35May 1481.59 1678.16 1895.72 2069.58JUN 1414.17 1725.36 1964.66 1985.18JUL 1415.29 1624.72 1895.67 1894.37AUG 1426.24 1656.96 1817.02 1908.80SEP 1438.79 1688.51 1777.67 1859.86
1st half Total 8699.8 10171 11258 11803.1OCT 1503.38 1627.85 1844.81 1690.12NOV 1364.74 1742.36 1742.46 1681.12DEC 1662.13 1767.8 1901.34 1901.43JAN 1832.32 1861.79 2008.49 1952.95FEB 1753.19 1904.61 1860.03 2077.38MAR 1909.58 1954.39 2181.3 1956.44
2nd half total 10025 10859 11538 11259.44Total 18725 21030 22796 23062.6
Ratio of 2nd half year with 1st half year 1.15 1.07 1.02 0.95
1 st half yearly growth rate 5.05% 16.91% 10.68% 4.85%
2nd half yearly growth rate 11.89% 8.31% 6.26% -2.42%
Over all annual growth rate 8.60% 12.31% 8.40% 1.17%
The actual sales of FY-14 has dipped and the projected sales of FY-15 are not expected to meet the
Commission approved sales in its Tariff Order dated 12.05.2014. In view of the said circumstances,
considering the actual half yearly sales of FY-15 and one year growth rate of FY-14 over FY-13, FY-
15 sales are revised as under:
METERED SALES
Chapter-7 Page 98

Bangalore Electricity Supply Company Limited Truing up for FY-14 and ARR for FY-16
Category FY-15 (Apr-Sept)
FY-15 (half yearly energy doubled)
FY-14 FY-14 growth over FY-13
Final FY-15
LT-2 2893.5 5787.0 5246.0 0.1 5549.0LT-3 846.7 1693.3 1536.9 0.0 1603.8LT-4( b)&© 3.6 7.2 8.5 -0.2 8.5LT-5 568.8 1137.5 1109.4 0.0 1109.4LT-6 WR 229.7 459.5 467.1 0.0 470.0LT-6 SL 195.1 390.2 394.5 0.0 394.5LT-7 95.1 190.1 147.8 0.1 156.1LT Total 4832.4 9664.9 8910.1 9291.3HT-1 322.6 645.2 612.9 0.2 717.9HT-2(a) 2671.2 5342.4 5067.5 0.1 5367.0HT-2(b) 1605.4 3210.7 2855.7 0.0 2855.7HT-2© 87.8 175.6 89.7 89.7HT-3 28.0 56.0 9.1 -0.2 28.0HT-4 72.7 145.4 109.7 -0.1 109.7HT-5 27.9 55.8 46.9 1.3 55.8HT TOTAL 4815.5 9631.0 8791.6 9223.8TOTAL 9647.9 19295.9 17701.7 18515.0
The metered category sales for FY-15 (upto Sept-14) is 9647.95 MU. The doubled half yearly sales
totals to 19295.89 MU for FY-15, there is an increase of 9% over FY-14. From the previous years
growth rate it can be found that there is 4.5% increase in metered category for FY-14 over FY-13.
LT5 sales are showing reduced growth rate, the HT2b sales have also decreased. Hence, one year
growth of FY-14 over FY-13 is considered for projecting FY-15 sales.
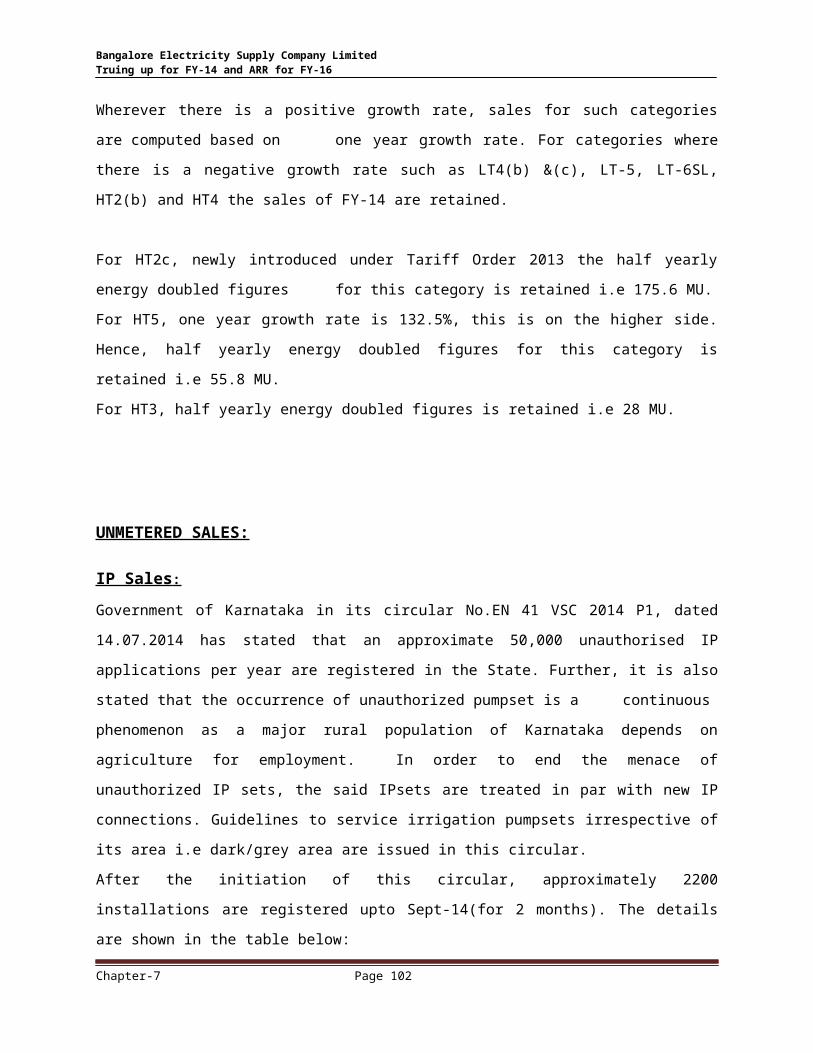
Wherever there is a positive growth rate, sales for such categories are computed based on one
year growth rate. For categories where there is a negative growth rate such as LT4(b) &(c), LT-5,
LT-6SL, HT2(b) and HT4 the sales of FY-14 are retained.
For HT2c, newly introduced under Tariff Order 2013 the half yearly energy doubled figures for this
category is retained i.e 175.6 MU.
For HT5, one year growth rate is 132.5%, this is on the higher side. Hence, half yearly energy
doubled figures for this category is retained i.e 55.8 MU.
For HT3, half yearly energy doubled figures is retained i.e 28 MU.
UNMETERED SALES:
Chapter-7 Page 99
Bangalore Electricity Supply Company Limited Truing up for FY-14 and ARR for FY-16
IP Sales :
Government of Karnataka in its circular No.EN 41 VSC 2014 P1, dated 14.07.2014 has stated that an
approximate 50,000 unauthorised IP applications per year are registered in the State. Further, it is
also stated that the occurrence of unauthorized pumpset is a continuous phenomenon as a major
rural population of Karnataka depends on agriculture for employment. In order to end the menace
of unauthorized IP sets, the said IPsets are treated in par with new IP connections. Guidelines to
service irrigation pumpsets irrespective of its area i.e dark/grey area are issued in this circular.
After the initiation of this circular, approximately 2200 installations are registered upto Sept-14(for
2 months). The details are shown in the table below:
Statement showing the details of the IP sets as per the order dated 14.07.2014 & 23-07-2014 as on Sept-14
Circle
OB as at the end of the beginning
month
Registered during the
month
Lapsed during the
month
Serviced during the
month
Balance applications as at the end of the month
Davangere 1 206 0 207 0Ramnagar 652 540 0 53 1139
Tumkur 82 503 0 229 356Kolar 89 443 0 3 529BRC 9 94 0 2 101
Total 833 1786 0 494 2125
The number of installations for FY-15 upto September-14 is 708150.
For the next half year of FY-15, 6000 installations are added to 708150 which sums up to 714150
installations.
The Phase-1 of Niranthara Jyothi scheme is completed and the IP sales on these feeders are
recorded. As against 7 lakh IP installations the data for only 4.5 lakhs IP installations are received.
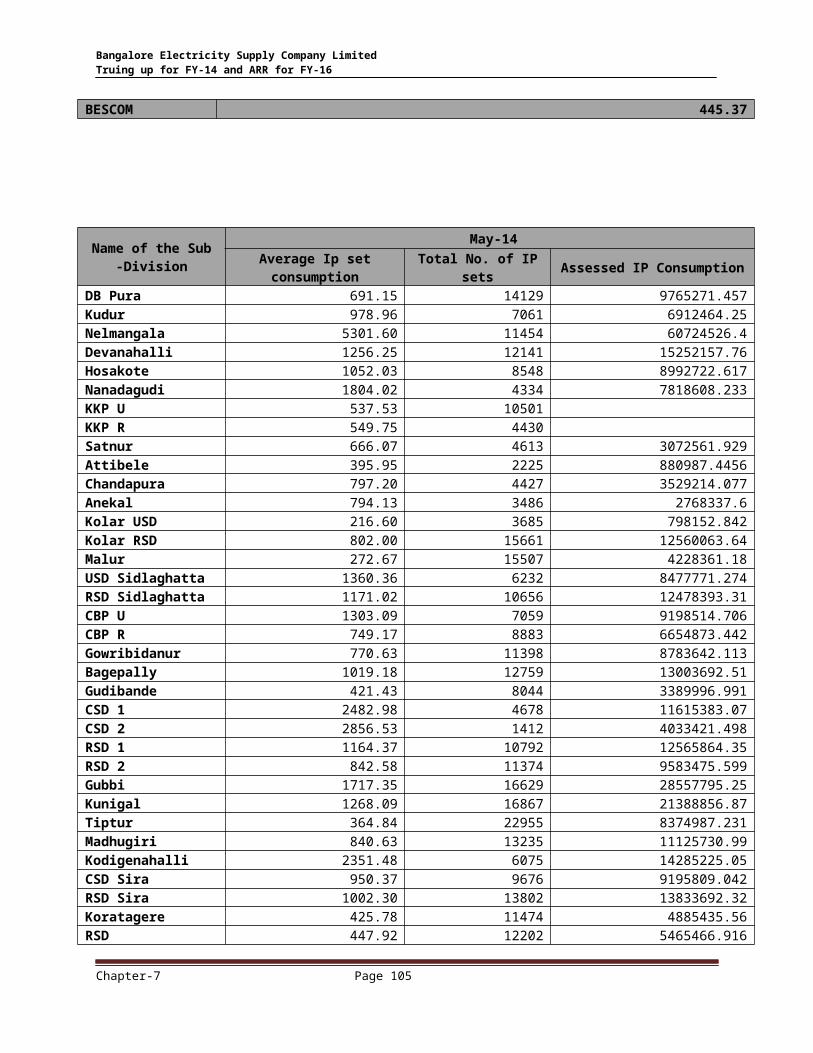
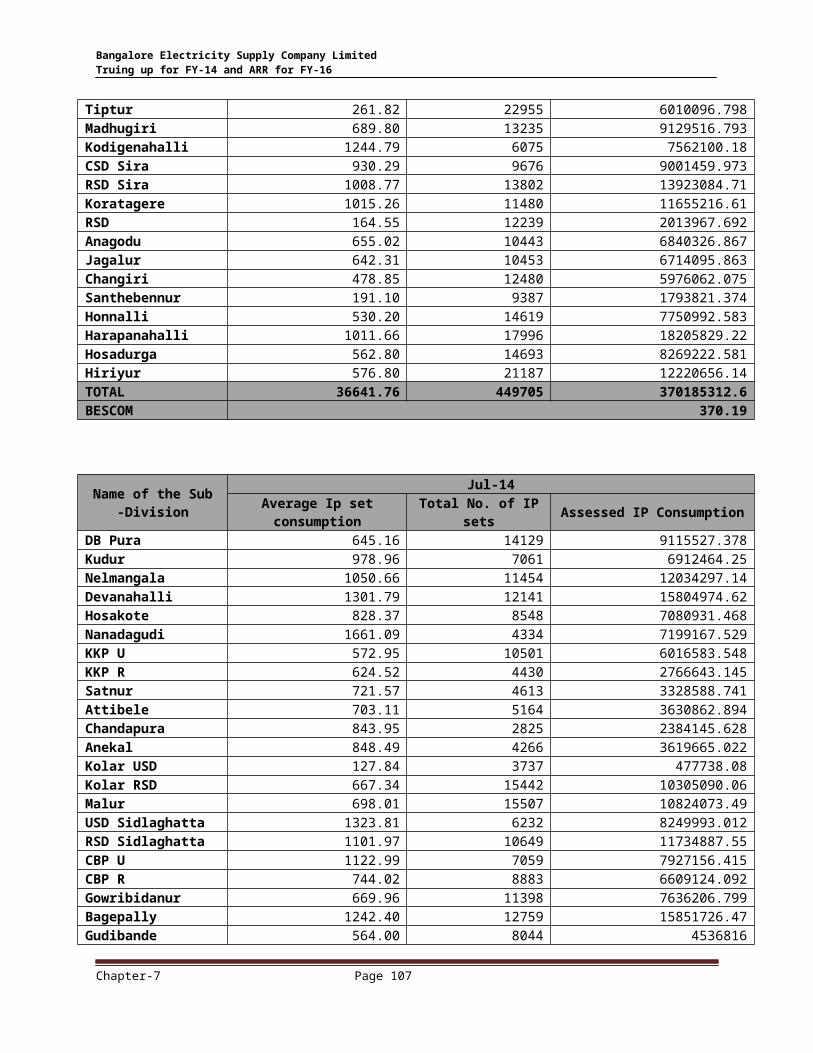
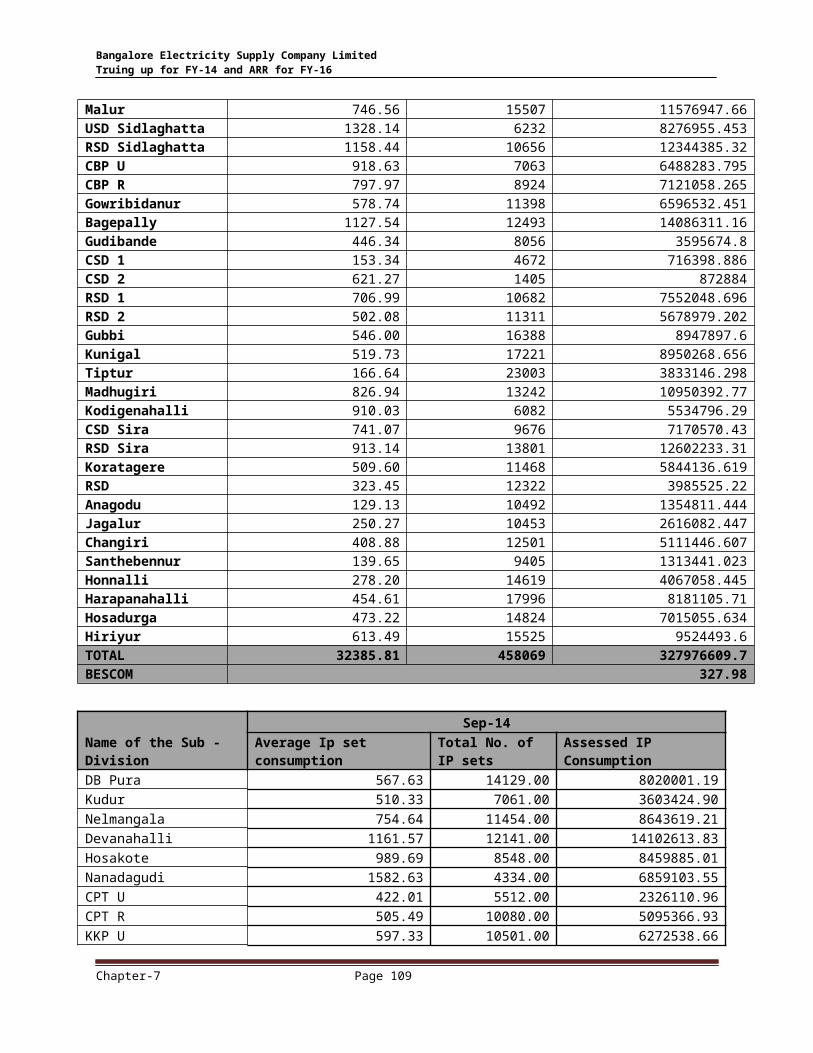
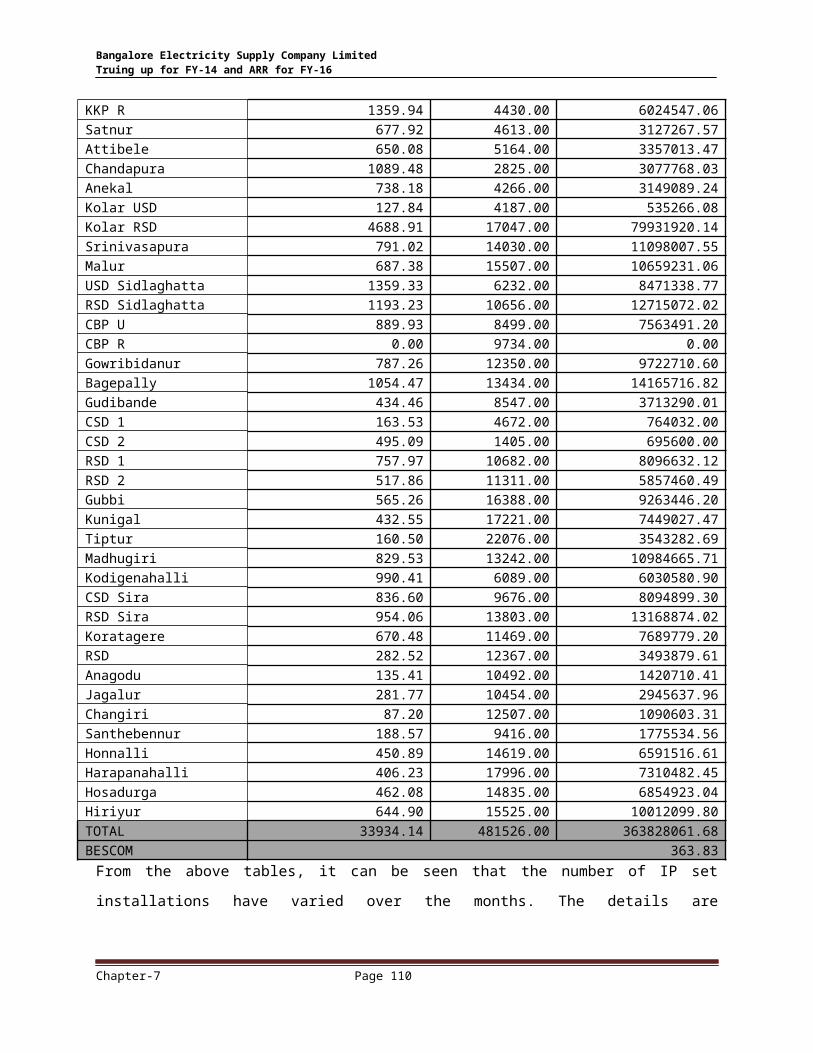
IP sales on NJY feeders for the months Apr-14 to Sept-14 are shown below:
Chapter-7 Page 100

Bangalore Electricity Supply Company Limited Truing up for FY-14 and ARR for FY-16
Name of the Sub -
Division Apr-14
Average Ip set consumption Total No. of IP sets Assessed IP ConsumptionDB Pura 764.09 14129 10795889.19Kudur 978.96 7061 6912464.25Nelmangala 431.77 11454 4945531.76Devanahalli 1422.67 12141 17272647.32Hosakote 1236.66 8548 10570967.33Nanadagudi 1892.02 4334 8200028.271KKP U 735.40 10501KKP R 854.51 4430Satnur 919.91 4613 4243567.174Attibele 766.28 2225 1704975.385Chandapura 1191.69 4427 5275629.29Anekal 998.21 3486 3479767.2Kolar USD 310.60 3685 1144542.842Kolar RSD 1025.74 15661 16064158.28Malur 344.83 15507 5347210.681USD Sidlaghatta 1530.16 6232 9535972.908RSD Sidlaghatta 1443.19 10656 15378628.23CBP U 1431.34 7059 10103811.77CBP R 895.87 8880 7955310.308Gowribidanur 943.10 11398 10749403.45Bagepally 1428.22 12758 18221174.78Gudibande 305.92 8044 2460797.633CSD 1 2706.31 4678 12660102.72CSD 2 3179.96 1412 4490106.464RSD 1 1250.50 10791 13494124.48RSD 2 907.74 11100 10075951.04Gubbi 1855.58 16629 30856388.08Kunigal 1268.09 16747 21236686.19Tiptur 638.46 20858 13317015.21Madhugiri 1117.96 13232 14792898.77Kodigenahalli 1034.87 5988 6196808.775CSD Sira 1188.27 9676 11497694.34RSD Sira 1344.61 13802 18558297.2Koratagere 764.22 11479 8772457.419RSD 950.32 12185 11579613.54Anagodu 790.65 10387 8212530.161Jagalur 554.15 10453 5792543.159Changiri 1107.98 12366 13701219.69Santhebennur 827.86 9354 7743782.493Honnalli 954.80 14619 13958152.8Harapanahalli 690.45 17996 12425420.74Hosadurga 802.64 14837 11908712.51Hiriyur 1528.63 15525 23732039TOTAL 47315.19 441343.00 445365022.82BESCOM 445.37
Chapter-7 Page 101
Bangalore Electricity Supply Company Limited Truing up for FY-14 and ARR for FY-16
Name of the Sub -Division
May-14Average Ip set consumption Total No. of IP sets Assessed IP Consumption
DB Pura 691.15 14129 9765271.457Kudur 978.96 7061 6912464.25Nelmangala 5301.60 11454 60724526.4Devanahalli 1256.25 12141 15252157.76Hosakote 1052.03 8548 8992722.617Nanadagudi 1804.02 4334 7818608.233KKP U 537.53 10501KKP R 549.75 4430Satnur 666.07 4613 3072561.929Attibele 395.95 2225 880987.4456Chandapura 797.20 4427 3529214.077Anekal 794.13 3486 2768337.6Kolar USD 216.60 3685 798152.842Kolar RSD 802.00 15661 12560063.64Malur 272.67 15507 4228361.18USD Sidlaghatta 1360.36 6232 8477771.274RSD Sidlaghatta 1171.02 10656 12478393.31CBP U 1303.09 7059 9198514.706CBP R 749.17 8883 6654873.442Gowribidanur 770.63 11398 8783642.113Bagepally 1019.18 12759 13003692.51Gudibande 421.43 8044 3389996.991CSD 1 2482.98 4678 11615383.07CSD 2 2856.53 1412 4033421.498RSD 1 1164.37 10792 12565864.35RSD 2 842.58 11374 9583475.599Gubbi 1717.35 16629 28557795.25Kunigal 1268.09 16867 21388856.87Tiptur 364.84 22955 8374987.231Madhugiri 840.63 13235 11125730.99Kodigenahalli 2351.48 6075 14285225.05CSD Sira 950.37 9676 9195809.042RSD Sira 1002.30 13802 13833692.32Koratagere 425.78 11474 4885435.56RSD 447.92 12202 5465466.916Anagodu 457.40 10406 4759746.024Jagalur 320.20 10453 3347002.33Changiri 601.42 12452 7488834.982Santhebennur 1153.44 9378 10817006.31Honnalli 771.97 14619 11285431.01Harapanahalli 619.54 17996 11149328.72Hosadurga 572.76 14939 11149328.72Hiriyur 698.94 15525 10851115.6TOTAL 44821.68 444172 315583500.5BESCOM 315.584
Chapter-7 Page 102

Bangalore Electricity Supply Company Limited Truing up for FY-14 and ARR for FY-16
Name of the Sub -Division
Jun-14Average Ip set consumption
Total No. of IP sets Assessed IP Consumption
DB Pura 2226.31 14129 31455542.38Kudur 986.78 7061 6967666.607Nelmangala 4065.73 11454 46568903.36Devanahalli 1133.05 12141 13756388.86Hosakote 843.15 8548 7207204.509Nanadagudi 3157.95 4334 13686569.13KKP U 464.83 10501 4610877.48KKP R 519.78 4430 2419829.116Satnur 605.09 4613 2791276.55Attibele 488.94 4427 2164544.944Chandapura 796.69 2225 1772631.967Anekal 804.78 3486 2805448.8Kolar USD 184.19 3685 678723.5942Kolar RSD 585.56 15661 9170380.74Malur 589.69 15507 9144387.055USD Sidlaghatta 1201.12 6232 7485394.841RSD Sidlaghatta 1005.81 10656 10717866.69CBP U 1044.06 7059 7370039.605CBP R 728.49 8883 6471202.655Gowribidanur 565.74 11398 6448281.407Bagepally 828.08 12759 10565411.55Gudibande 409.75 8044 3296055.222CSD 1 212.62 4678 994613.333CSD 2 816.90 1412 1153458.278RSD 1 827.16 10792 8926684.714RSD 2 380.56 11374 4328531.834Gubbi 683.82 16629 11371159.82Kunigal 521.12 16867 8789788.051Tiptur 261.82 22955 6010096.798Madhugiri 689.80 13235 9129516.793Kodigenahalli 1244.79 6075 7562100.18CSD Sira 930.29 9676 9001459.973RSD Sira 1008.77 13802 13923084.71Koratagere 1015.26 11480 11655216.61RSD 164.55 12239 2013967.692Anagodu 655.02 10443 6840326.867Jagalur 642.31 10453 6714095.863Changiri 478.85 12480 5976062.075Santhebennur 191.10 9387 1793821.374Honnalli 530.20 14619 7750992.583Harapanahalli 1011.66 17996 18205829.22Hosadurga 562.80 14693 8269222.581Hiriyur 576.80 21187 12220656.14TOTAL 36641.76 449705 370185312.6BESCOM 370.19
Name of the Sub - Jul-14
Chapter-7 Page 103

Bangalore Electricity Supply Company Limited Truing up for FY-14 and ARR for FY-16
DivisionAverage Ip set consumption Total No. of IP sets Assessed IP Consumption
DB Pura 645.16 14129 9115527.378Kudur 978.96 7061 6912464.25Nelmangala 1050.66 11454 12034297.14Devanahalli 1301.79 12141 15804974.62Hosakote 828.37 8548 7080931.468Nanadagudi 1661.09 4334 7199167.529KKP U 572.95 10501 6016583.548KKP R 624.52 4430 2766643.145Satnur 721.57 4613 3328588.741Attibele 703.11 5164 3630862.894Chandapura 843.95 2825 2384145.628Anekal 848.49 4266 3619665.022Kolar USD 127.84 3737 477738.08Kolar RSD 667.34 15442 10305090.06Malur 698.01 15507 10824073.49USD Sidlaghatta 1323.81 6232 8249993.012RSD Sidlaghatta 1101.97 10649 11734887.55CBP U 1122.99 7059 7927156.415CBP R 744.02 8883 6609124.092Gowribidanur 669.96 11398 7636206.799Bagepally 1242.40 12759 15851726.47Gudibande 564.00 8044 4536816CSD 1 207.61 4673 970174.8962CSD 2 832.95 1412 1176130.676RSD 1 927.88 10792 10013662.52RSD 2 359.10 11376 4085125.012Gubbi 611.62 16632 10172397.91Kunigal 521.12 17149 8936744.845Tiptur 206.47 23002 4749255.771Madhugiri 758.90 13235 10044024.37Kodigenahalli 979.40 6078 5952773.678CSD Sira 1005.98 9676 9733900.602RSD Sira 1220.97 13802 16851808.02Koratagere 1964.82 11480 22556184.33RSD 474.48 12310 5840801.905Anagodu 492.47 10460 5151194.36Jagalur 479.09 10453 5007951.14Changiri 408.25 12484 5096612.712Santhebennur 386.59 9397 3632782.361Honnalli 541.82 14619 7920906.505Harapanahalli 877.10 17996 15784353.66Hosadurga 680.67 14818 10086157.52Hiriyur 749.39 15525 11634210.8TOTAL 33729.65 446545 339443816.9BESCOM 339.44
Name of the Sub -Division
Aug-14Average Ip set Total No. of IP sets Assessed IP Consumption
Chapter-7 Page 104
Bangalore Electricity Supply Company Limited Truing up for FY-14 and ARR for FY-16
consumptionDB Pura 497.63 14129 7030956.124Kudur 978.96 7061 6912464.25Nelmangala 999.00 11454 11442536.28Devanahalli 1288.53 12141 15644072.69Hosakote 1015.70 8548 8682161.141Nanadagudi 1681.41 4334 7287211.076KKP U 658.05 10501 6910186.442KKP R 788.03 4430 3490970.78Satnur 721.76 4613 3329458.782Attibele 821.91 5164 4244340.905Chandapura 1038.62 2825 2934109.836Anekal 819.50 4266 3495981.86Kolar USD 127.84 3144 401928.96Kolar RSD 2867.77 15447 44298414.67Srinivasapura 791.02 12595 9962894.164Malur 746.56 15507 11576947.66USD Sidlaghatta 1328.14 6232 8276955.453RSD Sidlaghatta 1158.44 10656 12344385.32CBP U 918.63 7063 6488283.795CBP R 797.97 8924 7121058.265Gowribidanur 578.74 11398 6596532.451Bagepally 1127.54 12493 14086311.16Gudibande 446.34 8056 3595674.8CSD 1 153.34 4672 716398.886CSD 2 621.27 1405 872884RSD 1 706.99 10682 7552048.696RSD 2 502.08 11311 5678979.202Gubbi 546.00 16388 8947897.6Kunigal 519.73 17221 8950268.656Tiptur 166.64 23003 3833146.298Madhugiri 826.94 13242 10950392.77Kodigenahalli 910.03 6082 5534796.29CSD Sira 741.07 9676 7170570.43RSD Sira 913.14 13801 12602233.31Koratagere 509.60 11468 5844136.619RSD 323.45 12322 3985525.22Anagodu 129.13 10492 1354811.444Jagalur 250.27 10453 2616082.447Changiri 408.88 12501 5111446.607Santhebennur 139.65 9405 1313441.023Honnalli 278.20 14619 4067058.445Harapanahalli 454.61 17996 8181105.71Hosadurga 473.22 14824 7015055.634Hiriyur 613.49 15525 9524493.6TOTAL 32385.81 458069 327976609.7BESCOM 327.98
Name of the Sub -Division
Sep-14Average Ip set consumption
Total No. of IP sets
Assessed IP Consumption
DB Pura 567.63 14129.00 8020001.19
Chapter-7 Page 105

Bangalore Electricity Supply Company Limited Truing up for FY-14 and ARR for FY-16
Kudur 510.33 7061.00 3603424.90Nelmangala 754.64 11454.00 8643619.21Devanahalli 1161.57 12141.00 14102613.83Hosakote 989.69 8548.00 8459885.01Nanadagudi 1582.63 4334.00 6859103.55CPT U 422.01 5512.00 2326110.96CPT R 505.49 10080.00 5095366.93KKP U 597.33 10501.00 6272538.66KKP R 1359.94 4430.00 6024547.06Satnur 677.92 4613.00 3127267.57Attibele 650.08 5164.00 3357013.47Chandapura 1089.48 2825.00 3077768.03Anekal 738.18 4266.00 3149089.24Kolar USD 127.84 4187.00 535266.08Kolar RSD 4688.91 17047.00 79931920.14Srinivasapura 791.02 14030.00 11098007.55Malur 687.38 15507.00 10659231.06USD Sidlaghatta 1359.33 6232.00 8471338.77RSD Sidlaghatta 1193.23 10656.00 12715072.02CBP U 889.93 8499.00 7563491.20CBP R 0.00 9734.00 0.00Gowribidanur 787.26 12350.00 9722710.60Bagepally 1054.47 13434.00 14165716.82Gudibande 434.46 8547.00 3713290.01CSD 1 163.53 4672.00 764032.00CSD 2 495.09 1405.00 695600.00RSD 1 757.97 10682.00 8096632.12RSD 2 517.86 11311.00 5857460.49Gubbi 565.26 16388.00 9263446.20Kunigal 432.55 17221.00 7449027.47Tiptur 160.50 22076.00 3543282.69Madhugiri 829.53 13242.00 10984665.71Kodigenahalli 990.41 6089.00 6030580.90CSD Sira 836.60 9676.00 8094899.30RSD Sira 954.06 13803.00 13168874.02Koratagere 670.48 11469.00 7689779.20RSD 282.52 12367.00 3493879.61Anagodu 135.41 10492.00 1420710.41Jagalur 281.77 10454.00 2945637.96Changiri 87.20 12507.00 1090603.31Santhebennur 188.57 9416.00 1775534.56Honnalli 450.89 14619.00 6591516.61Harapanahalli 406.23 17996.00 7310482.45Hosadurga 462.08 14835.00 6854923.04Hiriyur 644.90 15525.00 10012099.80TOTAL 33934.14 481526.00 363828061.68BESCOM 363.83
From the above tables, it can be seen that the number of IP set installations have varied over the
months. The details are inconsistent. In this regard, the approved specific consumption of 8284
units /installation/annum is considered for projecting IP sales.
Chapter-7 Page 106
Bangalore Electricity Supply Company Limited Truing up for FY-14 and ARR for FY-16
The specific consumption of 8284 units /installation/annum approved by the Commission in its
Tariff Order 2014 is considered for computing IP sales. Based on the actual number of Installations
for FY-14 and the estimated number of IP sets for FY-15, the mid year number of installations is
determined for FY-15. The mid year figure multiplied with the Commission approved specific
consumption is computed and shown in the table below:
Particulars FY-13 FY-14 FY-15 (half yearly) FY-15Installations 652209 691785 708150 714150Sales MU 5726 5238Avg Consumption in units /installation/annum 8778.98 7571.85Mid year installation for FY-15 702968Approved Specific Consumption in units /installation/annum 8284Sales MU (as per appd. Sp. consumption) 5823.38
BJ/KJ Sales:
The details of BJ/KJ installations for FY-15 (upto Sept-15) are shown in the table below.
ParticularsNo. of
installationsFY-15 Half yearly
Consumption in MUAvg. consumption per installation per month
Consumption for the full year FY-15
Installations consuming less than 18 units
608296 45 12.33 89.98
Installations consuming more than 18 units
158686 23 23.74 45.20
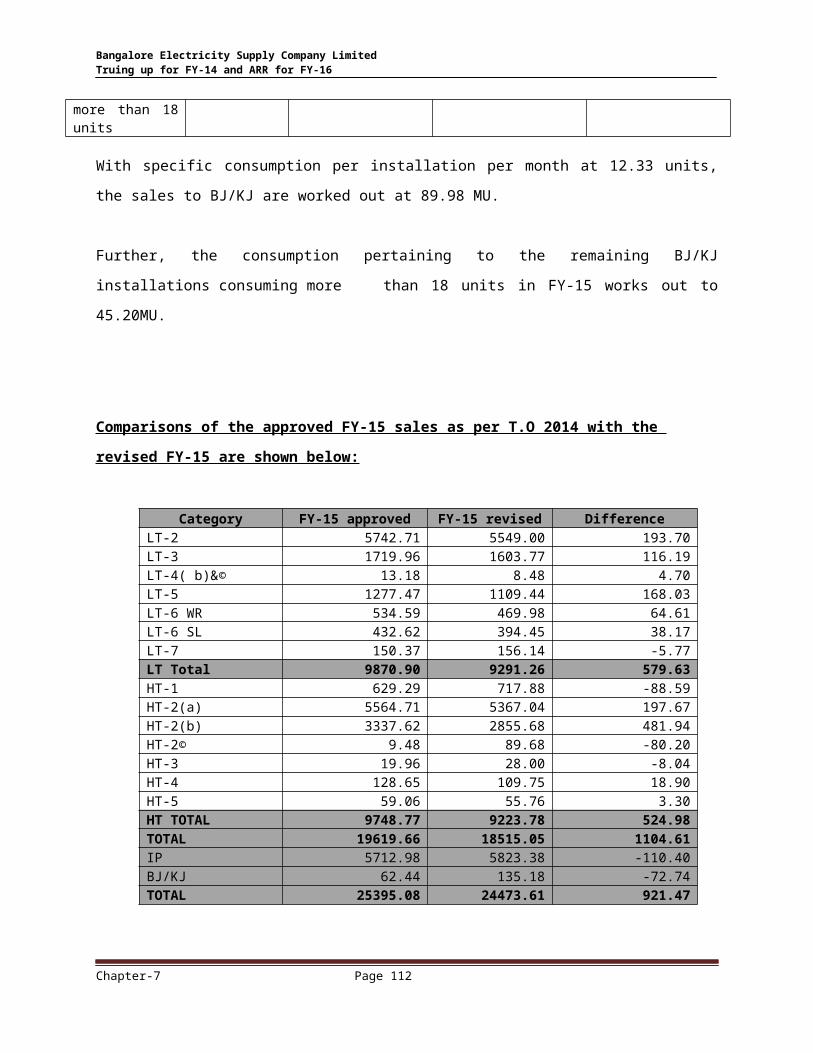
With specific consumption per installation per month at 12.33 units, the sales to BJ/KJ are worked
out at 89.98 MU.
Further, the consumption pertaining to the remaining BJ/KJ installations consuming more than 18
units in FY-15 works out to 45.20MU.
Comparisons of the approved FY-15 sales as per T.O 2014 with the revised FY-15 are shown
below:
Category FY-15 approved FY-15 revised Difference
Chapter-7 Page 107

Bangalore Electricity Supply Company Limited Truing up for FY-14 and ARR for FY-16
LT-2 5742.71 5549.00 193.70LT-3 1719.96 1603.77 116.19LT-4( b)&© 13.18 8.48 4.70LT-5 1277.47 1109.44 168.03LT-6 WR 534.59 469.98 64.61LT-6 SL 432.62 394.45 38.17LT-7 150.37 156.14 -5.77LT Total 9870.90 9291.26 579.63HT-1 629.29 717.88 -88.59HT-2(a) 5564.71 5367.04 197.67HT-2(b) 3337.62 2855.68 481.94HT-2© 9.48 89.68 -80.20HT-3 19.96 28.00 -8.04HT-4 128.65 109.75 18.90HT-5 59.06 55.76 3.30HT TOTAL 9748.77 9223.78 524.98TOTAL 19619.66 18515.05 1104.61IP 5712.98 5823.38 -110.40BJ/KJ 62.44 135.18 -72.74TOTAL 25395.08 24473.61 921.47
For projecting sales for FY-16, the revised FY-15 figures are considered.
The CAGR details of 5 years, 4 years, 3 years, 2 years and one year growth are shown in the table
below:
Category CAGR for 5 yrs CAGR for 4yrs CAGR for 3yrs CAGR for 2yrs One year growthLT-2 9.7% 7.1% 6.8% 5.8% 5.8%LT-3 9.3% 7.7% 6.4% 4.4% 4.4%LT-4 b&c 2.2% -3.9% -6.9% -9.2% 0.0%LT-5 4.0% 3.0% 2.0% -0.7% 0.0%LT-6 I 5.9% 3.7% 0.7% 0.6% 0.6%LT-6 II 5.4% 2.5% -0.6% -1.3% 0.0%LT-7 11.2% 13.7% 7.2% 5.7% 5.7%HT-1 8.0% 10.5% 13.5% 17.1% 17.1%HT-2(A) 9.0% 8.3% 7.1% 5.9% 5.9%HT-2(B) 5.5% 4.6% 2.6% -0.9% 0.0%HT-2(C) 0.0% 0.0% 0.0% 0.0% 0.0%HT-3 70.9% 98.6% 63.8% 54.9% 203.7%HT-4 3.3% 0.9% -2.4% -4.5% 0.0%HT-5 0.0% 0.0% 0.0% 66.3% 18.9%
After bearing in mind the sales growth during FY-14, it is unlikely that BESCOM should go for an
optimistic approach for projecting sales for FY-16. From the above table it can be seen that CAGR
for 3 years is best situated for projection as it is neither optimistic nor pessimistic.
Chapter-7 Page 108
Bangalore Electricity Supply Company Limited Truing up for FY-14 and ARR for FY-16
After considering 3 year CAGR, the sales for FY-16 for metered categories are projected in the
below table. Wherever there is negative CAGR, sales of FY-15 are retained. For HT-5 category which
was introduced during Tariff Order 2013, one year growth rate is considered for projection.
Similarly, HT2c category was introduced during Tariff Order 2013, the installations coming under
HT2c were earlier projected under HT-1, HT2a and HT-4. Since there is no clear growth rate for
this category it is assumed that the growth projected in the other categories will take care of HT2c
category growth also. Hence, the consumption of FY-15 is retained for FY-16 also under HT2c
category.
IP sales:
The specific consumption of 8284 units /installation/annum approved by the Commission in its
Tariff Order 2014 is considered for computing IP sales. Adding 15000 installations to FY-15 the
estimated number of IP sets for FY-16 is 729150, the mid year number of installations is
determined for FY-16. To this mid year figure approved specific consumption is multiplied to
compute the sales for FY-16 as shown in the table below:
Particulars FY-15 FY-16
Installations 714150 729150Midyear installation for FY-16 721650Approved Specific Consumption in units /installation/annum 8284Sales MU (as per appd. Sp. consumption) 6040.28
BJ/KJ Sales:
The number of BJ/KJ installations of FY-15 are retained the same for FY-16 as there are no
Government schemes regarding the same. The sales are also retained the same as shown in the
table below.
ParticularsNo. of
installationsAvg. consumption per installation per month
Consumption for FY-16
Installations consuming less than 18 units 608296 12 89.98Installations consuming more than 18 units
158686 24 45.20
With specific consumption per installation per month at 12.33 units, the sales to BJ/KJ are worked out at
89.98 MU.
Chapter-7 Page 109
Bangalore Electricity Supply Company Limited Truing up for FY-14 and ARR for FY-16
Further, the consumption pertaining to the remaining BJ/KJ installations consuming more than 18 units in
FY-16 works out to 45.20MU.
Category FY-15 CAGR for 3yrs FY-16LT-2 5549.00 6.8% 5924.99LT-3 1603.77 6.4% 1705.63LT-4( b)&© 8.48 -6.9% 8.48LT-5 1109.44 2.0% 1132.12LT-6 WR 469.98 0.7% 473.21LT-6 SL 394.45 -0.6% 394.45LT-7 156.14 7.2% 167.43LT Total 9291.26 9806.31HT-1 717.88 13.5% 814.59HT-2(a) 5367.04 7.1% 5750.45HT-2(b) 2855.68 2.6% 2928.82HT-2© 89.68 0.0% 89.68HT-3 28.00 63.8% 45.86HT-4 109.75 -2.4% 109.75HT-5 55.76 18.9% 66.30HT TOTAL 9223.78 9805.45BJ/KJ 135.18 135.18IP 5823.38 6040.28TOTAL 24473.61 25787.22
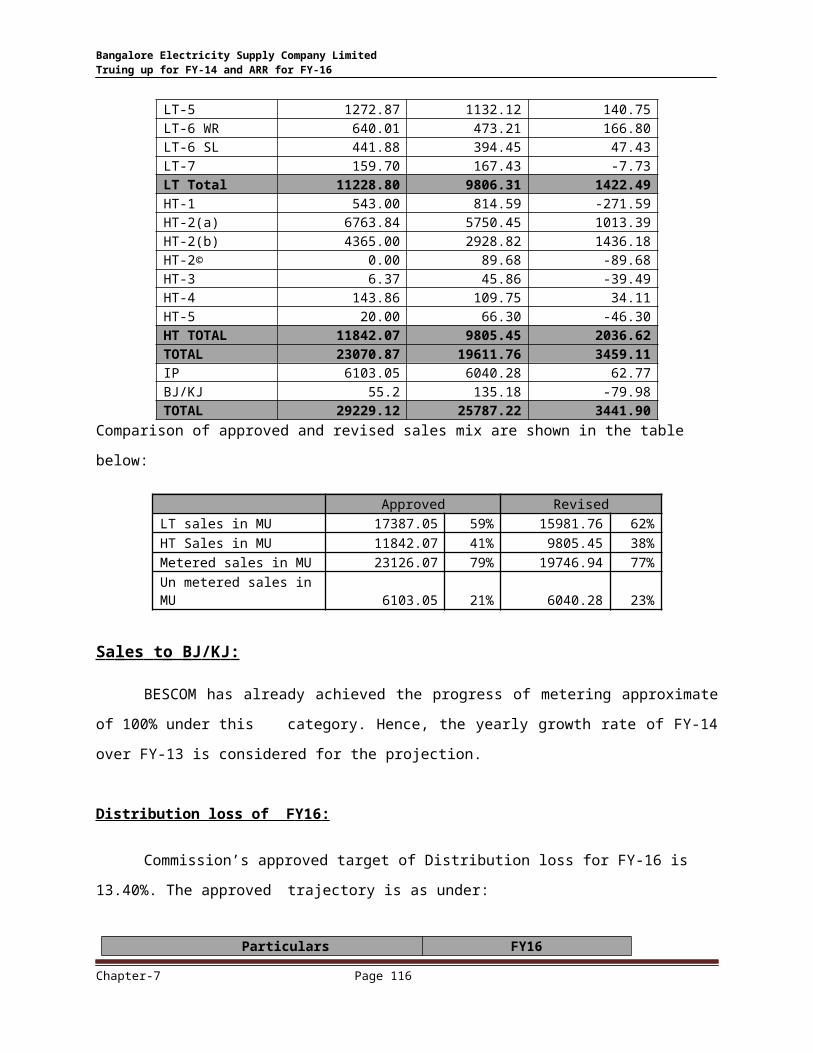
After revising the sale for FY-16 the comparison of approved and revised sales are as under:
Category FY-16 approved FY-16 revised Difference
LT-2 6610.96 5924.99 685.97LT-3 2083.36 1705.63 377.73LT-4( b)&© 20.02 8.48 11.54LT-5 1272.87 1132.12 140.75LT-6 WR 640.01 473.21 166.80LT-6 SL 441.88 394.45 47.43LT-7 159.70 167.43 -7.73LT Total 11228.80 9806.31 1422.49HT-1 543.00 814.59 -271.59HT-2(a) 6763.84 5750.45 1013.39HT-2(b) 4365.00 2928.82 1436.18HT-2© 0.00 89.68 -89.68HT-3 6.37 45.86 -39.49HT-4 143.86 109.75 34.11HT-5 20.00 66.30 -46.30HT TOTAL 11842.07 9805.45 2036.62TOTAL 23070.87 19611.76 3459.11IP 6103.05 6040.28 62.77BJ/KJ 55.2 135.18 -79.98TOTAL 29229.12 25787.22 3441.90
Comparison of approved and revised sales mix are shown in the table below:
Approved Revised
Chapter-7 Page 110

Bangalore Electricity Supply Company Limited Truing up for FY-14 and ARR for FY-16
LT sales in MU 17387.05 59% 15981.76 62%HT Sales in MU 11842.07 41% 9805.45 38%Metered sales in MU 23126.07 79% 19746.94 77%Un metered sales in MU 6103.05 21% 6040.28 23%
S a les t o B J / K J :
BESCOM has already achieved the progress of metering approximate of 100% under this
category. Hence, the yearly growth rate of FY-14 over FY-13 is considered for the projection.
Distribution loss of F Y 16 :
Commission’s approved target of Distribution loss for FY-16 is 13.40%. The approved
trajectory is as under:
Particulars FY16Upper limit 13.60
Average limit 13.40Lower limit 13.20
BESCOM is retaining the distribution loss of 13.40% for FY-16.
Ene r gy R e qu ir e m ent for FY-16:
Based on the modified sales of FY-16 and considering the approved level of distribution
loss and transmission loss, Energy requirement is modified as under:
Est imated E nergy requirement For FY-16:
Po w er P u r cha s e:
ENERGY AVAILABILITY & COST FOR 2015-16
Chapter-7 Page 111
Particulars UnitFY-16
Approved RevisedEstimated Sales MUs 29229 25787Percentage distribution losses % 13.4 13.4Energy at interface point MUs 33752 29777Percentage transmission losses % 3.90 3.90Total energy requirement MUs 35122 30986
Bangalore Electricity Supply Company Limited Truing up for FY-14 and ARR for FY-16
1.0 The energy required by the ESCOMs for Financial year 2015-16 is 63436.83 MUs
considering transmission losses of 3.90 %/3.81%. The ESCOMwise energy requirement is shown
below:
ESCOMs Energy requirement in MUsBESCOM 30985.83GESCOM 8145.13HESCOM 11980.53MESCOM 5274.31CESC,Mysore 7051.03Total 63436.83
2.0. Energy being purchased by ESCOMs from different sources viz KPCL Hydel, Thermal, CGS,
IPPs, NCE projects and others through medium / short term purchases.
2.1. Hydro and Thermal Stations of KPCL
The details of Energy availability of hydel and Thermal stations for the year 2015-16 furnished
by KPCL is considered except Yermarus project. The KPCL considering the anticipated inflows
based on ten years moving average less by 1% auxiliary consumption as per PPA in respect of hydel
stations and in respect of thermal stations , energy availability is as per the targeted availability
defined in the PPA . The energy projection for Yermarus TPS considered from October-2015 to
March -2016.
2.2. The KPCL has furnished details of projects likely to be commissioned during 2015-16 is shown
below:
Project Name Year of commissionBTPS Unit -3( 700 MW) 2015-16Yermarus TPS Unit 1 & 2(800 MWX2)
2015-16
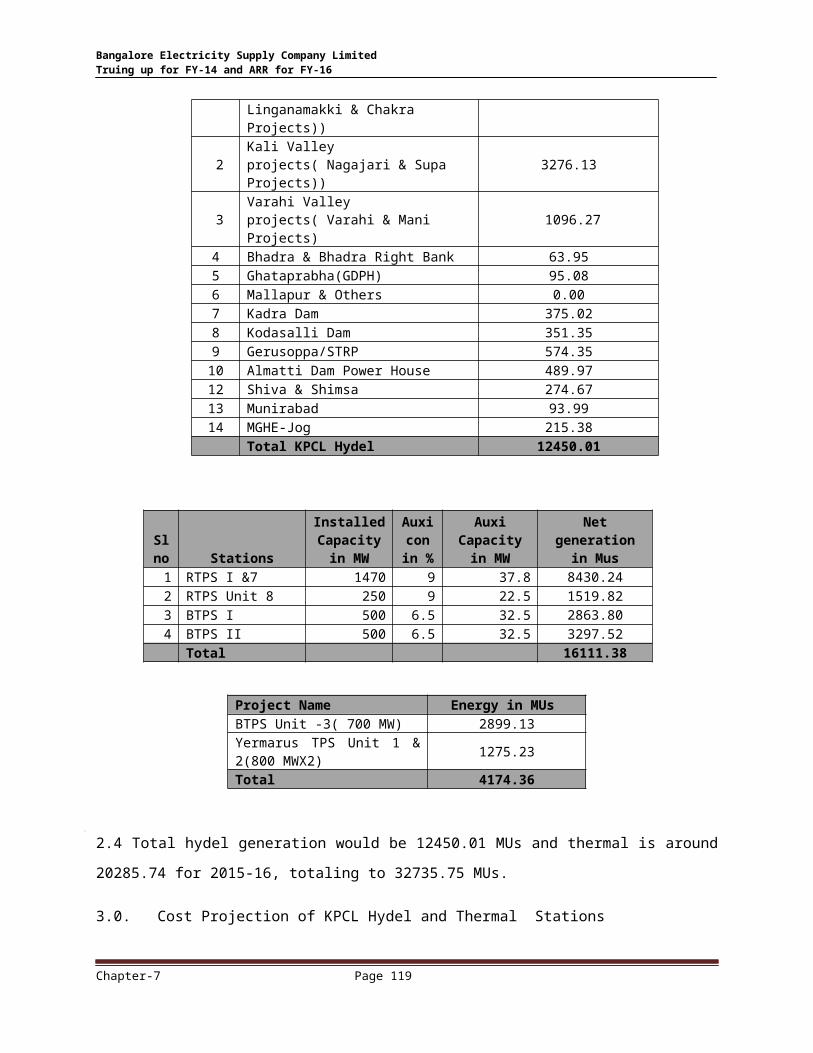
2.3. The availability of hydel & Thermal energy details furnished by KPCL as shown in the below
tables
1Sharavathy valley project( Sharavathy, Linganamakki & Chakra Projects))
5543.85
Chapter-7 Page 112

Bangalore Electricity Supply Company Limited Truing up for FY-14 and ARR for FY-16
2Kali Valley projects( Nagajari & Supa Projects))
3276.13
3Varahi Valley projects( Varahi & Mani Projects)
1096.27
4 Bhadra & Bhadra Right Bank 63.955 Ghataprabha(GDPH) 95.086 Mallapur & Others 0.007 Kadra Dam 375.028 Kodasalli Dam 351.359 Gerusoppa/STRP 574.35
10 Almatti Dam Power House 489.9712 Shiva & Shimsa 274.6713 Munirabad 93.9914 MGHE-Jog 215.38
Total KPCL Hydel 12450.01
Sl no Stations
Installed Capacity in
MW
Auxi con
in %
Auxi Capacity in
MWNet generation
in Mus1 RTPS I &7 1470 9 37.8 8430.24
2 RTPS Unit 8 250 9 22.5 1519.82
3 BTPS I 500 6.5 32.5 2863.80
4 BTPS II 500 6.5 32.5 3297.52
Total 16111.38
Project Name Energy in MUsBTPS Unit -3( 700 MW) 2899.13Yermarus TPS Unit 1 & 2(800 MWX2)
1275.23
Total 4174.36
[[
2.4 Total hydel generation would be 12450.01 MUs and thermal is around 20285.74 for 2015-16,
totaling to 32735.75 MUs.
3.0. Cost Projection of KPCL Hydel and Thermal Stations
Hydel Stations:
Chapter-7 Page 113

Bangalore Electricity Supply Company Limited Truing up for FY-14 and ARR for FY-16
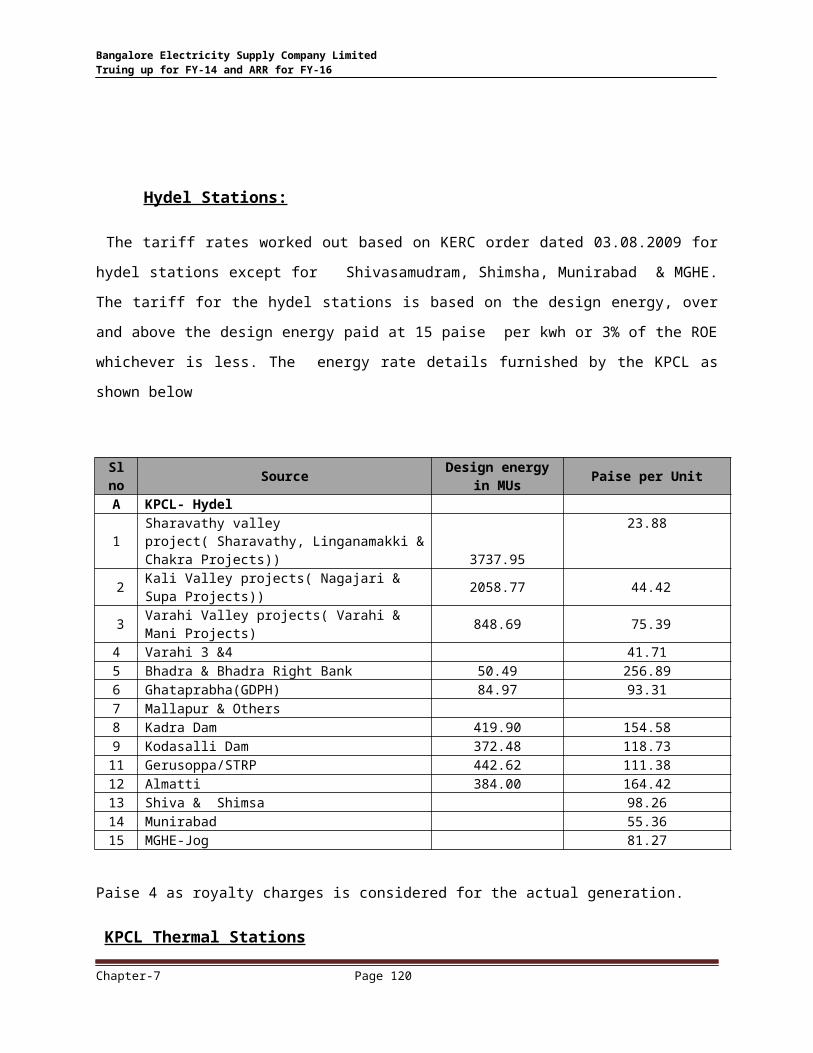
The tariff rates worked out based on KERC order dated 03.08.2009 for hydel stations except for
Shivasamudram, Shimsha, Munirabad & MGHE. The tariff for the hydel stations is based on the
design energy, over and above the design energy paid at 15 paise per kwh or 3% of the ROE
whichever is less. The energy rate details furnished by the KPCL as shown below
Sl no Source
Design energy in MUs Paise per Unit
A KPCL- Hydel
1Sharavathy valley project( Sharavathy, Linganamakki & Chakra Projects)) 3737.95
23.88
2 Kali Valley projects( Nagajari & Supa Projects)) 2058.77 44.42 3 Varahi Valley projects( Varahi & Mani Projects) 848.69 75.394 Varahi 3 &4 41.715 Bhadra & Bhadra Right Bank 50.49 256.896 Ghataprabha(GDPH) 84.97 93.317 Mallapur & Others8 Kadra Dam 419.90 154.589 Kodasalli Dam 372.48 118.73
11 Gerusoppa/STRP 442.62 111.3812 Almatti 384.00 164.4213 Shiva & Shimsa 98.2614 Munirabad 55.3615 MGHE-Jog 81.27
Paise 4 as royalty charges is considered for the actual generation.
KPCL Thermal Stations
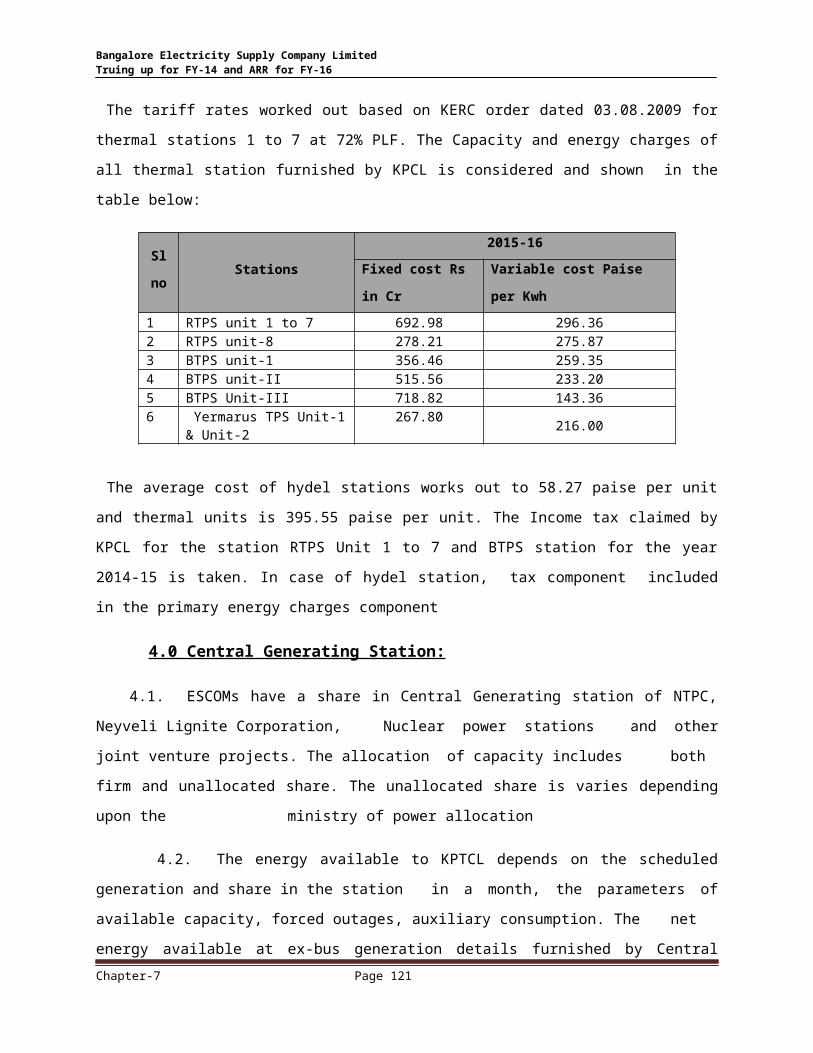
The tariff rates worked out based on KERC order dated 03.08.2009 for thermal stations 1 to 7 at
72% PLF. The Capacity and energy charges of all thermal station furnished by KPCL is considered
and shown in the table below:
Sl
noStations
2015-16
Fixed cost Rs in Cr Variable cost Paise per Kwh
1 RTPS unit 1 to 7 692.98 296.362 RTPS unit-8 278.21 275.873 BTPS unit-1 356.46 259.354 BTPS unit-II 515.56 233.205 BTPS Unit-III 718.82 143.366 Yermarus TPS Unit-1 &
Unit-2267.80
216.00
Chapter-7 Page 114

Bangalore Electricity Supply Company Limited Truing up for FY-14 and ARR for FY-16
The average cost of hydel stations works out to 58.27 paise per unit and thermal units is 395.55
paise per unit. The Income tax claimed by KPCL for the station RTPS Unit 1 to 7 and BTPS station
for the year 2014-15 is taken. In case of hydel station, tax component included in the primary
energy charges component
4.0 Central Generating Station:
4.1. ESCOMs have a share in Central Generating station of NTPC, Neyveli Lignite Corporation,
Nuclear power stations and other joint venture projects. The allocation of capacity includes
both firm and unallocated share. The unallocated share is varies depending upon the
ministry of power allocation
4.2. The energy available to KPTCL depends on the scheduled generation and share in the station
in a month, the parameters of available capacity, forced outages, auxiliary consumption. The
net energy available at ex-bus generation details furnished by Central Generating Stations
to CEA for preparation of LGBR for the year 2014-15 is considered for energy available for
2015-16. Out of which the share of allocation including allocated for the month of October-
2014 is considered for Karnataka share. In order to arrive energy available at Karnataka
Periphery, POC loss of injection state/project and withdrawal state for the week 11.11.2014
to 17.11.2014 as notified by the NLDC is taken. The schedule energy available at ex-bus
and share of Karnataka is shown below table.
Sl no StationsTotal Energy
scheduled at EX-bus in MUs
Share of Karnatak
a in %
Karnataka Share in MUs
1 RSTP-I&II 15048.00 20.32 3057.752 RSTP-III 3579.00 21.91 784.163 RSTP-Talcher 14230.00 19.34 2752.084 Simhadri station I & II 6828.00 21.37 1459.145 Vallur unit-I & II 6118.00 8.74 534.716 NLC II Stage-1 3351.00 20.39 683.277 NLC II Stage-2 4674.00 20.69 967.058 NLC expansion I 2701.00 26.49 715.499 NLC expansion Stage II ( Unit-1) 1569.94 25.88 406.30
10 Tuticorn Unit-2X 500 Mw 2051.55 25.88 530.9411 MAPS 2552.00 7.26 185.2812 Kaiga Unit-1& 2 2526.00 27.00 682.0213 Kaiga Unit-3&4 2662.00 29.50 785.2914 Kudamkulam Unit-1 & II 6111.00 26.00 1588.86
Chapter-7 Page 115
Bangalore Electricity Supply Company Limited Truing up for FY-14 and ARR for FY-16
Net energy available at KPTCL periphery after considering the POC losses is shown in this table
Stations
Energy scheduled
@ generators
Ex-busin MUs
Injection loss in
%
withdrawl loss in %
Injection state POC
loss in Mus
Energy scheduled
after Injection state loss
withdrawal state POC
loss in Mus
Energy @ KPTCL
periphery
N.T.P.C-RSTP-I&II 3057.75 1.71 2.31 52.29 3005.47 69.43 2936.04NTPC-III 784.16 1.71 2.31 13.41 770.75 17.80 752.95NTPC-Talcher 2752.08 2.31 2.31 63.57 2688.51 62.10 2626.40NLC TPS2-Stage 1 683.27 1.71 2.31 11.68 671.59 15.51 656.07NLC TPS2-Stage 2 967.05 1.71 2.31 16.54 950.51 21.96 928.56NLC TPS1-Expn 715.49 1.71 2.31 12.23 703.26 16.25 687.01NLC II expansion I 406.30 1.71 2.31 6.95 399.35 9.23 390.13MAPS 185.28 1.71 2.31 3.17 182.11 4.21 177.90Kaiga Unit 1&2 682.02 1.71 2.31 11.66 670.36 15.49 654.87Kaiga Unit 3 &4 785.29 1.71 2.31 13.43 771.86 17.83 754.03Simhadri Unit -1 &2 1459.14 2.01 2.31 29.33 1429.81 33.03 1396.79Tuticorn Unit-2X 500 Mw
530.94 1.71 2.31 9.08 521.86 12.05 509.81
KudamKulam 1588.86 1.71 2.31 27.17 1561.69 36.08 1525.62Vallur TPS Stage I &2 &3
534.71 1.71 2.31 9.14 525.57 12.14 513.43
Total 14509.60
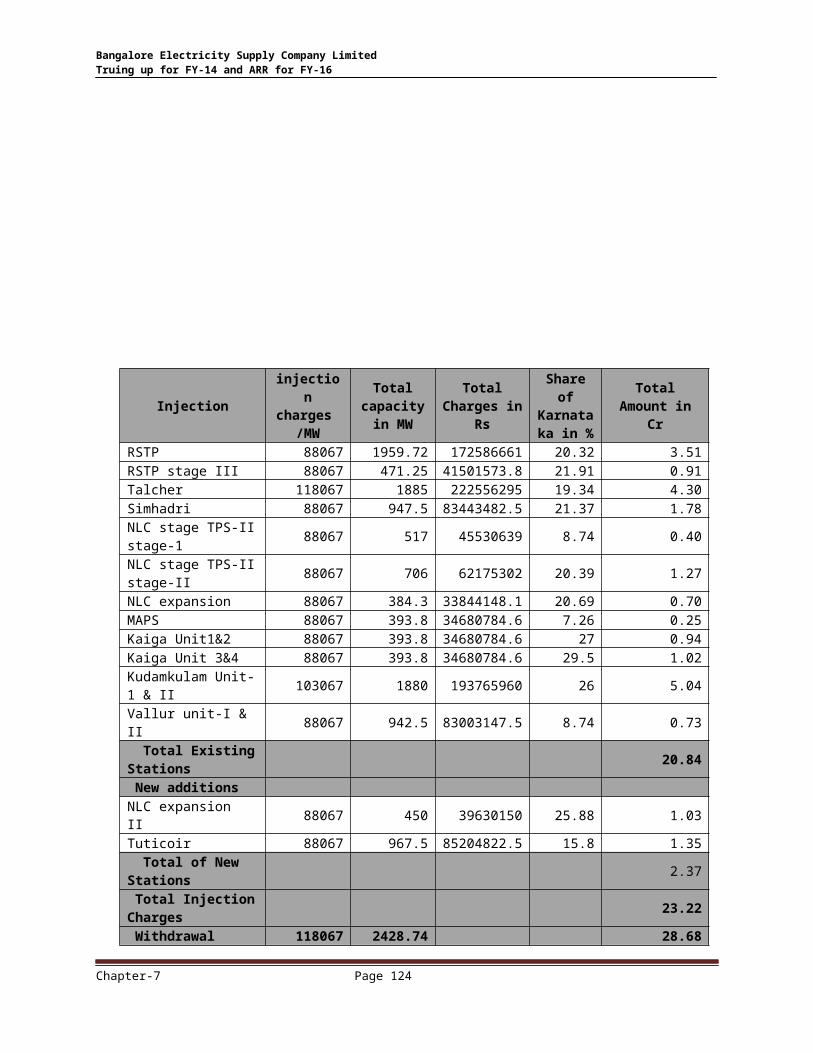
4.3. The power drawal from the Central Sector Generating Stations is through the PGCIL lines to
all the states in the Region. ESCOMs pay Transmission charges to PGCIL for Transmitting
the CGS power. The POC charges for the quarter October-2014 to December -2014 notified
by the CERC is considered for payment of transmission charge to PGCIL for 2015-16. The
total transmission charges payable by ESCOMs for the year 2015-16 is Rs 622 crore, the
details as shown in table below. The SRLDC POSOCO charges of Rs 3 crore is taken for
2015-16
Chapter-7 Page 116

Bangalore Electricity Supply Company Limited Truing up for FY-14 and ARR for FY-16
Injectioninjection charges
/MW
Total capacity in
MW
Total Charges in
Rs
Share of Karnatak
a in %
Total Amount in Cr
RSTP 88067 1959.72 172586661 20.32 3.51RSTP stage III 88067 471.25 41501573.8 21.91 0.91Talcher 118067 1885 222556295 19.34 4.30Simhadri 88067 947.5 83443482.5 21.37 1.78NLC stage TPS-II stage-1
88067 517 45530639 8.74 0.40
NLC stage TPS-II stage-II
88067 706 62175302 20.39 1.27
NLC expansion 88067 384.3 33844148.1 20.69 0.70MAPS 88067 393.8 34680784.6 7.26 0.25Kaiga Unit1&2 88067 393.8 34680784.6 27 0.94Kaiga Unit 3&4 88067 393.8 34680784.6 29.5 1.02Kudamkulam Unit-1 & II
103067 1880 193765960 26 5.04
Vallur unit-I & II 88067 942.5 83003147.5 8.74 0.73 Total Existing Stations 20.84
New additionsNLC expansion II 88067 450 39630150 25.88 1.03Tuticoir 88067 967.5 85204822.5 15.8 1.35 Total of New Stations 2.37
Total Injection Charges 23.22
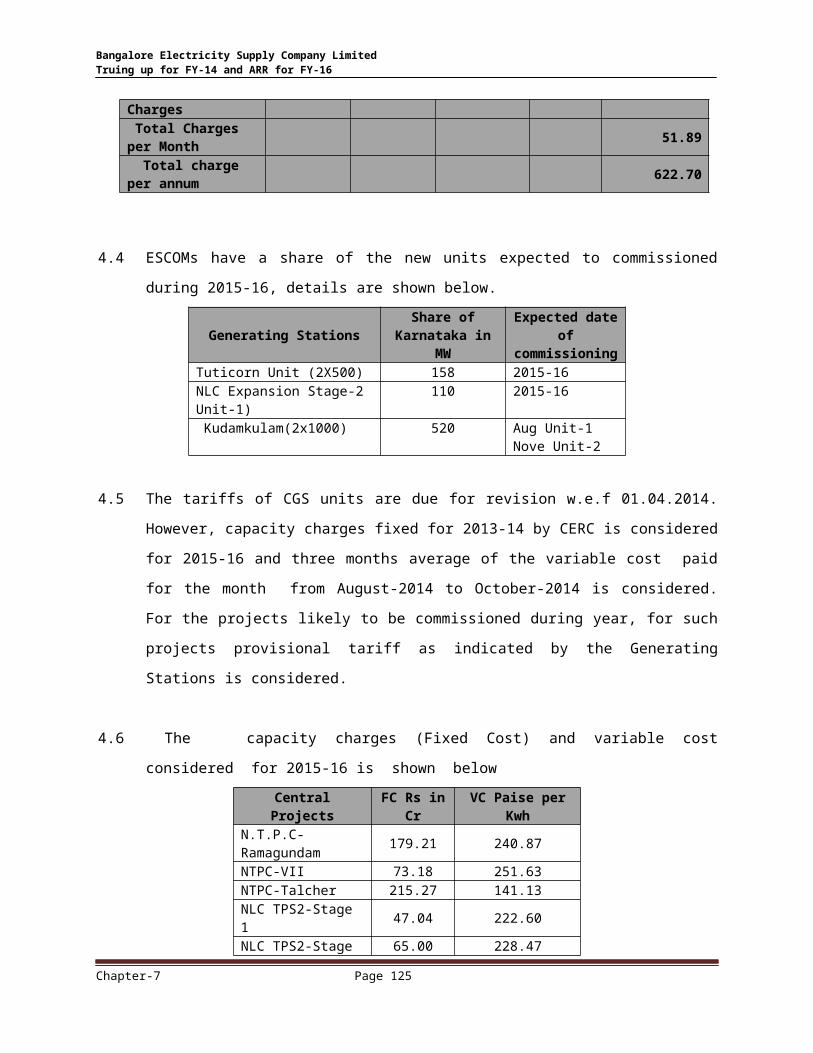
Withdrawal Charges 118067 2428.74 28.68 Total Charges per Month 51.89
Total charge per annum 622.70
4.4 ESCOMs have a share of the new units expected to commissioned during 2015-16, details
are shown below.
Generating StationsShare of
Karnataka in MWExpected date of commissioning
Tuticorn Unit (2X500) 158 2015-16NLC Expansion Stage-2 Unit-1) 110 2015-16 Kudamkulam(2x1000) 520 Aug Unit-1
Nove Unit-2
Chapter-7 Page 117

Bangalore Electricity Supply Company Limited Truing up for FY-14 and ARR for FY-16
4.5 The tariffs of CGS units are due for revision w.e.f 01.04.2014. However, capacity charges
fixed for 2013-14 by CERC is considered for 2015-16 and three months average of the
variable cost paid for the month from August-2014 to October-2014 is considered. For the
projects likely to be commissioned during year, for such projects provisional tariff as
indicated by the Generating Stations is considered.
4.6 The capacity charges (Fixed Cost) and variable cost considered for 2015-16 is shown
below
Central Projects FC Rs in Cr VC Paise per KwhN.T.P.C-Ramagundam 179.21 240.87NTPC-VII 73.18 251.63NTPC-Talcher 215.27 141.13NLC TPS2-Stage 1 47.04 222.60NLC TPS2-Stage 2 65.00 228.47NLC TPS1-Expn 93.80 209.67NLC II Expansion-1 107.26 202.00MAPS 205.91Kaiga unit I &II 302.00Kaiga Unit 3 &4 302.00Simhadri Unit -1 &2 252.22 256.76 KudamKulam 425.00 Vallur TPS 108.72 199.90Tuticorn 112.03 251.00
Income tax for the CGS station included in the capacity charges payment as per CERC 2009-
14 regulation( capacity charges for 2013-14 is taken) and hence not considered, In case of
Nuclear stations, income tax is considered, since tariff does not include the tax component.
5.0. Independent Power Producers
5.1. The generation of 1200 MW of UPCL unit 1 & unit-2 taken at 85% of 90% installed capacity
as per PPA. The auxiliary consumption of 7.2 % fixed in the CERC order dated 20.02.2014
is Taken. The capacity charges determined by CERC for 2013-14 and actual variable cost
paid for three months from August-2014 to October 2014 is considered. The energy and
cost details are shown below.
Stations Energy in Mus Fixed cost Rs in Cr Variable cost Paise per Kwh
UPCL 7462.68 1278.12 258.08
Chapter-7 Page 118
Bangalore Electricity Supply Company Limited Truing up for FY-14 and ARR for FY-16
6.0. Non conventional Energy Source:
6.1. The actual generation of NCE projects for the year 2013-14 has been considered including
cogeneration and Bio-mass projects.
6.2. Expected to commissioning projects based on the details furnished by the M/s KREDL.
However, PLF for the energy calculation is as per the KERC order dated 11.12.2009.
6.3. 130 MW wind projects of NTPC likely to be commissioned during 2015-16 in the area of
Maduragudda and Guledaguddad. The availability of energy is based on CERC CUF PLF.
6.4. KREDL has finalized tender for solar power , the PLF is based KERC is considered to arrive
energy.
6.4. ESCOMwise NCE energy projected for FY 2011-12 is shown in Table
(Energy in MUs)
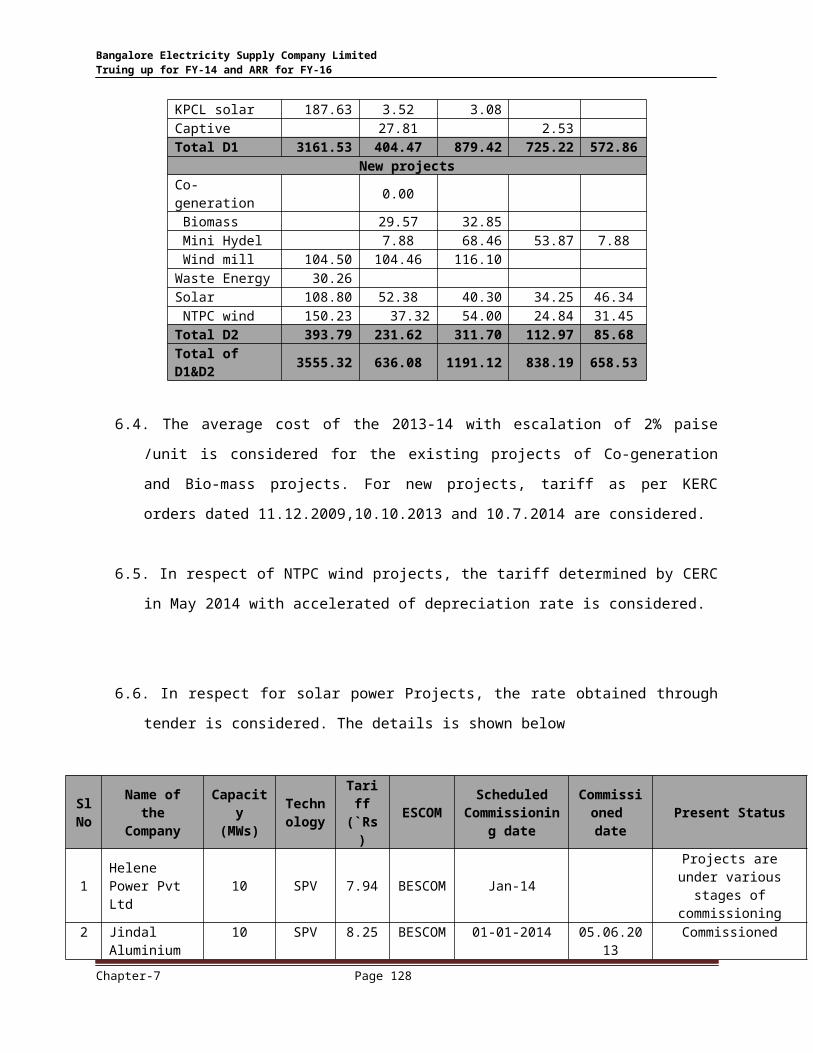
Minor IPPS BESCOM GESCOM HESCOM MESCOM CESCOld projectsCo-generation 13.02 95.12 0.00 63.26 Biomass 52.92 41.03 0.00 4.37 1.73 Mini Hydel 492.63 155.01 52.59 397.11 283.60 Wind mill 2414.84 164.08 728.63 321.21 224.26KPCL wind mill 13.51KPCL solar 187.63 3.52 3.08Captive 27.81 2.53Total D1 3161.53 404.47 879.42 725.22 572.86
New projectsCo-generation 0.00 Biomass 29.57 32.85 Mini Hydel 7.88 68.46 53.87 7.88 Wind mill 104.50 104.46 116.10Waste Energy 30.26Solar 108.80 52.38 40.30 34.25 46.34 NTPC wind 150.23 37.32 54.00 24.84 31.45Total D2 393.79 231.62 311.70 112.97 85.68Total of D1&D2 3555.32 636.08 1191.12 838.19 658.53
Chapter-7 Page 119
Bangalore Electricity Supply Company Limited Truing up for FY-14 and ARR for FY-16
6.4. The average cost of the 2013-14 with escalation of 2% paise /unit is considered for the
existing projects of Co-generation and Bio-mass projects. For new projects, tariff as per
KERC orders dated 11.12.2009,10.10.2013 and 10.7.2014 are considered.
6.5. In respect of NTPC wind projects, the tariff determined by CERC in May 2014 with
accelerated of depreciation rate is considered.
6.6. In respect for solar power Projects, the rate obtained through tender is considered. The
details is shown below
Sl No
Name of the Company
Capacity(MWs)
Technology
Tariff(`Rs)
ESCOMScheduled
Commissioning date
Commissioned date
Present Status
1Helene Power Pvt Ltd
10 SPV 7.94 BESCOM Jan-14Projects are under various stages of commissioning
2Jindal Aluminium Ltd
10 SPV 8.25 BESCOM 01-01-2014 05.06.2013 Commissioned
3ESSEL Infrastructure Ltd.
5 SPV 8.37 HESCOM 01-01-2014 30.07.2014Projects are under various stages of commissioning
4ESSEL Infrastructure Ltd.
5 SPV 8.46 HESCOM 01-01-2014 30.07.2014Projects are under various stages of commissioning
5GKC Projects Limited
10 SPV 8.46 GESCOM 01-01-2014 30.08.2014Projects are under various stages of commissioning
6SaiSudhir Energy Ltd
10 SPV 8.49 CESC 01-01-2014Projects are under various stages of commissioning
7United Telecoms Limited
3 SPV 8.46 BESCOM 01-01-2014 28.08.2014Projects are under various stages of commissioning
8Welspun Solar Kannada Pvt Ltd
7 SPV 8.50MESCO
M01-01-2014 09.12.2013 Commissioned
9Atria Power Corpration Ltd
10 ST 11.32 GESCOM 01-01-2015 1.01.2015Projects are under various stages of commissioning
Total 70
Chapter-7 Page 120
Bangalore Electricity Supply Company Limited Truing up for FY-14 and ARR for FY-16
Phase-II: 70MW Solar Power:
Sl No
Name of the Company Capacity
Technology
Tariff(Rs) ESCOM
Scheduled Commissionin
g date
Present Status
1
Sharda Construction and
6 SPV 6.93 GESCOM
Expected to commission by
Aug 2015 Signed PPACorporation Private Ltd
2Bhoruka Power Corporation
10 SPV 7.16 BESCOMcommissioned
Signed PPALimited on 12.11.2014
3
Waa Solar Private Limited_Tumkur1 5 SPV 7.2 CESC 24.04.2015 Signed PPA
4
Waa Solar Private Limited_Tumkur2 5 SPV 7.47 CESC 24.04.2015 Signed PPA
5Azure Power Karnataka
10 SPV 7.47 BESCOM
Expected to commission by
Aug 2015 Signed PPAPrivate Limited
6Hero Future Energies Pvt Ltd 10 SPV 7.47 HESCOM 18.08.2015 Signed PPA
7 Raghu Infra Pvt Ltd 3 SPV 7.85 CESC
Expected to commission by
Aug 2015 Signed PPA
8 United Telecoms Ltd 3 SPV 7.92 BESCOM
Expected to commission by
Aug 2015 Signed PPA
9ESD Builders and Developers
3 SPV 7.98 BESCOM
Expected to commission by
Aug 2015 Signed PPAPrivate Limited
10Welspun Solar Kannada
10 SPV 8.05 MESCOM 11.04.2014 CommissionedPrivate Ltd.
11 Heidelberg Solar Pvt Ltd 5 SPV 8.05 BESCOM
Expected to commission by
Aug 2015 Signed PPA
7.0. Jurala:
The 50% of the energy from Jurala Hydro electric Projects for the year 2013-14 is considered for
2015-16. The APERC has approved an amount of Rs.123.78 Crs in Retail Supply Tariff for the FY
2013-14 dated 30.03.2013 is taken.
Particulars Energy in MUs Capacity charges Rs croreJurala Project 135 61.80
Chapter-7 Page 121

Bangalore Electricity Supply Company Limited Truing up for FY-14 and ARR for FY-16
8.0 The T. B. Dam power is a shared power source between AP and Karnataka. For FY 14, the power
purchase from T. B. Dam has been estimated to be 41.07 MUs and 1/5th share of revenue
expenditure is 1.96 crore.
9.0 Medium term power Purchase
PCKL has finalized tender for procurement of 1500 MW power on medium term basis for the
period from 1st August-2013 to 30th June 2015. However, due to non availability of corridor
power availability for the period from April to June 2015 is only 450 MW. The energy at 85% of the
contracted capacity and rate as approved /obtained through tender is considered
Particulars Energy in Mus Rate per unit in Rs
JSWPTC
835.38
5.20
10. Short term power Procurement
BESCOM has entered into agreement for supply power from with M/s Global Energy Private limited
for supply of power from Maharastra ranging power from 100 MW to 150 MW at RS 4.85 per unit. The
energy at 85% of the contracted capacity and rate as approved /obtained through tender is considered
Particulars Energy in Mus Rate per unit in Rs M/s Global Energy Private Limited
244.43 4.85
11. PCKL finalized tender for procurement of power under short term for the period from
November 2014 to June 2015. The energy at 85% of the contracted capacity and rate as
approved /obtained through tender is considered ie Rs 5.50 per unit
Chapter-7 Page 122

Bangalore Electricity Supply Company Limited Truing up for FY-14 and ARR for FY-16
Sl no Generators/Traders source
MW Energy MW Energy MW Energ
y Total
1 M/s Satish Sugars M/s Satish Sugars15 9.18 15 9.49 15 9.18 27.85
2 M/s TATA PowerEID ParrY India Ltd 8.8 5.39 8.8 5.57 0 0.00 10.95
Core Green Sugar & Fuels Pvt Ltd
16 9.79 16 10.12 19 11.63 31.54
3 M/s PTCIL
KPR Sugar Mills Pvt Ltd (KPRML)
18.36 11.24 0 0.00 0 0.00 11.24
Bannari Amman Sugars Ltd
15 9.18 0 0.00 0 0.00 9.18
Sathavahana Ispat Ltd (SIL)
5 3.06 5 3.16 5 3.06 9.28
GEM Sugars Ltd (GSL) 8.5 5.20 8.5 5.38 8.5 5.20 15.78
4 M/s Nirani Sugars Ltd M/s Nirani Sugars Ltd 20 12.24 20 12.65 20 12.24 37.13
5M/s Global Energy Pvt Ltd
Jamakhandi Sugars Ltd Unit-I
12 7.34 0 0.00 0 0.00 7.34
Jamakhandi Sugars Ltd Unit-II
14 8.57 0 0.00 0 0.00 8.57
Indian Sugar Manufacturing Co. Ltd
8.5 5.20 0 0.00 0 0.00 5.20
Shirgappa Sugar Works Ltd
11 6.73 11 6.96 11 6.73 20.42
GM Sugar & Energy Ltd 10 6.12 10 6.32 10 6.12 18.56
Koganthi Power Ltd 6.6 4.04 6.6 4.17 6.6 4.04 12.25
6 M/s Athani Sugars Ltd M/s Athani Sugars Ltd 19 11.63 0 0.00 0 0.00 11.63
7 M/s BMM Ispat LtdM/s BMM Ispat Ltd 70 42.84 70 44.27 0.0 0.00 87.11
M/s BMM Ispat Ltd 0 0.00 0 0.00 100 61.20 61.20
8 M/s Dhruvadesh Metasteel Pvt Ltd
M/s Dhruvadesh Metasteel Pvt Ltd
9 5.51 9 5.69 9 5.51 16.71
9M/s Thermal Power
tech Corporation India Ltd
M/s Thermal Power tech Corporation India Ltd
100 61.20 100 63.24 100 61.20 185.64
10M/s GMR Trading Ltd
Sree Renuka Sugars Ltd Havalga Unit
10 6.12 0 0.00 0 0.00 6.12
Total 376.8 230.58 279.9 177.01 304.1 186.11 593.70
Capacity in MW and Energy in Mus @ 85% of the Contracted Capcity
Particulars Energy in Mus Rate per unit in Rs
short term procurement 593.70 5.50
Chapter-7 Page 123
Bangalore Electricity Supply Company Limited Truing up for FY-14 and ARR for FY-16
Transmission charges:
Commission’s approved transmission charges for FY-16 is retained. Details are as under:
In Crs.Particulars Approved for FY-16
Transmission charges of KPTCL 1063.00Total 1063.00
O & M E x pen s e s :
Commission has approved the O&M expenses for FY-16 considering weighted
inflation index and compounded annual growth rate of consumers. Uncontrollable
expense was also approved. Details are as under:
(Rs.Crs)Particulars FY15 FY16
No. of Installations 9289556 9828662
CGI based on 3 Year CAGR (Using actuals of FY09 to FY12)
4.47% 4.47%
Inflation as per CERC Order dated 25.09.12 5.49% 5.49%Base Year O&M Cost excluding P&G Contribution (FY12 as per actual) (Rs.Crs.)
882.95 962.07
Un controllable expenses 198.98O&M Index= 0&M (t-1)*(1+WII+CGI-X) 1161.05
In the previous chapters, the abnormality in considering the price index notified by CERC
has been briefed.
CPI for 2014 is arrived taking actuals up to September 2014 as available from the Labour
Bureau, Government of India (http://labourbureau.nic.in/indtab.html) and estimating
the CPI for the balance months through moving average, the details are shown below:
Year Jan Feb Mar Apr May Jun Jul Aug Sep Oct Nov Dec Avg.
201423
7 238 239 242 244 246 252 253 253254.0
7255.1
4256.2
2247.4
5Calculatio
n0.004
2239.
0240.
0243.
0245.
0247.
0253.
1254.
1 254.1 255.1 256.2
WPI for 2014 is arrived taking actuals upto October 2014 as available from the office of
Economic Adviser, Government of India
(http://www.eaindustry.nic.in/display_data.asp,) and estimating the WPI for the
Chapter-7 Page 124
Bangalore Electricity Supply Company Limited Truing up for FY-14 and ARR for FY-16
balance months through moving average, the details are shown below:
Year Jan Feb Mar Apr May Jun Jul Aug Sep Oct Nov Dec Avg.2014 179 179.5 180.3 180.8 182 183 185 185.9 185 183.9 184.41 184.93 182.81
Calculation
0.0028
180.00 180.80
181.31
182.51
183.51 185.52
186.42
185.52 184.41 184.93
Applying the methodology followed by CERC duly changing the Composition of
CPI[IW](83%)and WPI(17%), inflation index is worked out as under:
Year WPI CPI17% of
WPI 83%of CPIComposite series YT/Y1=Rt Ln Rt Year-1(t-1)
Product [(t-1) x (Ln Rt)]
1 2 34=17% of (2) 5=83% of (3) 6=(4+5)
2003 92.6 107 15.74 88.81 104.552004 98.72 111 16.78 92.13 108.91 1.04 0.041 1 0.042005 103.37 116 17.57 96.28 113.85 1.09 0.085 2 0.172006 109.59 123 18.63 102.09 120.72 1.15 0.144 3 0.432007 114.94 131 19.54 108.73 128.27 1.23 0.204 4 0.822008 124.92 142 21.24 117.86 139.10 1.33 0.285 5 1.432009 127.86 157 21.74 130.31 152.05 1.45 0.374 6 2.252010 140.08 176 23.81 146.08 169.89 1.62 0.485 7 3.402011 157.3 197 26.74 163.51 190.25 1.82 0.599 8 4.792012 168.8 219 28.70 181.77 210.47 2.01 0.700 9 6.302013 179.6 239 30.53 198.37 228.90 2.19 0.784 10 7.842014 182.8 247 31.08 205.01 236.09 2.26 0.815 11 8.96
A = Sum of "product" 36.415*Note: B= 6 times (6 x A) 218.49
C= (n-1) x n x (2n-1); n = No. of Years of data = 12 3036
D = B/C 0.072
g (Exponential Factor) = Exponential (D) -1 0.07462
e = Annual Escalation Rate (%) = g x100 7.462
BESCOM request the Commission to consider this inflation index for computation of O&M
Expenses. Revised O&M expenses worked out is as under:
Particulars FY13 FY14 FY15 FY16
No. Of Installations 8307147 8875987 9496988 10129950CGI based on 3 Year CAGR (Using actuals of FY09 to FY12) 4.56%Inflation 7.462Base Year O&M Cost as approved in T.O 2014(Rs.Crs.) 1110.95O&M Index= 0&M (t-1)*(1+WII+CGI-X) (Rs.Crs) 1233.40
Chapter-7 Page 125

Bangalore Electricity Supply Company Limited Truing up for FY-14 and ARR for FY-16
BESCOM has already recruited 391 Assistant Lineman. The Company has initiated the process
of recruiting 373 Assistant Linemans. Further, the Company has commenced the recruitment of
87 Assistant Engineers, 24 Junior Engineers and 13 Assistant Accounts Officers.
The inclusion of proposed staff into the Company will increase the Employees Cost
approximately by Rs.20 Crores per annum. However, this is not included in the ARR for FY-16.
Actuals will be placed before the Commission at the time of truing up.
For the purpose of segregation of O&M expenses to repair and maintenance cost, Employees
cost and Administrative and General Expenses, ratio of 5:78:17 is considered respectively
based on FY-14 actuals.
Particulars Allocation CostRepair and Maintenance cost 5% 61.67Employee cost 78% 962.05Administrative and General Expenses 17% 209.68Total 100% 1233.4
D e p r eci a t io n , In t e r e s t a n d Fina n ce C ha r ge s, R e t u r n on E qu i t y and O t her I n come:
BESOM has not changed the capital investment plan, hence BESCOM is retaining the figures
approved by the Commission for Depreciation, Interest and Finance Charges, Return on
Equity, Other Income for the year FY-16.
Abstract of revised Revenue Requirement is as under:
Sl. NoParticulars
FY16
As Appd ModifiedA Energy @ Gen Bus 35121 30986B Transmission Losses in % 3.90% 3.90%C Energy @ Interface in MU 33752 29777D Distribution Losses in
%Sales in MU13.40%
13.40%G Sales 29229 25787
Chapter-7 Page 126

Bangalore Electricity Supply Company Limited Truing up for FY-14 and ARR for FY-16
Sl. No
Particulars FY16
As Appd Modified
Expenditure in Rs Crs
1 Power Purchase Cost 13808.9 11248.88
2 Transmission charges of KPTCL 1305.62 1063.003 SLDC Charges 10.534 Power Purchase Cost including cost of transmission 15125.05 12311.885 Employee Cost 962.052
6 Repairs & Maintenance 61.67
7 Admin & General Expenses 209.6788 Total O&M Expenses 1161.05 1233.4
9 Depreciation 229.71 229.71
Interest & Finance charges10 Interest on Loans 195.31 252.71
11 Interest on Working capital 316.64 316.6412 Interest on belated payment on PP Cost 0
13 Interest on consumer deposits 210.51 210.51
14 Other Interest & Finance charges 7.63 7.63
15 Less interest & other expenses capitalised 40 4016 Total Interest & Finance charges 690.1 747.4917 Other Debits 018 Net Prior Period
19 RoE 114.93 105.4
20 Funds towards Consumer Relations/Consumer Education 1 121 Other Income 197.52 197.52
22 Net ARR 17124.32 14431.37
Gap 880.63
Segregation of ARR into Distribution and Retail Supply Business:
The Consolidated ARR has been segregated into ARR for Distribution Business and ARR for
Retail Supply Business based on the item wise allocation made in the MYT Order. Approved
rations are as under:
Particulars Distribution Business Retail Supply Business
Chapter-7 Page 127
Bangalore Electricity Supply Company Limited Truing up for FY-14 and ARR for FY-16
O&M 56% 44%Depreciation 88% 12%Interest on Loans 100% 0%Interest on Consumer Deposits 0% 100%RoE 50% 50%GFA 88% 12%Non Tariff Income 19% 81%
Modified ARR FOR DISTRIBUTION BUSINESS - FY16:
Rs. Crores
Sl. No Particulars Modified proposal
1 O&M Expenses 690.702 Depreciation 202.143 Interest and Finance Charges 252.714 Net Prior Period 05 Debit/Credit 06 RoE 52.77 Funds towards Consumer Relations/Consumer Education 08 Other Income 37.53
Net ARR 1160.73
MODIFIED ARR FOR RETAIL BUSINESS FOR FY16:
Rs. Crores
Sl. No
Expenditure in Rs Crs Modified proposal
1 Power Purchase Cost 11248.882 Transmission charges of KPTCL 1063.003 SLDC Charges 0.004 Power Purchase Cost including cost of transmission 12311.885 O&M Expenses 542.706 Depreciation 27.577 Interest & Finance charges 494.788 Other Debits 0.009 Net Prior Period
10 Debit/Credit 0.0011 RoE 52.7012 Funds towards Consumer Relations/Consumer Education 1.0013 Other Income 159.9914 Net ARR 13270.63
Chapter-7 Page 128

Bangalore Electricity Supply Company Limited Truing up for FY-14 and ARR for FY-16
Average Cost of Supply:
Based on the modified ARR the average cost of supply of BESCOM for FY16 is worked out as
under:
Average Cost of Supply for FY16:
Sl.No Particulars Approved Modified proposal1 Net ARR (Rs.Crores) 17124.32 14431.372 Energy Sales in MU 29229 257873 Average Cost per unit 5.86 5.60
Chapter-7 Page 129