balancing hydronic systems in multifamily buildings
TRANSCRIPT
Balancing Hydronic Systems in Multifamily Buildings Russell Ruch, Peter Ludwig, and Tessa Maurer Partnership for Advanced Residential Retrofit
July 2014

NOTICE
This report was prepared as an account of work sponsored by an agency of the United States government. Neither the United States government nor any agency thereof, nor any of their employees, subcontractors, or affiliated partners makes any warranty, express or implied, or assumes any legal liability or responsibility for the accuracy, completeness, or usefulness of any information, apparatus, product, or process disclosed, or represents that its use would not infringe privately owned rights. Reference herein to any specific commercial product, process, or service by trade name, trademark, manufacturer, or otherwise does not necessarily constitute or imply its endorsement, recommendation, or favoring by the United States government or any agency thereof. The views and opinions of authors expressed herein do not necessarily state or reflect those of the United States government or any agency thereof.
Available electronically at http://www.osti.gov/scitech
Available for a processing fee to U.S. Department of Energy and its contractors, in paper, from:
U.S. Department of Energy Office of Scientific and Technical Information
P.O. Box 62 Oak Ridge, TN 37831-0062
phone: 865.576.8401 fax: 865.576.5728
email: mailto:[email protected]
Available for sale to the public, in paper, from: U.S. Department of Commerce
National Technical Information Service 5285 Port Royal Road Springfield, VA 22161 phone: 800.553.6847
fax: 703.605.6900 email: [email protected]
online ordering: http://www.ntis.gov/ordering.htm
Printed on paper containing at least 50% wastepaper, including 20% postconsumer waste

iii
Balancing Hydronic Systems in Multifamily Buildings
Prepared for:
The National Renewable Energy Laboratory
On behalf of the U.S. Department of Energy’s Building America Program
Office of Energy Efficiency and Renewable Energy
15013 Denver West Parkway
Golden, CO 80401
NREL Contract No. DE-AC36-08GO28308
Prepared by:
Russell Ruch, Peter Ludwig, and Tessa Maurer
Partnership for Advanced Residential Retrofit
322 S Green St., Suite 300
Chicago, IL 60607
NREL Technical Monitor: Stacey Rothgeb
Prepared under Subcontract No. KNDJ-0-40346-04
July 2014

iv
[This page left blank]

v
Contents List of Figures ............................................................................................................................................ vi List of Tables .............................................................................................................................................. vi Definitions .................................................................................................................................................. vii Executive Summary ................................................................................................................................. viii 1 Introduction ........................................................................................................................................... 1
1.1 Problem Statement ...............................................................................................................1 1.2 Relevance to Building America’s Goals ..............................................................................2 1.3 Research Questions ..............................................................................................................2
2 Literature Review .................................................................................................................................. 3 2.1 Background ..........................................................................................................................3 2.2 Recent Research ...................................................................................................................9
3 Experiment .......................................................................................................................................... 11 3.1 Recruitment ........................................................................................................................11 3.2 Data Collection ..................................................................................................................11
3.2.1 Temperature ...........................................................................................................11 3.2.2 Gas Usage ..............................................................................................................12 3.2.3 Equipment ..............................................................................................................12 3.2.4 Method of Analysis ................................................................................................12
3.3 Building A ..........................................................................................................................13 3.3.1 Background ............................................................................................................13 3.3.2 Data Findings .........................................................................................................16 3.3.3 Analysis..................................................................................................................19
3.4 Building B ..........................................................................................................................22 3.4.1 Background ............................................................................................................22 3.4.2 Data Findings .........................................................................................................24 3.4.3 Analysis..................................................................................................................27
4 Discussion ........................................................................................................................................... 30 4.1 Imbalance ...........................................................................................................................30 4.2 Improvement ......................................................................................................................30
5 Conclusion .......................................................................................................................................... 32 References ................................................................................................................................................. 33 Appendix A: Sample Tenant Letter ......................................................................................................... 35 Appendix B: Outside Temperatures at Buildings A and B ................................................................... 36

vi
List of Figures Figure 1. Diverter tees ................................................................................................................................ 4 Figure 2. Two-pipe direct return ................................................................................................................ 5 Figure 3. Two-pipe reverse return ............................................................................................................. 5 Figure 4. Primary/secondary piping .......................................................................................................... 6 Figure 5. Radiator (top left); convector (top right); finned-tube (bottom) ............................................. 7 Figure 6. Baseboard radiator (left); radiant flooring (right) .................................................................... 8 Figure 7. Fan coils (left); unit heater (right) .............................................................................................. 8 Figure 8. Photograph of Building A: northeast corner (left); northwest corner (right) ..................... 13 Figure 9. Aerial view of Building A; note position of boiler in southeast corner ............................... 14 Figure 10. Circulator added to west loop at Building A ........................................................................ 15 Figure 11. Building A in-unit and outdoor temperatures, pre- and post-retrofit ................................ 18 Figure 12. Two weeks of readings at unit 5651-1: pre-retrofit (left); post-retrofit (right) ................... 19 Figure 13. Lowest unit temperature at Building A versus outside temperature ................................ 20 Figure 14. Difference between highest and coldest unit temperatures at 30-minute intervals ........ 21 Figure 15. Building B: note location of boiler room .............................................................................. 23 Figure 16. Primary circulator at Building B ............................................................................................ 23 Figure 17. Temperatures collected at Building B .................................................................................. 25 Figure 18. Temperatures in first floor units of Building B .................................................................... 26 Figure 19. Temperatures in second floor units of Building B .............................................................. 26 Figure 20. Temperature spreads at both buildings ............................................................................... 28 Figure 21. Comparison of outside temperatures recorded at Building A and Building B ................ 36
Unless otherwise noted, all figures were created by the Partnership for Advanced Residential Retrofit.
List of Tables Table 1. Buildings Included in the Study ................................................................................................ 11 Table 2. Logger Equipment ...................................................................................................................... 12 Table 3. Summary Statistics for Unit Temperatures (°F) in Building A ............................................... 19 Table 4. Measures of Building Spread, Before and After Retrofit, at Building A ............................... 21 Table 5. Boiler Gas Usage in Pre- and Post-Retrofit Periods at Building A ........................................ 22 Table 6. Summary Statistics for Unit Temperatures (°F) in Building B ............................................... 27 Table 7. Temperature Deviation Between Recorded and Set Point Temperatures (°F) in Building B29
Unless otherwise noted, all tables were created by the Partnership for Advanced Residential Retrofit.

vii
Definitions
ARIES Advanced Residential Integrated Energy Solutions Collaborative
ASHRAE American Society of Heating, Refrigerating and Air Conditioning Engineers
Btu British Thermal Unit
DOE U.S. Department of Energy
EMS Energy Management System
HDD Heating Degree Day
NREL National Renewable Energy Laboratory
PARR Partnership for Advanced Residential Retrofit

viii
Executive Summary
More than 50% of units in colder climate region multifamily buildings in the United States are heated by steam or hot water systems (RECS 2009).1 These buildings often suffer from imbalance: some apartments are too hot and some are too cold. In hydronic systems, distribution issues may be caused by undersized piping, improperly adjusted balancing valves, inefficient water temperature and flow levels, and owner/occupant interaction with the boilers, distribution, and controls. The effects of imbalance include tenant discomfort, higher energy use intensity, inefficient building operation, and decreased equipment longevity. These issues can affect a building’s financial viability as apartments become more expensive to heat, no-heat calls accumulate, and maintenance staff and heating equipment work harder and less efficiently in their efforts to provide enough heat to all units to meet code requirements and tenant expectations. This paper explores the causes for heat imbalance in these systems and discusses potential upgrades and measures to address them, providing guidance to contractors, auditors, and building owners on best practices to improve tenant comfort and lower operating costs.
The research was conducted by The Partnership for Advanced Residential Retrofit in conjunction with Elevate Energy.2 The team drew upon existing knowledge of retrofits for optimizing distribution in typical multifamily hydronic systems, with the aim of identifying common situations and solutions, then conducted case studies on two Chicago-area buildings with known balancing issues to quantify the extent of temperature imbalance. At one of these buildings the team installed a booster pump on a loop to an under-heated wing of the building and tested the effect of this retrofit on imbalance.
This study found that the spread of unit air temperatures in a multifamily hydronic building can reach as high as 48°F (56°–104°F), particularly if windows are opened or tenants use intermittent supplemental heating sources like oven ranges. This extreme disparity was even greater than that reported by the Advanced Residential Integrated Energy Solutions Collaborative, which found a spread in one building of 37.9°F (Dentz et al. 2013). The literature review found different types of retrofits necessary for different types of hydronic systems. Increasing flow to an underheated zone in the test building was found to be an effective method of improving an extreme imbalance issue. Average temperature spread at the building as a result of this retrofit decreased from 22.1°F to 15.5°F.
1 Of the 4.3 million housing units in buildings with two or more units in the “Very Cold/Cold” U.S. climate region, 2.2 million are heated by a steam or hot water system. 2 Elevate Energy is nonprofit organization that “designs and implements efficiency programs that lower costs, protect the environment, and ensure the benefits of energy efficiency reach those who need them the most” (Elevate Energy 2014a).

1
1 Introduction
1.1 Problem Statement Most older Chicago-area multifamily buildings are heated by centrally metered steam or hydronic (hot water) systems. Hydronic systems offer many advantages over steam, including the possibility for greater energy efficiency and more control over temperature in different areas of the building. Depending on the piping configuration, these systems can be zoned for each unit, giving tenants some control over their temperatures although the heating plant is centrally configured.
However, as with steam systems, these buildings can fall out of balance. Poor maintenance, improper renovations, or design flaws such as undersized piping can cause a hydronic system to heat units unevenly. Balancing the building—ensuring that the distribution system consistently delivers the correct rate of heat transfer to each apartment—can bring multiple benefits to owners, operations and maintenance staff, and tenants.
Chief among these benefits is improved tenant comfort and heating fuel efficiency. Overheated tenants tend to open windows to reach their desired temperature, resulting in greater space heat loss and increased heating fuel usage. Underheated tenants may resort to inefficient, expensive, and sometimes dangerous secondary heating sources such as space heaters and oven ranges. (Caleffi 2012; Deutsche Bank 2012)
Balancing systems can alleviate damage due to moisture as well. Cold air can cause shrinkage cracks in wood and drywall surfaces, slow drying of wetted surfaces, condensation on windows, and growth of mold and mildew. Air temperatures that are too high can increase air leakage through the building envelope and reduce interior humidity (Caleffi 2012).
Lastly, lower heating fuel costs generate operating savings that can increase cash flow and the bottom line while freeing up resources for other necessary building repairs. Enhanced tenant comfort may stabilize occupancy, thus lowering the costs of finding new tenants for owners, and reducing the amount of time spent by maintenance staff dealing with low-heat calls (Elevate 2014b).
Multifamily building owners have much to gain from improving the distribution of their hydronic systems. However, balancing is not a measure commonly employed by building owners and contractors. As Choi et al. (2012) discuss, older heating systems are often plagued by poor maintenance of the system and inadequate or inappropriate upgrades to parts of systems that compromise the system’s designed functionality and efficiency. Lacking capital funds, knowledge of available technologies, appropriate contractor solutions, and understanding of the benefits and definition of system balancing are the primary causes for misinvestment in older multifamily buildings. System balancing may be among the most cost-effective efficiency opportunities available in such buildings, though the associated comfort improvements, utility cost savings, and contractor methodologies are rarely well documented in the marketplace.

2
With these barriers and benefits in mind, this project seeks to:
• Survey existing knowledge about balancing hydronic buildings.
• Quantify the extent of imbalance in two test buildings.
• Measure the improvement in imbalance from retrofitting one of these buildings.
• Analyze the process of optimizing hydronic distribution systems in multifamily buildings.
By taking practical, cost-effective steps to optimizing their hydronic distribution systems, multifamily building owners can reduce costs and improve tenant comfort. This study examines some issues surrounding the optimization of hydronic systems, with the ultimate goal of providing building owners and contractors with the resources and information to make financially sensible and long-lasting investments in energy efficiency and tenant comfort.
1.2 Relevance to Building America’s Goals The goal of the Building America program is to develop and prove cost-effective strategies for reducing energy use in buildings by up to 50%, while also seeking to identify technologies that lead to higher comfort, improved indoor air quality, and moisture-resistant buildings (Building America 2014).
This research project investigates temperature imbalance in multifamily buildings in order to identify retrofits that reduce energy waste from overheating and improve the comfort of tenants, in a colder humid continental climate, where heating is the focus of residential energy use.
In addition to the potential for heating fuel and electricity savings, distribution optimization brings with it a number of other benefits in line with Building America’s goals. These include improved air quality, higher comfort levels throughout the building, and reduced risk of building deterioration that may be caused by improper moisture and/or temperature levels.
Part of the motivation behind this project is to increase the visibility of hydronic distribution improvements as viable energy efficiency measures for multifamily building owners, as well as to streamline the identification and implementation of these measures to make them as cost effective and transparent as possible. These goals naturally increase the scalability of the measures and could serve the larger aim of turning them into more widely practiced retrofit techniques.
1.3 Research Questions • How much can the temperature vary within and across units in a hot water-heated
building?
• What are the most cost-effective and lasting improvements for hot water heating systems?
• Are certain balancing approaches best suited to specific building types?
3
2 Literature Review
In the first phase of this project, the Partnership for Advanced Residential Retrofit (PARR) conducted background research and prepared a survey of existing knowledge and research related to multifamily building hydronic heating and balancing. Sources for this survey included Building America and ASHRAE publications, engineering studies, trade journals, hydronics design guides, seminars, and consultations with an expert hydronic heating contractor and Elevate Energy’s senior engineer.
2.1 Background The relative balance of a hydronic heating system is primarily dependent on the alignment of its component parts, including boilers, piping configuration, circulators, air eliminators, and heat emitters. Briefly, this section describes how a hydronic heating system functions and some of the many potential issues that can lead to significant imbalance.
2.1.1 Overview of Hydronic Heating Systems Though it has existed in some form or another for hundreds of years, hydronic heating became prevalent in residential buildings in the United States around the 1940s as a more efficient alternative to steam. In a hydronic system, hot water flows from a central boiler to heat emitters located throughout the building, where heat from the water is transferred to the surrounding air via highly conductive metal. The water loses its heat and cools, flowing out from the heat emitters and back to the boiler where it is heated again. The exact path of water depends on the piping configuration of the system, discussed in Section 2.1.3.
Modern hydronic systems have a variety of components designed to enhance the performance of the system, including the circulator, meant to facilitate the flow of water throughout the building and the air eliminator, which removes microbubbles from the fluid. Hydronic systems may be zoned in order to control or isolate water flow in certain areas of a building. Thermostats can be installed in each of these zones to more or less control the air temperature of the zone.
2.1.2 Circulators In their earliest iterations, hydronic systems were designed to rely only on the lower density of hot water than cold water to create circulation through a closed piping system. Relatively lighter hot water flowed upward from the boiler to the heat emitters as colder, heavier water flowed downward. These “gravity hot water” systems relied solely on gravity to circulate water throughout the building. As hydronic systems became more sophisticated, circulators were introduced in order to minimize friction losses and provide more efficient heat delivery.
Circulators are sized according to the flow rate and head loss in a given heating system. Flow rate is determined by the heating load of the system and reflected in the diameter of the piping, while head loss is calculated as the pressure drop seen across the system as water flows through it. As a circulator cannot move more water than is permitted by the pipe size, it must be sized to provide the necessary head pressure at the given flow rate (Holohan 2011).
Traditional or “single-speed” circulators are designed to provide flow at a constant rate and are sized for maximum demand. In recent years, engineers have developed variable speed circulators which have the ability to step down flow rate, thereby improving performance in systems with
4
multiple zones and reducing unnecessary electricity use. These circulators use variable frequency drives, which adjust the flow rate of water in the system in response to changes in demand as control valves open or close. When a valve closes, the variable frequency drive reduces the speed of the motor, thereby adjusting the flow rate to match the demand in the system. This ensures relatively constant pressure throughout the system and lowers average pump speeds, resulting in reduced electricity use (Vastyan 2012).
2.1.3 Piping Configurations Common hydronic piping configurations include the following (Hoger 2012; Holohan 2011):
• Series piping: Flow passes from the heat source, through each heat emitter and back to the heat source. As water passes through the system its temperature decreases, so heat emitters must be sized accordingly. While this is the simplest type of system to install and uses minimal piping, this configuration cannot be zoned and balancing issues are difficult to resolve.
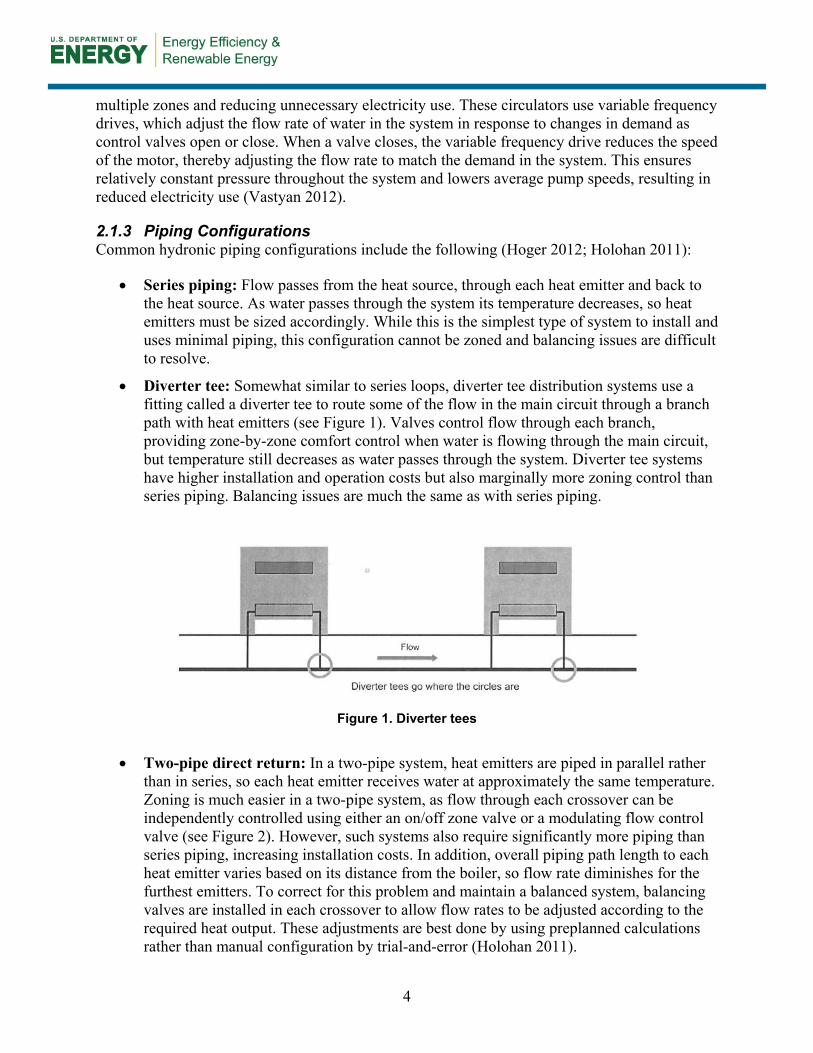
• Diverter tee: Somewhat similar to series loops, diverter tee distribution systems use a fitting called a diverter tee to route some of the flow in the main circuit through a branch path with heat emitters (see Figure 1). Valves control flow through each branch, providing zone-by-zone comfort control when water is flowing through the main circuit, but temperature still decreases as water passes through the system. Diverter tee systems have higher installation and operation costs but also marginally more zoning control than series piping. Balancing issues are much the same as with series piping.
Figure 1. Diverter tees
• Two-pipe direct return: In a two-pipe system, heat emitters are piped in parallel rather
than in series, so each heat emitter receives water at approximately the same temperature. Zoning is much easier in a two-pipe system, as flow through each crossover can be independently controlled using either an on/off zone valve or a modulating flow control valve (see Figure 2). However, such systems also require significantly more piping than series piping, increasing installation costs. In addition, overall piping path length to each heat emitter varies based on its distance from the boiler, so flow rate diminishes for the furthest emitters. To correct for this problem and maintain a balanced system, balancing valves are installed in each crossover to allow flow rates to be adjusted according to the required heat output. These adjustments are best done by using preplanned calculations rather than manual configuration by trial-and-error (Holohan 2011).

5
Figure 2. Two-pipe direct return
• Two-pipe reverse return: Again, heat emitters are piped in parallel, but return and
supply piping are sized so that the overall piping path length for each heat emitter is identical. Consequently, the flow rate and temperature of the water entering each heat emitter are roughly the same, and balancing is much easier than in direct return systems. Reverse return systems, however, require even more piping than two-pipe direct returns. Moreover, though these systems are in theory “self-balancing,” in practice, balancing valves are still required, as the flow resistance through each crossover will not necessarily be the same. Figure 3 shows the layout of a two-pipe reverse return system; the image has been modified to include balance valves.
Figure 3. Two-pipe reverse return

6
• Primary/secondary: A primary/secondary configuration consists of a primary loop that delivers heated water to one or more secondary circuits. Each secondary circuit has its own circulator and is connected to the primary loop with pairs of closely spaced tees. The minimal spacing allows each circulator in the system to operate without impacting any of the others, thereby separating flow between the primary and secondary circuits. This configuration is ideal for radiant systems and systems with large temperature drops because it causes cooler water leaving the secondary loops to mix with the still-warm water in the primary loop. Water returning to the boiler is therefore warmer than it would be if it was returned directly from the secondary loops (Joyce 2005). Figure 4 shows an example of a primary/secondary piping system. As the diagram indicates, it is possible to have multiple secondary loops with different heat loads, including an indirect load such as a domestic hot water heater.
Figure 4. Primary/secondary piping
2.1.4 Air Elimination Hydronic systems are designed to be airless, closed loops. The presence of air molecules in the piping can compromise the longevity and performance of the system. Air molecules limit heat transfer by preventing heat-containing water molecules from coming into contact with the metal in heat emitters, reduce the efficiency of the circulator by jamming flow-check valves, create noise and contribute to balancing problems, and can potentially clog the distribution system by reacting with metals and creating rust (Holohan 2011).
Thus, air elimination is an important function of the modern hydronic system. Broadly speaking, air elimination occurs at two stages. After initial installation of the system, and on an annual basis as the system is drained and refilled between heating seasons, a technician purges air using bleed valves at the radiators. Air is also automatically removed during the normal operation of the system by the air eliminator. Since hot water has less capacity than cold water to hold air in
7
solution, heating water causes air molecules to fall out of solution and create microbubbles inside the piping. The air eliminator takes advantage of the buoyancy of air to capture and expel microbubbles floating on the top of the water (ClimateMaster 2011; Holohan 2011).
2.1.5 Heat Emitters Common types of heat emitters in multifamily buildings include radiators, convectors, finned-tube, baseboard, radiant flooring, fan coils, air handlers, and unit heaters. This section briefly explains how each of these emitters functions.
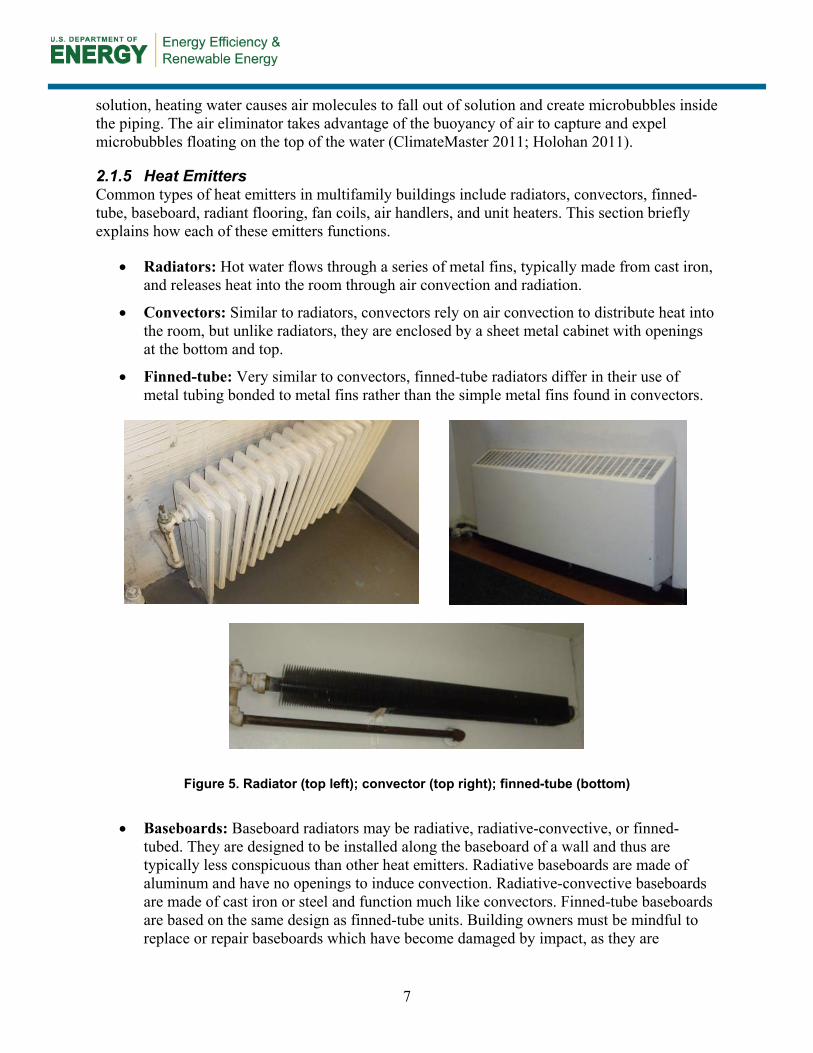
• Radiators: Hot water flows through a series of metal fins, typically made from cast iron, and releases heat into the room through air convection and radiation.
• Convectors: Similar to radiators, convectors rely on air convection to distribute heat into the room, but unlike radiators, they are enclosed by a sheet metal cabinet with openings at the bottom and top.
• Finned-tube: Very similar to convectors, finned-tube radiators differ in their use of metal tubing bonded to metal fins rather than the simple metal fins found in convectors.
Figure 5. Radiator (top left); convector (top right); finned-tube (bottom)
• Baseboards: Baseboard radiators may be radiative, radiative-convective, or finned-
tubed. They are designed to be installed along the baseboard of a wall and thus are typically less conspicuous than other heat emitters. Radiative baseboards are made of aluminum and have no openings to induce convection. Radiative-convective baseboards are made of cast iron or steel and function much like convectors. Finned-tube baseboards are based on the same design as finned-tube units. Building owners must be mindful to replace or repair baseboards which have become damaged by impact, as they are

8
relatively fragile in comparison to other emitter types. Damaged baseboard radiators can seriously inhibit a system’s ability to provide the necessary amount of heat to a given unit.
• Radiant flooring: Radiant flooring relies principally on radiative tubing, which is laid out at regular intervals under a floor. Hot water flows through the tubing and heats the room from the bottom up. Radiant flooring is most effective when covered by ceramic tiles, which are good heat conductors.
Figure 6. Baseboard radiator (left); radiant flooring (right)
• Fan coils: Fan coils consist simply of a fan and heating coils, which act as a heat
exchanger. Heat is delivered to the fan coil by means of a hydronic system; the heat exchanger then transfers that heat load to the air, which is circulated throughout the room by the fan.
• Air handlers: Air handlers work much the same way as fan coils, but are typically much larger and attached to duct work, which may deliver heat to multiple parts of a building rather than just a single room.
Figure 7. Fan coils (left); unit heater (right)
• Unit heaters: Unit heaters work in much the same way as fan coils except that the
components are contained in a single unit that, unlike most fan coils or air handlers, are designed to be exposed to the area they are heating. They offer easy and inexpensive installation for areas that require additional heating.

9
2.2 Recent Research The most relevant current research on balancing strategies in multifamily hydronic systems is found in two studies conducted by the Advanced Residential Integrated Energy Solutions (ARIES) Collaborative, another Building America team.
Dentz et al. (2014) examined three hydronically heated low-rise multifamily buildings with above average energy usage. The project measured energy usage before and after replacing modulating aquastats with boiler controls that provided more precise control.3 In one of the three buildings studied by Dentz et al., the new controller averaged indoor temperatures from sensors placed in each unit. In the other two, the new controller supported nighttime setback abilities but not indoor temperature averaging. More sophisticated mixing valves were also added to the first building. The change in energy usage was examined based on a regression analysis comparing pre- and post-retrofit heating gas use, which showed a 10.1% to 30.9% drop in heating energy usage. The largest reduction was in the building with indoor temperature sensors, where the boiler runtime was reduced by 28%. Moreover, nearly all the savings were realized at night when the temperature cutoff was 5°F lower than during the day, indicating that a properly adjusted outdoor reset control could be enough to generate similar savings. Simple payback for all three buildings collectively was calculated to be about 3 years, indicating that hydronic heating retrofits can be cost effective. Finally, the study also concluded that a 5°F nighttime setback in the supply water temperature did not have any significant impact.
In a separate study, Dentz et al. (2013) collected existing archival data from energy management systems (EMSs) in four hydronically heated buildings, in addition to 14 steam buildings, in order to examine the presence and magnitude of overheating and the role of EMSs in regulating indoor temperatures. The study suggested that overheating is a pervasive problem in hydronic buildings and that the average temperature in units of hydronic buildings was above the 70°F cutoff for overheating whether the EMSs were on or not. Moreover, the spread of temperatures in each hydronic building was significant, 14.5°–37.9°F4 when the EMSs were off, and 24.5°–34°F when EMSs were on. (Data when the EMSs were on were collected at only three of the four hydronic buildings). As implied by these data, the EMSs did not reliably lower the average temperature, nor did they narrow the temperature range in the hydronic buildings. In fact, in two of the three hydronic buildings with EMSs, the temperature range increased when the system was turned on and in one, the average temperature rose. No correlation was found between in-unit temperatures and floor height. In summary, the study suggested that overheating is a significant and widespread problem in hydronic buildings and that such buildings suffer from uneven distribution. EMSs were found to have a limited ability to control temperature and distribution problems.
These studies indicate that overheating and temperature imbalance can be very significant issues in hydronic buildings and that the efficiency improvements associated with sophisticated control systems such as EMSs and those with averaging temperature sensors are limited. These results are not surprising, as EMSs are not designed to address heating imbalances. They are incapable 3 A report of preliminary results was released after monitoring the retrofitted buildings for the 2011–2012 heating season. The findings detailed here are from a draft version of the project’s final report, which includes observations from the 2012–2013 heating season. The final report had not yet been peer reviewed or published at the time of this writing. 4 Page 11, Table 3. A temperature range of 62.1°–100°F was recorded in Building 13.

10
of sending more heat to cold apartments or less heat to warm apartments; thus, it is to be expected that they had no effect on temperature range.
Research presented below adds to the conversation about imbalance in hydronic systems by documenting serious temperature imbalances at two buildings, analyzing the factors which contributed to the imbalance, and evaluating a booster pump retrofit at a building with undersized piping. Uneven building temperatures can lead to undesired tenant responses such as intermittent supplemental heating or window opening, exacerbating the imbalance and impeding the efficient use of temperature averaging controls. In these cases, increasing flow rate to an underheated zone may be a necessary first step before installing temperature averaging controls.

11
3 Experiment
3.1 Recruitment In the second component of this study, PARR recruited hydronic buildings in the Elevate Buildings program at which to implement and study heat balancing retrofits. The following criteria were used to select the two buildings examined in this study:
• Suffered from unbalanced heating, as indicated by tenant complaints or sensor data.
• Owner willing to participate in the research study. Owners would potentially receive installed retrofit measures at no cost, and would provide access and coordination to Elevate staff and the contractor.
• No other upgrades to the heating system or envelope planned for the research period.
Two buildings were selected. At one building, the owner was willing to participate in logging and data collection but did not choose to implement retrofit measures. This building was included in the study (1) as a second case study of a building known to suffer from imbalance and a source of additional high-resolution temperature data, as well as (2) as a control in temperature analysis for the building that was retrofitted, as it was located nearby and experienced nearly identical weather.
After selecting two buildings that met these criteria, the team recruited a Chicago-based heating contractor who specializes in hydronic heat. Working in tandem with Elevate engineers and construction managers, the contractor inspected the heating systems at these buildings, diagnosing the likely causes of imbalance in each. Based on the findings the team determined these buildings would be good candidates and enrolled them in the study. Table 1 summarizes their characteristics. Building “A” is located in Chicago and Building “B” is located in a nearby suburb.
Table 1. Buildings Included in the Study
Heat Emitters Zoning Age Stories Units Size Building A Baseboard Wing 1920 3 33 39,500 ft2 Building B Radiant flooring Unit 1961 2 10 6,750 ft2
Once the managers at both buildings agreed to enroll in the study, the contractor prepared a detailed scope of work for retrofitting the test building. This scope of work was approved by Elevate engineers and signed in a contract by the building manager, the contractor, and the PARR team on October 1, 2013.
3.2 Data Collection 3.2.1 Temperature In order to record the balance of the distribution systems over the course of the sample period, the team installed temperature loggers in both buildings. These were installed according to protocols drafted by the National Renewable Energy Laboratory (NREL) for Building America (NREL 2013). Outdoor loggers were mounted on exterior walls in positions where they would be
12
shaded 100% of the time. Indoor loggers were configured for 15-minute readings and installed, one per unit, according to the following specifications:
• On an interior wall
• Between 4 ft and 5 ft from the floor
• Not above or within 4 ft horizontally of any heating or cooling appliance
• Away from direct sunlight
• Not in close proximity to any devices that may consume a relatively large amount of electricity (e.g., television, aquarium, large appliances)
• In a location mutually agreed upon with the occupant
• Using damage-free hanging strips.
To ensure uncomplicated data retrieval and to minimize noise, tenants were notified in advance of data logger installation and given a letter explaining the project (a sample of which can be seen in Appendix A).
3.2.2 Gas Usage To evaluate the impact of the retrofit on heating gas usage, the team had a natural gas submeter installed at Building A and piped in to measure gas usage by the boilers. Since the existing central gas meter at the building measured usage by the domestic hot water heaters in addition to the boilers, it would not be possible to know the change in usage by the boilers alone. By recording gas usage by the boilers during pre- and post-retrofit periods and weather-normalizing the data, the researchers were able to evaluate whether the retrofit increased or decreased the amount of energy used for central heating.
3.2.3 Equipment Table 2 summarizes the equipment used to record temperatures and boiler gas usage.
Table 2. Logger Equipment
Measurement Model Description
Outdoor Air Temperature HOBO U23 Pro v2 Outdoor temperature/ relative humidity logger
Indoor Air Temperature HOBO U10-003 Indoor temperature/ relative humidity logger
Boiler Gas Usage 3,500 CFH Elster-American rotary gas meter Natural gas meter
3.2.4 Method of Analysis A number of metrics were used to assess the extent, duration, and extremes of temperature imbalance in both buildings. Time series plots of temperature were prepared for each unit. Summary statistics of each unit’s temperature history were also calculated, including the minimum, maximum, mean, median, and standard deviation. These measures quantified the underheating, overheating, and temperature range in each unit. In Building A, a comparison of

13
these metrics before and after retrofit enabled an assessment of whether and to what extent the retrofit improved imbalance in each unit.
Both buildings were also evaluated according to their temperature spreads; that is, the difference between highest and lowest unit temperature at coincident time intervals. Since the loggers were not perfectly synchronous, each logger’s 15 minute readings were averaged into regular 30-minute bins (e.g., 1:00–1:30) in order to directly compare temperature readings among units. Differentials between the highest and lowest temperature readings in the building for each 30-minute period were then calculated. The measured width of temperature spread was plotted as a time series to show the change in imbalance over time. At Building A, this data series was used to assess whether the retrofit changed the percentage of time the temperature spread was wider than 30°F (i.e., extremely imbalanced) or less than 15°F (i.e., relatively balanced).
Unusually cold weather during the sample period made for a study of how each heating system performed under extremely challenging conditions. As Building B was subject to similar temperatures as Building A, it was possible to compare the performance of their respective heating systems in terms of underheating, overheating, and temperature spreads. However, this was not a perfect comparison given various differences in distribution systems, construction type, size, and pre-retrofit heat slope between the two buildings.
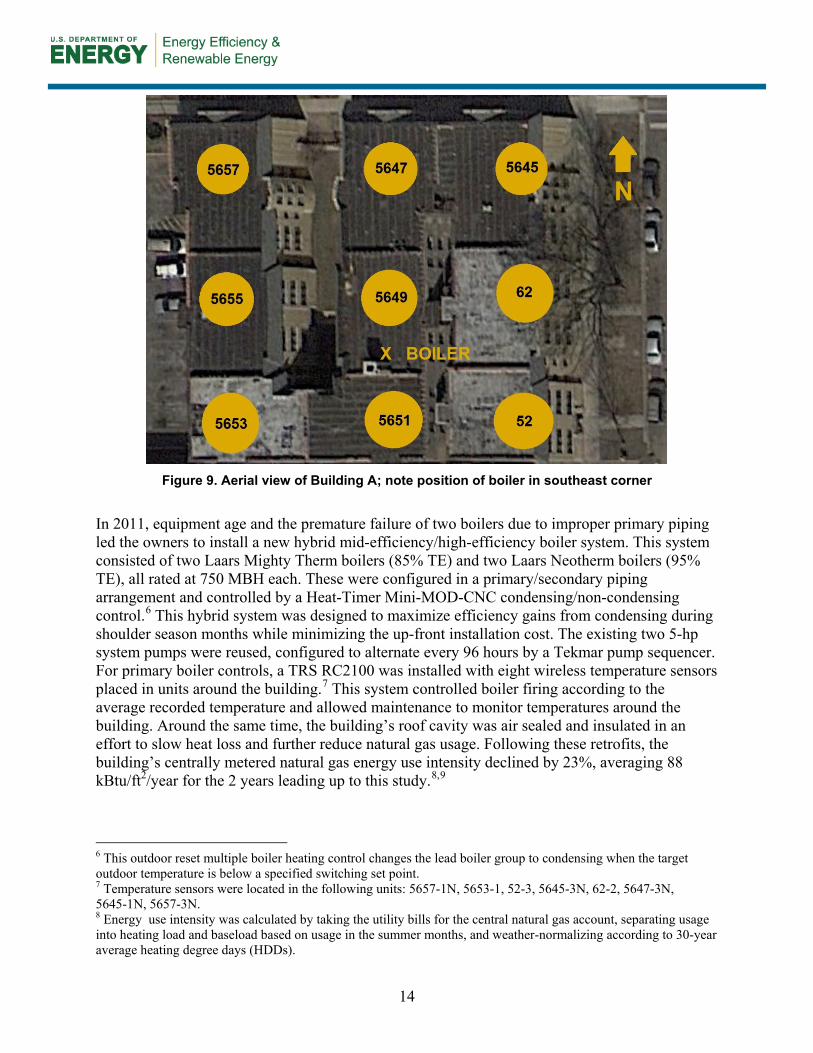
3.3 Building A 3.3.1 Background Building A (Figure 8) was built in 1920 in an “S” shape typical of Chicago multifamily buildings of that era. Originally outfitted for a steam boiler, the building was converted in the late 1990s to a centrally metered hydronic system with baseboard radiators and multiple sequenced boilers.5 This new system was piped for only two zones, west and east, and the distribution piping was undersized. This resulted in chronic underheating issues in the north and west units, which were located furthest away from the boiler room (Figure 9).
Figure 8. Photograph of Building A: northeast corner (left); northwest corner (right)
5 Central space heating and domestic hot water heating are master metered and paid by the owner. In-unit electricity and natural gas usage (i.e., oven ranges) is individually metered and paid by tenant.
14
Figure 9. Aerial view of Building A; note position of boiler in southeast corner
In 2011, equipment age and the premature failure of two boilers due to improper primary piping led the owners to install a new hybrid mid-efficiency/high-efficiency boiler system. This system consisted of two Laars Mighty Therm boilers (85% TE) and two Laars Neotherm boilers (95% TE), all rated at 750 MBH each. These were configured in a primary/secondary piping arrangement and controlled by a Heat-Timer Mini-MOD-CNC condensing/non-condensing control.6 This hybrid system was designed to maximize efficiency gains from condensing during shoulder season months while minimizing the up-front installation cost. The existing two 5-hp system pumps were reused, configured to alternate every 96 hours by a Tekmar pump sequencer. For primary boiler controls, a TRS RC2100 was installed with eight wireless temperature sensors placed in units around the building.7 This system controlled boiler firing according to the average recorded temperature and allowed maintenance to monitor temperatures around the building. Around the same time, the building’s roof cavity was air sealed and insulated in an effort to slow heat loss and further reduce natural gas usage. Following these retrofits, the building’s centrally metered natural gas energy use intensity declined by 23%, averaging 88 kBtu/ft2/year for the 2 years leading up to this study.8,9
6 This outdoor reset multiple boiler heating control changes the lead boiler group to condensing when the target outdoor temperature is below a specified switching set point. 7 Temperature sensors were located in the following units: 5657-1N, 5653-1, 52-3, 5645-3N, 62-2, 5647-3N, 5645-1N, 5657-3N. 8 Energy use intensity was calculated by taking the utility bills for the central natural gas account, separating usage into heating load and baseload based on usage in the summer months, and weather-normalizing according to 30-year average heating degree days (HDDs).
15
In July 2013, building management expressed concerns that despite the new temperature controls the building still had underheating issues in the north and, especially, west units. They noted that uneven heat distribution caused many tenants to open windows or supplement heat with their oven ranges. These temperature-altering actions interfered with the averaging controls to the extent that the cut-in set point had to be set at 79°F in order for the boiler to consistently heat all units to at least 65°F. The high set point resulted in severe overheating of some units, causing significant tenant discomfort and unnecessary gas usage. Ultimately building management decided to bypass the new temperature averaging controls altogether and use only the outdoor reset as the primary firing control.
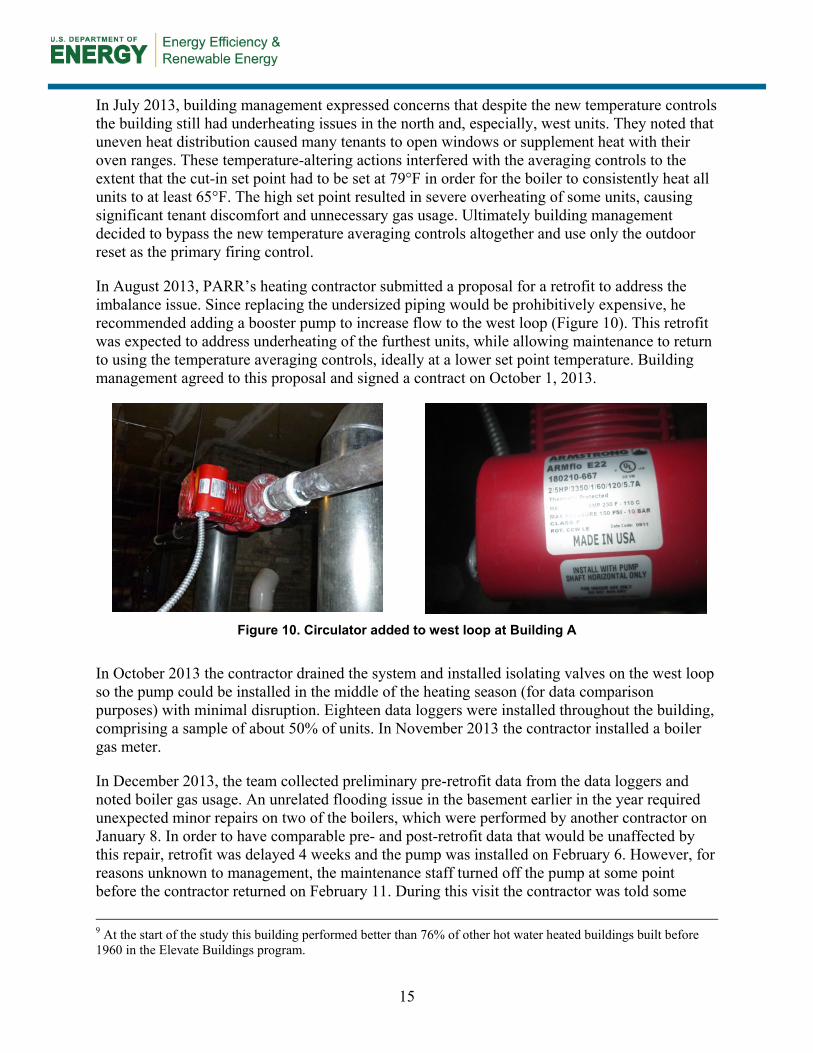
In August 2013, PARR’s heating contractor submitted a proposal for a retrofit to address the imbalance issue. Since replacing the undersized piping would be prohibitively expensive, he recommended adding a booster pump to increase flow to the west loop (Figure 10). This retrofit was expected to address underheating of the furthest units, while allowing maintenance to return to using the temperature averaging controls, ideally at a lower set point temperature. Building management agreed to this proposal and signed a contract on October 1, 2013.
Figure 10. Circulator added to west loop at Building A
In October 2013 the contractor drained the system and installed isolating valves on the west loop so the pump could be installed in the middle of the heating season (for data comparison purposes) with minimal disruption. Eighteen data loggers were installed throughout the building, comprising a sample of about 50% of units. In November 2013 the contractor installed a boiler gas meter.
In December 2013, the team collected preliminary pre-retrofit data from the data loggers and noted boiler gas usage. An unrelated flooding issue in the basement earlier in the year required unexpected minor repairs on two of the boilers, which were performed by another contractor on January 8. In order to have comparable pre- and post-retrofit data that would be unaffected by this repair, retrofit was delayed 4 weeks and the pump was installed on February 6. However, for reasons unknown to management, the maintenance staff turned off the pump at some point before the contractor returned on February 11. During this visit the contractor was told some
9 At the start of the study this building performed better than 76% of other hot water heated buildings built before 1960 in the Elevate Buildings program.

16
units were suddenly not getting heat, and he advised maintenance to bleed problem units and check for proper circulation. By February 13 the no-heat issues had been resolved and the pump was running again.
Thus, in the following data analysis “pre-retrofit” refers to the period of January 9–February 5 and “post-retrofit” refers to the period of February 14–March 30. Outside temperature during these periods was relatively similar: average HDD per day in the pre-retrofit period were 36, as opposed to 44 in the post-retrofit period.
Data collection continued after retrofit through the end of March. Thirteen in-unit data loggers10 and the outside logger were retrieved on April 1. At this time loggers were tested at room temperature to ensure their sensors were still functioning properly. One logger (5657-2N) was excluded from the study because of faulty readings.
Two loggers showed periods of unusually low readings. These were in the following units.
• 5655-3: For reasons unknown to building management, temperature dropped suddenly from 73.8°F to 48.9°F at 10:00 p.m. on January 14. Unusually low readings continued until around 12:30 p.m. on January 18, when the temperature returned to the 70+°F range. Temperature began to dip again into the 50s°F on January 20 at 1:00 p.m. and did not return to normal range (64°–82°F) until 5:00 p.m. on January 24. Due to this anomalous pattern of behavior, readings for this unit between January 14 and January 24 were not used in this study.
• 52-1: This unit was vacant from January 13 to March 1. Temperature dropped significantly, dipping as low as 50°F. Management believes a window may have been left open during this period. Because the unit included so many low temperature outliers during this time, readings for this period were not used in the analysis for this study.
3.3.2 Data Findings In-unit temperatures collected in the pre-retrofit period were uneven and erratic, with a wide spread of temperatures across units. These data confirmed a temperature imbalance across the building and suggested that tenants were altering their unit temperatures by opening windows and using supplemental heating such as oven ranges. Figure 11 plots the temperatures in each unit over the course of the sample period. Before the retrofit, temperatures were 55°–115°F, rising above 90°F in units 52-2, 5645-1N, and 5651-1. After retrofit, temperatures were 59°–104°F and peaked above 90°F in units 52-1 and 52-2 (3 times), 5651-1 (once), and 5657-1N.
As an illustration of the extreme temperature fluctuations recorded by the loggers, Figure 12 compares readings in Unit 5651-1 over the course of 2 different weeks. Located in the west wing of the building, this unit experienced very high temperature peaks in the pre-retrofit period. Temperatures rose above 100°F during 144 of the 7,943 readings recorded after January 9, and all of these 100+°F readings occurred before the pump installation on February 6. Note that this particular logger had been installed near the kitchen but followed NREL protocol in being more than 4 ft away horizontally from any heat emitting appliances. However, the extreme
10 Four data loggers went missing after installation.
17
temperatures and relative proximity to the kitchen suggest that the oven range was used to supplement heat in the unit.
Temperature in the pre-retrofit week oscillates widely within a range of 66°–111°F, cycling one to three times a day. Temperature in the post-retrofit week rises and falls within a relatively narrower range of 66°–86°F, and only rises above 81°F during a single cycle. Outdoor temperatures during these weeks were comparable.

18
Figure 11. Building A in-unit and outdoor temperatures, pre- and post-retrofit
-10
0
10
20
30
40
50
60
70
80
90
100
110
120
1/9 1/14 1/19 1/24 1/29 2/3 2/8 2/13 2/18 2/23 2/28 3/5 3/10 3/15 3/20 3/25 3/30
Tem
pera
ture
(°F)
52-1
52-2
62-2
62-3
5645-1N
5645-2N
5645-3N
5649-3
5651-1
5655-3
5657-1N
outside
Retrofit

19
Figure 12. Two weeks of readings at unit 5651-1: pre-retrofit (left); post-retrofit (right)
3.3.3 Analysis 3.3.3.1 Summary of Unit Temperatures A number of metrics were calculated in order to quantify the changes in unit temperatures before and after retrofit. Table 3 gives summary statistics for each unit.
Table 3. Summary Statistics for Unit Temperatures (°F) in Building A
Min Max Mean Median SD Unit Pre Post Pre Post Pre Post Pre Post Pre Post 52-1 58.1 65.2 79.0 103.7 66.2 79.2 67.1 76.7 4.1 7.2
52-2 64.7 64.8 98.7 93.9 78.3 76.6 75.7 76.9 7.6 3.8 62-2 66.2 67.6 82.0 85.0 74.0 76.5 74.1 76.5 2.5 2.3
62-3 64.7 71.7 82.7 87.0 71.3 80.6 70.1 80.9 4.1 1.6
5645-1N 53.4 58.5 98.5 89.8 73.3 69.8 71.9 70.0 9.3 3.9
5645-2N 56.9 65.3 77.4 79.3 67.8 71.6 68.2 71.5 4.7 2.9 5645-3N 62.9 71.0 91.2 89.2 76.1 78.8 76.0 78.8 4.9 2.2 5649-3 72.9 72.5 88.7 86.1 80.4 82.0 80.4 82.2 2.6 1.5 5651-1 53.3 63.1 114.0 94.4 77.5 73.0 74.2 73.4 11.5 3.4 5655-3 65.5 64.8 79.7 82.2 73.0 76.9 74.1 77.6 3.6 3.0
5657-1N 55.0 62.9 86.5 105.4 72.2 75.2 72.7 73.9 5.9 5.4 Averaged 61.2 66.1 88.9 90.5 73.6 76.4 73.1 76.2 5.5 3.4
The results indicate that unde-heating became less significant as a result of the retrofit. Minimum recorded temperature rose in nine of the 11 units and dropped by less than 1°F in the other two
-100
102030405060708090
100110120
Tem
pera
ture
(°F)
-100
102030405060708090
100110120
Tem
pera
ture
(°F)

20
units. On average, unit minimum temperature rose by 4.9°F after the retrofit, with the greatest improvement in the west wing unit 5651-1 (9.8°F). Figure 13 plots the minimum recorded unit temperature in Building A at each 30-minute interval over the course of the study period.
Figure 13. Lowest unit temperature at Building A versus outside temperature
Meanwhile, standard deviations dropped in 10 of the 11 units, representing a reduction in the magnitude of the temperature swings. This was especially true in units 5651-1 and 5645-1N (located respectively on the west and north sides), where this metric improved by 8.1°F and 5.4°F, respectively. Mean standard deviation in all units decreased from 5.5°F to 3.4°F.
While temperature spreads did narrow and underheating was less common after retrofit, median temperatures also rose slightly in eight of the 11 units. On average, median temperatures increased by an average 3.1°F. (Excluding outlier unit 52-1, which experienced a wide range of temperatures between 70 and 104°F in the post-retrofit period, the average median temperature rise was 1.5°F.) Every unit had median temperatures in the post-retrofit period above 70°F. Seven of the 11 units had median temperatures above 75°F after retrofit, as opposed to only three of the 11 units before retrofit, suggesting that overheating had become a problem and the outdoor reset control was set too high. However, given the narrower temperature spread across units (shown in the next section) and the higher minimum unit temperatures, these data suggest that maintenance may be able to lower the cut-in set point next year and reduce heating fuel usage.
3.3.3.2 Analysis of Temperature Imbalance Across Units Mean differentials for the pre-retrofit and post-retrofit periods showed an improvement in temperature spread from 22.1°F to 15.5°F. This measure of temperature spread is plotted over time in Figure 14. Pre- and post-retrofit averages are shown in green and red.
-10
0
10
20
30
40
50
60
70
80
Tem
pera
ture
(°F
)
Pre-Retrofit Post-Retrofit
Lowest unit temperature
21
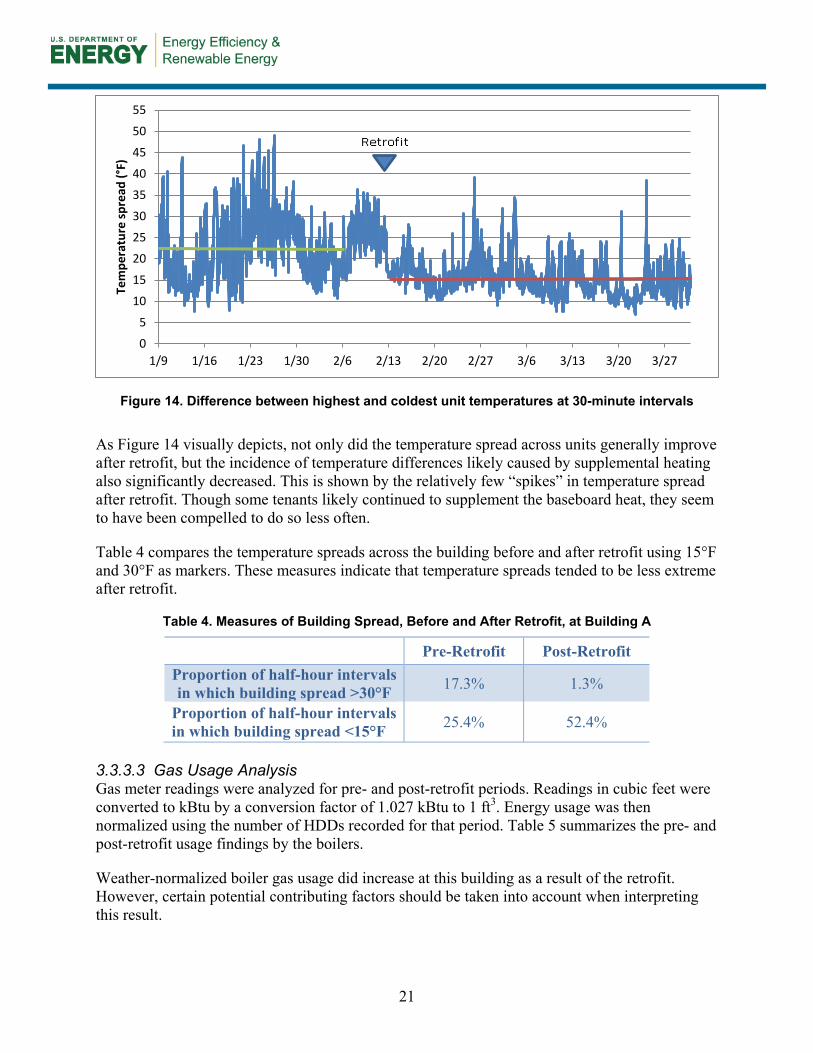
Figure 14. Difference between highest and coldest unit temperatures at 30-minute intervals
As Figure 14 visually depicts, not only did the temperature spread across units generally improve after retrofit, but the incidence of temperature differences likely caused by supplemental heating also significantly decreased. This is shown by the relatively few “spikes” in temperature spread after retrofit. Though some tenants likely continued to supplement the baseboard heat, they seem to have been compelled to do so less often.
Table 4 compares the temperature spreads across the building before and after retrofit using 15°F and 30°F as markers. These measures indicate that temperature spreads tended to be less extreme after retrofit.
Table 4. Measures of Building Spread, Before and After Retrofit, at Building A
Pre-Retrofit Post-Retrofit Proportion of half-hour intervals in which building spread >30°F 17.3% 1.3%
Proportion of half-hour intervals in which building spread <15°F 25.4% 52.4%
3.3.3.3 Gas Usage Analysis Gas meter readings were analyzed for pre- and post-retrofit periods. Readings in cubic feet were converted to kBtu by a conversion factor of 1.027 kBtu to 1 ft3. Energy usage was then normalized using the number of HDDs recorded for that period. Table 5 summarizes the pre- and post-retrofit usage findings by the boilers.
Weather-normalized boiler gas usage did increase at this building as a result of the retrofit. However, certain potential contributing factors should be taken into account when interpreting this result.
0
5
10
15
20
25
30
35
40
45
50
55
1/9 1/16 1/23 1/30 2/6 2/13 2/20 2/27 3/6 3/13 3/20 3/27
Tem
pera
ture
spre
ad (°
F)

22
Table 5. Boiler Gas Usage in Pre- and Post-Retrofit Periods at Building A
Boiler Gas Usage (ft3)
Boiler Gas Usage (kBtu) HDD kBtu/HDD
Pre-Retrofit 326,487 335,302 1,257 266.7
Post-Retrofit 575,185 590,715 1,476 400.2 As shown in Table 3, some units were underheated in the pre-retrofit period. Ten of the 11 units experienced temperatures lower than 68°F prior to retrofit, and mean temperatures in 2 units were below 68°F. Maintenance and ownership indicated several times before and during the study that some tenants would sometimes use oven ranges to supplement the heat in their units. The extreme and sudden air temperature spikes recorded over the course of the sample period are evidence of this. In the absence of sufficient, even heating from their baseboards, some tenants appear to have taken the heating situation into their own hands.
After retrofit, the temperature spikes decreased in frequency, suggesting that tenants used their oven ranges less. However, average temperatures also increased in nine of the 11 units. Since heat from oven ranges apparently decreased but the air temperatures did not decrease, it is likely that the heating load was shifted from tenants’ oven ranges onto the boiler. Oven ranges at the building are individually metered, and the meter installed for this study measured boiler gas usage only. If more of the heating load was supplied by the boiler than by oven ranges, it is expected that boiler gas usage would increase as a result of this retrofit. This would explain the rise in gas usage in Table 5.
As has been suggested above, it is possible that next heating season maintenance may be able to lower the set point and/or use the temperature averaging controls as a result of the pump retrofit, which improved the balance in the building. Doing so would likely decrease boiler gas usage, resulting in savings to the building owner. Shifting the heating load away from oven ranges and onto the central heating system would be a necessary first step before these savings are possible.
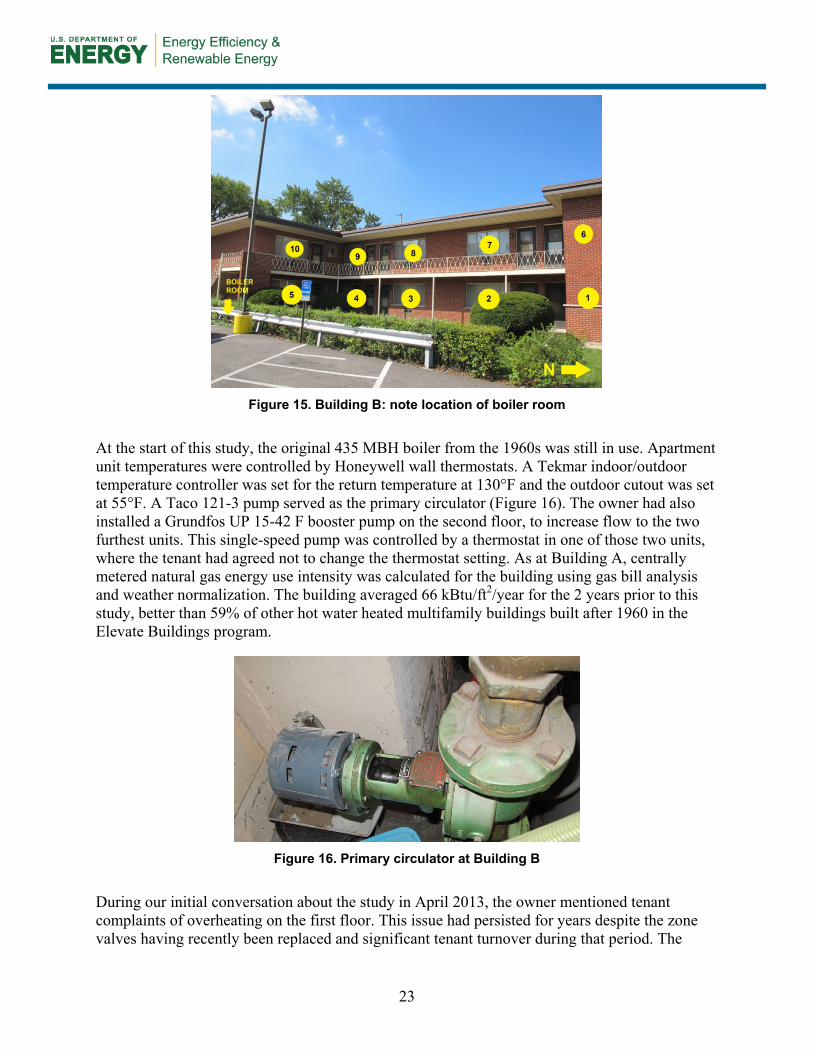
3.4 Building B 3.4.1 Background Building B is a 10-unit, two-story, California style building constructed in 1961. Roughly arranged in an “L” shape with five units on each floor (Figure 15), the building uses an underfloor radiant heating system with individual zones for each apartment. The boiler room is located in a basement in the southeast corner.11
11 Like Building A, central space heating and domestic hot water heating are master metered and paid for by the owner. In-unit electricity and natural gas usage (i.e., oven ranges) is metered by unit and paid for by the tenants.
23
Figure 15. Building B: note location of boiler room
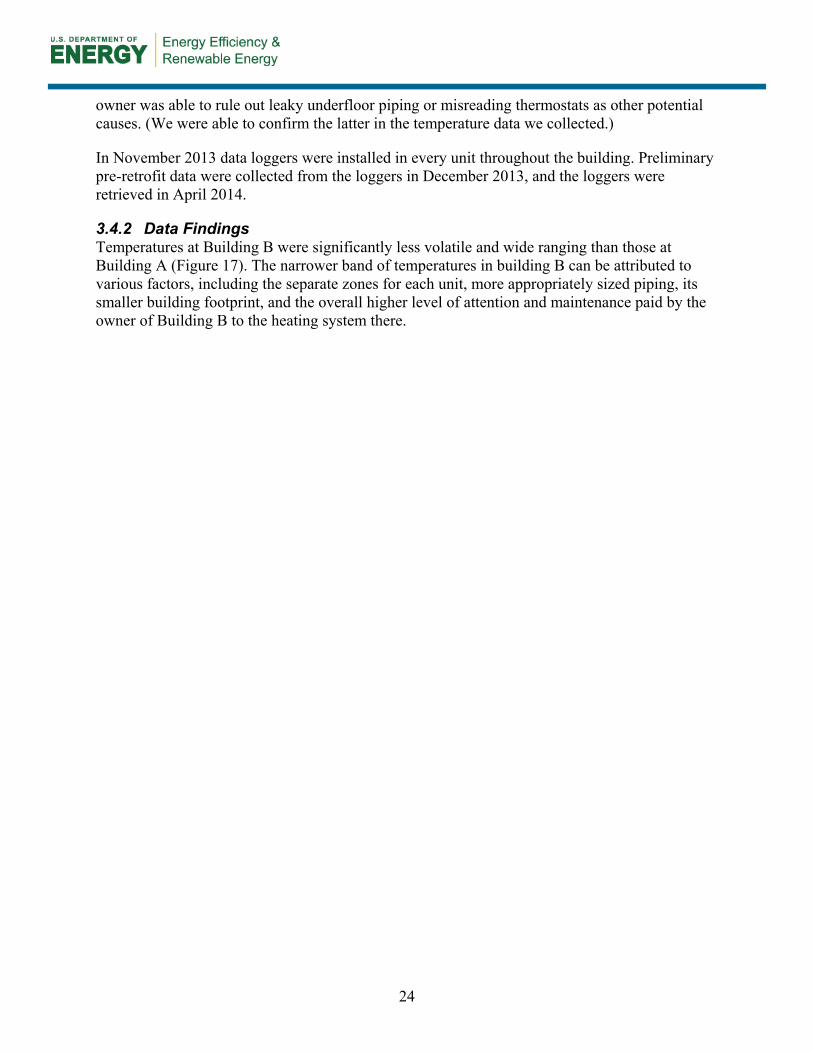
At the start of this study, the original 435 MBH boiler from the 1960s was still in use. Apartment unit temperatures were controlled by Honeywell wall thermostats. A Tekmar indoor/outdoor temperature controller was set for the return temperature at 130°F and the outdoor cutout was set at 55°F. A Taco 121-3 pump served as the primary circulator (Figure 16). The owner had also installed a Grundfos UP 15-42 F booster pump on the second floor, to increase flow to the two furthest units. This single-speed pump was controlled by a thermostat in one of those two units, where the tenant had agreed not to change the thermostat setting. As at Building A, centrally metered natural gas energy use intensity was calculated for the building using gas bill analysis and weather normalization. The building averaged 66 kBtu/ft2/year for the 2 years prior to this study, better than 59% of other hot water heated multifamily buildings built after 1960 in the Elevate Buildings program.
Figure 16. Primary circulator at Building B
During our initial conversation about the study in April 2013, the owner mentioned tenant complaints of overheating on the first floor. This issue had persisted for years despite the zone valves having recently been replaced and significant tenant turnover during that period. The
24
owner was able to rule out leaky underfloor piping or misreading thermostats as other potential causes. (We were able to confirm the latter in the temperature data we collected.)
In November 2013 data loggers were installed in every unit throughout the building. Preliminary pre-retrofit data were collected from the loggers in December 2013, and the loggers were retrieved in April 2014.
3.4.2 Data Findings Temperatures at Building B were significantly less volatile and wide ranging than those at Building A (Figure 17). The narrower band of temperatures in building B can be attributed to various factors, including the separate zones for each unit, more appropriately sized piping, its smaller building footprint, and the overall higher level of attention and maintenance paid by the owner of Building B to the heating system there.

25
Figure 17. Temperatures collected at Building B
-10
-5
0
5
10
15
20
25
30
35
40
45
50
55
60
65
70
75
80
85
90
Tem
pera
ture
(°F)
1
2
3
4
5
6
7
8
9
0
outside

26
In line with the owner’s concern, the first floor did regularly experience higher temperatures than the second floor during the sample period. First floor unit readings were generally ranged between 76°F and 85°F (Figure 18), while on the second floor temperature tended to oscillate between 72°F and 82°F (Figure 19). Note that second floor unit #8 read especially low because the tenant there preferred to set the thermostat at 60°F.
Figure 18. Temperatures in first floor units of Building B
Figure 19. Temperatures in second floor units of Building B
69
71
73
75
77
79
81
83
85
87
Tem
pera
ture
(°F)
1
2
3
4
5
60
62
64
66
68
70
72
74
76
78
80
82
84
Tem
pera
ture
(°F)
6
7
8
9
10

27
3.4.3 Analysis 3.4.3.1 Summary of Unit Temperatures Metrics were calculated to evaluate the range of unit temperatures at Building B. Table 6 gives summary statistics by unit.
Table 6. Summary Statistics for Unit Temperatures (°F) in Building B
Unit Min Max Mean Median SD 1 72.0 88.1 80.0 79.7 1.7 2 75.5 83.6 79.2 79.2 1.1 3 75.0 82.3 79.3 79.5 1.0 4 69.6 86.6 81.3 81.6 2.6 5 73.4 85.7 80.4 80.7 2.1 6 66.2 84.1 75.1 74.6 3.3 7 70.8 77.4 73.8 73.9 1.2 8 60.4 72.0 64.8 64.7 1.8 9 70.8 83.8 78.5 78.3 2.3 10 71.0 83.6 77.9 78.1 2.1
Averaged 70.5 82.7 77.0 77.0 1.9 These figures confirm the higher first floor temperatures seen in Figure 18 and Figure 19. Median temperatures in the first floor units were 79.2°–81.6°F (mean 80.1°F), while the second floor unit medians were 64.7°–78.3°F (mean 73.9°F). These ranges indicate a moderate temperature disparity between floors, but they are not proof of imbalance. Since units were individually zoned, it is possible that first floor tenants could have had higher thermostat set points than those on the second floor. Set points are dealt with in Section 3.4.3.3.
3.4.3.2 Comparison of Unit Temperatures Between Test Buildings In every measure shown on Table 3, Building B performed as well as or better than Building A:
• Underheating: Minimum unit temperatures suggest that underheating was much less an issue here than at Building A. With the exception of unit #8, where the tenant preferred to keep a low set point, unit temperatures never dropped below 66.2°F. Meanwhile, even after retrofit minimum unit temperatures at Building A ranged from 58.5°F to 67.6°F.
• Temperature variability: Units here experienced narrower temperature bands. The mean unit standard deviation for Building B was 1.9°F versus 3.4°F for post-retrofit Building A.
• Overheating: Building B units were heated to about the same degree as Building A, as indicated by the average temperatures measured. Median unit temperatures topped 75°F in seven of 10 units here versus seven of 11 units at Building B, with averages at 77.0°F and 76.2°F, respectively.
Weather conditions at Building A and Building B were similar, as seen by a comparison of outside temperatures recorded at each, found in Appendix B.
28
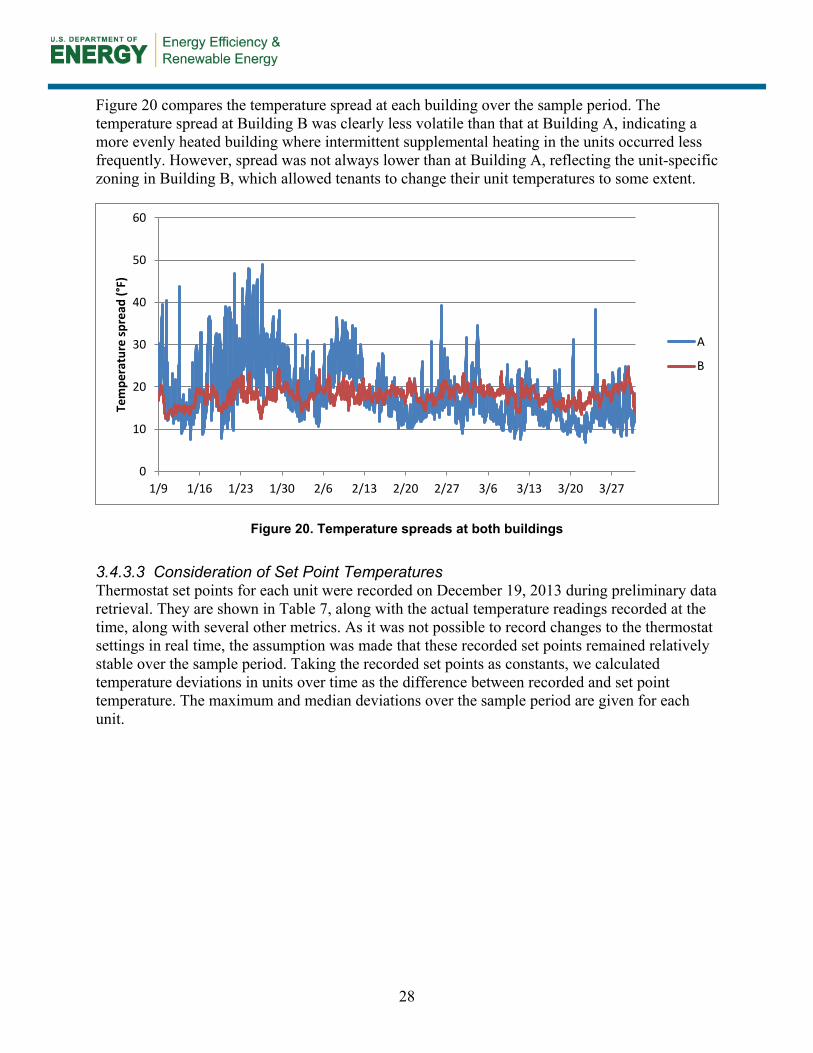
Figure 20 compares the temperature spread at each building over the sample period. The temperature spread at Building B was clearly less volatile than that at Building A, indicating a more evenly heated building where intermittent supplemental heating in the units occurred less frequently. However, spread was not always lower than at Building A, reflecting the unit-specific zoning in Building B, which allowed tenants to change their unit temperatures to some extent.
Figure 20. Temperature spreads at both buildings
3.4.3.3 Consideration of Set Point Temperatures Thermostat set points for each unit were recorded on December 19, 2013 during preliminary data retrieval. They are shown in Table 7, along with the actual temperature readings recorded at the time, along with several other metrics. As it was not possible to record changes to the thermostat settings in real time, the assumption was made that these recorded set points remained relatively stable over the sample period. Taking the recorded set points as constants, we calculated temperature deviations in units over time as the difference between recorded and set point temperature. The maximum and median deviations over the sample period are given for each unit.
0
10
20
30
40
50
60
1/9 1/16 1/23 1/30 2/6 2/13 2/20 2/27 3/6 3/13 3/20 3/27
Tem
pera
ture
spre
ad (°
F)
A
B
29
Table 7. Temperature Deviation Between Recorded and Set Point Temperatures (°F) in Building B
Unit Set Point (12/19)
Actual (12/19)12
Deviation Max (11/13 – 3/31)
Deviation Median (11/13 – 3/31)
1 75 78.4 13.1 4.7
2 70 79.3 13.6 9.2
3 75 79.5 7.3 4.5
4 60 83.2 26.6 21.6
5 74 79.0 11.7 6.7
6 74 78.2 10.1 0.6
7 73 74.6 4.4 0.9
8 60 64.3 12.0 4.7
9 73 80.0 10.8 5.3
10 75 78.4 8.6 3.1
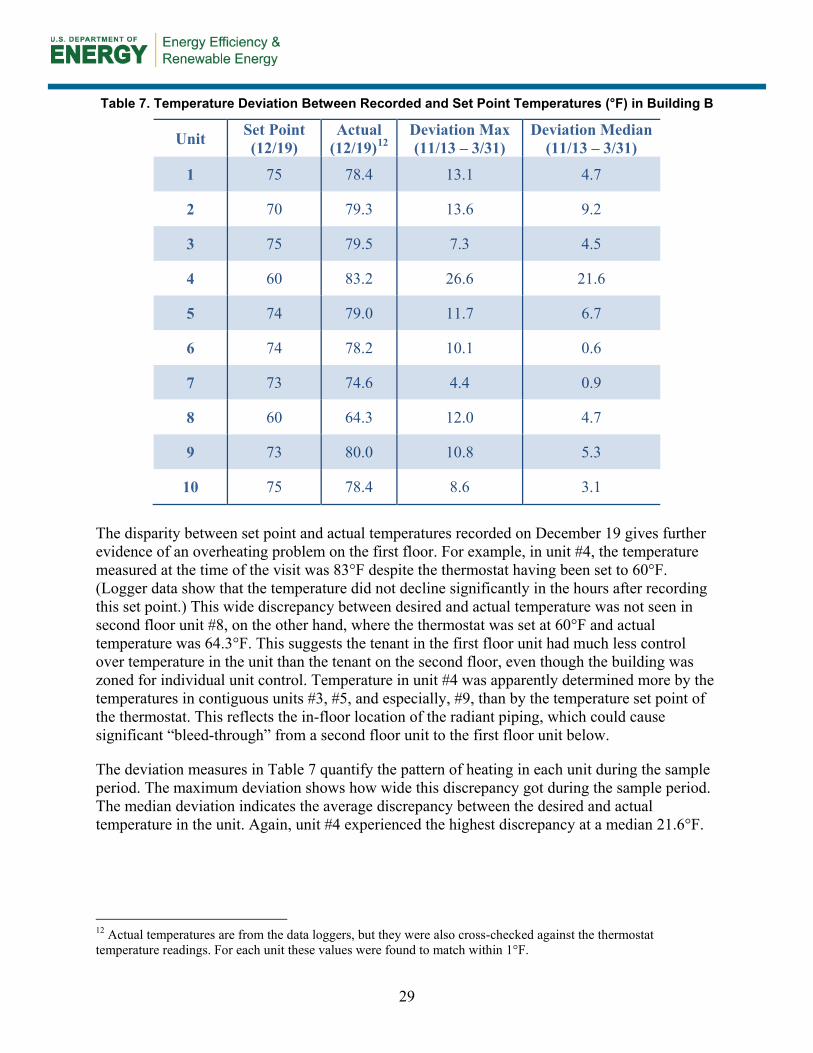
The disparity between set point and actual temperatures recorded on December 19 gives further evidence of an overheating problem on the first floor. For example, in unit #4, the temperature measured at the time of the visit was 83°F despite the thermostat having been set to 60°F. (Logger data show that the temperature did not decline significantly in the hours after recording this set point.) This wide discrepancy between desired and actual temperature was not seen in second floor unit #8, on the other hand, where the thermostat was set at 60°F and actual temperature was 64.3°F. This suggests the tenant in the first floor unit had much less control over temperature in the unit than the tenant on the second floor, even though the building was zoned for individual unit control. Temperature in unit #4 was apparently determined more by the temperatures in contiguous units #3, #5, and especially, #9, than by the temperature set point of the thermostat. This reflects the in-floor location of the radiant piping, which could cause significant “bleed-through” from a second floor unit to the first floor unit below.
The deviation measures in Table 7 quantify the pattern of heating in each unit during the sample period. The maximum deviation shows how wide this discrepancy got during the sample period. The median deviation indicates the average discrepancy between the desired and actual temperature in the unit. Again, unit #4 experienced the highest discrepancy at a median 21.6°F.
12 Actual temperatures are from the data loggers, but they were also cross-checked against the thermostat temperature readings. For each unit these values were found to match within 1°F.
30
4 Discussion
4.1 Imbalance Temperature data collected at the two test buildings illustrate two examples of significant temperature imbalances that can exist in multifamily hydronic buildings. Using high-resolution data, we found that one unit in Building A experienced temperatures that varied by as much as 61°F (unit #5651-1). It is likely this wide range was the result of a tenant opening windows when the unit was too hot and using the oven range for heating when the unit was too cold.
This data also showed the temperature spread across units which is possible in this building type. At several points in the pre-retrofit period, temperatures across different units in Building A differed by as much as 48°F (56°F to 104°F). It is to be expected that in a 100-year-old building with only two zones and a boiler that is not centrally located, some units would have higher temperatures than others. However, the extent of the temperature disparity between units was likely the result of the tenant behaviors discussed above.
Interestingly, temperature spreads at Building B, which was individually zoned and of newer construction, were not always lower than those at Building A. During much of the post-retrofit period, Building A experienced spreads in the 10°–15°F range while Building B ranged between 15°F and 20°F differences. This is most likely to be explained by the fact that one of the units in Building B had set the thermostat at 60°F; although wide, temperature spreads at Building B were fairly regular and did not have the extreme peaks experienced by Building A. Standard deviation in spread was only 1.9°F versus 3.4°F at post-retrofit Building A.
By other measures, Building B performed as well as or better than Building A when subjected to the same weather conditions. Minimum unit temperatures never dropped below 66.2°F, but post-retrofit Building A saw temperatures as low as 58.5°F (though they were uncommon). Median unit temperatures in both buildings topped 75°F in about 70% of the units, indicating overheating.
4.2 Improvement Though conditions in Building A were still less than optimal after retrofit, the addition of a booster pump to its west wing did significantly improve issues with underheating, imbalance, and extreme heating possibly caused by oven ranges. In nine of 11 units, the lowest recorded temperature rose after retrofit, for an average 4.9°F increase. The average building temperature spread decreased from 22.1°F to 15.5°F. Finally, standard deviation in unit temperatures decreased from 5.5°F to 3.4°F, indicating a reduction in the extreme temperature swings that were likely the result of window opening and supplemental heating.
This building had temperature averaging controls installed in 2011, but this retrofit proved ineffective in a situation where one of the wings was chronically underheated and tenants regularly made significant changes to the temperature in their units through methods unrelated to the distribution system. Faced with frequent low-heat and over-heating calls, maintenance decided to bypass the temperature averaging controls and revert to solely using the outdoor reset. The set point was set to nearly 80°F in an effort to prevent low-heating complaints, and the building continued to experience wide-ranging temperatures.

31
Increasing flow rate to the underheated wing served to stabilize the situation and bring the system into better balance. Now that this has been achieved, it is more likely that maintenance will have fewer low-heat and overheating calls, and they should at the very least be able to return to reduce the set point on the outdoor reset control and hopefully will in fact return to using the temperature averaging controls. Experience at this building suggests that it is necessary to get the flow rate right before installing efficiency retrofits such as temperature sensors to “fine-tune” the boiler firing.
32
5 Conclusion
This research project helped to provide an answer to a question issued by the Building America Expert Meeting on hydronic heating in multifamily buildings: How much can the temperature vary within units in a building heated by hot water? With high-resolution temperature data collected in line with NREL protocol from two buildings, we found that unit air temperatures in a poorly balanced building can range by as much as 48°F (56°F to 104°F), particularly if windows are opened or tenants use intermittent supplemental heating sources like oven ranges. This extreme result was even higher than that reported by the ARIES Collaborative, which reported an instantaneous spread in one building of 37.9°F.
The literature review and dissimilar temperatures seen at each building showed that different types of retrofits are necessary for different types of hydronic buildings. As previous PARR research on single-pipe steam systems showed, simple balancing retrofits such as vent replacement and temperature averaging controls can be cost-effective measures for saving energy and improving tenant comfort (Choi 2012). Hydronic systems are much more diverse, including a range of piping configurations, heat emitter styles, and zoning methods. Poor heating balance can result from undersized piping, undersized circulators, malfunctioning zone valves, damaged heat emitters, poor air elimination, misconfigured balancing valves, or a number of other mechanical issues. It can be further exacerbated by tenant behaviors such as window opening or oven range heating, which can dramatically and quickly change the temperature in a unit.
As results from Building A indicate, adding a booster pump to an underheated zone can be one effective method of balancing out an extremely uneven multifamily hydronic building. After retrofit, the average temperature spread in Building A decreased from 22.1°F to 15.5°F. Experience at this building suggests that, in cases where unit temperatures are significantly affected by tenants opening windows or using oven ranges to regulate unit temperature, a temperature averaging control retrofit will likely be ineffective in improving the efficiency of the system. Maintenance may choose to revert to prior, relatively inefficient controls and raise the set points on those to very high temperatures to avoid low-heat calls in underheated units. Increasing flow to an underheated wing can help stabilize the situation and allow for more “fine-tuning” of the system with temperature averaging controls. Energy reduction from and cost effectiveness of the retrofit in these cases is highly contingent on the extent to which tenants are supplying their own heat with their own sources. However, the potential improvements to tenant comfort, health, and safety, not to mention the reduced time and cost spent dealing with tenant complaints, make hydronic balancing highly beneficial to owner and tenants alike, in buildings facing very significant balance problems.

33
References
ASHRAE (2012). ASHRAE Handbook: HVAC Systems and Equipment, Hydronic Heat-Distributing Units and Radiators.
Building America (2014). Research for the American Home. Website. Accessed 3/11/2014 at http://energy.gov/eere/buildings/building-america-research-american-home.
Caleffi Hydronic Solutions (2012). Hydronic Fundamentals. idronics Journal of Design Innovation for Hydronic Professionals. Issue 12, January 2013.
Choi, J., Ludwig, P., Brand, L. (2012). Steam System Balancing and Tuning for Multifamily Residential Buildings in Chicagoland. Partnership for Advanced Residential Retrofit. July 2012.
ClimateMaster (2011). Essentials of Hydronics for GSHP Professionals.
Dentz, J.; Henderson, H.; Varshney, K. (2014). “Hydronic Heating Retrofits for Low-Rise Multifamily Buildings.” The ARIES Collaborative.
Dentz, J.; Varshney, K.; Henderson, H. (2013). “Overheating in Hot Water- and Steam-Heated Multifamily Buildings.” The ARIES Collaborative.
Deutsche Bank (2012). The Benefits of Energy Efficiency in Multifamily Affordable Housing.
Elevate Energy (2014a). “About Elevate Energy.” Accessed on 4/17/2014 at http://www.elevateenergy.org/about/.
Elevate (2014b). Preserving Affordable Multifamily Housing through Energy Efficiency: Non-Energy Benefits of Energy Efficiency Building Improvements. January 2014.
Hoger, R., and Bailey, B. (2012). “Hydronic System Fundamentals.” Seminar at Temperature Equipment Corporation (TEC) Center on October 24, 2012. http://tecstorage.com/controls/hydronic/1%20-%20Hydronic%20Fundamentals.pdf
Holohan, D (2011). Classic Hydronics: How to Get the Most From Those Older Hot-Water Heating Systems.
Joyce, M. (2005). Residential Construction Academy: Plumbing. Thomson Delmar Learning.
Landry, R. (2012). Variable Speed Pumping in Condensing Boiler Systems. Webinar, October 9, 2012. http://mncee.org/Innovation-Exchange/Resources/Variable-Speed-Pumping-in-Condensing-Boiler-System/
Liao, Z.; Dexter, A.L. (2004). “The potential for energy saving in heating systems through improving boiler controls.” Energy and Buildings; 36(3); pp. 261-271.
NREL (2013). The Building America Indoor Temperature Study Measurement Protocol, Version 04. Draft, February 28, 2013. Golden, CO: National Renewable Energy Laboratory.

34
RECS (2009). Table HC6.6 Space Heating in U.S. Homes, by Climate Region, 2009. Residential Energy Consumption Survey
Vastyan, John (2012). “Variable-Speed Pumping.” Accessed 18 April 2014 at http://hpac.com/mag/variable-speed-pump-1212.

35
Appendix A: Sample Tenant Letter13
13 CNT Energy is the former name of Elevate Energy. The name was changed in the middle of the study.

36
Appendix B: Outside Temperatures at Buildings A and B
Figure 21. Comparison of outside temperatures recorded at Building A and Building B
-10
0
10
20
30
40
50
60
70
0 1000 2000 3000 4000 5000 6000 7000 8000 9000
Building A
Building B

DOE/GO-102014-4463 ▪ July 2014
Printed with a renewable-source ink on paper containing at least 50% wastepaper, including 10% post-consumer waste.
buildingamerica.gov