bad to the bone: empirically defining and measuring
TRANSCRIPT

The Pennsylvania State University
The Graduate School
College of the Liberal Arts
BAD TO THE BONE: EMPIRICALLY DEFINING AND MEASURING
NEGATIVE LEADERSHIP
A Dissertation in
Psychology
by
Brian W. Tate
© 2009 Brian W. Tate
Submitted in Partial Fulfillment of the Requirements
for the Degree of
Doctor of Philosophy
August 2009

The dissertation of Brian W. Tate was reviewed and approved* by the following: Rick R. Jacobs Professor of Psychology Dissertation Advisor Chair of Committee James L. Farr Professor of Psychology Samuel T. Hunter Assistant Professor of Psychology Susan Mohammed Director of Graduate Training Associate Professor of Psychology Linda K. Treviño Distinguished Professor of Organizational Behavior & Ethics * Signatures are on file in the Graduate School

ABSTRACT
Research on negative leadership has grown in popularity in recent years. This
proliferation is not surprising given the frequency with which instances of negative
leadership occur and the severity of its consequences. Despite the increased attention
given to the topic however, the area still suffers from a lack of attempts to define and
measure negative leader behavior as a broad-level construct. The present research project
addressed both issues through four studies. In Study 1, a comprehensive inventory of
negative leader behavior was generated. Using multidimensional scaling, in Study 2,
three dimensions were found to underlie the inventory of behaviors, including
“organization-directed/subordinate-directed,” “insidiously-damaging/immediately-
damaging,” and “norm-violating/rule-violating” dimensions. Study 3’s confirmatory
factor analysis identified three negative leader behavior factors, including “subordinate-
directed,” “organization-directed,” and “sexual harassment” factors. Finally, in Study 4,
evidence of the construct and criterion validity of the new measure of negative leader
behavior was obtained. Based on findings across the four studies, the similarities and
differences between negative leader behavior, as a broad-level construct, and other forms
of leader and non-leader-specific negative workplace behavior are discussed, along with
implications of the project for future research and potential practical applications.
iii

TABLE OF CONTENTS
List of Tables………………………………………………………………..……………………..v List of Figures………………………………………………………………………….…………vii Acknowledgements……………...……...…………………………………………………..…...viii Chapter 1: INTRODUCTION ..........................................................................................................1
Characteristics of the Behaviors of Interest to the Present Study ....................................2 Explanations for the Prevalence of Negative Leader Behavior .......................................2 The Importance of Studying Negative Leader Behavior .................................................4 Existing Research Relevant to Negative Leadership .......................................................9 Potential Organizing Dimensions...................................................................................38 Summary and Study Objectives .....................................................................................39
Chapter 2: STUDY 1: ITEM GENERATION ...............................................................................40
Method ...........................................................................................................................41 Results & Discussion .....................................................................................................42
Chapter 3: STUDY 2: MULTIDIMENSIONAL SCALING ANALYSIS.....................................44
Method ...........................................................................................................................45 Results ............................................................................................................................47 Discussion ......................................................................................................................52
Chapter 4: STUDY 3: CONFIRMATORY FACTOR ANALYSIS ..............................................54
Method ...........................................................................................................................54 Results ............................................................................................................................55 Discussion ......................................................................................................................58
Chapter 5: STUDY 4: VALIDATION ...........................................................................................60
Method ...........................................................................................................................68 Results ............................................................................................................................73
Chapter 6: GENERAL DISCUSSION ...........................................................................................82
Conclusions Regarding the Structure of Negative Leader Behavior .............................84 Conclusions Regarding Previous Research on Negative Leader Behavior....................89 Implications for Future Research ...................................................................................92 Practical Implications.....................................................................................................94 Limitations .....................................................................................................................94 Summary ........................................................................................................................97
References ......................................................................................................................................98 Appendix: Tables and Figures......................................................................................................121
iv

LIST OF TABLES
Table 1: Neuman and Baron’s (2005) behavioral examples of aggression based on Buss’s (1961) dimensions....................................................................................................................................121 Table 2: Sample characteristics for Study 1 .................................................................................122 Table 3: List of negative leader behaviors generated in Study 1..................................................123 Table 4: Stress values associated with dimensions 1 through 6 ...................................................125 Table 5: Behavior-dimension scores for the three-dimensional solution .....................................126 Table 6: Behaviors included in the eight negative leader behavior categories.............................130 Table 7: 40-item measure of negative leader behavior created in Study 2...................................133 Table 8: Results of dimension label-dimension score regression analysis...................................134 Table 9: Mapping of previously studied constructs onto the eight negative leader behavior categories......................................................................................................................................135 Table 10: Sample characteristics for Study 3 ...............................................................................137 Table 11: Results of Study 3’s CFA.............................................................................................138 Table 12: Factors, Behaviors, and Factor Loadings Resulting from Study 3’s CFA ...................139 Table 13: Sample characteristics for Study 4 ...............................................................................140 Table 14: Final measure of negative leader behavior used in Study 4 .........................................141 Table 15: Pearson correlation matrix for study 4 variables..........................................................142 Table 16: Kendall’s tau correlation matrix for study 4 variables .................................................143 Table 17: Follower job satisfaction regressed on control variables and negative leader behavior factors and overall scores .............................................................................................................144 Table 18: Follower liking for leader regressed on control variables and negative leader behavior factors and overall scores .............................................................................................................145 Table 19: Follower turnover intentions regressed on control variables and negative leader behavior factors and overall scores ..............................................................................................146
v

Table 20: Follower interpersonal deviance regressed on control variables and negative leader behavior factors and overall scores ..............................................................................................147 Table 21: Follower organizational deviance regressed on control variables and negative leader behavior factors and overall scores ..............................................................................................148 Table 22: Overall follower deviance regressed on control variables and negative leader behavior factors and overall scores .............................................................................................................149 Table 23: Binary regression of followers’ leader effectiveness judgments on control variables and negative leader behavior factors and overall scores .....................................................................150 Table 24: Welch’s t-tests of differences in negative leader behavior scores according to followers’ leader effectiveness judgment ......................................................................................................151 Table 25: Incremental validity of the negative leader behavior measure over abusive supervision in predicting follower job satisfaction ..........................................................................................152 Table 26: Incremental validity of the negative leader behavior measure over abusive supervision in predicting follower liking for leader ........................................................................................153 Table 27: Incremental validity of the negative leader behavior measure over abusive supervision in predicting follower turnover intentions ....................................................................................154 Table 28: Incremental validity of the negative leader behavior measure over abusive supervision in predicting follower interpersonal deviance ..............................................................................155 Table 29: Incremental validity of the negative leader behavior measure over abusive supervision in predicting follower organizational deviance ............................................................................156 Table 30: Incremental validity of the negative leader behavior measure over abusive supervision in predicting overall follower deviance ........................................................................................157 Table 31: Incremental validity of the negative leader behavior measure over abusive supervision in predicting followers’ leader effectiveness judgment................................................................158
vi

LIST OF FIGURES Figure 1. Illustration of the state of existing research on constructs related to negative leader behavior ........................................................................................................................................160 Figure 2. Scree plot of stress values for the MDS analysis .......................................................161 Figure 3. Factor structure of the negative leader behavior measure............................................162 Figure 4. Standardized path coefficients for the validation model ............................................163 Figure 5. Overlap among negative leader behavior factors and other leader- and non-leader-specific constructs ........................................................................................................................164
vii

viii
ACKNOWLEDGEMENTS
I would like to thank Rick Jacobs for being a great advisor and friend, Sam Hunter and
Jim Farr for their help throughout the project, my parents Ken and Marilyn for supporting
me through graduate school, my friends for not making me talk about my dissertation
when I didn’t want to, my fur daughter Emma and fur son Tommy for being fun to spend
time with, and April for marrying me when I didn’t have much besides my dissertation.

Chapter 1
INTRODUCTION
Although research has traditionally focused on positive aspects of leader behavior
(Kelloway, Mullen, & Francis, 2006; Padilla, Hogan, & Kaiser, 2007), several authors
have suggested that many people in leadership and managerial positions may not only be
ineffective but may be destructive or toxic toward the work environment. DeVries and
Kaiser (2003) estimated that half of all managers may qualify as incompetent. According
to people in subordinate positions, this number may be even greater; Hogan and Kaiser
(2005) cited statistics showing that 65% to 75% of workers from the general population
consider their bosses to be the worst part of their job. Certainly, leadership research
should take negative leader behavior into consideration.
The prevalence of “incompetent” individuals in leadership positions is not
surprising given the quality of the procedures that many organizations use to select
individuals for those positions and how they are evaluated once there. Often,
organizations make decisions to promote people into leadership positions based on
factors other than their ability and skill in leading and managing others. According to the
“Peter Principle” (Peter & Hull, 1996) organizations tend to promote people through
managerial ranks until they reach a “level of incompetence” and are unable or unprepared
to meet the demands of a job. Consequently, many individuals in supervisory positions
lack an understanding of how to manage people (Lloyd, 2006). Compounding the
problem, organizations are often reluctant to remove underperforming employees from
leadership positions due to the high costs of hiring and training new workers (Bell &
Smith, 1991).
1

Characteristics of the Behaviors of Interest to the Present Study
Before further discussion of issues related to negative leader behavior, it is useful
to first provide some background on the behaviors upon which the present study will
focus. Research suggests that a distinction can be made between behaviors committed
intentionally and those committed unintentionally. Kellerman (2004) argued that
negative leader behavior ranges from incompetent to purposefully evil. For example,
unintentional behavior includes the managerial decision making errors discussed by Nutt
(e.g., Nutt, 1999; Nutt, 2004). On the other hand, intentional behavior includes actions
like verbal abuse, taking credit for a subordinate’s work, and intentionally withholding
important information (Duffy, Ganster, & Pagon, 2002; Tepper, 2000). The present
study will focus on the latter type of behavior, those committed intentionally or that are
likely to be perceived as so by others.
Another characteristic of the behaviors of interest to the present study is that they
are in some way negative for followers and/or the organization. Behaviors that are in
some way negative include those that are likely to result in negative outcomes and/or are
likely to be perceived as inherently deviant, harmful, or inappropriate by others. Within a
comprehensive inventory of such behaviors, the present proposes to identify the factorial
structure of the negative leader behavior construct and to create and validate a measure of
the behaviors.
Explanations for the Prevalence of Negative Leader Behavior
Now turning back to a more general discussion of negative leadership, besides the
organizational policies already mentioned that promote incompetent leadership, there are
several reasons why leaders engage in negative behavior. First, such behavior is often
2

encouraged by others. In many organizations, leaders who engage in behaviors that
intimidate or threaten individuals in subordinate positions are regarded as “tough” or
“courageous” organizational employees who fight for their organizations and develop
strong followers (Bell & Smith, 1991; Lloyd, 2006). Consequently, even abusive,
threatening, and self-serving leaders and managers may be evaluated positively by
organizational members other than their followers.
Second, some of the strategies that help individuals to reach leadership positions,
such as impression management and manipulation of information, may engender negative
outcomes once individuals reach those positions (Conger, 1990). For example,
exaggerating the importance of achieving one’s vision (Conger, 1990) may lead to the
conferral of leadership status by drawing others’ attention and respect in something like a
leaderless group discussion, but the same behavior enacted by someone already in a
leadership position may lead to confusion and disillusionment among followers. As
another example, research shows the trait of dominance to positively predict the extent to
which individuals are perceived as leaders by others (Lord, DeVader, & Alliger, 1986).
However, once in a leadership position, expressions of dominance, through actions like
not sharing power in decision-making processes, are associated with negative group
outcomes (Top 10 Mistakes that New Managers Make). Thus, in some cases, the
strategies that individuals use as a means of acquiring a leadership position do not
become truly negative or counterproductive until a leadership position has been reached.
Finally, leaders often rely on their own management strategies or use out-dated
strategies (Lloyd, 2006) and may see value in using negative behavior as a motivational
technique. This tendency seems to be a symptom of a lack of accurate and meaningful
3

feedback given to people in leadership positions as well as a lack of an emphasis on the
successful development of people in leadership positions. In many cases, leaders may
adhere to management strategies that promote aggressive and/or bullying behavior
because they are unaware that those behaviors are likely to have negative outcomes.
As explanations for the prevalence of negative leader behavior imply, leaders’
decisions to engage in negative behaviors can likely be explained by an expectancy
decision-making framework. According to Vroom’s (1964) VIE (valence-
instrumentality-expectancy) model, people are motivated to engage in a behavior to the
extent that they believe expending effort will result in a desired level of performance, that
the performance level will result in a specific outcome, and that the outcome is valuable.
Expectancy refers to the first relationship, the perception that engaging in a behavior will
result in a given level of performance. Issac, Zerbe, and Pitt (2001) applied expectancy
theory to leader-follower relationships and argued that the leaders have expectations that
engaging their followers in a certain way will lead to a desired level of performance
among followers. Applied to cases of negative leader behavior, based on encouragement
from others, learned strategies for advancement, and their own leadership strategies,
leaders who engage in negative behavior likely do so because they expect those behaviors
to lead to greater follower performance.
The Importance of Studying Negative Leader Behavior
Regardless of why leaders engage in negative leader behavior, such behavior is
likely to have negative outcomes for followers and organizations. Research shows leader
behavior to account for a significant amount of variance in individual-follower, group,
and organizational outcomes. Regarding follower outcomes, evidence for the importance
4

of leader behaviors comes from four sources, including research on substitutes for
leadership, leadership style, dimensions of leader behaviors, and the nature of leader-
follower relationships. Leader behaviors and substitutes for leadership, defined as
situational variables that can substitute for, enhance, or neutralize the effects of leader
behaviors (e.g., subordinate ability, task feedback, and group cohesiveness) (Podsakoff,
MacKenzie, & Bommer, 1996) have been primarily studied by Podsakoff and colleagues.
In studies that compared the validity of leader behaviors and leadership substitutes in
predicting follower outcomes, both Podsakoff, Niehoff, MacKenzie, and Williams (1993)
and Podsakoff, MacKenzie, and Bommer (1996) found aggregate leader behaviors to
account for more variance in follower job performance than substitutes. Also, in both
studies, although not as strongly as substitutes for leadership, leader behaviors
significantly predicted follower organizational citizenship behaviors, role conflict, job
satisfaction, commitment, and role ambiguity.
Research on leadership styles also shows leader behavior to have a strong effect
on follower outcomes. A meta-analysis by Judge and Piccolo (2004) found large effect
sizes between transformational leadership and follower job satisfaction and motivation as
well as between contingent reward leadership and follower job satisfaction and
motivation. A great deal of other research has also found strong relationships between
leadership style and follower affective, attitudinal, and performance-based outcomes
(e.g., Pillai & Williams, 2004; Whittington, Goodwin, & Murray, 2004).
Such research is consistent with findings from large-scale quantitative reviews of
the outcomes of leader behavior. A meta-analysis by Judge, Piccolo, and Ilies (2004)
found significant effect sizes between leader consideration and follower job satisfaction
5

and between consideration and follower motivation. Leader initiation of structure had a
significant effect size with follower job satisfaction and follower motivation. In addition,
Podsakoff, Bommer, Podsakoff, and MacKenzie (2006) found strong effect sizes between
leader contingent and non-contingent reward and punishment behavior and a wide range
of follower outcomes.
Lastly regarding the relationships between leadership and follower outcomes,
research shows that the nature of leader-follower relationships shapes a large extent of
followers’ overall work experience. The quality of leader-follower relationships has been
found to relate to a wide range of follower outcomes. A meta-analysis by Gerstner and
Day (1997) found significant effect sizes between leader-member exchange quality
(LMX) and follower job performance, job satisfaction, organizational commitment, role
conflict and clarity, and turnover intentions. LMX has also been linked to follower
citizenship behavior (Ilies, Nahrgang, & Morgeson, 2007). Additionally, Dirks and
Ferrin (2002) found significant effect sizes between followers’ trust in their leaders and
follower job performance, organizational citizenship behavior (OCB), intentions to quit,
organizational commitment, and job satisfaction. Such research on the quality of leader-
follower relationships suggests that, as Gerstner and Day argued, individuals’
relationships with their leaders can be thought of as a lens through which their entire
work experience can be viewed and are predictive of a wide range of affective,
attitudinal, and performance outcomes.
Negative leader behavior is likely to affect follower job performance and attitudes
by violating the perceptions of justice of victims of the behaviors. A study by Tepper
(2000) found a negative relationship between abusive supervision and followers’ justice
6

perceptions, which in turn, have been found to predict job satisfaction, organizational
commitment, organizational citizenship behaviors, and job performance by Tepper’s
study and others (e.g., Colquitt, Conlon, Wesson, Porter, & Ng, 2001). Among the
different categories of justice perceptions (distributive, procedural, and interactional),
negative leader behavior may be most likely to come at a cost of interactional justice,
which refers to the nature of individuals’ interpersonal relationships at work and has been
linked to a variety of outcomes (Colquitt et al., 2001). Thus, negative leader behavior is
likely to result in a wide range of negative outcomes for followers, including engagement
in negative behavior by followers themselves (Ambrose, Seabright, & Schminke, 2002;
Mitchell & Ambrose, 2007). Such research on the implications of leader-follower
relationships, along with research on the validity of leader behaviors and styles shows
that leadership has significant implications for follower outcomes.
Leadership is also an important predictor of group and organizational outcomes.
Regarding the former, previous research has found significant relationships between
leadership variables, such as style and behaviors, and group outcomes, performance-
related and otherwise (e.g., Judge & Piccolo, 2004; Judge, Piccolo, & Ilies, 2004; Keller,
2006; Schaubroeck, Lam, & Cha, 2007). Regarding organizational outcomes, research
on top executives shows that leaders can have a substantial impact on organizational
performance. In studies of executive succession, comparing organizational performance
before and after successions among top-level leaders, Lieberson and O’Connor (1972)
found an effect size of 0.15 between leadership succession and organizational financial
measures, and Salancik and Pfeffer (1977) found an effect size of 0.16 between
succession and municipal government financial outcomes. Thomas (1988) found the
7

length of time that top executives were in office to explain 61.4% of variance in
organizational profit, 66% of variance in sales, and 51.2% of variance in profit margin
not explained by year, industry, or company in a sample of retail organizations from the
United Kingdom. After reviewing studies on executive leadership and organizational
performance, Day and Lord (1988) stated that executive leadership consistently explains
20-45% of variance in organizational outcomes. A later study by Barrick, Day, Lord, and
Alexander (1991) that applied a utility analysis to executive leadership found that, over
their tenure, effective top executives can provide approximately $25 million more to their
organizations than less effective executives. In summary, as Hogan and Kaiser (2005)
argued, leadership is a key determinant of organizational effectiveness.
Given the impact that leaders can have on their followers, groups, and
organizations, it is not surprising that Hogan and Kaiser (2005) also argued that bad
leaders, by perpetrating “terrible misery” on others, are likely to cause substantial
negative outcomes. Because people attend to, store, and recall negative events from
social interactions more so than positive events (Baumeister, Bratlavsky, Finkenauer, &
Vohs, 2001), negative leader behavior should more strongly affect the same outcomes
than positive leader behavior. In support of this claim, the previously mentioned meta-
analysis by Podsakoff et al. (2006) on leader contingent and non-contingent reward and
punishment behavior found the strongest effect sizes to be associated with the most
negative behavior, non-contingent punishment behavior. Not surprisingly, Hogan (2006)
wrote that bad leadership has a negative impact at multiple levels, including follower and
organizational levels, by making follower turnover, withdrawal, sabotage, and retaliation
8

more prevalent issues. In summary, the serious outcomes of negative leader behavior
alone make the topic worth understanding.
Existing Research Relevant to Negative Leadership
Although researchers have relatively recently begun to acknowledge the
importance of studying negative leader behavior, there are three main deficiencies with
the state of research on the topic. First, research has sometimes conceptualized bad
leadership as merely a lack of positive leadership. Second, there is a focus on constructs
that represent relatively limited sets of behaviors (e.g., abusive supervision) rather than
working toward an understanding of negative leadership in general. Finally, existing
research features a lack of systematic investigations into constructs related to negative
leadership, as shown through an absence of attempts to identify the factor structures of
those constructs or to validate measures of the constructs.
Research on Positive Leader Behavior
Until recently, leadership research has overwhelmingly focused on positive leader
behavior and has tended to conceptualize negative leader behavior as simply a lack of
positive behavior (Ashforth, 1994; Kelloway et al., 2006; Padilla et al., 2007). According
to Einarsen, Aasland, and Skogstad (2007) however, leadership that is positive for both
the organization and followers is only one possibility, as leadership may be positive or
negative for followers, the organization, or both. Furthermore, studies on constructs
related to negative leader behavior show leaders to sometimes actively engage in
behaviors like bullying, sabotage, and corruption, rather than simply failing to engage in
positive behaviors. Just as counterproductive and organizational citizenship behaviors
9

represent different sets of behaviors rather than opposite ends on the same continuum
(Dalal, 2005), so do negative and positive leader behaviors.
Importantly, although Kellerman (2004) argued that leadership inherently
involves positive behaviors and outcomes, Padilla, Hogan, and Kaiser (2007) argued that
positivity and negativity should not be criteria for defining leadership. According to
Padilla et al., most people in leadership positions engage in both positive and negative
behavior in order to accomplish their goals. Also, consistent with LMX theory, the same
person may engage in negative behavior toward one follower and positive behavior at
another and still be considered a leader. Thus, leaders can and do engage in both positive
and negative behavior.
Constructs Related to Negative Leader Behavior
Existing research has studied constructs related to negative leader behavior under
a variety of labels, each of which represents specific types of behaviors. The state of
research on negative leadership is similar to the state of research on general negative
workplace behavior before studies began assessing the construct at a general level.
According to Gruys and Sackett (2003), prior to the 1980’s, research focused on specific
counterproductive behaviors (e.g., theft), but there was not an accepted general
framework of counterproductive behaviors. Studying counterproductive behaviors in a
more general manner provided a greater understanding of the underlying structure of
CWB, including its dimensions and the specific behaviors comprising those dimensions
(Gruys & Sackett, 2003). Studies such as Robinson and Bennett (1995) and Bennett and
Robinson (2000), which determined the dimensions and factors of general workplace
deviant behaviors and the behaviors included in those dimensions and factors, provided a
10

better understanding of the nature of general worker deviance and counterproductive
behaviors than could be provided by lines of research on specific types of behaviors.
Both Neuman and Baron (2005) and Sackett (2002) argued that current research
has still not given adequate attention to examining negative workplace behavior at the
most general level and has continued to focus on either individual behaviors or constructs
that represent limited ranges of behavior, such as withdrawal. Sackett (2002) and Sackett
and DeVore (2002) argued that negative behavior can be organized according to a
hierarchy with specific behaviors at the bottom, constructs representing bundles of those
behaviors at the next level, and larger constructs at higher levels. Sackett went on to
write that studying constructs at higher levels is important for research and practical
reasons. For research, examinations at higher levels allows for a greater understanding of
relationships among more specific constructs and their potentially distinct antecedents
and outcomes. For practice, Sackett wrote that organizations are more likely to be
concerned with not selecting people who are likely to engage in intentionally negative
behaviors in general, rather than specific forms of those behaviors. For these reasons,
Sackett suggested that future research work toward developing an understanding of
intentional, negative behaviors at higher hierarchical levels.
Neuman and Baron (2005) similarly argued that focusing on more specific
constructs at the sake of broader concepts impedes the advancement of theory and
practice involving negative workplace behavior for reasons similar to those of Gruys and
Sackett (2003). As will be shown, the same criticisms can be made of the current state of
research on constructs related to leader deviance. The present study will address issues
with research on negative leader behavior by determining the full-range of negative
11

leader behavior, the factors underlying those behaviors, and the correlates of those
factors. In so doing, the study will also develop a measure of the general construct of
negative leader behavior
Laissez-Faire Leadership and Management-by-Exception
Laissez-faire leadership was introduced by Lewin, Lippitt, and White (1939). The
style of leadership, defined as an inactive or absent form of leadership, was included in
Bass’s (1985) model of leadership along with charismatic leadership and in Bass and
Avolio’s (1990) full-range leadership model along with dimensions of transformational
and transactional leadership. Research has consistently found negative relationships
between laissez-faire leadership and outcomes such as follower job satisfaction,
motivation, and performance (e.g., Judge & Piccolo, 2004). Skogstad, Einarsen,
Torsheim, Aasland, and Hetland (2007) found laissez-faire leadership increased conflict
between coworkers, role conflict and ambiguity, psychological distress, and exposure to
bullying. Based on results of the study, Skogstad et al. argued that laissez-faire
leadership may be more of a counterproductive leadership style than a form of zero
leadership, in that followers of leaders who provide no leadership are subject to high
levels of stress and interpersonal conflict.
Management-by-exception (MBE) was also included in Bass’s (1985) model of
leadership and characterizes leaders who interact with followers only in response to
failures or problems. MBE can be classified as active or passive (Hater & Bass, 1988).
With both forms of MBE, failures and problems are the focus of leadership. MBE-active
leaders scan the environment and their followers’ work to detect any deviations from
expectations in order to prevent those deviations from resulting in more serious problems
12

(Howell & Avolio, 1993). MBE-passive is characterized by leaders who wait until
assignments are completed by followers, scan those completed assignments and tasks for
errors, and then respond with criticism or reproof to any errors that are detected.
Podsakoff, Todor, Grover, and Huber (1984) suggested that MBE-active may be
associated with positive or negative outcomes depending on the extent to which a
leader’s pre-emptive criticism is seen as fair, clarifies performance standards, or modifies
poor performance in such a way as to avoid aversive outcomes. MBE-passive, however,
they argued is likely to result in poor follower effort and performance. Consistent with
Podsakoff et al.’s argument, across follower, group, organizational, and leader outcomes,
Judge and Piccolo’s (2004) meta-analysis found a positive effect size associated with
MBE-active and a negative effect size associated with MBE-passive.
Despite the negative outcomes of laissez-faire leadership and MBE-passive and
Skogstad et al.’s (2007) argument for the counterproductivity of laissez-faire leadership,
the motivation underlying use of these styles is not consistent with the intentionality of
the negative leader behavior of interest to the present study. Although laissez-faire
leadership and MBE-passive are likely to cause harm, the extent to which leaders intend
to engage in the behaviors characteristic of the styles is not clear. Thus, laissez-faire
leadership and MBE-passive will not be included in the conceptualization of negative
leader behavior.
Dark and Personalized Leadership
Conger (1990) discussed three areas in which charismatic leaders may engage in
“dark” activities in order to reach their goals. According to Conger, problems can arise
in charismatic leaders’ implementation of a strategic vision if the vision is not realistic
13

given available resources or does not match the values and needs of constituents.
Regarding the second area of communication and impression-management skills,
charismatic leaders may resort to manipulating information communicated to followers
and may over-exaggerate the importance and details of their vision. Finally, in managing
followers, charismatic leaders may alienate followers, create rivalries, alternate between
idealizing and demeaning others, and remove themselves from daily operations in order
to achieve their goals. Conger’s paper is important because it was one of the first to
discuss ways in which leaders, especially those considered charismatic, may engage in
“dark” behaviors in pursuit of their goals.
Luthans, Peterson, and Ibrayeva (1998) applied “dark” leadership to the national
level in discussing reasons for the rise of “dark” leadership in post-communist countries.
According to the authors, at the national level, “dark” leaders demand unconditional
loyalty and commitment from followers, desire heroic recognition without blame, and
have a high need for visibility. Luthans et al. argued that people tend to become blinded
to the negative actions of “dark” leaders as they emphasize their positive characteristics
and minimize their negative ones. More recently, Hogan and Hogan (2001) organized
eleven personality variables into three dimensions, including moving away from people
(e.g., excitable, cautious, reserved, skeptical, and leisurely), moving against people (e.g.,
mischievous, bold, colorful, and imaginative), and moving toward people (e.g., diligent
and dutiful), that predict “dark” leadership and manager derailment, defined as the failure
to reach potential. This line of research on “dark” behaviors is important because it
established the importance of examining how and why some leaders engage in behaviors
that engender negative outcomes for other individuals and their organizations.
14

Similar to the self-serving nature of “dark” leaders, researchers have also made a
distinction between socialized and personalized leaders. House and Howell (1992)
described socialized leaders as those who empower subordinates and are motivated to
maximize the achievement of organizational goals without regard for personal needs.
Personalized leaders, on the other hand, use manipulation, threats, and punishment and
are aggressive, exploitative, and self-aggrandizing (Bass & Rigio, 2006; House &
Howell, 1992; Popper, 2002). In a biographical study of historical leaders, O’Connor,
Mumford, Clifton, Gessner, and Connelly (1995) found personalized leadership to be
associated with high need for power and narcissism and the existence of negative life
themes. By discussing leaders who intentionally cause harm to followers, research on
personalized and socialized leadership comes closer to assessing deviant behaviors on the
part of leaders.
Petty Tyranny, Abusive Supervision, and Supervisor Undermining
The relatively recently introduced constructs of petty tyranny, abusive
supervision, and supervisor undermining are directly related to the negative leader
behavior to be investigated by the present study. The three constructs have several
features in common. Foremost is that they represent a specific subset of negative leader
behaviors, those directed at subordinates and that are low in severity. Consequently, the
constructs provide a limited understanding of the nature of negative leader behavior at a
broad-level. These are limitations that the present study will address.
Petty tyranny. Petty tyranny represents the tendency of leaders to over-control
followers and treat them in an uncaring, punitive, and arbitrary manner (Ashforth, 1994).
Ashforth (1994) characterized tyrannical leaders by close supervision, distrust, cold and
15

impersonal actions, severe and public criticism, condescension, coercion, boasting,
emphasizing authority and status, rigidity and inflexibility, taking others’ credit, failing to
consult with others, and obstructing others’ development. Based on previous research
and analysis of critical incidents provided by a student sample, Ashforth (1987)
developed a measure of petty tyranny that included 47 items organized around six
dimensions. The dimensions included arbitrariness and self-aggrandizement, belittling
subordinates, lack of consideration, a forcing style of conflict resolution, discouraging
initiative, and non-contingent punishment.
There are two main limitations associated with Ashforth’s (1987) measure. First,
petty tyranny has been included in only two empirical studies. In addition to the Ashforth
(1987) study, Ashforth (1997) found neither supervisor dispositional variables, including
self-esteem and tolerance for ambiguity, nor contextual variables, including
institutionalized norms, power, and stressors to predict petty tyranny. The low frequency
of use of the petty tyranny measure may be due to the availability of the measure and
information about its reliability and validity. The measure was presented in a conference
paper, and the full measure has not been published for public use. Along with this, the
measure has not undergone validation testing and information about the reliability and
item characteristics of the measure are not easily accessible to the public.
The second limitation of the measure also concerns its development. Although
the petty tyranny measure includes a wider range of behaviors than measures of abusive
supervision and supervisor undermining, the list of behaviors were obtained from a
student sample alone, in addition to existing research on leader behaviors. Whether the
measure represents a full-range of negative leader behaviors is questionable, as people
16

with more working experience are likely to have observed different examples of negative
leader behavior than people with less working experience. Also, because the measure
was not subjected to a formal validation study, how the measure and its dimensions share
convergent and discriminant validity with other measures and the extent to which they
predict individual and organizational-level outcomes are unknown. As will be shown,
these limitations are also characteristic of measures of abusive supervision and supervisor
undermining.
Abusive supervision. Of the concepts related to negative leader behavior, abusive
supervision has received the most attention. According to Tepper (2000), abusive
supervision represents workers’ perceptions that their supervisors engage in sustained and
hostile verbal and non-verbal behavior, excluding behaviors that involve physical contact.
Tepper (2000) reviewed research on abusive personal relationships and managerial abuse
to develop a measure of abusive supervision. The measure includes items that reflect
behaviors such as ridiculing, demeaning subordinates in front of others, being invasive,
not crediting subordinates for their effort, being rude, and lying.
As with Ashforth’s (1987) measure of petty tyranny, there are limitations
associated with the measure of abusive supervision. Mainly, the measure represents a
limited bundle of negative leader behavior; it does not include behaviors such as
threatening with job loss and withholding information, which Keashley (1998) argued
should be included in abusive supervision, nor does it include behaviors related to
coercion, though Bies (2000) suggested that it should.
Other studies on abusive supervision have supplemented the Tepper (2000)
measure by combining it with items from other measures. Zellars, Tepper, and Duffy
17

(2002) combined eight items from Tepper’s measure with six items from Duffy, Ganster,
and Pagon’s (2002) measure of supervisor undermining in order to broaden the range of
behaviors included in the measure and make it more appropriate for a military sample.
Tepper, Duffy, Henle, and Lambert (2006) used the same supplemented measure as
Duffy et al. That researchers have added items from other measures to the measure of
abusive supervision suggests that the latter does not capture the full range of negative
leader behavior.
Despite the limited focus of abusive supervision, as reflected by Tepper’s (2000)
measure, research on abusive supervision confirms the importance of negative leader
behavior as a predictor of subordinate and group outcomes. Tepper (2000) found abusive
supervision to positively predict turnover, work-family conflict, and depression and to
negatively predict job and life satisfaction and organizational commitment, with the
relationships mediated by perceptions of distributive, procedural, and interactional
justice. Tepper, Duffy, and Shaw (2001) found perceptions of abusive supervision to
interact with subordinate conscientiousness to predict subordinates’ constructive and
dysfunctional resistance to their supervisors. Similarly to Tepper’s (2000) results,
Zellars, Tepper, and Duffy (2002) found procedural justice to mediate the relationship
between abusive supervision and subordinate organizational citizenship behavior (OCB).
Using structural equation modeling, Aryee, Chen, Sun, and Debrah (2007) found abusive
supervision to negatively predict subordinates’ perceptions of interactional justice, which
were positively related to subordinate OCB and organizational commitment. Abusive
supervision has also been negatively linked to subordinate job performance (Hoobler &
Brass, 2006; Harris, Kacmar, & Zivnuska, 2007). Harris, Kacmar, and Zivnuska (2007)
18

found abusive supervision to interact with subordinates’ perceptions of their work as
meaningful to predict job performance. Abusive supervision has also been found to
interact with subordinates’ trait positive affect and use of ingratiation to predict job
tension, emotional exhaustion, and turnover intentions (Harvey, Stoner, Hachwater, &
Kacmar, 2007). Finally, abusive supervision has been linked to individual-level follower
deviance as well as group-level counterproductivity (Detert, Treviño, Burris, &
Andiappan, 2007; Mitchell & Ambrose, 2007).
Research has also begun to examine abusive supervision as an outcome, mainly of
perceptions of justice. Tepper et al. (2006) found subordinate trait affect and supervisors’
perceptions of procedural justice and depression to predict abusive supervision.
Additionally, supervisors’ perceptions of interactional justice has been found to
negatively predict abusive supervision for supervisors high in authoritarian leadership but
not for those low in authoritarian leadership (Aryee, Chen, Li-Yun, and Debrah, 2007).
Supervisor undermining. Duffy, Ganster, and Pagon (2002) developed a measure
of supervisor undermining by reviewing research on undermining in non-work
relationships and antisocial workplace behavior in addition to asking a sample of
Slovenian police officers to provide examples of supervisor undermining. Social
undermining was defined as “behavior intended to hinder, over time, the ability to
establish and maintain positive interpersonal relationships, work-related success, and a
favorable reputation.” Duffy et al. distinguished undermining from other forms of
deviance, such as abusive supervision, by arguing that the effects of social undermining
are more insidious and are realized with multiple enactments of those behaviors rather
than with one or two enactments. Despite any conceptual distinctions between supervisor
19

undermining and abusive supervision, the items included in Duffy et al.’s measure are
highly similar to those included in Tepper’s (2000) abusive supervision measure. Both
mainly refer to subordinates’ perceptions that their supervisors ridicule, demean, and
personally insult them. Thus, there is substantial overlap between the measures of
supervisor undermining and abusive supervision.
The same limitations associated with research on petty tyranny and abusive
supervision arise in research on supervisor undermining. Mainly, the construct does not
reflect a wide range of negative leader behavior. Furthermore, the measure was
developed and tested in isolation from similar measures (e.g., abusive supervision),
despite its similarity with other measures.
Destructive Leadership
Two papers published in a recent issue of Leadership Quarterly, Einarsen,
Aasland, and Skogstad (2007) and Padilla, Hogan, and Kaiser (2007), introduced
“destructive leadership.” According to Einarsen et al., “destructive leadership” refers to
“the systematic and repeated behavior by a leader, supervisor, or manager that violates
the legitimate interest of the organization by undermining and/or sabotaging the
organization’s goals, tasks, resources, and effectiveness and/or the motivation, well-
being, or job satisfaction of subordinates.” Leadership can be destructive for
subordinates, the organization, or both.
Padilla et al. (2007) went on to discuss other characteristics of “destructive
leadership.” According to the authors, “destructive leadership” can be defined in terms
of its target, which could be toward oneself or toward the organization and its members
and stakeholders. Padilla et al. listed five features of “destructive leadership.”
20

“Destructive leadership,” they argued, is not necessarily entirely destructive, emphasizes
coercion and control instead of commitment and persuasion, has a selfish orientation,
negatively affects the quality of life for organizational constituents, and has outcomes
that depend on the susceptibility of followers and the conduciveness of the environment
to “destructive leaders.” Padilla et al. further discussed characteristics of leaders (e.g.,
their charisma, personalized power, narcissism, negative life themes, and ideology),
followers (e.g., unmet needs, maturity, and values, and the environment, including
stability, cultural values), and organizational checks and balances that increase the
likelihood of “destructive leadership.”
The main distinction between “destructive leadership” and the negative leader
behavior of interest to the present study is in defining what is considered destructive or
negative. Padilla et al. (2007) argued that “destructive leadership” should be defined
according to group outcomes. The present study, on the other hand, does not define
negative leader behavior in terms of its outcomes; instead, a stipulation for the inclusion
of a behavior in the present study is that it is likely to be committed voluntarily and that it
is likely to be perceived as negative in some way for followers or the organization. The
present study contends that, although negative leader behavior is likely to cause negative
outcomes, behaviors such as threatening with job loss or personally insulting a follower
should be considered inherently negative regardless of their effects on individual, group,
or organizational outcomes. Despite any issues related to requiring that a behavior be
likely to be committed intentionally, mainly that people tend to judge the intentionality of
the same behavior differently (Andersson & Pearson, 1999), not including the
requirement of intentionality could make classifying behaviors as negative even more
21

problematic. In a discussion of workplace aggression, Neuman and Baron (2005) argued
that by not including a requirement of intentionality, mistakes that occur without intent to
harm would be considered aggressive, and acts that are intentionally deviant but fail to
cause harm would not be considered aggressive. Thus, intentionality is a difficult but
necessary requirement for negative leader behavior.
Summary of Research on Constructs Related to Negative Leader Behavior
There are several conceptual similarities across the three constructs most closely
related to negative leader behavior, petty tyranny, abusive supervision, and supervisor
undermining. As mentioned earlier, the constructs are intended to reflect specific types
of negative leadership rather than negative leadership at a general level. For example,
supervisor undermining was proposed to be slightly distinct from abusive supervision
(Duffy et al., 2002) but neither reflects the entire range of negative leadership. The
constructs also overlap in that they reference behaviors of a similar severity. Each
includes behaviors that would be considered low in severity (e.g., giving the silent
treatment, not defending a follower, being overly critical, not showing consideration for
followers, and being absent from leadership duties), relative to more violent potential
forms of negative leader behavior, such as physical intimidation or abuse or threatening
with job loss. Thus, the constructs represent bundles of negative leader behaviors that
have a similar severity.
Figure 1 illustrates the state of existing research. The figure presents each of the
constructs reviewed according to the range of behaviors included in each. The range was
determined by examining measure(s) of each construct. Consistent with existing research
(e.g., Kellerman, 2004) and for the sake of organization, the figure distinguishes
22

constructs that represent behaviors committed unintentionally, such as management-by-
exception, laissez-faire leadership, and decision-making errors, from those that represent
behaviors committed intentionally, such as supervisor undermining, abusive supervision,
and petty tyranny. The present study focuses on the right side of the diagram, behaviors
enacted intentionally or that are likely to be perceived as such. As depicted in Figure 1,
“dark” leadership, personalized leadership, and “destructive leadership” all reference
some behaviors that are likely to be committed intentionally and others that are likely to
be committed unintentionally (e.g., mistakes or accidents).
Another distinction across constructs is that they reflect at least slightly unique
ranges of behaviors. “Destructive leadership” features the largest range of behavior
among those reviewed because it includes any behavior resulting in a negative outcome.
However, because “destructive leadership” occurs only if negative outcomes are also
found, it would not include behaviors that are negative in nature but do not always lead to
negative outcomes; therefore, “destructive leadership” does not include all possible
manifestations of negative leader behavior. Among constructs that reflect intentionally
committed behavior, petty tyranny is associated with the greatest range of behaviors, and
abusive supervision and supervisor undermining include a more limited range of
behavior. Although, to a large extent, petty tyranny, abusive supervision, and supervisor
undermining overlap, they do not include identical sets of behaviors.
Figure 1 also shows the degree to which existing constructs, even if considered
together, fail to address the entire range of negative leader behavior. The next section
will review research on forms of negative workplace behavior that are not specific to
leaders in order to provide examples of behaviors that could be included in the present
23

study’s conceptualization of negative leader behavior but are not included in existing
constructs.
Non-Leader-Specific Negative Workplace Behavior
Negative behaviors committed by leaders are likely to be distinct from negative
behaviors committed by non-leaders in terms of both their specific manifestations and
correlates. Leaders have access to rewards, punishments, and other resources that are
likely to be involved in their manifestations of negative behaviors (e.g., threatening to fire
a subordinate) that are unavailable to people not in leadership positions. Negative leader
behavior may also have different predictors and outcomes than non-leader negative
behavior. Leader behaviors are likely to have a greater impact on outcomes for other
individuals and the organization than non-leaders’ behaviors. Thus, similar behaviors
enacted by leaders and non-leaders may have different consequences. Despite these
differences, it is worth reviewing research on forms of negative behavior that are not
leader-specific in order to expand on the list of possible manifestations of negative leader
behavior.
Workplace Aggression
Neuman and Baron (2005) provided a comprehensive review of workplace
aggression, defined as, “any form of behavior directed by one or more persons in a
workplace toward the goal of harming one or more others in that workplace (or the entire
organization) in ways the intended targets are motivated to avoid.” In their review,
Neuman and Baron created categories of workplace aggression (presented in Table 1,
along with behavioral examples of each) by crossing each of Buss’s (1961) proposed
dimensions of aggressive behavior and applying them to a work setting. According to
24
Buss, aggressive behaviors may be verbal or physical, direct (which directly harm a
target) or indirect (which harm a target’s values or something a target cares about), and
active (which entail an actor actively trying to harm a target) or passive (which involve
withholding something in order to harm a target).
Although Neuman and Baron’s (2005) list of aggressive workplace behaviors is
the most comprehensive of such lists, the most commonly used measure of workplace
aggression is Greenberg and Barling’s (1999) measure. The measure was based on
Straus’s (1979) Conflict Tactics Scale, which represents the use of reasoning, verbal
aggression, and violence in families. Greenberg and Barling’s measure includes twelve
psychological aggression-related items (e.g., having argued with, yelled at, gossiped
about, and having been rude with others) and ten violence-related items (e.g., having
thrown something at, swore at, and pushed others), with the distinction that violent
behaviors are physical in nature and psychologically aggressive behaviors are non-
physical. Despite Greenberg and Barling’s recommendation that future research build a
more comprehensive inventory of aggressive and violent workplace behaviors to expand
on their own measure, studies have relied primarily on Greenberg and Barling’s original
measure (e.g., Dupré, Inness, Connelly, Barling, & Hoption, 2006; Inness, Barling, &
Turner, 2005).
Several behaviors included in Neuman and Baron’s (2005) measure are not found
in measures of previously researched constructs related to negative leader behavior.
Aggressive behaviors that are physical in nature are especially under-represented on
measures of those constructs. Behaviors such as glaring at, making hostile gestures,
excluding others from social gatherings, preventing a target from expressing him or
25

herself, arriving late to meetings hosted by a target, failing to protect a target’s welfare,
denying a raise or promotion without a valid reason, and harassment are behaviors that
leaders may engage in but are not included in constructs related to negative leader
behavior. The same is true of behaviors that are more verbal in nature, such as taking
credit for others’ work, not showing sympathy, and failing to warn a target about
impending danger.
Bullying
Workplace bullying is a relatively recently developed construct, having been
initially developed by researchers in Europe in the 1990s (Rayner & Keashly, 2005; Zapf
& Einarsen, 2005). Although the construct of workplace bullying derived from research
on mobbing (Zapf & Einarsen, 2005; Leymann, 1996), the two are distinct in that the
latter involves workers grouping together to bully a target at the same hierarchical level
(Rayner & Keashly, 2005); whereas, the former takes place on a dyadic level. Possibly
because bullying has received less attention than other forms of negative behaviors at
work (Lutgen-Sandvik, Tracy, & Alberts, 2006), there is still a lack of clarity as to what
constitutes workplace bullying (Rayner & Keashly, 2005). Researchers do, however,
agree on core elements of bullying. First, bullying involves the occurrence of multiple,
repetitive, negative acts directed at an individual, rather than a one-time occurrence
(Lutgen-Sandvik, et al., 2006; Einarsen & Hoel, 2001). In most cases, bullies engage in a
variety of negative acts directed at a target (Lutgen-Sandvik, et al., 2006).
A second core element is that bullying is more likely to occur across imbalances
of power than mobbing (Einarsen, Hoel, Zapf, & Cooper, 2003; Lamertz & Aquino,
2004). Neuman and Baron (1997) suggested that approximately half of people labeled as
26

bullies occupy higher positions than their targets. Among European samples, Rayner and
Keashly (2005) have found managers to comprise a greater percentage of bullies than
among American samples.
Ferris, Zinko, Brouer, Buckley, and Harvey (2007) argued that leaders may
engage in bullying directed at followers as an influence tactic, as “strategic bullying.”
The goal of strategic bullying is to enhance the submissiveness of targets, thereby
reinforcing the leader’s power and making followers more susceptible to influence and
control. Furthermore, with strategic bullying, leaders have long-term goals in mind as a
reason for using bullying as an influence strategy, rather than engaging in bullying
reactively, or for short-term ends.
Although such research and arguments suggest that leaders are more likely to
engage in bullying than peers or subordinates, similar to the definition of workplace
bullying, the specific behaviors that constitute the construct are unclear (Rayner &
Keashly, 2005). Bullying is most commonly measured by the Negative Acts
Questionnaire (Einarsen & Hoel, 2001), or a modified version of that measure (e.g.,
Agervold, 2007; Fox & Stallworth, 2005). The NAQ asks people to rate how many times
in a given time span (typically six months) they have been subject to behaviors such as
having had important information withhold from them, exposure to an unmanageable
workload, excessive monitoring of one’s work, and humiliation or ridicule.
A characteristic of the NAQ that differs from behaviors included in constructs
related to negative leader behavior is that several NAQ items refer to using workload and
assignments as a means of harming others. The NAQ suggests that leaders may
intentionally provide followers with an excessively demanding and/or unreasonable
27

workload that includes impossible-to-achieve task deadlines. Leaders may also assign
demeaning tasks to followers or ones that are generally unpleasant as a form of
punishment. Such behavior should be considered as potential manifestations of negative
leader behavior.
Counterproductive Work Behavior (CWB) and Deviance
The constructs of CWB and workplace deviance have been the subject of research
since Hollinger and Clark (1983) collected a list of counterproductive behaviors from
9175 employees across 47 organizations and three industries (Gruys & Sackett, 2003).
Hollinger and Clark proposed that the behaviors could be categorized as “property
deviance,” involving misuse of employer assets, or “production deviance,” involving
violation of norms about how work should be accomplished. Production deviance
included behaviors related to not being present on the job as scheduled, such as absence,
tardiness, and taking long breaks, and behaviors that detract from on-the-job production,
such as intentionally slow and sloppy work and alcohol and drug use.
CWB. The constructs of CWB and deviance have diverged slightly following
Hollinger and Clark’s (1983) study. According to Spector and Fox (2005), deviance
refers to behaviors that violate organizational norms and cause harm to the organization
or its employees; whereas, CWB refers to behaviors that may cause harm but do not
necessarily violate norms. Spector and Fox defined CWB as volitional acts that harm or
are intended to harm an organization or its members. Sackett (2002) defined CWB as
intentional behaviors undertaken by an organizational member that are considered to be
contrary to its legitimate interests. Although these definitions diverge slightly, each
references behaviors committed intentionally and that are likely to cause harm or be
28

considered negative in some way. Similarly to the present study’s negative leader
behavior, CWB is defined in terms of the inherent characteristics of a behavior rather
than its outcomes (Gruys & Sackett, 2003).
CWB includes several dimensions. Gruys (1999) identified eleven CWB
categories. The categories include theft and related behaviors, destruction of property,
misuse of information (e.g., falsifying records and revealing confidential information),
misuse of time and resources (e.g., wasting time at work), unsafe behavior (e.g., failure to
follower safety procedures), poor attendance, intentionally poor-quality work, alcohol
use, drug use, inappropriate verbal actions (e.g., harassment and arguing with customers),
and inappropriate physical actions (e.g., physically attacking others and making a sexual
advance toward a coworker). A confirmatory factor analysis by Gruys and Sackett
(2003), using a sample of college alumni, confirmed the existence of Gruy’s eleven
factors. Gruys and Sackett also performed a multidimensional scaling analysis, using the
same sample, and found two dimensions, one reflecting a distinction between individual
and organization-targeted deviance and another reflecting the task relevance of a
behavior. Martinko, Gundlach, and Douglas (2002) categorized CWB as self-destructive,
including behaviors such as drug and alcohol abuse, absenteeism, and passivity, or
retaliatory, including instances of aggression, violence, sabotage, theft, and harassment.
Finally, Spector, Fox, Penney, Bruursema, Goh, and Kessler (2006) proposed five
dimensions of CWB, including abuse against others, production deviance, sabotage, theft,
and withdrawal and found that each dimension had different patterns of relationships with
antecedents.
29

A commonly used measure of CWB is Fox, Spector, and Miles’s (2002) CWB-
Checklist. The measure has five sub-scales, corresponding to Spector et al.’s (2006)
dimensions of CWB. Examples of the sabotage sub-scale include purposely damaging
equipment and purposely wasting materials and supplies; the abuse sub-scale includes
making fun of someone’s personal life, spreading rumors, blaming someone else for
one’s own error, threatening with violence, looking at someone’s private mail or property
without permission, and insulting; purposely failing to follow instructions and purposely
doing work incorrectly are examples of production deviance; withdrawal includes coming
to work late and leaving early without permission; taking supplies without permission is
an example of theft. Within the abuse sub-scale, expressions of invasiveness (e.g.,
looking through someone else’s private materials) seem particularly relevant to a
conceptualization of negative leader behavior, as individuals in leadership positions have
the authority and resources to excessively monitor followers’ work.
Deviance. Workplace deviance has been defined as, “voluntary behavior that
violates significant organizational norms and, in so doing, threatens the well-being of the
organization or its members, or both” (Robinson & Bennett, 1995). The most well cited
studies of deviance are by Bennett and Robinson. Robinson and Bennett (1995) noted
that, similarly to the current state of research on constructs related to negative leader
behavior, there was a lack of comprehensive and systematic research on workplace
deviance as an overarching concept that could lead to a greater understanding of deviance
and the development of related theories. To remedy this problem, Robinson and Bennett
generated a list of deviant workplace behaviors and, using a multidimensional scaling
analysis, found two dimensions to underlie those behaviors based on the severity and
30

target of a behavior. By crossing the two dimensions, the researchers created four
categories of deviance, including production deviance (of minor severity and an
organization-focus), political deviance (of minor severity and targeted at individuals),
property deviance (serious behaviors aimed at an organization), and personal aggression
(serious behaviors targeted at individuals). Several of the categories included behaviors
undertaken by leaders that are not included in constructs related to negative leader
behavior, such as a leader leaving his or her own work for follower to do (production
deviance), asking employees to work beyond their job descriptions, blaming employees
for one’s own mistakes, and showing favoritism (political deviance), refusing to give
employees their earned benefits and pay, unjustifiably firing employees, and inflexibly
following rules (personal aggression).
In a later study, Bennett and Robinson (2000) developed a measure of workplace
deviance. Through three studies, including item generation, factor analysis and reliability
analysis, and validation, eighteen items loading on two factors were generated. Examples
of behaviors loading on an interpersonal deviance factor include saying something hurtful
and publicly embarrassing to someone. The organizational deviance factor includes theft,
putting little effort into work, and arriving to work late and leaving early without
permission, among others. More recent studies have supported the distinction between
deviance and CWB directed at individuals and organizations (Berry, Ones, & Sackett,
2007; Dalal, 2005; O’Brien & Allen, 2008; Sackett, Berry, Wiemann, & Laczo, 2006).
Besides the specific behaviors mentioned in Robinson and Bennett’s (1995) study,
research on workplace deviance suggests that there may be a distinction between negative
leader behavior directed at followers and those directed at the organization.
31

Incivility
Andersson and Pearson (1999) defined workplace incivility as, “low intensity
deviant behavior with ambiguous intent to harm the target, in violation of workplace
norms for mutual respect.” Incivility differs from other forms of antisocial behavior at
work in that the latter tend to include relatively more severe behaviors or a mix of low
and high severity behaviors whereas the former focuses on less severe behaviors.
Examples of uncivil behaviors are eavesdropping on a telephone conversation, littering at
work, neglecting to say thank you, sending rude emails, being excluded from a meeting
or social event, and having loud and boorish telephone conversations at work (Andersson
& Pearson, 1999; Pearson, Andersson, & Porath, 2000; Pearson, Andersson, & Porath,
2005; Pearson, Andersson, & Wegner, 2001). Another characteristic of incivility is that
any intent to harm a target is ambiguous. Uncivil behaviors may be intentional or
unintentional (Pearson et al., 2000), but they have rudeness, discourteousness, and a lack
of regard for others in common (Andersson & Pearson, 1999; Pearson et al., 2005).
Cortina, Magley, Williams, and Langhout (2001) developed a measure of
incivility for use in a department of the federal court system. Based on interviewing a
sample of representatives from the department, seven items were generated that ask
subjects to report whether they have been subject to each form of incivility in the past
five years. Requirements for the items were that they represent instances of disrespect,
rudeness, or condescension and that an intention to harm an individual or organizational
target was not readily apparent. Example of items include having been put down or
condescended to, having been ignored, having had one’s judgment doubted on a matter in
which one had responsibility, and having been addressed in unprofessional terms.
32

Although the measure was intended only for use in the judicial department sample,
Cortina et al.’s measure provides an example of specific types of uncivil workplace
behaviors.
According to Pearson, Andersson, and Porath (2000), hierarchical status plays a
role in the enactment of uncivil behaviors. They estimated that instigators of incivility
are three times more likely to be of a higher status than targets. Leader-relevant uncivil
behaviors include publicly admonishing a subordinate, delaying response to a request
(seemingly intentionally), and avoiding answering subordinates’ questions. Pearson,
Andersson, and Porath (2005) wrote that uncivil behaviors are similar in severity to less
severe behaviors included in conceptualizations of petty tyranny and abusive supervision
and that incivility, petty tyranny, and abusive supervision have in common a lack of
consideration for others. For the present study, the most important contribution of
workplace incivility may be to reinforce the relevance of including behaviors that reflect
a range of severities in an inventory of negative leader behavior.
Workplace Violence
Whereas research on incivility suggests that low severity behaviors should be
included in a conceptualization of negative leader behavior, research on workplace
violence suggests that more severe behaviors should also be included. Workplace
violence refers to “an illicit behavior or action which reduces the actual or perceived
security of employees, patrons, and the organization itself” (Howard, 2001). Neuman
and Baron (1998) described workplace violence as, “efforts by individuals to harm others
with whom they work, or have worked, or the organizations in which they are presently,
or were previously, employed.” Violence is distinguishable from workplace aggression
33

in that the former represents only physical behavior (Neuman & Baron, 1998).
According to Neuman and Baron (2005), workplace violence would be classified as
physical, active, and direct under Buss’s (1961) typology, and most instances are nonfatal
(Scalora, Washington, Casady, & Newell, 2003). The violence sub-scale of Greenberg
and Barling’s (1999) measure of aggression includes behaviors such as throwing
something at, threatening to hit, swearing at, pushing, shoving, and hitting another.
Although these behaviors may be associated with a low base-rate (Baron & Neuman,
1996; Neuman & Baron, 1998), they are behaviors that should be considered as forms of
negative leader behavior.
White Collar Crime
Research on white collar crime suggests that not all negative leader behavior is
likely to be directed at particular followers. Traditionally, white collar crime has been
conceived of as particular to high status positions within organizations. Sutherland
(1949) defined white collar crime as crime committed by people of respectability and
high social status in the course of their occupations. Status is involved in white collar
crime to the extent that people of higher status have greater access to power, influence,
and trust from others, allowing them to commit crimes for financial gain at work (Blickle,
Schlegel, Fassbender, & Klein, 2006; Collins & Schmidt, 1993). In support of the role of
status in white collar crime, research shows that although people of low organizational
status do commit such crimes (e.g., falsification of records and documents, insider
trading, and misuse of assets), there is generally a strong relationship between status and
commission of white collar crimes (Holtfreter, 2005; Szockyj & Geis, 2002). Although
white collar crimes are likely to be motivated by a desire for personal gain rather than to
34

harm an organization, they are behaviors that are enacted intentionally, most likely by
people in leadership positions. No construct related to negative leader behavior includes
behaviors not directed at followers, and according to white collar crime research, this
may be a deficiency in those constructs.
Summary of Research on Non-Leader-Specific Negative Workplace Behavior
The review of non-leader-specific constructs serves to highlight limitations
associated with existing leader-specific constructs. Within each non-leader-specific
construct, there are specific behaviors and sometimes groups of behaviors in which
leaders are likely to engage that are not captured in existing leader-specific constructs.
Also, in contrast to non-leader-specific constructs, research on constructs related to
negative leader behavior has not identified the organizing categories of those behaviors.
Also, because research on non-leader specific constructs has more systematically
investigated antecedents of negative behavior, it speaks to factors that may predict
negative leader behavior, which future research should examine more closely. According
to Bennett and Robinson (2003), there are three trends in research on the antecedents of
negative work behaviors, including using reactions to work experiences as a predictor of
negative behavior (e.g., using job satisfaction as a predictor), using personality as a
predictor, and assessing negative behavior as a means of adapting to the social context of
work (e.g., using perceptions of justice as a predictor). Regarding the first line of
research, studies have found negative relationships between variables such as overall job
satisfaction and satisfaction with pay and negative behaviors (Hershcovis, Turner,
Barling, Arnold, Dupré, Inness, LeBlanc, & Sivanathan, 2007; Judge, Scott, & Ilies,
2006; Lee & Allen, 2002; Mount, Ilies, & Johnson, 2006).
35

Research on personality and individual differences shows emotional stability,
agreeableness, conscientiousness, integrity, trait negative affect, trait anger and anxiety,
and cognitive ability to be especially relevant predictors of negative behavior (Berry,
Ones, & Sackett, 2007; Colbert, Mount, Harter, Witt, & Barrick, 2004; Dalal, 2005;
Dilchert, Ones, Davis, & Rostow, 2007; Fox, Spector, & Miles, 2001; Hershcovis, et al.,
2007; Lee & Allen, 2002; Mount, et al., 2006; Ones & Viswesvaran, 2001; Penney &
Spector, 2002; Salgado, 2002). Recently, O’Brien and Allen (2008) found trait anger to
be the strongest predictor of counterproductive behaviors targeted at individuals, among
other individual difference and perception variables, and conscientiousness to be the
strongest predictor of behaviors directed at the organization.
The third trend in research has primarily used social exchange theory to argue that
individuals with low justice perceptions, who perceive a norm of reciprocity to have been
violated, are likely to reciprocate the perceived violation by engaging in negative
behaviors themselves (Colbert et al., 2004; Flaherty & Moss, 2007). Consistent with this
hypothesis, studies have generally found employees’ perceptions of justice to negatively
predict their commission of negative behavior (Ambrose, Seabright, & Schminke, 2002;
Cohen-Charash & Mueller, 2007; Colbert, et al., 2004; Flaherty & Moss, 2007).
Research on constructs related to negative leader behavior has begun to
investigate justice perceptions as a predictor of those behaviors. As previously
mentioned, Tepper et al. (2006) found supervisors’ perceptions of procedural justice to
predict subordinates’ ratings of those supervisors as abusive. Similarly, Aryee, et al.
(2007) found interactional justice to negatively predict abusive supervision for
36

supervisors high in authoritarian leadership but found no relationship for supervisors low
in authoritarian leadership.
Finally regarding the antecedents of negative work behaviors, research suggests
the behaviors can best be predicted by assessing interactions between individual
difference and perceptions-of-the-work-environment variables (Colbert, et al., 2004;
Diefendorff & Mehta, 2007; Folger & Skarlicki, 1998; Fox, et al., 2001). For example,
Colbert, Mount, Harter, Witt, and Barrick (2004) found a negative relationship between
perceptions of organizational support and interpersonal deviance for people low in
agreeableness but a positive relationship for people high in agreeableness.
Besides job satisfaction, justice perceptions, and individual difference variables,
previous research also suggests variables that may be especially relevant for predicting
negative behavior committed by leaders. Giacalone and Knouse (1990) found
Machiavellianism to predict workplace deviance, and Penney and Spector (2002) found a
positive relationship between narcissism and CWB. Machiavellianism and narcissism are
especially relevant for predicting leaders’ behaviors because individuals high in those
traits are likely to be motivated to pursue leadership positions (O’Connor, Mumford,
Clifton, Gessner, & Connelly 1995). Thus, there may be a greater proportion of
individuals high in Machiavellianism and narcissism found in leadership positions than
non-leadership positions, and, as a result of being in a position of power, those
individuals may have fewer restraints on their behavior than those not in leadership
positions. Although it is not the direct focus of the present study, future research should
examine the extent to which the variables suggested by research on non-leader specific
negative behavior, in addition to the factors described earlier, including organizational
37

norms and learned management strategies, predict the occurrence of negative leader
behavior.
Potential Organizing Dimensions
In addition to highlighting the types of behaviors in which leaders may engage but
are not included in previously researched constructs related to negative leader behavior,
previous research also suggests the dimensions or factors onto which those behaviors
may be organized. Two recent papers applied Buss’s (1961) dimensions of workplace
aggression to leader behaviors. Einarsen et al. (2007) made a distinction between
passive-indirect-physical behaviors directed at subordinates (e.g., failing to protect a
subordinate’s welfare in a risky environment) and passive-indirect-verbal behaviors (e.g.,
failing to provide a subordinate with important information or feedback). Kelloway,
Sivanathan, Francis, and Barling (2005) also applied the active-passive dimension in
discussing poor leadership. They argued that the active dimension would include
behaviors like yelling, ridiculing, name-calling, and threatening with job loss or pay cuts;
whereas, the passive dimension would include elements of laissez-faire leadership and
management-by-exception.
Other potential dimensions may include the severity of a behavior and whether it
is targeted at subordinates or the organization (e.g., Bennett & Robinson, 2000; Robinson
& Bennett, 1995). Behaviors may also be classified according to whether they have to be
committed fewer (e.g., hitting) or more times (e.g., taking credit for others’ work) before
resulting in the same outcome (Duffy et al., 2002) and whether behaviors are motivated
primarily by a desire to harm a target or to help the person engaging in the behavior.
38

Regardless of specific dimensional labels, research shows that there should be
meaningful categories of behaviors within the construct of negative leader behavior.
Summary and Study Objectives
The major objectives of the present study are to generate a comprehensive
inventory of negative leader behavior, determine the factors underlying those behaviors,
create a measure of the behaviors, and to evaluate the validity of the measure. In pursuit
of these objectives, the present study will generally comply with the scale development
steps outlined by Timothy Hinkin (Hinkin, 1995; Hinkin, 1998). Hinkin (1995) reviewed
scale development efforts in published research and outlined three stages of the process.
First, a pool of items are generated using a deductive approach (involving a review of
relevant existing research), an inductive approach (involving collecting subjects’
descriptions of some variable or event), or both. The second stage, scale development,
involves formatting the descriptions and examples gathered in the first stage into useable
scale items, with concern for item wording, scale length, and response format. Also
within the second stage of scale development, the scale should be administered to a
relevant and representative sample of participants in order to conduct reliability and
factor analyses of the scale. Providing evidence of the validity of a scale makes up the
third of Hinkin’s stages. In a later paper, Hinkin (1998) described similar scale
development steps. The steps included item generation, questionnaire administration,
initial item reduction, confirmatory factor analysis, testing for construct and criterion
validity, and replication. Aside from replication, which occurs over multiple studies, the
procedure of the present study will be based on Hinkin’s scale development steps.
39

Chapter 2
Study 1: Item Generation
The first study involved the building of a comprehensive list of negative leader
behaviors. It is important to make four notes about the behaviors included in the present
study. First, the term “leader” applies to anyone in a general leadership, supervisory, or
managerial position and is not restricted to any specific organizational level; the
behaviors of interest could be committed by anyone in such a position. Second, the
present study focuses on behaviors committed voluntarily or that are likely to be
perceived as such and that are likely to be perceived as negative, deviant, or inappropriate
in some way for followers and/or the organization. Third, as mentioned earlier, because
of the difficulty of characterizing behaviors as intentionally negative (Andersson &
Pearson, 1999), although the behaviors of interest are negative and committed
voluntarily, they are not restricted to intentionally harmful behaviors. Fourth, not all
behaviors perceived to be negative will have negative outcomes and may sometimes have
positive effects on certain outcomes (Fox, 2005). For example, threatening a follower
with termination may increase the follower’s motivation to perform well in the short-term
but may also make the follower more likely to seek alternative employment or withdraw
from work in some other way. Thus, the behaviors of interest are not restricted to those
with an associated malice or that necessarily negatively affect all outcomes. This
characteristic of the behaviors of interest to the present study is consistent with research
on CWB, which focuses on the behavior itself rather than the results or consequences of
the behavior (Gruys & Sackett, 2003).
40

Behaviors were drawn from three sources, including measures of constructs
related to negative leader behavior (abusive supervision, petty tyranny, supervisor
undermining, and personalized leadership), measures of non-leader-specific forms of
negative work behaviors (e.g., aggression, deviance, CWB, bullying, white collar crime),
and critical incidents collected from the sample described below.
Method
Participants
Participants were recruited from three sources and reflect low, mid, and high
hierarchical organizational positions. Personal contacts of the author were asked to
complete a critical incidents survey and to ask contacts of their own to complete the
survey (n = 26). In addition, undergraduates taking two upper level psychology classes
(n = 113) and alumni of the Penn State Industrial/Organizational Psychology program
were asked to participate (n = 71). Table 2 lists characteristics of the sample. Across the
three sources, the 210 participants represent of a wide range of occupations.
Measures
Participants were asked to provide three examples of incidents in which a current
or past leader, supervisor, or manager engaged in an act that participants consider
deviant, harmful, or wrong. Participants were told that two of the incidents should stand
out in their memory and could have occurred anytime during their career. In order to
capture less severe behaviors as well, for the third incident, participants were asked to
describe an incident that has occurred within the past month.
41

Analysis
After the incidents had been collected, each was rephrased into one or more
concise behaviors. Redundant behaviors were then eliminated, such that only one version
of each behavior remained. Seventy-two behaviors were generated and retained using
this method.
To the list were added behaviors from measures of constructs related to leader and
non-leader-specific forms of negative work behaviors (see Table 2 for a list of the
constructs and measures). Behaviors were also drawn from examples of constructs for
which there are no measures, including “dark” leadership and white collar crime. Based
on Conger’s (1990) article, “dark” leader behaviors relevant to the present study include
manipulating the information that followers receive, deflecting responsibility for negative
outcomes, alienating others, creating rivalries among followers, being overly controlling,
alternating between idealizing and demeaning followers, and creating excessive
dependence among followers. Regarding white collar crime, relevant behaviors include
theft, misuse of company assets, use of personal influence to secure personal gains,
falsifying records and documents, embezzlement, bribery, and forgery (Holtfreter, 2005).
Each behavior collected from measures and examples of non-leader-specific forms of
negative behaviors was rephrased to make a leader the source of the behavior. Twenty
behaviors taken from leader and non-leader-specific measures and constructs were added
to the list of negative leader behaviors.
Results & Discussion
Table 3 lists the ninety-two negative leader behaviors. The inventory includes
several types of behaviors not found in existing measures, such as sexual harassment,
42

ways in which leaders may manipulate subordinates’ task characteristics as a form of
abuse (e.g., assigning demeaning tasks), behaviors of a physical nature (e.g., throwing
things, making obscene gestures, and physically assaulting subordinates), and behaviors
directed at the organization or that are likely to at least have greater consequences for the
organization than for subordinates. Using the present inventory, the subsequent studies,
which determined the dimensionality, factor structure, and outcomes of negative leader
behavior, present a more comprehensive picture than could be provided by existing
constructs.
43

Chapter 3
Study 2: Multidimensional Scaling Analysis
Multidimensional Scaling (MDS) was used to determine the dimensions
underlying the inventory of leader behaviors and to serve as a basis for making
predictions about factor loadings to inform Study 3’s confirmatory factor analysis. MDS
places objects (behaviors in this case) in a geometric space based on dissimilarities
among the objects (Weinberg, 1991). The space has as many dimensions as are found in
the objects. If objects are found to conform best to a two dimensional space, it would be
concluded that two dimensions underlie the objects.
Robinson and Bennett (1995) described an analogy for MDS. They compared
MDS to drawing a map of several cities on various dimensions, based on distances
between the cities. A map with a single dimension would place the cities on a single line.
A map with two dimensions could resemble a road map, and a map with three dimensions
could provide additional information about elevation.
MDS was chosen over exploratory factor analysis (EFA) for three reasons. First,
MDS analysis uses rated similarities among items as input rather than some other aspect
of those items (e.g., frequency of commission), as does EFA (Weinberg, 1991).
Choosing an inappropriate scale, which could have occurred given that there is not a
clearly most appropriate aspect of negative leader behavior to use as a reference for a
rating scale, could have led to misleading results.
Second, MDS analysis places fewer restrictions on data collection procedures
than does EFA. The sample size requirement was an especially relevant distinction.
Depending on characteristics of the underlying factors, EFA could have required 900
44

subjects, given the set of 92 behaviors, to be consistent with guidelines (Nunnally, 1978).
Finally, MDS was more consistent with the objective of the present study, to highlight the
conceptual underpinnings of the full range of negative leader behaviors rather than
evaluate the extent to which they function as a measure (Snell, McDonald, & Koch,
1991).
Method
Participants
Twenty-six graduate students and faculty in Industrial/Organizational Psychology
and Organizational Behavior participated in Study 2’s behavior sorting task. A sample of
subject matter experts was chosen because the ability of individuals from the general
population to both understand the task used in Study 2 and be willing to devote a
sufficient amount of time to its completion was questionable. In addition, researchers
suggest that accurate solutions can be obtained from a sample of 20-30 subject matter
experts, in instances in which a sorting task is used as input for MDS analysis, in contrast
to a sample of hundreds of individuals from the general population (Santos, 2006; Tullis
& Wood, 2004).
Measures
There are several ways to collect data for an MDS study. Ideally, participants rate
the extent to which each item within a set is dissimilar from all other items (Tsogo et al.,
2000); however, large sets of items make this strategy impractical. For example, to rate
dissimilarities between all pairs of ninety-two leader behaviors, participants would have
had to make 8464 ratings. An excellent review by Tsogo, Masson, and Bardot (2000)
discussed MDS data collection strategies that can be used with large sets of items.
45

Potential strategies to reduce the time-demands placed on participants by large sets of
items include asking participants to complete an incomplete set of dissimilarity ratings
(by randomly eliminating one-third of the dissimilarity ratings, for example), asking
participants to sort items into groups of similar items, asking participants to rank-order
items according to dissimilarities, and obtaining pairwise comparisons from participants
(by asking participants to rate whether the dissimilarity between one pair of items is less
or greater than the dissimilarity between another pair).
For the present study, the sorting task was deemed most appropriate, as the other
strategies would still have placed considerable demands on participants. For example,
reducing the 8464 dissimilarity ratings mentioned above by one-third would have left
5586 ratings for participants to make. By using the sorting task, on the other hand, the
demands placed on participants were substantially reduced over the traditional MDS
strategy. Also, according to Tsogo et al., the sorting task, among alternative strategies,
most closely replicates the results of a traditional MDS data collection strategy.
To complete the sorting task, participants were given the set of 92 items and
asked to sort behaviors they judged to be similar into the same group and those they
judged to be dissimilar into different groups using an online spreadsheet-style survey.
Participants were also asked to provide concise explanations of why they sorted
behaviors into a particular group. The rationales for group assignments were later used to
help interpret the dimensions.
Analysis
Analyzing participants’ responses to the sorting task involved the creation of three
matrices (Tsogo et al., 2000). For each participant, a matrix was created with rows
46

representing behaviors 1 through 92 and columns representing groups 1 through 13.
Participants were not allowed to assign behaviors to more than thirteen groups in order to
make their responses more manageable and easily interpretable. Entries ‘1’ and ‘0’ were
used to indicate whether each participant assigned a behavior to a group. Next, a
similarity matrix F was created by summing the individual-participant matrices. The
entries in F represented the frequency fij with which participants assigned behaviors i and
j to the same group. Finally, a dissimilarity matrix Δ was created with entries δij, where
δij = N (the number of participants) – fij. In other words, δij represents the number of
participants who placed behaviors i and j into separate categories. Matrix Δ was then
used as input for an MDS analysis using SPSS’s ALSCAL program.
Results
Determining the Number of Dimensions
To determine the most appropriate number of dimensions underlying a set of
items, researchers recommend comparing goodness-of-fit statistics associated with
solutions of different numbers of dimensions (Shepard, 1972; Snell, McDonald, & Koch,
1991). The goodness-of-fit statistic most commonly used in MDS analysis is Kruskal’s
(1964) stress value, which represents the amount of unexplained variance in a data set
associated with a solution of a given number of dimensions. Lower stress values indicate
better fit.
Figure 2 presents a scree plot of stress values associated with solutions of one
through six dimensions. In addition, Table 4 lists the specific stress values and the
reduction in values as the number of dimensions increases. Both the figure and table
suggested that the stress values begin to level-off at three dimensions. Although the two-
47

dimensional solution may also seem plausible, according to Kruskal (1964), a stress value
of approximately 0.01 indicates fair model fit; whereas, a value of 0.02, which the two-
dimensional solution came closer to, indicates poor fit.
Additionally, the interpretability of a set of dimensions can be used as a criterion
for determining the most appropriate number of dimensions (Kruskal, 1964; Snell et al.,
1991). In general, consistent with exploratory nature of MDS, if competing solutions
have similar stress values and both offer interpretable dimensions, the solution with the
greater number of dimensions should be accepted. In the present study, both the two-
dimensional and three-dimensional solutions were interpretable. Thus, the three-
dimensional solution was accepted.
Interpreting the Dimensions
Table 5 lists the scores of each behavior on each of the three dimensions. What
seemed to distinguish behaviors at one end of Dimension 1 from the other end is the
target. Behaviors at the positive extreme of Dimension 1 are targeted at the organization
or have greater consequences for the organization. Behaviors at the negative extreme of
the dimension are directed at subordinates.
Dimension 2 seemed to distinguish incompetent from malignant behaviors.
Behaviors that scored most positively on Dimension 2 included trying to please everyone,
avoiding addressing issues, putting little effort into work, and flip-flopping on decisions.
The behaviors seemed to reflect a failure to fulfill the role of leader rather than malice.
At the opposite end of Dimension 2 were behaviors that are clearly negative and likely to
harm others, some intentionally so (e.g., physically assaulting subordinates and throwing
objects at subordinates).
48

Behaviors that scored most positively on Dimension 3 reflect violations of social
norms (e.g., bringing inappropriate material to work, engaging in sexual or romantic
relationships with others from work, gossiping, and making jokes at others’ expense). In
contrast, behaviors scoring most negatively on Dimension 3 reference violating rules and
laws, theft, and endangering others’ welfare. These behaviors are violations of rules that
are likely to be clearly prescribed or agreed upon. Thus, Dimension 3 seemed to
represent a violation of social norms versus violation of clear rules dimension.
To confirm the meaning of dimensions, several studies have used a regression
method that comes closer to objectively applying labels to dimensions than relying on
researchers’ subjective interpretations alone (e.g., Robinson & Bennett, 1995). The
method involves regressing dimension scores on subject matter experts’ ratings of the
extent to which a set of dimension labels characterizes a set of behaviors. Because the
number of behaviors in the present study made a label-behavior rating survey impractical,
it was judged that the behavior inventory should first be reduced to a set that could be
used in a future measure of negative leader behavior before applying the most appropriate
label to each dimension.
Creating a Reduced Set of Behaviors
To reduce the number of behaviors, first, eight categories of behaviors were
created by crossing the three dimensions (Table 6). A total category score was calculated
for each behavior by adding the absolute values of each behavior’s scores across all three
dimensions. These category scores along with behaviors’ scores on each dimension and
whether a behavior conceptually fit with other behaviors included in a category served as
criteria for elimination. Behaviors that had low category scores, scored close to zero on a
49

dimension, and/or were not conceptually similar to other behaviors in a category were
removed. This method of removing behaviors was chosen because it resulted in a set of
categories that were clearly distinct. The method also increased the likelihood that each
category’s behaviors would hang together during subsequent studies that tested the factor
structure of the measure of negative leader behavior by reducing correlations between
categories and increasing category reliability. Forty items, five within each category,
were retained (Table 7). The researcher and two professors of Industrial/Organizational
Psychology reviewed and agreed upon the final list of behaviors.
Confirming the Dimension Labels
As the final step, to confirm dimension labels, the regression method of verifying
dimension labels was employed using a sample of six graduate students and faculty in
Industrial/Organizational Psychology. Participants rated the extent to which each of five
dimension labels, derived from the most popular explanations that sorting-task
participants gave for their sortings, described each of the forty behaviors. The label-
behavior ratings were averaged across raters and used as a predictor of the absolute
values of dimension scores. Table 8 shows that only one of the labels significantly and
positively predicted scores on any dimension. Consistent with expectations, the “norm-
violating/rule-violating” label predicted scores on Dimension 3 (β = .40, p < 0.05).
Although the “malignant/incompetent” label also significantly predicted Dimension 3
scores, the negative beta coefficient indicated that as behaviors’ scores on Dimension 3
increase, the label becomes less descriptive and appropriate.
Because the labels failed to significantly and positively predict scores on the other
dimensions, the results of the regression analysis were interpreted in conjunction with a
50

visual inspection of behaviors’ dimension scores in order to apply the most appropriate
label to Dimensions 1 and 2. The regression analysis confirms expectations that the label
“organizationally-directed/subordinate-directed” is most appropriate for Dimension 1 (β
= .25). Regarding Dimension 2, contrary to expectations, the regression analysis showed
the “malignant/incompetent” label to poorly predict dimension scores and the “severe/not
severe” label to be the best predictor (β = .42). However, implying that some behaviors
are severe and others minor may be misleading. Ignoring important issues and requests
and being absent from work may have outcomes just as severe as bribing and physically
intimidating others under certain conditions.
Upon further inspection of Dimension 2 scores, what seemed to distinguish
behaviors at one end of the dimension from those at the other end was the frequency with
which a behavior occurs before it engenders negative outcomes. Throwing objects at
subordinates is likely to have serious consequences immediately; whereas, discounting
subordinates’ input may also have serious consequences, but after repeated occurrences.
Thus, an “insidiously-damaging/ immediately-damaging” label seemed appropriate for
Dimension 2. This label is consistent with the regression analysis, as under most single
situations, immediately-damaging behaviors should have more serious consequences than
insidiously-damaging behaviors. The label is also consistent with Duffy, Ganster, and
Pagon’s (2002) argument that behaviors that produce negative outcomes after repetition
should be distinguished from those that have negative outcomes after sole occurrences.
Despite the inclusion of the term “damaging,” it is noted that the damage is not restricted
to subordinates’ performance and could apply to other variables (e.g., commitment)
instead.
51

Discussion
In addition to enhancing the understanding of negative leader behavior, the results
of Study 2 serve to organize existing research and provide a starting point for Studies 3
and 4’s efforts to develop a measure of negative leader behavior. Table 9 illustrates the
present study’s contribution to research on negative leadership by mapping constructs
related to leader-specific forms of negative behavior onto the eight categories of negative
leader behavior identified in Study 2. Whether a construct maps onto a category was
determined by comparing behaviors included in measures of those constructs to
behaviors included in the categories of negative leader behavior. For example, “Gives
me the silent treatment,” from Tepper’s (2000)’s measure, is similar to the present
study’s “Gives the silent treatment to express displeasure,” from the subordinate-directed,
insidiously-damaging, norm-violating behavior category. Thus, abusive supervision
maps onto that category of negative leader behavior.
The table makes two points. First, aside from one item from Popper’s (2002)
personalized leadership measure, existing constructs do not include behaviors directed at
the organization or that have greater consequences for the organization than for
subordinates. Consequently, existing measures do not address approximately half of all
possible manifestations of negative leadership. Thus, Figure 1 may have underestimated
the space in negative leader behavior not addressed by previous research.
Second, besides illustrating the types of behaviors not addressed by previous
research, the table also shows the types of behaviors upon which research has focused.
Most behaviors from previously researched leader-specific negative behavior constructs
map onto the subordinate-directed, insidiously-damaging, norm-violating negative leader
52

behavior category of negative leader behavior. Consistent with expectations, this finding
emphasizes the point that previous research has focused on behaviors directed at
subordinates and that are relatively less severe, in terms of a single commission. The two
points made by the table underscore the idea that although the constructs of interest in
previous research may be valid indicators of a specific type of negative leader behavior,
they should not be considered representative of all types of negative leader behavior.
53

Chapter 4
Study 3: Confirmatory Factor Analysis
The next step in the process of both empirically defining negative leader behavior
and developing a measure of the construct was to confirm the factor structure of the
reduced set of behaviors generated in Study 2 using a confirmatory factor analysis (CFA).
In addition to being an initial step in evaluating the set of behaviors as a measure of
negative leader behavior, CFA should also provide further insight into negative leader
behavior as a construct. According to Long (1983), CFA is a necessary step in theory
and construct development, as it evaluates relationships among latent factors and their
indicators. The CFA resulted in a measure of negative leader behavior and its factors that
was subsequently evaluated in Study 4.
Method
Participants
Data for the CFA were collected from 410 participants. Participants were
recruited through a variety of means, including advertisements placed on work-oriented
websites (e.g., www.workrant.com) (n = 55), staff across all branches of the Pennsylvania
State University (n = 78), professional organizations (e.g., the Society for Human
Resource Management) (n = 53), employees of a small state government department (n =
12), adult contacts of undergraduates enrolled in upper level psychology courses (n = 97),
and the Study Response Project (n = 115), a participant recruitment service. Table 10
lists characteristics of the sample.
54

Measures
Participants were asked to rate the extent to which a very abusive, unethical,
and/or damaging supervisor, manager, or leader with whom they currently work or
worked with in the past engages or engaged in each of the 40 negative leader behaviors
generated in Study 2. Ratings for each behavior were made on a 5-point scale, with
“Never,” “Seldom,” “Occasionally,” “Often,” and “Very Often” serving as response
options.
Results
LISREL 8.8 (Jöreskog & Sörbom, 2007) was used to perform the CFA. Because
the data were not normal, Satorra-Bentler scaled chi-square statistics (Satorra & Bentler,
2001) were used to compare the fit of the tested models. The Satorra-Bentler correction
adjusts the chi-square test statistic associated with a model as well as individual
parameter estimates according to item-level curtosis; it was used instead of a bootstrap
analysis because, although relatively newly developed, Satorra-Bentler adjustments have
been shown to be robust across different degrees of item-level curtosis as well as sample
and model sizes (Curran, West, & Finch, 1996; Herzog, Boomsma, & Reinecke, 2006).
CFA output was compared for eight models. The models were based on the eight
categories of negative leader behavior found in Study 2 and included a one-factor model,
three two-factor models, three four-factor models, and an eight-factor model. Table 11
details the goodness-of-fit statistics associated with each model. Among the two-factor
models, one with subordinate-directed and organization-directed factors showed the best
fit [Scaled χ2 (739) = 2738.74; RMSEA = .09; CFI = .94; NFI = .92; SRMR = .11].
Among four-factor models, one made by crossing the subordinate-directed/organization-
55

directed and insidiously-damaging/immediately-damaging dimensions showed the best fit
[Scaled χ2 (734) = 2171.62; RMSEA = .07; CFI = .95; NFI = .93; SRMR = .11]. As
shown in Table 11, the eight-factor model showed significantly better fit, in terms of a
comparison of scaled chi-square statistics associated with each model, than any other
model [Scaled χ2 (712) = 1852.01; RMSEA = .07; CFI = .96; NFI = .94; SRMR = .09].
Despite the quality of the fit of the eight-factor model, an issue with the model
called for attention. Several of the latent-variable factors shared high phi coefficients.
These coefficients suggested that the four factors including behaviors directed at
subordinates should be collapsed into one subordinate-directed behavior factor, as the
coefficients among these factors ranged from .80 to .95. A coefficient of .87 between the
organization-directed/insidiously-damaging/rule-violating and organization-
directed/insidiously-damaging/norm-violating behavior factors suggested that the factors
should also be collapsed into one organization-directed/insidiously-damaging behavior
factor.
After making these modifications, the organization-directed/immediately-
damaging/rule-violating factor did not show uniqueness from the newly created
organization-directed/insidiously-damaging factor, in terms of a high phi coefficient of
.91. Consequently, the factors were combined to create an organization-directed behavior
factor.
Following these revisions to factors of the measure, modification indices showed
problems with four behaviors. Two behaviors, “Makes obscene gestures at subordinates”
and “Puts his own career ahead of what is good for his group or the organization” were
removed due to high cross-loadings on factors that did not make theoretical sense.
56

“Makes obscene gestures at subordinates” loaded on the organization-directed behavior
and organization-directed/immediately-damaging/norm-violating behavior factors in
addition to its predicted factor, the subordinate-directed behavior factor. “Puts his/her
own career of what is good for his/her group or the organization” loaded on the
subordinate-directed behavior factor in addition to its predicted factor, the organization-
directed behavior factor. Additionally, two behaviors from the organization-
directed/immediately-damaging/norm-violating factor [“At times appears to be under the
influence of alcohol or recreational drugs while at work” and “Throws things (but not at
others) or smashes things”] were reassigned to the organization-directed behavior factor.
Because the three remaining behaviors in this factor reference types of sexual
misconduct, the factor was judged to represent a sexual harassment behavior factor.
According to most goodness-of-fit indices, the final model showed adequate fit to
the data [Scaled χ2 (662) = 1876.83; RMSEA = .07; CFI = .96; NFI = .93; SRMR = .10].
Table 12 lists the behaviors included in each factor along with the factor loading of each
behavior. Additional assessment showed each factor to have adequate reliability, judged
in terms of internal consistency reliability. The subordinate-directed behavior factor had
a reliability of .92; the organization-directed factor had a reliability of .88; lastly, the
sexual harassment factor was found to have a reliability of .64. Finally, Figure 3 shows
the loadings of each of the three factors on the general negative leader behavior factor
and the correlations among the factors. The figure shows that although the factors seem
to be unique, in terms of inter-factor correlations, the overall negative leader behavior
factor explains at least a moderate amount of variance in each of the three sub-factors.
57

Discussion
Results of Study 3 show the structure of negative leader behavior to be similar to
the structure of negative workplace behavior in general, though the specific
manifestations of the behaviors differ. At a broad level, studies on negative workplace
behavior tend to make a distinction between behaviors directed at specific individuals and
those directed at the organization (e.g., Bennett & Robinson, 2000). Study 3 shows that a
similar distinction can be made among negative leader behaviors.
Also, though it may seem that subordinate-directed negative leader behavior and
sexual harassment behavior should be included in the same factor, research on non-
leader-specific negative behavior shows harassment to be somewhat distinct from
negative interpersonal behavior in general. Using CFA, Lim and Cortina (2005) tested
the extent to which sexual harassment and interpersonal incivility are unique. A model
that treated the two as separate factors showed significantly better fit than one that
included harassment and incivility behaviors in the same factor. Lim and Cortina argued
that sexual harassment is unique from other forms of incivility because it is rarer and
more severe than general incivility. Study 3 suggests that the same may be true of
harassment and interpersonal negative behavior engaged in by people in leadership
positions.
Despite the similarities, the measure of negative leader behavior is distinct from
measures of non-leader-specific negative behavior in terms of its specific items. Thirteen
of the thirty-eight behaviors included in the negative leader behavior measure are also
found in measures of workplace deviance [using Bennett and Robinson’s (2000) measure
as a reference] or counterproductive work behavior [using Fox, Spector, and Miles’s
58

(2001) measure as a reference]. Eleven of the thirteen overlapping behaviors are
included in the organization-directed behavior factor. The fourth and final study will not
only confirm the factor structure of the negative leader behavior measure but will also
determine the outcomes of those factors.
59

Chapter 5
Study 4: Validation
As with any measure development effort, evaluating the validity of a measure is
an important step (Hinkin, 1995). Study 4 will provide evidence of the criterion and
construct validity of the negative leader behavior measure developed through the first
three studies.
To determine the criterion validity of the negative leader behavior measure,
outcome measures will be collected from followers using a concurrent design. From a
follower’s perspective, relevant outcomes of negative leader behavior include job
satisfaction and turnover intentions. Research on abusive supervision and supervisor
undermining has found followers treated negatively by their leaders to have less job
satisfaction and be more likely to express a desire to leave an organization than followers
treated positively (e.g., Duffy et al., 2002; Tepper, 2000). It is also likely that followers
treated negatively by a leader will dislike that leader personally. Thus, similarly to a
manipulation check, Study 4 will assess the relationship between negative leader
behavior and liking for a leader.
Regarding the effects of the negative leader behavior factors individually, because
the subordinate-directed behavior factor most closely resembles existing constructs, it
should produce results similar to existing constructs. Studies on abusive supervision
have typically found that, by violating followers’ perceptions of justice, abusive
supervisors create lower levels of job satisfaction and organizational commitment and
higher levels of turnover, work-family conflict, stress, and depression among followers
(Aryee et al., 2007; Harvey et al., 2007; Tepper, 2000). In addition, research on non-
60

leader-specific forms of negative workplace behavior shows victims of bullying and
incivility to have less job satisfaction and greater stress and turnover intentions than non-
victims (Lim, Cortina, & Magley, 2008; Lutgen-Sandvik, Tracy, & Alberts, 2006). That
followers of leaders who engage in negative behaviors should have more negative
attitudes toward their organizations is not surprising given the extent to which leader-
follower relationships affect how followers feel about their organizations (Gerstner &
Day, 1997). Thus, subordinate-directed negative leader behavior should have negative
relationships with follower job satisfaction and liking for a leader and a positive
relationship with turnover intentions.
Sexual harassment should also negatively affect work attitudes. Quantitative
reviews have found negative relationships between sexual harassment and job
satisfaction, satisfaction with supervisors, and organizational commitment and a positive
relationship between harassment and withdrawal (Chan, Lam, Chow, & Cheung, 2008;
Willness, Steel, & Lee, 2007). Because of the interpersonal nature of sexual harassment,
it is likely that harassment leads to negative work attitudes by violating victims’
perceptions of justice.
Organization-directed behavior is predicted to have effects similar to the other
negative leader behavior factors but for a different reason. Studies that have found
witnesses of interpersonal bullying to have less job satisfaction and greater stress and
turnover intentions than non-witnesses have typically argued that witnesses have similar
affective responses to negative events as victims or that witnesses have a negative
reaction because they fear becoming victims of the same acts (Lim et al., 2007; Lutgen-
Sandvik et al., 2007; Vartia, 2001).
61
Organization-directed negative leader behavior is different than bullying or
interpersonal incivility though in that particular individuals are not the direct targets of
organization-directed behavior. Organization-directed behavior may still lead to negative
follower attitudes toward work but for a different reason. People expect higher standards
of behavior from people in leadership positions; they respond to positive forms of
leadership, such as transformational (Judge & Piccolo, 2004), authentic (Walumbwa,
Avolio, Gardner, Wernsing, & Peterson, 2008), and ethical leadership (Brown & Treviño,
2006), with more positive attitudes toward work and the organizations for which they
work. Leaders who engage in negative behavior should then be less likely to be
perceived as credible and trustworthy authority figures, as deviant behaviors are likely to
be inconsistent with expectations for appropriate conduct in a leader. The lack of trust in
a leader should then lead to more negative attitudes toward the leader and organization on
behalf of followers. In support of this argument, Dirks and Ferrin (2002) found unmet
expectations of leaders to negatively predict trust in leaders, which, in turn, predicts
follower turnover intentions and job satisfaction.
Hypothesis 1a: Negative leader behavior will negatively predict follower job satisfaction
and liking for leader and will positively predict follower turnover intentions.
Hypothesis 1b: Subordinate-directed negative leader behavior will negatively predict
follower job satisfaction and liking for leader and will positively predict follower
turnover intentions.
Hypothesis 1c: Sexual harassment leader behavior will negatively predict follower job
satisfaction and liking for leader and will positively predict follower turnover intentions.
62

Hypothesis 1d: Organization-directed negative leader behavior will negatively predict
follower job satisfaction and liking for leader and will positively predict follower
turnover intentions.
Another relevant outcome of negative leader behavior is the extent to which
followers engage in negative behavior themselves. Previous studies show that people
who are victims of negative behavior or are around others who commit negative
behaviors at work are more likely to perform deviant behavior than those who have not
been victimized by or witness to others’ negative behavior (Fox & Stallworth, 2005;
Hoobler & Brass, 2006; Robinson & O’Leary-Kelly, 1998).
As with negative leader behavior, there are different types of deviant follower
behavior to consider in making predictions; Bennett and Robinson (2000) identified
interpersonal and organizational deviance factors of overall workplace deviance. In a
study relevant to the effects of subordinate-directed negative leader behavior on the
specific types of follower deviance, Hoobler and Brass (2006) found subordinates of
abusive supervisors to engage in more undermining behaviors with their families, outside
of work. Using a “displaced aggression” perspective, Hoobler and Brass reasoned that
victims of supervisory abuse are likely to attempt to harm others less powerful than their
supervisors in order to vent their frustration but avoid incurring further abuse at the same
time. Research on non-leader-specific negative behavior shows that, although victims of
the negative behavior of those of higher status may not retaliate against those high-status
offenders (Aquino, Tripp, & Bies, 2001), they are more likely to engage in aggressive
behavior toward other individuals than non-victims (Glomb & Liao, 2003). Thus,
63

subordinate-directed negative leader behavior should lead to increased instances of
follower interpersonal deviance.
Subordinate-directed negative leader behavior should also promote followers’
organizational deviance. Detert et al. (2007) found abusive supervision to positively
predict work-unit counterproductivity, operationalized as food loss within a sample of
restaurants. The researchers proposed two explanations for the relationship: first, victims
of abusive supervision retaliate against their organizations in response to violations of
justice, and, second, abusive supervision leads to greater psychological distress, which
leads to more frequent instances of carelessness and mistakes. A similar effect is
expected for subordinate-directed negative leader behavior. Regarding leader sexual
harassment behavior, because of the similarity in the interpersonal nature of subordinate-
directed and harassment behavior, the latter should also lead to greater interpersonal and
organizational deviance.
Concerning organization-directed negative leader behavior, because the behavior
of people in leadership positions serves as a reference for how followers should behave at
work (Detert et al., 2007), leaders who behave badly should be more likely to have
followers who behave similarly. Similarly to leaders who behave unethically, although
Detert et al. (2007) did not find ethical leadership to predict work-unit
counterproductivity, those who engage in negative behavior directed at the organization
are likely to send a message to followers that such behavior is acceptable (Brown &
Treviño, 2006). Unlike subordinate-directed and sexual harassment behavior though,
because followers are not true victims of organization-directed behavior, there should not
be the same desire to enact vengeance upon less powerful coworkers. Thus,
64

organization-directed negative leader behavior should lead to follower organizational
deviance but not interpersonal deviance.
Hypothesis 2a: Negative leader behavior will positively predict overall follower
deviance, interpersonal deviance, and organizational deviance.
Hypothesis 2b: Subordinate-directed negative leader behavior will positively predict
overall follower deviance, interpersonal deviance, and organizational deviance.
Hypothesis 2c: Sexual harassment leader behavior will positively predict overall follower
deviance, interpersonal deviance, and organizational deviance.
Hypothesis 2d: Organization-directed negative leader behavior will positively predict
overall follower deviance and organizational deviance but will be unrelated to follower
interpersonal deviance.
As a final outcome, if the negative leader behavior measure is functioning as it
should, there should be a difference in follower ratings of leader effectiveness according
to scores on the measure. Just as followers perceive leaders who engage in positive
behaviors to be more effective than those who do not (Kim & Yukl, 1995), leaders rated
highly on the negative leader behavior measure should be rated as less effective than
those whom followers rate low on the measure. Regarding predictions for the overall
negative leader behavior measure and the subordinate-directed and sexual harassment
factors, followers who feel personally threatened by a leader should have less regard for
the effectiveness of the leader than followers who do not feel threatened. This is because
research on transformational leadership shows that leaders who fail to demonstrate
individualized consideration, which refers to stimulating, coaching, and respecting
followers, are likely to be evaluated poorly (Lowe, Kroeck, & Sivasubramaniam, 1996).
65

Regarding the effects of the organization-directed behavior factor, although followers
may not feel personally threatened by the behaviors, the behaviors are likely to constitute
a violation of followers’ expectations for their leaders. As mentioned earlier, unmet
expectations negatively predict trust in leadership, and leaders who are not perceived as
trustworthy are judged as less effective than those who are (Colquitt, Scott, & LePine,
2007).
Hypothesis 3a: Overall negative leader behavior and its factors will negatively predict
evaluations of leader effectiveness.
Hypothesis 3b: Among negative leader behavior factors, the organization-directed
behavior factor will predict evaluations of leader effectiveness least well.
To further support the validity of the negative leader behavior measure, Study 4
will assess the incremental validity of the measure over abusive supervision. Because the
negative leader behavior measure is more comprehensive than the measure of abusive
supervision, it is predicted that the former will explain variance in each outcome beyond
that explained by the latter. Similarly, among factors of the negative leader behavior
measure, because the organization-directed and sexual harassment factors are most
unique from the behaviors included in the measure of abusive supervision, those factors
should show incremental validity over the abusive supervision measure.
Hypothesis 4a: Negative leader behavior will predict all outcomes over abusive
supervision.
Hypothesis 4b: Among negative leader behavior factors, the organization-directed and
sexual harassment factors will account for the greatest amount of incremental variance
explained in each outcome over abusive supervision.
66

Finally, the construct validity of the negative leader behavior measure will be
assessed by comparing its scores to those of the abusive supervision measure. Because of
the similarity between several of the behaviors included in the measure of negative leader
behavior and those included in the abusive supervision measure, there should be a
positive relationship between scores on the two measures. Among negative leader
behavior factors, as previously mentioned, the subordinate-directed behavior factor is
most similar to the types of behaviors included in the abusive supervision measure. Thus,
there should also be a positive correlation between the subordinate-directed behavior
factor and abusive supervision. Regarding the relationships between abusive supervision
and the other negative leader behavior factors, existing research shows factors of negative
workplace behavior not to be orthogonal (Dalal, 2005). People who engage in one type
of negative behavior are likely to engage in other forms of negative behavior; therefore,
although the organization-directed and sexual harassment behavior factors are distinct
from abusive supervision behaviors, there should be positive but moderate-strength
correlations among abusive supervision and the factors.
Hypothesis 5a: Negative leader behavior will share a strong, positive correlation with
abusive supervision.
Hypothesis 5b: Subordinate-directed negative leader behavior will share a strong,
positive correlation with abusive supervision.
Hypothesis 5c: Organization-directed and sexual harassment negative leader behavior
will share moderate, positive correlations with abusive supervision.
67

Method
Participants
Participants included 522 individuals recruited from the general population
through several means. Sources of participants included MBA students from a small
Midwestern university (n = 19), the Study Response Project (n = 191), undergraduates
enrolled in two upper level psychology courses (n = 95), advertisements placed on work-
relevant websites (n = 18), and professional organizations (n = 199). Because
participants working in the education industry made up a disproportionately large portion
of the sample, responses from 96 participants who reported working in education were
removed at random, leaving a final sample size of 426. Characteristics of the sample are
presented in Table 13. Among the 426 participants, 226 completed two versions of a
survey according to the procedure described below, leading to a total of 692 completed
surveys.
Measures
Negative leader behavior. To assess negative leader behavior, participants
completed the 38-item measure resulting from Study 3. Before responses to the survey
were involved in any analyses, steps were taken to confirm the factor structure and item
loadings of the measure. Using LISREL 8.8 (Jöreskog & Sörbom, 2007), a confirmatory
factor analysis with Satorra-Bentler adjustments showed the predicted 3-factor, 38-item
model to have somewhat adequate fit [Scaled χ2(662) = 3322.78; RMSEA = .08; CFI =
.98; NFI = .98; SRMR = .09]. To improve on the fit of the model and to make the
negative leader behavior measure more concise, steps were taken to reduce the behaviors
included in each factor to those that are most indicative of a factor. Decisions to remove
68

behaviors were based on three pieces of information, including item-factor loadings from
Study 3 (Table 12), item-factor loadings and modification indices from the first CFA
attempt of Study 4, and subject matter experts’ reviews of the factors and their items. For
the third method, ten graduate students and faculty in Industrial/Organizational
Psychology were provided with descriptions of the three negative leader behavior factors
and asked to rate the extent to which each behavior was representative of its predicted
factor. Descriptive statistics results from this exercise were then reviewed.
Taking the three pieces of information into account led to the creation of the
measure outlined in Table 14. The measure includes 28 items, 14 of which comprise the
subordinate-directed factor, 11 are included in the organization-directed factor, and the
sexual harassment factor includes 3 items. A notable revision to the measure is that,
based on modification indices of the first CFA attempt of Study 4 as well as SMEs’
reviews of the behaviors, the behavior “Ignores phone calls and/or email” was reassigned
to the subordinate-directed behavior factor from the organization-directed behavior
factor.
After making decisions to revise the negative leader behavior measure and before
performing another CFA, the data set of 692 completed surveys was split into two
separate data sets, with one set including two-thirds of the completed surveys (454). The
other set included one-third of the completed surveys (224). The initial CFA, using the
unrevised measure, was performed again on the data set of 454 completed surveys, and a
CFA based on the revised measure was performed on the set of 224 surveys. The data set
was split in this way to ensure that both CFA tests did not use the same data; in other
69

words, the sample was split to ensure that the CFA tests were based on independent data
sets.
The unrevised measure again showed less than adequate fit to the data [Scaled
χ2(662) = 2357.23; RMSEA = .08; CFI = .98; NFI = .97; SRMR = .09]. The revised
measure showed better fit [Scaled χ2(347) = 728.10; RMSEA = .07; CFI = .99; NFI = .98;
SRMR = .04]. Consequently, all remaining analyses in Study 4 featured the revised
measure.
Participants responded to the negative leader behavior measure’s items on the
same 5-point response scale used in Study 3, with response options ranging from “never”
to “very often.” Coefficient alpha reliability was found to be 0.96 for the overall
measure. The reliabilities of the subordinate-directed, organization-directed, and sexual
harassment factors were found to be .96, .91, and .80, respectively.
Abusive supervision. Tepper’s (2000) abusive supervision measure consists of
fifteen items and represents the extent to which subordinates perceive their supervisors to
engage in abusive behaviors. Responses to the items are made on a five point scale.
Response anchors included: “I cannot remember him/her ever using this behavior with
me,” “He/she seldom uses this behavior with me,” “He/she occasionally uses this
behavior with me,” “He/she uses this behavior moderately with me,” and “He/she uses
this behavior very often with me”. The measure showed a reliability of .94.
Job satisfaction. Job satisfaction was assessed by four items drawn from scales
developed by Brayfield and Rothe (1951) and Cammann, Fichman, Jenkins, and Klesh
(1979). The items were: “I am enthusiastic about my job,” “I am satisfied with my
present job,” “I find real enjoyment in my job,” and “I consider my job to be rather
70

pleasant.” The 5-point response scale for the items ranged from “strongly disagree” to
“strongly agree.” The scale had a reliability of .94.
Liking for leader. A 4-item measure of liking developed by Engle and Lord
(1997) was used to assess the extent to which participants like the leader they had in mind
while completing the survey. The measure’s items include: “To what extent do you agree
that the person you have in mind would make a good friend?,” “How much do you like
this person?,” “To what extent do you agree that you get along with this person?,” and
“To what extent do you agree that working with this person is a pleasure?” The
reliability of the measure was found to be .92.
Turnover intentions. Three items were used to measure turnover intentions,
including “I am seriously thinking about quitting my job” (Landau & Hammer, 1986),
“How likely is it that you will actively look for a new job in the next year?” (Larwood,
Wright, Desrochers, & Dahir, 1998), and “How strongly do you feel about leaving your
job in the next year?” (Hom, Griffeth, & Sellaro, 1984). Responses to the items were
made on a 5-point scale. The measure had a reliability of .89.
Follower Deviance. To measure the extent to which participants engage in their
own forms of deviance, Bennett and Robinson’s (2000) 19-item workplace deviance
measure was used. The measure includes an interpersonal deviance scale, consisting of
seven items (e.g., “Made fun of someone at work”), and an organizational deviance scale,
consisting of the remaining items (e.g., “Taken property from work without permission”).
Participants rated the extent to which they have engaged in each behavior while working
with the leader in question on a 7-point scale. Response options included: “never,” “once
a year,” “twice a year,” “several times a year,” “monthly,” “weekly,” and “daily.” The
71

overall measure, interpersonal deviance factor, and organizational deviance factor had
reliabilities of .90, .81, and .86.
Procedure
Participants were asked to think of two leaders, supervisors, or managers with
whom they currently work or worked with in the past five years. One of the leaders
should have been someone that participants consider to be ineffective as a leader or
manager, and one should have been someone that participants consider to be effective as
a leader or manager. Participants were told to judge effectiveness according to how well
a leader performed typical duties, such as providing guidance and feedback to
subordinates, administering rewards and punishments appropriately, keeping abreast of
current events or issues at work, resolving conflicts, making good decisions about work,
delegating and keeping track of subordinates' assignments, and keeping material
resources (e.g., printers and paper) available. These examples were taken from
Fleishman, Mumford, Zaccaro, Levin, Korotkin, and Hein (1991)’s taxonomy of leader
behavior. Participants’ distinctions between effective and ineffective leaders served as an
assessment of participants’ perceptions of the effectiveness of a leader.
Participants were told to only complete the effective-leader portion of the survey
if they either work with someone who they consider to be effective at the above duties or
worked with someone they would consider to be effective within the past five years.
Similarly, they were told to only complete the ineffective-leader portion of the survey if
they currently worth with someone they would consider to be ineffective or worked with
someone they would consider to be ineffective within the past five years. For
participants who completed either the effective or ineffective-leader portions of the
72

survey while thinking of someone they no longer work with, survey items were reworded
to assess participants’ attitudes, behavior, and evaluations while working with the leader
in question (for example, the extent to which they engaged in interpersonal deviance
while working with the effective or ineffective leader). There were no significant
differences in responses to items according to whether participants completed one or both
versions of the survey.
Results
Correlational Analysis
Tables 15 and 16 present correlation matrices among the variables included in
Study 4. Table 15 presents Pearson product-moment correlations; whereas, due to
normality issues among responses to the negative leader behavior and abusive
supervision items, Table 16 presents Kendall’s Tau correlations among variables, which
is a non-parametric statistic. The tables lead to similar conclusions. Consistent with
predictions, subordinate-directed, organization-directed, and sexual harassment negative
leader behavior, as well as overall negative leader behavior, share significant and
negative correlations with job satisfaction and liking for a leader and positive correlations
with turnover intentions. The correlations also provide preliminary support for the
hypotheses for follower deviance, aside from a significant, positive correlation between
organization-directed negative leader behavior and follower interpersonal deviance,
contradicting Hypothesis 2d.
Regarding the comparisons between scores on the negative leader behavior and
abusive supervision measures, there is a strong, positive correlation between scores on
each measure, consistent with Hypothesis 5a. Hypotheses 5b and 5c also received
73

support, as, among negative leader behavior factors, the subordinate-directed behavior
factor shared the strongest correlation with abusive supervision, followed by the
organization-directed behavior and sexual harassment factors.
Providing mixed support for Hypothesis 4a, the negative leader behavior and
abusive supervision measures had similar correlations with the outcome measures. The
correlations between abusive supervision and the attitudinal outcomes (job satisfaction,
liking for leader, and turnover intentions) were somewhat greater than those for negative
leader behavior; however, the correlations between negative leader behavior and follower
deviance outcomes were somewhat greater than those for abusive supervision. Support
was also mixed for Hypothesis 4b. Abusive supervision had consistently higher
correlations with outcomes than the sexual harassment leader behavior factor. The
organization-directed behavior factor did though have greater correlations with the
follower deviance outcomes than did abusive supervision.
Regression Analyses
Tables 17-22 show the results of hierarchical regression analyses for the
attitudinal and follower deviance outcomes. Each table shows the extent to which the
three separate negative leader behavior factors and the overall negative leader behavior
scores predict each outcome over relevant control variables. Consistent with Hypothesis
1a, overall negative leader behavior scores negatively predicted job satisfaction (β = -.50,
p < .01) and liking for leader (β = -.64, p < .01) and positively predicted turnover
intentions (β = .48, p < .01) (Table 17-19).
Regarding Hypotheses 1b-d, an inspection of Tables 17-19 shows that the
standardized beta weights associated with the effects of the organization-directed and
74
sexual harassment factors on follower job satisfaction, liking for leader, and turnover
intentions are either non-significant or have the opposite signs as the zero-order
correlations among those variables. The organization-directed factor did not significantly
predict job satisfaction (β = .08, p > .05), liking for leader (β = .09, p > .05), or turnover
intentions (β = .03, p > .05). Sexual harassment positively predicted follower job
satisfaction (β = .11, p < .05), did not predict liking for leader (β = .04, p < .05), and
negatively predicted turnover intentions (β = -.11, p < .05).
Discrepancies between the size and direction of the beta weights and those of the
zero-order correlations indicated the presence of a suppression situation (Tzelgov &
Henik, 1991). More specifically, because the beta weights for the organization-directed
and sexual harassment factors, for the most part, have the opposite sign as the
correlations among those variables, the results of the regression analyses seem to qualify
as an example of negative suppression, a particularly rare form of suppression (Tzelgov
& Henik, 1991). As a conceptual explanation for the suppression, the portions of the
organization-directed and sexual harassment factors that negatively correlated with job
satisfaction and liking for leader and positively correlated with turnover intentions were
suppressed, most likely by some portion of variance in the subordinate-directed behavior
factor. Consequently, the beta weights show the two factors to either fail to predict job
satisfaction, liking, and turnover intentions or to predict those outcomes in the opposite
direction as the factors do in reality.
The suppression situation affected the beta weights associated with the
subordinate-directed factor as well. More consistent with the definition of absolute
suppression (Tzelgov & Henik, 1991), results of the regression analyses suggested that
75

the portion of variance in the subordinate-directed behavior factor that did not correlate
with job satisfaction, liking, and turnover intentions was suppressed by the other two
leader behavior factors, inflating the validity estimates associated with the subordinate-
directed factor.
Because of the finding of suppression, one should not consider the beta weights
included in Tables 17-19 to be accurate estimates of the extent to which the three
negative leader behavior factors predict job satisfaction, liking for leader, and turnover
intentions (Tzelgov & Henik, 1991). Results of the regression analyses can however be
interpreted according to the relative strengths with which the factors predict each of the
three outcomes (Tzelgov & Henik, 1991). Consistent with the correlational analysis,
Tables 17-19 show the subordinate-directed factor to predict follower job satisfaction (β
= -.67, p < .01), liking for leader (β = -.78, p < .01), and turnover intentions (β = .55, p <
.01) to a greater extent than the other two factors, as the largest beta weights are
associated with the subordinate-directed factor.
Regarding follower deviance as an outcome, consistent with Hypothesis 2a,
overall negative leader behavior scores positively predicted follower interpersonal
deviance (β = .40, p < .01), organizational deviance (β = .49, p < .01), and overall
follower deviance (β = .50, p < .01). Now considering the three leader behavior factors
separately, the similarity between the direction and magnitude of the beta weights
included in Tables 20-22 and those of the zero-order correlations among the variables did
not indicate the presence of a suppression situation. The beta weights should therefore be
considered accurate estimates of the extent to which each negative leader behavior factor
predicts follower interpersonal, organizational, and overall deviance. Concerning those
76

predictive relationships, subordinate-directed negative leader behavior was found to
positively predict follower interpersonal deviance (β = .16, p < .01), organizational
deviance (β = .31, p < .01), and overall deviance (β = .28, p < .01). In support of
Hypothesis 2d, organization-directed leader behavior positively predicted overall
follower deviance (β = .19, p < .01) and organizational deviance (β = .16, p < .01);
contrary to Hypothesis 2d, organization-directed behavior was the best predictor of
follower interpersonal deviance (β = .19, p < .01). Finally, as predicted, sexual
harassment behavior also positively predicted follower interpersonal deviance (β = .15, p
< .01), organizational deviance (β = .10, p < .05), and overall deviance (β = .13, p < .01).
Results for leader effectiveness as an outcome. To determine whether negative
leader behavior predicted follower judgments about the effectiveness of leaders, a binary
regression using the PROC GENMOD command in SAS was used (Table 23). As with
the other outcomes, the effects of the overall negative leader behavior scores conformed
to expectations. Unfortunately however, a suppression situation similar to that found for
follower job satisfaction, liking for leader, and turnover intentions appeared again in the
prediction of followers’ leader effectiveness judgments. The negative regression
coefficient associated with the subordinate-directed factor and the positive coefficients
associated with the organization-directed and sexual harassment factors indicated the
presence of suppression. As before, although the parameters included in Table 23 are not
accurate estimates of the extent to which the three factors predict followers’ leader
effectiveness judgments, the subordinate-directed factor emerged as a more useful
predictor of those judgments than the other two factors.
77

To provide a clearer picture of the effect of leaders’ engagement in negative
behavior on whether followers consider them to be effective, t-tests were performed to
determine whether leaders judged as effective engaged in significantly more or fewer of
each type of negative behavior than those judged as ineffective. In particular, Welch’s t-
tests were used because they do not assume independent samples to have equal variances
in scores on a particular variable. Results of the t-tests showed that leaders classified as
effective engaged in significantly fewer of each type of negative behavior than those
classified as ineffective (Table 24), with the greatest difference found in scores on the
subordinate-directed factor.
Incremental Validity of the Negative Leader Behavior Measure over Abusive Supervision
Tables 25-31 show the extent to which the negative leader behavior measure and
its factors predicted each outcome over abusive supervision. According to the change in
R2 statistics, the overall negative leader behavior scores and the three negative leader
behavior factors explained a significant amount of variance in each outcome beyond the
amount attributed to abusive supervision, providing support for Hypothesis 4a. Overall
negative leader behavior scores showed the greatest incremental validity in predicting
overall follower deviance (ΔR2 = .06, p < .01), follower organizational deviance (ΔR2 =
.05, p < .01), and follower interpersonal deviance (ΔR2 = .04, p < .01) and the least
amount of incremental validity in predicting follower job satisfaction (ΔR2 = .01, p < .01)
and turnover intentions (ΔR2 = .01, p < .05). Overall negative leader behavior scores
actually predicted follower interpersonal deviance better than abusive supervision [β =
.35 (p < .01) vs. β = .06 (p > .05), respectively]; the same was true for follower
78

organizational deviance [β = .39 (p < .01) vs. β = .12 (p < .05), respectively] and overall
follower deviance [β = .41 (p < .01) vs. β = .11 (p > .05), respectively].
The three negative leader behavior factors, considered separately, showed the
greatest amount of incremental validity in predicting follower job satisfaction (ΔR2 = .08,
p < .01) and liking for leader (ΔR2 = .08, p < .01), followed by overall follower deviance
(ΔR2 = .07, p < .01) and follower interpersonal (ΔR2 = .06, p < .01) and organizational
deviance (ΔR2 = .06, p < .01). The factors show the least incremental validity in
predicting follower turnover intentions (ΔR2 = .03, p < .01), although their combined
effect was significant. For each outcome, the negative leader behavior factors, entered as
separate factors, provided greater incremental validity than an overall negative leader
behavior score.
Also regarding the incremental validity of the three leader behavior factors, Table
28 shows the organization-directed factor to predict follower interpersonal deviance
better than abusive supervision [β = .17 (p < .01) vs. β = .13 (p < .05), respectively],
consistent with Hypothesis 4b. The subordinate-directed factor predicted follower
organizational deviance better than abusive supervision [β = .20 (p < .01) vs. β = .15 (p <
.05), respectively] (Table 29).
Structural Equation Model of the Predicted Relationships
To provide further support for the validity of the negative leader behavior
measure, especially given the suppression situation that made interpreting results of the
regression analyses for the attitudinal outcomes (job satisfaction, liking for leader, and
turnover intentions) more difficult, a structural equation model (SEM) was tested.
Because results of the CFA’s from Studies 3 and 4 as well as the correlational and
79

regression analyses of Study 4 suggested that treating the negative leader behavior factors
separately is more informative than as indicators of an overall negative leader behavior
score, the model depicted in Figure 4 presents the standardized path coefficients between
each negative leader behavior factor and each outcome, excluding the evaluation of
leader effectiveness (due to the point that this variable was represented by non-linear
single indicator), as well as between abusive supervision and each outcome.
Because the degree of intercorrelations among the negative leader behavior
factors may have contributed to the suppression situations found in several of the
regression analyses, the SEM included a constraint that did not allow the factors to
correlate. As expected, not allowing the leader behavior factors to correlate resulted in a
model of poorer fit [Scaled χ2(2460) = 12100.45; RMSEA = .08; CFI = .96; NFI = .95;
SRMR = .15] than a model in which the factors were allowed to correlate [Scaled
χ2(2457) = 8765.41; RMSEA = .06; CFI = .97; NFI = .97; SRMR = .13]; however, the
low goodness-of-fit statistics were acceptable because the SEM analysis had an objective
of evaluating the individual path estimates of predicted relationships, in light of the
previous findings of suppression, rather than evaluating the overall fit of a model.
Results of the SEM analysis, presented in Figure 4, still suggested the presence of
a suppression situation in the prediction of follower job satisfaction, liking for leader, and
turnover intentions, as the direction of the path estimates between those outcomes and the
organization-directed and sexual harassment factors are, for the most part, opposite of the
direction of the zero-order correlations among the variables. The figure does though
support the general conclusions from the correlational and regression analyses. First,
among negative leader behavior factors, subordinate-directed behavior is most predictive
80

of attitudinal outcomes, including job satisfaction, liking for leader, and turnover
intentions. The size and direction of the effects of subordinate-directed negative leader
behavior on the attitudinal outcomes is similar to the size and direction of the effects of
abusive supervision.
Second, the organization-directed and sexual harassment factors appear to be
important predictors of follower deviance. Results of the SEM analysis show that
leaders’ engagement in organization-directed negative behavior and sexual harassment
behavior increases the likelihood that followers will engage in both interpersonal and
organizational negative behavior themselves. Moreover, according to the SEM analysis,
the organization-directed and sexual harassment factors have greater effects on follower
deviance than does abusive supervision.
81

Chapter 6
General Discussion
Negative leadership has the potential to not only harm the psychological well-
being of those both inside and outside of organizations (Hoobler & Brass, 2006) but has
the potential to substantially hurt organizations financially as well. Bennett and
Robinson (2000) estimated that negative workplace behavior in general, not tied to
leadership positions, can cost organizations billions of dollars in legal, personnel, and
property costs. Because of the status of and resources available to people in leadership
positions, their performance of negative behavior is likely to be even more costly than
similar behaviors committed by people in non-leadership positions (Tepper et al., 2006).
Recent social events, especially within banking and mortgage industries, as well as
financial oversight agencies, suggest the degree to which negative leadership is a
destructive force and one that should be understood by organizational behavior
researchers.
However, for reasons cited earlier, despite the importance of doing so, previous
research has not taken a competent first step toward understanding negative leadership as
a broad-level construct. Existing research provides several examples of why taking such
a step is important. Bateman, O’Neill, and Kenworthy-U’Ren (2002) wrote that although
researchers assumed culture to affect behavior, cross-cultural research was not
characterized by a strong understanding of cultural types or accurate predictions of cross-
cultural organizational behavior until Hofstede’s (1980) identification of distinct cultural
dimensions. Similarly, since Robinson and Bennett’s (1995) and Bennett and Robinson’s
(2000) identification of two types of deviant work behavior, research has developed
82

theories and relatively accurate predictions involving those types of behavior (e.g.,
Colbert, Mount, Harter, Witt, & Barrick, 2004; Deifendorff & Mehta, 2007; Liao, Joshi,
& Chuang, 2004; Mount et al., 2006). Such advancements in the topics of culture and
deviance would likely not have occurred without the knowledge of the constructs that
studies such as Robinson and Bennett’s provided.
The examples underscore Fleishman and Quaintenance (1984)’s argument that
empirical analysis of constructs at general levels allows researchers to know which
portions of constructs have already been explored and which require further examination,
provides a point of comparison for findings from future research, and serves as a starting
point for theory development. Gruys and Sackett (2003) similarly stated that empirically
defining constructs at general levels provides a greater understanding of relationships
among specific forms of the constructs and their distinct antecedents and outcomes.
Investigating constructs at general levels also has utility for practice. Again
according to Fleishman and Quaintance (1984), a better understanding of constructs at
general levels allows for better job definition and analysis, training, performance
measurement and enhancement, and personnel selection, placement, and human resource
planning.
Similarly to the seminal studies on culture and workplace deviance, the present
study should significantly advance the understanding of negative leadership. Through a
comprehensive, empirical description of negative leader behavior and the development of
a measure of the construct, the present research project has reached several conclusions
regarding negative leadership, each of which is discussed below.
83

Conclusions Regarding the Structure of Negative Leader Behavior
The primary conclusion from the present research project is that negative leader
behavior is a multidimensional construct. Through MDS analysis, Study 2 identified
three dimensions underlying the full range of negative leader behavior, including
subordinate-directed/organization-directed, norm-violating/rule-violating, and
immediately-damaging/insidiously-damaging dimensions. Using a reduced set of
behaviors, Studies 3 and 4 found a measure of negative leader behavior to include three
factors referencing subordinate-directed, organization-directed, and sexual harassment
behavior.
That Study 2 found evidence for different types of negative leader behavior than
Studies 3 and 4 is not entirely surprising given the exploratory nature of MDS relative to
CFA. Previous efforts at applying MDS and factor analysis techniques to the same
construct have shown the two techniques to result in somewhat different sets of
conclusions. For example, using MDS, Robinson and Bennett (1995) found that deviant
behaviors can be organized according to two dimensions based on the target and severity
of a behavior. Using CFA, Bennett and Robinson (2000) found two deviant behavior
factors, interpersonal and organizational. Thus, there is precedence for the discord in the
dimensions found through the MDS analysis relative to the factors found through the
CFA analyses. Despite any discrepancies across the results of the MDS analysis and the
CFA analyses of the present project, the analyses support the general conclusion that, at
the broadest level, negative leader behavior can be organized around several conceptual
dimensions, and that the negative leader behavior measure proposed here includes three
confirmed factors.
84

Along with the MDS and CFA analyses, results of Study 4 also suggest that
conceptualizing negative leader behavior as three separate factors is more informative
than as a single negative leader behavior score. Study 4’s analyses showed the factors to
have different relationships with job-relevant criteria. Consistent with research
highlighting the importance of leader-follower personal relationships in predicting
followers’ evaluations of and attitudes toward their organizations (Gerstner & Day, 1997;
Rhoades & Eisenberger, 2002), the present study found subordinate-directed behavior to
emerge as more predictive of followers’ attitudes toward their organizations and the
leaders for whom they work than organization-directed and sexual harassment behavior.
Although individuals who are aware that people in leadership positions within their
organizations have engaged in any type of negative behavior are less likely to be satisfied
with their jobs, to like those leaders, and to perceive them as effective and are more likely
to desire to turnover than individuals who are unaware of such behavior, the effects are
strongest for the subordinate-directed behavior factor. Consistent with research on
abusive supervision, as discussed in the introduction to Study 4, the pattern of
relationships for the subordinate-direct factor can likely be explained by justice theory.
Whereas the subordinate-directed behavior factor appeared to be most valid as a
predictor of attitudinal outcomes, the organization-directed behavior factor emerged as a
strong predictor of overall follower deviance and follower interpersonal deviance. The
findings for the organization-directed behavior factor showed that followers of leaders
who act destructively toward the organization are more likely to respond by engaging in
negative behavior directed at other individuals than at the organization. Similarly, the
regression analyses showed subordinate-directed negative leader behavior to be more
85

predictive of follower organizational deviance than interpersonal deviance. Thus, results
of Study 4 suggest that individuals respond to exposure to subordinate-directed or
organization-directed negative leader behavior by engaging in the other form of behavior
themselves.
Although the results may seem counterintuitive, they are not entirely inconsistent
with existing research. Findings from existing research support the notion that
individuals treated abusively are more likely to retaliate against the organization than
other individuals. Though the study did not compare follower organizational deviance to
interpersonal deviance, Tepper, Henle, Lambert, Giacalone, and Duffy (2008) found a
positive relationship between abusive supervision and follower organizational deviance.
Other studies have found positive relationships between interactional and interpersonal
justice, which refer to the quality of treatment individuals receive from their supervisors
(Bies & Moag, 1986), and organizational deviance but not between supervisor-focused
justice perceptions and interpersonal deviance (Aquino, Galperin, & Bennett, 2004; Berry
et al., 2007).
Because previous studies on negative leader behavior have not included behaviors
directed at the organization, there are no prior studies to which the link between
organization-directed leader behavior and follower interpersonal deviance found in Study
4 can be compared. The relationship may occur because leaders who engage in behavior
such as stealing funds and property and violating organizational policies have failed as
authority figures to the extent that followers do not feel restrained against acting
aggressively toward others. Research does show individuals to be more likely to engage
in deviance to the extent that they are less likely to be punished for doing so (Hollinger &
86

Clark, 1983; Vardi & Wiener, 1996). In a relevant study, Skogstad, Einarsen, Torsheim,
Aasland, and Hetland (2007) found a positive relationship between laissez-faire
leadership and bullying among followers. Thus, leaders who engage in organization-
directed negative behavior may indirectly promote interpersonal incivility and aggression
through failing to create a safe working environment.
Regarding the sexual harassment factor, results showing the factor to have the
weakest, though still significant, relationships with outcomes seem to be consistent with
previous research. A study by Lim and Cortina (2005) found stronger correlations
between interpersonal incivility and job satisfaction, supervisor satisfaction, withdrawal,
and psychological well-being than between sexual harassment and the same outcomes.
Similarly, a meta-analysis by Lapierre, Spector, and Leck (2005) found a greater effect
size between nonsexual aggression and job satisfaction than between sexual aggression
and satisfaction, especially among female victims. Lapierre et al. proposed that, because
nonsexual aggression occurs more frequently, targets of sexual aggression are more likely
to blame particular offenders for their victimization, as opposed to the organization, than
victims of nonsexual aggression. The latter are more likely to at least partially blame an
organization for their victimization. Such findings suggest that, in general, sexual
harassment does not have consequences as severe as one might think.
Because previous research suggests that men and women perceive and react to
sexual harassment differently (Rotundo, Nguyen, & Sackett, 2001), supplemental
analyses were conducted to determine whether a different pattern of relationships
between sexual harassment and outcomes would apply to men and women from Study 4.
A comparison of Kendall’s tau correlations among the variables for men and women
87

showed the only notable difference to occur in the relationships between harassment and
the follower deviance outcomes, as the correlations among the variables were greater for
men than for women [r = .32 (p < .01) vs. r = .18 (p < .01), for interpersonal deviance; r
= .27 (p < .01) vs. r = .18 (p < .01), for organizational deviance; r = .31 (p < .01) vs. r =
.20 (p < .01), for overall deviance]. Hierarchical regression analyses, however, did not
show gender to moderate the relationships between sexual harassment and any outcome.
Thus, the same pattern of relationships holds for both men and women in Study 4.
Finally regarding the sexual harassment factor, for future research using the
measure of negative leader behavior, it may be beneficial to propose items to add to the
factor to make it approximately equal, in terms of number of items, to the other two
factors and to expand the range of harassment behaviors assessed by the factor. Studies
on sexual harassment have most frequently used Fitzgerald, Shullman, Bailey, Richards,
Swecker, Gold, Ormerod, and Weitzman’s (1988) measure. Although Fitzgerald et al.
initially intended the measure to address five categories of sexual harassment, subsequent
studies have found three factors to reliably emerge from the measure, including gender
harassment, unwanted sexual attention, and sexual coercion factors (Gelfand, Fitzgerald,
& Drasgow, 1995; Gettman & Gelfand, 2007; Glomb, Munson, Hulin, Bergman, &
Drasgow, 1999).
The three sexual harassment factors are represented by the three items included in
the harassment factor of the negative leader behavior measure. “Brings inappropriate
material to work (e.g., pornography)” is indicative of gender harassment; “Engages in
romantic and/or sexual relationships with others from work” of unwanted sexual
attention; “Hints that sexual favors will result in preferential treatment” of sexual
88

coercion. For future research, additional items representative of each of the three
harassment factors should be added to the sexual harassment factor of the negative leader
behavior measure. From Fitzgerald et al.’s (1988) measure, “Treats subordinates
differently because of their gender” and “Makes sexually suggestive/sexist remarks,”
which reflect gender harassment, seem relevant to leadership positions. To represent
unwanted sexual attention, “Gives unwelcome sexual attention,” “Attempts to touch
subordinates inappropriately,” and “Makes unwanted attempts to establish a relationship”
are likely to be relevant leader behaviors. Finally, from the sexual coercion harassment
factor, “Threatens with negative consequences for not cooperating sexually” and “Treats
subordinates badly for not having sexual relations with the supervisor/leader” should be
included. Making the proposed additions to the sexual harassment factor should make it
more representative of all possible forms of harassment.
Conclusions Regarding Previous Research on Negative Leader Behavior
In addition to highlighting the complexities of the negative leader behavior
construct, the present study’s findings emphasize the limitations of previous research.
Because existing constructs, such as abusive supervision, do not assess behaviors directed
at the organization or sexual harassment behaviors, they address only a portion of the
possible manifestations of negative leader behavior. Given Study 2’s finding that
existing constructs map almost entirely onto subordinate-directed leader behavior
categories and the relatively strong correlation between the subordinate-directed negative
leader behavior factor and abusive supervision in Study 4, it is not surprising that the
subordinate-directed factor and abusive supervision predict outcomes almost equally as
well. This is not to question the usefulness of previously developed constructs related to
89

negative leader behavior as indicators of the quality of the relationship between a leader
and follower, but results of Study 4 show that types of negative leader behavior not
included in petty tyranny, abusive supervision, and supervisor undermining may be more
valid predictors of some outcomes (e.g., follower deviance).
Besides identifying the types of negative leader behavior not addressed by
previous research, the present research project has two strengths relative to existing
research. First is the incorporation of a traditional scale development methodology. The
adoption of such methodologies is relatively rare in research on negative workplace
behavior. Among non-leader-specific constructs, Greenberg and Barling’s (1999)
measure of workplace aggression was not subjected to a thorough scale development
process. Regarding leader-specific constructs, neither measure of the most frequently
cited constructs, abusive supervision and supervisor undermining, was developed through
the steps involved in the preset project. For the present project, using such a
methodology not only resulted in a description of negative leader behavior that is more
comprehensive than previous efforts but provided a more reliable analysis of negative
leader behavior than if the inventory of behaviors had been generated through a review of
previous research alone and the resulting behaviors were not subjected to multiple rounds
of dimension and factor analysis, both of which are characteristics of the steps taken to
develop the measure of abusive supervision.
A second strength of the present project is that it provides a single source of
behaviors representative of each type of negative leader behavior. The importance of this
point can be illustrated by Figure 5. The figure depicts the overlap between the behaviors
included in each of the three negative leader behavior factors and behaviors included in
90

measures of previously researched leader- and non-leader-specific (e.g.,
counterproductive work behavior) constructs. The figure shows that although most
organization-directed and harassment behaviors overlap with behaviors included in
measures of non-leader-specific constructs and that leader-specific constructs (abusive
supervision, petty tyranny, and supervisor undermining) share the greatest degree of
overlap with the subordinate-directed factor, no existing construct includes all of the
behaviors included in the present project’s measure of negative leader behavior.
As mentioned earlier, leader-specific constructs do not address organization-
directed behaviors or those with sexually-themed content. Even within subordinate-
directed behavior, measures of leader-specific constructs do not include instances of
withdrawing from a leader-follower relationship (e.g., “Avoids addressing important
issues,” “Ignores phone calls and/or emails,” and “Inadequately explains performance
reviews”) or specific aspects of managing the administration of rewards and punishments
(e.g., “Denies subordinates of things they are entitled to”). Among individual measures,
that of the most frequently researched existing construct, abusive supervision, overlaps
with six of the fourteen subordinate-directed negative leader behaviors and does not
address, as mentioned, withdrawal from a leader-follower relationship or the management
of rewards and punishments.
Non-leader-specific constructs, in general, assess a wider range of different types
of negative behavior than leader-specific constructs, but behaviors included in measures
of the former do not reference actions taken by leaders and do not speak to activities
specific to leadership positions (e.g., “Lets violations of company policy slide,” “Denies
subordinated of things they are entitled to,” and “Shows no clear standards for
91
administering rewards and punishments”). That no single previously developed measure
includes the range of behaviors included in the measure of negative leader behavior and
that even if previously developed measures were combined, they would not address all of
the behaviors included in the negative leader behavior measure underscores the
importance of providing a single source of negative workplace behaviors relevant to
leadership positions.
Implications for Future Research
Future research should work toward further evaluating the differences among all
negative leader behavior factors. Differences could be highlighted through two means.
One would be by gathering a wider range of criteria, obtained through multiple sources,
against which to validate the negative leader behavior factors. Follower job performance
and organizational performance are especially relevant criteria. Because subordinate-
directed behaviors include actions like discounting follower feedback and effort, being
inconsistent, and failing to adequately administer rewards and punishments, they should
negatively affect follower performance. Subordinate-directed behaviors are also likely to
negatively affect organizational performance partly because they should lead to greater
turnover among employees.
The effects of the organization-directed and sexual harassment factors on follower
performance may depend on other factors, such as how strongly followers disagree with
negative behaviors directed at an organization, in the case of organization-directed leader
behavior, and the nature of the relationship between a leader and follower, in the case of
sexual harassment behavior. Regardless of their effect on follower performance, the two
factors are likely to have a negative impact on organizational performance because, as
92

shown by Study 4, followers of leaders who engage in organization-directed negative
behavior and sexual harassment behavior are likely to engage in their own forms of costly
negative behavior.
A second source of information regarding the distinctiveness of the three negative
leader behavior factors would be the extent to which they have unique sets of predictors.
Research on non-leader-specific forms of negative behavior suggests that behaviors
directed at organizations have somewhat different predictors than those directed at
individuals (e.g., Colbert et al., 2004; Lee & Allen, 2002; O’Brien & Allen, 2008).
Consistent with this research, conscientiousness may better predict organization-directed
negative leader behavior than subordinate-directed behavior; whereas, agreeableness may
better predict subordinate-directed behavior. Also, follower characteristics, such as
affect, may predict subordinate-directed and sexual harassment leader behavior similarly
to how they predict abusive supervision (Tepper et al., 2006) but may not predict
behaviors directed at the organization.
It is important to note that previous research provides few, to say the least,
explanations regarding the effects of organizational policies on individuals’ engagement
in negative leader behavior. More specifically, existing research offers organizations no
useful advice about characteristics of leader development programs that may make
individuals less likely to engage in negative leader behavior or how job characteristics
(e.g., job, time, and resource demands and degree of managerial oversight) enhance or
reduce the likelihood that leaders will perform negative behaviors. To be truly relevant
to the effective functioning of organizations, future research should investigate the impact
93

of specific organizational characteristics and programs on the frequency with which
leaders engage in the different types of negative behavior.
Practical Implications
Given that negative leader behavior can be reliably and validly assessed,
organizations should incorporate the construct in personnel selection, appraisal, and
development efforts. To avoid selecting individuals into leadership positions, the
negative leader behavior measure could be included as an outcome into criterion-validity
studies. For appraisal purposes, the measure could be included in 360-degree evaluation
programs. Knowledge of the extent to which employees in leadership positions have
engaged in negative behavior would allow organizations to know when to intervene in
cases of destructive behavior or when to terminate employees who have engaged in
negative behavior and being able to do so with justification. Finally, reviewing the full-
range of negative behaviors generated in Study 1 with individuals in leadership positions
may reduce the likelihood that individuals will engage in negative behavior in the first
place by making them aware of what is considered appropriate and inappropriate
conduct.
Limitations
There are several limitations associated with the present study. First is the finding
of suppression in the regression analyses of Study 4. Because suppression was found, the
parameter estimates found in those analyses could not be considered accurate
representations of the extent to which each of the three negative leader behavior factors
explain variance in follower job satisfaction, liking for leader, and turnover intentions.
However, two pieces of information support the argument that the suppression resulted
94

from issues related to the sample and/or data collection methods rather than the negative
leader behavior measure itself. First is the rarity with which suppression occurs,
especially a suppression situation in which the sign of a relationship between a predictor
and outcome is reversed, as was found in Study 4; such suppression is more difficult to
replicate than to fail to replicate (Tzelgov & Henik, 1991).
Second, as noted earlier, the regression models that included types of follower
deviance as outcomes did not show evidence of suppression. The measure of follower
deviance asked participants to report their behavior while working with the leader in
question; this is different from the measures of the attitudinal outcomes, which asked
participants to record their subjective impressions of and attitudes toward their
organizations and leaders. The finding of suppression with some outcomes but not others
suggests that collecting different kinds of criteria (e.g., attitudinal vs. behavioral) through
different means (e.g., objective vs. subjective; self-report vs. peer or supervisor reports)
may reduce the likelihood of the occurrence of suppression in the future and make
estimates of the effects of negative leader behavior more accurate.
As a second limitation, on a related note, because the survey used in Study 4 was
administered at a single time, common method bias may have inflated the magnitude of
the relationships among variables. A single administration time was chosen because
separating components of the survey across time would not have eliminated the tendency
of participants to base their responses to the leader behavior measures at least partly on
the general quality of their experience at work while with a particular leader. In addition,
because participants did not have to complete Study 4’s measures in response to their
current leader, those who completed the survey in regard to someone with whom they
95

previously worked may have forgotten which leader they chose to complete the first
portion of the survey in regard to before participating in future survey administrations.
Thus, despite the potential issues associated with a one-time survey administration, it was
judged to be the most appropriate method of collecting data for Study 4.
Another limitation tied to the method of collecting data across Studies 2, 3, and 4
is the inducement of variance in responses by referencing extremes of participants’
experiences with leaders. This was done in order to make the distinct dimensions and
factors of negative leader behavior and their relationships with outcomes more visible,
especially given the low baserate-frequency of many of the behaviors of interest in the
present study. As with common method bias though, inducing variability in scores can
inflate estimates of the relationships between variables. Although the same general
conclusions may apply to every-day working environments, in which extremes of
effectiveness and ineffectiveness are rarer, the strength of the relationships found in
Study 4 may not be as great. Future research should test the extent to which findings
from the present study apply to a day-to-day working environment.
Finally, the lack of an organizational sample, especially for Study 4, made
assessing the degree and effects of convergence among followers’ ratings of the same
leader impossible. Doing so would speak to the extent to which people in leadership
positions engage in negative subordinate-directed and sexual harassment behavior on a
dyadic leader-follower level versus engaging in the same behaviors consistently across
groups of followers. Also, by creating a measure of convergence in followers’ ratings,
Study 4 could have assigned a more accurate number to leaders’ engagement in each type
of negative behavior relative to relying on reports from a sole follower. To date, only one
96
known study by Detert, Treviño, Burris, and Andiappan (2007) has investigated the
effects of abusive supervision at a work-unit level. In the future, research should
examine issues related to convergence in followers’ ratings of negative leader behavior.
Summary
Despite the importance of understanding negative leadership, emphasized by the
frequency with which it occurs and the destructive effects it has on individual and
organizational outcomes, previous research has addressed the topic in a haphazard
manner. Rather than working toward developing a better understanding of the general
nature of negative leader behavior, existing research has focused on constructs that
represent specific types of negative leader behavior. The present project intended to
provide a starting point for studying negative leader behavior at a broad level by
identifying the structure of the behaviors, creating a measure of them, and providing
evidence of that measure’s validity. Through accomplishing its objectives, the present
study has reached important conclusions regarding negative leader behavior and has
implications for future research and practice on the popular and important topic of
negative leadership.
97

References
Agervold, M. (2007). Bullying at work: A discussion of definitions and prevalence,
based on an empirical study. Scandinavian Journal of Psychology, 48, 161-172.
Ambrose, M. L., Seabright, M. A., & Schminke, M. (2002). Sabotage in the workplace:
The role of organizational justice. Organizational Behavior and Human Decision
Processes, 89, 947-965.
Andersson, L. M. & Pearsson, C. M. (1999). Tit for tat? The spiraling effect of incivility
in the workplace. Academy of Management Review, 24, 452-471.
Aquino, K., Galperin, B. L., & Bennett, R. J. (2004). Social status and aggressiveness as
moderators of the relationship between interactional justice and workplace
deviance. Journal of Applied Social Psychology, 34, 1001-1029.
Aquino, K., Tripp, T. M., & Bies, R. J. (2001). How employees respond to personal
offense: The effects of blame attribution, victim status, and offender status on
revenge and reconciliation in the workplace. Journal of Applied Psychology, 86,
52-59.
Aryee, S., Chen, Z. X., Li-Yun, S., & Debrah, Y. A. (2007). Antecedents and outcomes
of abusive supervision: Test of a trickle-down model. Journal of Applied
Psychology, 92, 191-201.
Ashforth, B. E. (1987). Organizations and the petty tyrant: An exploratory study. Paper
presented at the Annual Meeting of the Academy of Management, New Orleans,
Louisiana.
Ashforth, B. (1994). Petty tyranny in organizations. Human Relations, 47, 755−778.
98

Ashforth, B. (1997). Petty tyranny in organizations: A preliminary examination of
antecedents and consequences. Canadian Journal of Administrative
Sciences, 14, 126–140.
Baron, R. A. & Neuman, J. H. (1996). Workplace violence and workplace aggression:
Evidence on their relative frequency and potential causes. Aggressive Behavior,
22, 161-173.
Barrick, M. R., Day, D. V., Lord, R. G., & Alexander, R. A. (1991). Assessing the utility
of executive leadership. Leadership Quarterly, 2, 9-22.
Bass, B. M. (1985). Leadership: Good, better, best. Organizational Dynamics, 13, 26-
40.
Bass, B. M. and B, Avolio (1990). Transformational leadership development: Manual for
the Multifactor Leadership Questionnaire. Palo Alto, CA: Consulting
Psychologist Press.
Bass, B. M., & Riggio, R. E. (2006). Transformational leadership (2nd. ed.). Mahwah,
NJ: Lawrence Erlbaum Associates.
Bateman, T. S., O’Neill, H., & Kenworthy-U’Ren, A. (2002). A hierarchical taxonomy
of top managers’ goals. Journal of Applied Psychology, 87, 1134-1148.
Baumeister, R. F., Bratslavsky, E., Finkenauer, C., & Vohs, K. D. (2001). Bad is
stronger than good. Review of General Psychology, 5, 323-370.
Bell, A. H. & Smith, D. M. (1991). Difficult people at work: How to cope, how to win.
MJF Books: New York.
Bennett, R. J. & Robinson, S. L. (2000). Development of a measure of workplace
deviance. Journal of Applied Psychology, 85, 349-360.
99

Bennett, R. J. & Robinson, S. L. (2003). The past, present, and future of workplace
deviance research. In J. Greenberg (Ed.), Organizational behavior: The state of
the science (2nd ed.) (pp. 247-281). Mahwah, NJ: Lawrence Erlbaum Associates
Publishers.
Berry, C. M., Ones, D. S., & Sackett, P. R. (2007). Interpersonal deviance,
organizational deviance, and their common correlates: A review and meta-
analysis. Journal of Applied Psychology, 92, 410-424.
Bies, R. J. (2000). Interactional (in)justice: The sacred and the profane. In J. Greenberg
& R. Cropanzano (Eds.), Advances in organizational behavior. Stanford, CA:
Stanford University Press.
Bies, R. J., & Moag, J. S. (1986). Interactional justice: Communication criteria of
fairness. In R. Lewicki, B. Sheppard, & M. Bazerman (Eds.), Research on
negotiation in organizations (pp. 43-53). Greenwich, CT: JAI.
Blickle, G., Schlegel, A., Fassbender, P., & Klein, U. (2006). Some personality
correlates of business white-collar crime. Applied psychology: An International
Review, 55, 220-233.
Brayfield, A. H. & Rothe, H. F. (1951). An index of job satisfaction. Journal of Applied
Psychology, 35, 307-311.
Brown, M. E. & Treviño, L. K. (2006). Ethical leadership: A review and future
directions. Leadership Quarterly, 17, 595-616.
Buss, A. H. (1961). The psychology of aggression. New York: Wiley and Sons.
100
Cammann, C., Fichman, M., Jenkins, D., & Klesh, J. (1979). The Michigan
Organizational Assessment Questionnaire. Unpublished manuscript, University of
Michigan, Ann Arbor.
Chan, D. K. S., Lam, C. B., Chow, S. Y., & Cheung, S. F. (2008). Examining the job
related, psychological, and physical outcomes of workplace sexual harassment: A
meta-analytic review. Psychology of Women Quarterly, 32, 362-376.
Christie, R., & Geis, F. (1970). Studies in Machiavellianism. New York: Academic
Press.
Cohen-Charash, Y. & Mueller, J. S. (2007). Does perceived unfairness exacerbate or
mitigate interpersonal counterproductive work behaviors related to envy? Journal
of Applied Psychology, 92, 666-680.
Colbert, A. E., Mount, M. K., Harter, J. K., Witt, L. A., & Barrick, M. R. (2004).
Interactive effects of personality and perceptions of the work situation on
workplace deviance. Journal of Applied Psychology, 89, 599–609.
Colquitt, J. A. (2001). On the dimensionality of organizational justice: A construct
validation of a measure. Journal of Applied Psychology, 86, 386–400.
Collins, J.M., & Schmidt, F.L. (1993). Personality, integrity, and white-collar crime:
A construct validity study. Personnel Psychology, 46, 295–311.
Colquitt, J. A., Conlon, D. E., Wesson, M. J., Porter, C. O. L. H., & Ng, K. Y. (2001).
Justice at the millennium: A meta-analytic review of 75 years of organizational
justice research. Journal of Applied Psychology, 86, 425-445.
101
Colquitt, J. A., Scott, B. A., & LePine, J. A. (2007). Trust, trustworthiness, and trust
propensity: A meta-analytic test of their unique relationships with risk taking and
job performance. Journal of Applied Psychology, 92, 909-927.
Conger, J. A. (1990). The dark side of leadership. Organizational Dynamics, 19, 44-55.
Cortina, L. M., Magley, V. J., Williams, J. H., & Langhout, R. D. (2001). Incivility in
the workplace: Incidence and impact. Journal of Occupational Health
Psychology, 6, 64-80.
Curran, P. J., West, S. G., & Finch, J. F. (1996). The robustness of test statistics to
nonnormality and specification error in confirmatory factor analysis.
Psychological Methods, 1, 16-29.
Dalal, R. S. (2005). A meta-analysis of the relationship between organizational
citizenship behavior and counterproductive work behavior. Journal of Applied
Psychology. Special Section: Theoretical Models and Conceptual Analyses –
Second Installment, 90, 1241-1255.
Day, D. V., & Lord, R. G. (1988). Executive leadership and organizational performance:
Suggestions for a new theory and methodology. Journal of Management, 14,
453-464.
Detert, J. R., Treviño, L. K., Burris, E. R., & Andiappan, M. (2007). Managerial modes
of influence and counterproductivity in organizations: A longitudinal business-
unit-level investigation. Journal of Applied Psychology, 92, 993-1005.
Diefendorff, J. M. & Mehta, K. (2007). The relations of motivational traits with
workplace deviance. Journal of Applied Psychology, 92, 967-977.
102
DeVries, D.L., & Kaiser, R.B. (2003). Going sour in the suite. In S. Steckler, D. Sethi, &
R.K. Prescot (coordinators), Maximizing executive effectiveness, workshop
presented by the Human Resources Planning Society, Miami, FL.
Dilchert, S., Ones, D. S., Davis, R. D., & Rostow, C. D. (2007). Cognitive ability
predicts objectively measured counterproductive work behaviors. Journal of
Applied Psychology, 92, 616-627.
Dirks, K. T. & Ferrin, D. L. (2002). Trust in leadership: Meta-analytic findings and
implications for research and practice. Journal of Applied Psychology, 87, 611-
628.
Duffy, M. K., Ganster, D., & Pagon, M. (2002). Social undermining in the workplace.
Academy of Management Journal, 45, 331-351.
Duffy, M. K., Ganster, D. C., Shaw, J. D., Johnson, J. L., & Pagon, M. (2006). The
social context of undermining behavior at work. Organizational Behavior and
Human Decision Processes, 101, 105-126.
Dupré, K. E., Inness, M., Connelly, C. E., Barling, J., & Hoption, C. (2006). Workplace
aggression in teenage part-time employees. Journal of Applied Psychology, 91,
987-997.
Einarsen, S., Aasland, M. S., & Skogstad, A. (2007). Destructive leadership behaviour:
A definition and conceptual model. Leadership Quarterly, 18, 207-216.
Einarsen, S., & Hoel, H. (2001, May). The Negative Acts Questionnaire: Development,
validation and revision of a measure of bullying at work. Paper presented at the
10th European Congress on Work and Organisational Psychology, Prague.
103

Einarsen, S., Hoel, H., Zapf, D., & Cooper, C. L. (2003). The concept of bullying at
work. In Bullying and emotional abuse in the workplace: International
perspectives in research and practice. (pp. 3-30). London: Taylor & Francis.
Engle, E. M. & Lord, R. G. (1997). Implicit theories, self schemas, and leader-member
exchange. Academy of Management Journal, 40, 988-1010.
Ferris, G. R., Zinko, R., Brouer, R. L., Buckley, M. R., & Harvey, M. G. (2007).
Strategic bullying as a supplementary, balanced perspective on destructive
leadership. Leadership Quarterly, 18, 195-206.
Fitzgerald, L. F., Shullman, S. L., Bailey, N., Richards, M., Swecker, J., Gold, Y.,
Ormerod, M., & Weitzman, L. (1988). The incidence and dimensions of sexual
harassment in academia and the workplace. Journal of Vocational Behavior, 32,
152-175.
Flaherty, S. & Moss, S. A. (2007). The impact of personality and team context on the
relationship between workplace injustice and counterproductive work behavior.
Journal of Applied Social Psychology, 37, 2549-2575.
Fleishman, E. A., Mumford, M. D., Zaccaro, S. J., Levin, K.Y., Korotkin, A. L., & Hein,
M. B. (1991). Taxonomic efforts in the description of leader behavior: A
synthesis and functional interpretation. Leadership Quarterly, 2, 245-287.
Fleishman, E. A. & Quaintance, M. K. (1984). Taxonomies of human performance.
Orlando, FL: Academic Press, Inc.
Folger, R. & Skarlicki, D. P. (1998). A popcorn metaphor for employee aggression. In
R. W. Griffin, A. O’Leary-Kelly, & J. M. Collins (Eds.), Dysfunctional behavior
in organizations. Violent and deviant behavior. Monographs in organizational
104

behavior and industrial relations (Vol. 23) (pp. 43-81). US: Elsevier Science/JAI
Press.
Fox, S., Spector, P. E., & Miles, D. (2001). Counterproductive work behavior (CWB) in
response to job stressors and organizational justice: Some mediator and moderator
tests for autonomy and emotions. Journal of Vocational Behavior, 59, 291–309.
Fox, S. & Stallworth, L. E. (2005). Racial/ethnic bullying: Exploring links between
bullying and racism in the US workplace. Journal of Vocational Behavior, 66,
438-456.
Gelfand, M. J., Fitzgerald, L. F., & Drasgow, F. (1995). The structure of sexual
harassment: A confirmatory factor analysis across cultures and settings. Journal
of Vocational Behavior, 47, 164-177.
Gerstner, C. R. & Day, D. V. (1997). Meta-analytic review of leader-member exchange
theory: Correlates and construct issues. Journal of Applied Psychology, 82,
827-844.
Gettman, H. J. & Gelfand, M. J. (2007). When the customer shouldn’t be king:
Antecedents and consequences of sexual harassment by clients and customers.
Journal of Applied Psychology, 92, 757-770.
Giacalone, R. A. & Knouse, S. B. (1990). Justifying wrongful employee behavior: The
role of personality in organizational sabotage. Journal of Business Ethics, 9, 55-
61.
Glomb, T. M. & Liao, H. (2003). Interpersonal aggression in work groups: Social
influence, reciprocal, and individual effects. Academy of Management Journal,
46, 486-496.
105

Glomb, T. M., Munson, L. J., Hulin, C. L., Bergman, M. E., & Drasgow, F. (1999).
Structural equation models of sexual harassment: Longitudinal explorations and
cross-sectional generalizations. Journal of Applied Psychology, 84, 14-28.
Greenberg, L. & Barling J. (1999). Predicting employee aggression against coworkers,
subordinates and supervisors: The roles of person behaviors and perceived
workplace factors. Journal of Organizational Behavior, 20, 897-913.
Gruys, M. L. (1999). The dimensionality of deviant employee performance in the
workplace. Unpublished doctoral dissertation, University of Minnesota.
Gruys, M. L. & Sackett, P. R. (2003). Investigating the dimensionality of
counterproductive work behavior. International Journal of Selection and
Assessment, 11, 30-42.
Hall, J. M. & Hall-Merenda, K. E. (1999). The ties that bind: The impact of leader-
member exchange, transformational and transactional leadership, and distance on
predicting follower performance. Journal of Applied Psychology, 84, 680-694.
Hanisch, K. A., & Hulin, C. L. (1990). Job attitudes and organizational withdrawal: An
examination of retirement and other voluntary withdrawal behaviors. Journal of
Vocational Behavior, 37, 60–78.
Harris, K. J., Kacmar, K. M., & Zivnuska, S. (2007). An investigation of abusive
supervision as a predictor of performance and the meaning of work as a
moderator of the relationship. Leadership Quarterly, 18, 252-263.
Harvey, P., Stoner, J., Hochwater, W., & Kacmar, C. (2007). Coping with abusive
supervision: The neutralizing effects of ingratiation and positive affect on
negative employee outcomes. Leadership Quarterly, 18, 264-280.
106

Hater, J. J. & Bass, B. M. (1988). Superiors’ evaluations and subordinates’ perceptions
of transformational and transactional leadership. Journal of Applied Psychology,
73, 695-702.
Hershcovis, M. S., Turner, N., Barling, J., Arnold, K. A., Dupré, K. E., Inness, M.,
LeBlanc, M. M., & Sivanathan, N. (2007). Predicting workplace aggression: A
meta-analysis. Journal of Applied Psychology, 92, 228-238.
Herzog, W., Boomsma, A., & Reinecke, S. (2005). The finite sample behavior of Satorra
Bentler and Bartlett-corrected fit statistics in large models. International Meeting
of the Psychometric Society, Tilburg, The Netherlands.
Hinkin, T. R. (1995). A review of scale development practices in the study of
organizations. Journal of Management, 21, 967-988.
Hinkin, T. R. (1998). A brief tutorial on the development of measures for use in survey
questionnaires. Organizational Research Methods, 1, 104-121.
Hofstede, G. (1980). Culture’s consequences. Beverly Hills, CA: Sage.
Hogan, R. (2006). Personality and the fate of organizations. Hillsdale, NJ: Erlbaum.
Hogan, R., & Hogan, J. (1995). Hogan Personality Inventory manual (2nd ed). Tulsa,
Oklahoma: Hogan Assessment Systems.
Hogan, R. & Kaiser, R. B. (2005). What we know about leadership. Review of General
Psychology, 9, 169-180.
Hollinger, R. C. & Clark, J. P. (1983). Deterrence in the workplace: Perceived certainty,
perceived severity, and employee theft. Social Forces, 62, 398-418.
107

Holtfreter, K. (2005). Is occupational fraud “typical” white collar crime? A comparison
of individual and organizational characteristics. Journal of Criminal Justice, 33,
353-365.
Hom, P. W., Griffeth, R. W., & Sellaro, C. L. (1984). The validity of Mobley’s (1977)
model of employee turnover. Organizational Behavior & Human Performance,
34, 141-174.
Hoobler, J. M. & Brass, D. J. (2006). Abusive supervision and family undermining as
displaced aggression. Journal of Applied Psychology, 91, 1125-1133.
House, R. J. & Howell, J. M. (1992). Personality and charismatic leadership. Leadership
Quarterly, 3, 81-108.
Howard, J. L. (2001). Workplace violence in organizations: An exploratory study of
organizational prevention techniques. Employee Responsibilities and Rights
Journal, 13, 57-75.
Howell, J. M. & Avolio, B. J. (1993). Transformational leadership, transactional
leadership, locus of control, and support for innovation: Key predictors of
consolidated-business-unit performance. Journal of Applied Psychology, 78, 891-
902.
Ilies, R., Nahrgang, J. D., Morgeson, F. P. (2007). Leader-member exchange and
citizenship behavior: A meta-analysis. Journal of Applied Psychology, 92, 269-
277.
Inness, M., Barling, J., & Turner, N. (2005). Understanding supervisor-targeted
aggression: A within-person, between-jobs design. Journal of Applied
Psychology, 90, 731–739.
108
Isaac, R. G., Zerbe, W. J., & Pitt, D. C. (2001). Leadership and motivation: The effective
application of expectancy theory. Journal of Managerial Issues, 13, 212-226.
Jöreskog, K. G. & Sörbom, D. (2007). LISREL 8.8. Chicago: Scientific Software
International.
Judge, T. A. & Colquitt, J. A. (2004). Organizational justice and stress: The mediating
role of work-family conflict. Journal of Applied Psychology, 89, 395-404.
Judge, T. A. & Piccolo, R. F. (2004). Transformational and transactional leadership: A
meta-analytic test of their relative validity. Journal of Applied Psychology, 89,
755-768.
Judge, T. A., Piccolo, R. F., & Ilies, R. (2004). The forgotten ones? The validity of
consideration and initiating structure in leadership research. Journal of Applied
Psychology, 89, 36-51.
Judge, T., Scott, B. A., & Ilies, R. (2006). Hostility, job attitudes, and workplace
deviance: Test of a multilevel model. Journal of Applied Psychology, 91, 126–
138.
Keashley, L. (1998). Emotional abuse in the workplace: Conceptual and empirical
issues. Journal of Emotional Abuse, 1, 85-117.
Keller, R. T. (2006). Transformational leadership, initiating structure, and substitutes for
leadership: A longitudinal study of research and development project team
performance. Journal of Applied Psychology, 91, 202-210.
Kellerman, B. (2004). Bad leadership: What it is, how it happens, why it matters. Boston:
Harvard Business School Press.
109

Kelloway, E. K., Sivanathan, N., Francis, L., & Barling, J. (2005). Poor leadership. In J.
Barling, E. K. Kelloway, & M. R. Frone (Eds.), Handbook of work stress.
Thousand Oaks: Sage Publications.
Kelloway, E. K., Mullen, J., & Francis, L. (2006). Divergent effects of transformational
and passive leadership on employee safety. Journal of Occupational Health
Psychology, 11, 76−86.
Kim, H. & Yukl, G. (1995). Relationships of managerial effectiveness and advancement
to self-report and subordinate-reported leadership behaviors from the multiple
linkage mode. Leadership Quarterly, 6, 361-377.
Kruskal, K. B. (1964). Multidimensional scaling by optimizing goodness of fit to a non-
metric hypothesis. Psychometrika, 29, 1-27.
Kruskal, K. B. & Wish, M. (1978). Nonmetric multidimensional scaling. Beverly Hills,
CA: Sage.
Lamertz, K. & Aquino, K. (2004). Social power, social status and perceptual similarity
of workplace victimization: A social network analysis of stratification. Human
Relations, 57, 795-822.
Landau, J. & Hammer, T. H. (1986). Clinical employees’ perceptions of
intraorganizational career opportunities. Academy of Management Journal, 29,
385-404.
Larwood, L., Wright, T. A., Desrochers, S., & Dahir, V. (1998). Extending latent role
and psychological contract theories to predict intent to turnover and politics in
business organizations. Group & Organization Management, 23, 100-123.
110

Lee, K., & Allen, N. J. (2002). Organizational citizenship behavior and workplace
deviance: The role of affect and cognitions. Journal of Applied Psychology, 87,
131–142.
Lewin, K., Lippit, R., & White, R. K. (1939). Patterns of aggressive behavior in
experimentally created “social climates.” Journal of Social Psychology, 10, 271-
299.
Leymann, H. (1996). The content and development of mobbing at work. European
Journal of Work and Organizational Psychology, 10, 165−184.
Liao, H., Joshi, A., & Chuang, A. (2004). Sticking out like a sore thumb: Employee
dissimilarity and deviance at work. Personnel Psychology, 57, 969-1000.
Lieberson, S. & O’Connor, J. F. (1972). Leadership and organizational performance: A
study of large corporations. American Sociological Review, 37, 117-130.
Lim, S. & Cortina, L. M. (2005). Interpersonal mistreatment in the workplace: The
interface and impact of general incivility and sexual harassment. Journal of
Applied Psychology, 90, 483-496.
Lim, S., Cortina, L. M., & Magley, V. J. (2008). Personal and workgroup incivility:
Impact on work and health outcomes. Journal of Applied Psychology, 93, 95-107.
Lloyd, K. (2006). Jerks at work. New York: Barnes and Noble.
Lord, R. G., De Vader, C. L., & Alliger, G. M. (1986). A meta-analysis of the relation
between personality traits and leadership perceptions: An application of validity
generalization procedures. Journal of Applied Psychology, 71, 402-410.
111

Lowe, K. B., Kroeck, K. G., & Sivasubramaniam, N. (1996). Effectiveness correlates of
transformation and transactional leadership: A meta-analytic review of the MLQ
literature. Leadership Quarterly, 7, 385-425.
Lutgen-Sandvik, P., Tracy, S. J., & Alberts, J. K. (2007). Burned by bullying in the
American workplace: Prevalence, perception, degree, and impact. Journal of
Management Studies, 44, 837-862.
Luthans, F., Peterson, S. J., & Ibrayeva, E. (1998). The potential for the “dark side” of
leadership in post-communist countries. Journal of World Business, 33, 185-201.
Martinko, M. J., Gundlach, M. J., & Douglas, S. C. (2002). Toward and integrative
theory of counterproductive workplace behavior: A causal reasoning perspective.
International Journal of Selection and Assessment, 10, 36-50.
McAllister, D. J. (1995). Affect- and cognition-based trust as foundations for
interpersonal cooperation in organizations. Academy of Management Journal, 38,
24-59.
Mitchell, M. S. & Ambrose, M. L. (2007). Abusive supervision and workplace deviance
and the moderating effects of negative reciprocity beliefs. Journal of Applied
Psychology, 92, 1159-1168.
Mount, M., Ilies, R., & Johnson, E. (2006). Relationship of personality traits and
counterproductive work behaviors: The mediating effects of job satisfaction.
Personnel Psychology, 59, 591-622.
Neuman, J. H. & Baron, R. A. (1998). Workplace violence and workplace aggression:
Evidence concerning specific forms, potential causes, and preferred targets.
Journal of Management, 24, 391-419.
112

Neuman, J. H., & Baron, R. A. (2005). Aggression in the workplace: A social–
psychological perspective. In S. Fox & P. E. Spector (Eds.),
Counterproductive work behavior: Investigations of actors and targets (pp. 13-
40). Washington, DC: American Psychological Association.
Nunnally, J. C. (1978). Psychometric theory (2nd ed.). New York: McGraw-Hill.
Nutt, P. C. (1999). Surprising but true: Half the decisions in organizations fail. Academy
of Management Executive, 13, 75-90.
Nutt, P. C. (2004). Expanding the search for alternatives during strategic decision
making. Academy of Management Executive, 18, 13-28.
O’Brien, K. E. & Allen, T. D. (2008). The relative importance of correlates of
organizational citizenship behavior and counterproductive work behavior using
multiple sources of data. Human Performance, 21, 62-88.
O’Connor, J., Mumford, M. D., Clifton, T. C., Gessner, T. L., & Connelly, M. S. (1995).
Charismatic leaders and destructiveness: A histriometric study. Leadership
Quarterly, 6, 529-555.
Ones, D. S., & Viswesvaran, C. (2001). Integrity tests and other criterion-focused
occupational personality scales (COPS) used in personnel selection. International
Journal of Selection and Assessment, 9, 31–39.
Padilla, A., Hogan, R., & Kaiser, R. B. (2007). The toxic triangle: Destructive leaders,
susceptible followers, and conducive environments. Leadership Quarterly, 18,
176-194.
Pearson, C. M., Andersson, L. M., & Porath, C. L. (2000). Assessing and attacking
workplace incivility. Organizational Dynamics, 29, 123-137.
113

Pearson, C. M., Andersson, L. M., & Porath, C. L. (2005). Workplace incivility. In S.
Fox & P. E. Spector (Eds.), Counterproductive work behavior: Investigations of
actors and targets (pp. 177-200). Washington, DC: American Psychological
Association.
Pearson, C. M., Andersson, L. M., & Wegner, J. A. (2001). When workers flout
convention: A preliminary study of workplace incivility. Human Relations, 54,
1387-1420.
Penney, L. M., & Spector, P. E. (2002). Narcissism and counterproductive work
behavior: Do bigger egos mean bigger problems? International Journal of
Selection and Assessment, 10, 126–134.
Penney, L. M. & Spector, P. E. (2005). Job stress, incivility, and counterproductive work
behavior (CWB): The moderating role of negative affectivity. Journal of
Organizational Behavior, 26, 777-796.
Peter, L. J. & Hull, R. (1996). The Peter Principle. In J. Billsberry (Ed.), The effective
manager: Perspectives and illustrations (pp. 209-213). Thousand Oaks, CA:
Sage Publications, Inc.
Pillai, R. & Williams, E. A. (2004). Transformational leadership, self-efficacy, group
cohesiveness, commitment, and performance. Journal of Organizational Change
Management, 17, 144-159.
Podsakoff, P. M., Bommer, W. H., Podsakoff, N. P., & MacKenzie, S. B. (2006).
Relationships between leader reward and punishment behavior and subordinate
attitudes, perceptions, and behaviors: A meta-analytic review of existing and new
research. Organizational Behavior and Human Decision Processes, 99, 113-142.
114
Podsakoff, P. M., MacKenzie, S. B., & Bommer, W. H. (1996). Meta-analysis of the
relationships between Kerr and Jermier’s substitutes for leadership and employee
job attitudes, role perceptions, and performance. Journal of Applied Psychology,
81, 380-399.
Podsakoff, P. M., Niehoff, B. P., MacKenzie, S. B., & Williams, M. L. (1993). Do
substitutes for leadership really substitute for leadership? An empirical
examination of Kerr and Jermier’s situational leadership model. Organizational
Behavior and Human Decision Processes, 54, 1-44.
Podsakoff, P. M., Todor, W. D., Grover, R. A., & Huber, V. L. (1984). Situation
modifiers of leader reward and punishment behaviors: Fact or fiction?
Organizational Behavior and Human Performance, 34, 21-63.
Popper, M. (2002). Narcissism and attachment patterns of personalized and socialized
charismatic leaders. Journal of Social and Personal Relationships, 19, 797-809.
Rayner, C. & Keashly, L. (2005). Bullying at work: Escalated conflicts in organizations.
In S. Fox & P. E. Spector (Eds.), Counterproductive work behavior:
Investigations of actors and targets (pp. 271-296). Washington, DC: American
Psychological Association.
Rhoades, L. & Eisenberger, R. (2002). Perceived organizational support: A review of
the literature. Journal of Applied Psychology, 87, 698-714.
Robinson, S. L. & Bennett, R. J. (1995). A typology of deviant workplace behaviors: A
multidimensional scaling study. Academy of Management Journal, 38, 555-572.
115

Rotundo, M., Nguyen, D. H., & Sackett, P. R. (2001). A meta-analytic review of gender
differences in perceptions of sexual harassment. Journal of Applied Psychology,
86, 914-922.
Sackett, P. R. (2002). The structure of counterproductive work behaviors:
Dimensionality and relationships with facets of job performance. International
Journal of Selection and Assessment, 10, 5-11.
Sackett, P. R., Berry, C. M., Wiemann, S. A., & Laczo, R. M. (2006). Citizenship and
counterproductive behavior: Clarifying relations between the two domains.
Human Performance, 19, 441-464.
Sackett, P. R. & DeVore, C. J. (2002). Counterproductive behaviors at work. In N.
Anderson, D. S. Ones, H. K. Sinangil, & D. Viswesvaran (Eds.), Handbook of
industrial, work and organizational psychology (Vol. 1) (pp. 145-164). Thousand
Oaks, CA: Sage Publications.
Salancik, G. H., & Pfeffer, J. (1977). Constraints on administrator discretion: The limited
influence of mayors on city budgets. Urban Affairs Quarterly, 12, 475-498.
Salgado, J. F. (2002). The Big Five personality dimensions and counterproductive
behaviors. International Journal of Selection and Assessment, 10, 117–125.
Santos, G. J. (2006). Card sorting technique as a qualitative substitute for quantitative
exploratory factor analysis. Corporate Communications: An International
Journal, 11, 288-302.
Satorra, A., & Bentler, P. M. (2001). A scaled difference chi-square test statistic for
moment structure analysis, Psychometrika, 66, 507-514.
116

Scalora, M. J., Washington, D. O., Casady, T., & Newell, S. P. (2003). Nonfatal
workplace violence risk factors: Data from a police contact sample. Journal of
Interpersonal Violence, 18, 310-327.
Schaubroeck, J., Lam, S. S. K., & Cha, S. E. (2007). Embracing transformational
leadership: Team values and the impact of leader behavior on team performance.
Journal of Applied Psychology, 92, 1020-1030.
Shepard, R. N. (1972). Introduction to Volume I. In R. N. Shepard, A. K. Romney, & S.
B. Nerlove (Eds.), Multidimensional scaling, Vol. 1. New York: Seminar.
Skogstad, A., Einarsen, S., Torsheim, T., Aasland, M. S., & Hetland, H. (2007). The
destructiveness of laissez-faire leadership behavior. Journal of Occupational
Health Psychology, 12, 80-92.
Snell, W. E., McDonald, K., & Koch, W. R. (1991). Anger provoking experiences: A
multidimensional scaling analysis. Personality and Individual Differences, 12,
1095-1104.
Spector, P. E. & Fox, S. (2005). The stressor-emotion model of counterproductive work
behavior. In S. Fox & P. E. Spector (Eds.), Counterproductive work behavior:
Investigations of actors and targets (pp. 151-174). Washington, DC: American
Psychological Association.
Spector, P. E., Fox, S., Penney, L. M., Bruursema, K., Goh, A., & Kessler, S. (2006).
The dimensionality of counterproductivity: Are all counterproductive behaviors
created equal? Journal of Vocational Behavior, 68, 446-460.
Sutherland, E.H. (1949). White-collar crime. New Haven, CT: Yale University Press.
117

Szockyj, E. & Geis, G. (2002). Insider trading patterns and analysis. Journal of
Criminal Justice, 30, 273-286.
Tepper, B. J. (2000). Consequences of abusive supervision. Academy of Management
Journal, 43, 178-190.
Tepper, B., Duffy, M., Henle, C., & Lambert, L. (2006). Procedural injustice, victim
precipitation, and abusive supervision. Personnel Psychology, 59, 101−123.
Tepper, B., Duffy, M., & Shaw, J. (2001). Personality moderators of the relationship
between abusive supervision and subordinates' resistance. Journal of Applied
Psychology, 86, 974−983.
Tepper, B. J., Henle, C. A., Lambert, L. S., Giacalone, R. A., & Duffy, M. K. (2007).
Abusive supervision and subordinates’ organization deviance. Journal of Applied
Psychology, 93, 721-732.
Thomas, A. B. (1988). Does leadership make a difference to organizational performance?
Administrative Science Quarterly, 33, 388-400.
Tsogo, L., Masson, M. H., & Bardot, A. (2000). Multidimensional scaling methods for
many-object sets: A review. Multivariate Behavioral Research, 35, 307-319.
Tullis, T. & Wood, L. E. (2004). How many users are enough for a card-sorting study?
Poster presented at the annual meeting of the Usability Professionals Association,
Minneapolis, MN.
Tzelgov, J. & Henik, A. (1991). Suppression situations in psychological research:
Definitions, implications, and applications. Psychological Bulletin, 109, 524-536.
Vardi, Y. & Wiener, Y. (1996). Misbehavior in organizations: A motivational
framework. Organization Science, 7, 151-165.
118
Vartia, M. (2001). Consequences of workplace bullying with respect to the well-being of
its targets and the observers of bullying. Scandinavian Journal of Work,
Environment & Health, 27, 63-69.
Vroom, V. (1964). Work and Motivation. New York, NY: Wiley.
Walumbwa, F. O., Avolio, B. J., Gardner, W. L., Wernsing, T. S., & Peterson, S. J.
(2008). Authentic leadership: Development and validation of a theory-based
measure. Journal of Management, 34, 89-126.
Wanek, J. E., Sackett, P. R., & Ones, D. S. (2003). Towards an understanding of
integrity test similarities and differences: An item-level analysis of seven tests.
Personnel Psychology, 56, 873-894.
Weinberg, S. L. (1991). An introduction to multidimensional scaling. Measurement &
Evaluation in Counseling and Development, 24, 12-25.
Whittington, J. L., Goodwin, V. L., & Murray, B. (2004). Transformational leadership,
goal difficulty, and job design: Independent and interactive effects on employee
outcomes. Leadership Quarterly, 15, 593-606.
Willness, C. R., Steel, P., & Lee, K. (2007). A meta-analysis of the antecedents and
consequences of workplace sexual harassment. Personnel Psychology, 60,
127-162.
Zapf, D. & Einarsen, S. (2005). Mobbing at work: Escalated conflicts in organizations.
In S. Fox & P. E. Spector (Eds.), Counterproductive work behavior:
Investigations of actors and targets (pp. 237-270). Washington, DC: American
Psychological Association.
119

Zellars, K., Tepper, B., & Duffy, M. (2002). Abusive supervision and subordinates'
organizational citizenship behavior. Journal of Applied Psychology, 87,
1068−1076.
120

Appendix: Tables and Figures
Table 1
Neuman and Baron’s (2005) behavioral examples of aggression based on Buss’s (1961) dimensions Dimensions Behavioral Examples Physical, active, and direct Nonfatal assaults
Making hostile gestures Physical, active, and indirect Theft
Destruction of resources needed by others Physical, passive, and direct Intentionally slowing down work
Refusing to provide needed resources Physical, passive, and indirect Failing to protect a target’s welfare
Denying a raise without reason Verbal, active, and direct Making threats and insults
Yelling at a target Verbal, active, and indirect Taking credit for others’ work
Spreading rumors Verbal, passive, and direct Giving the silent treatment
Refusing requests Verbal, passive, and indirect Failing to defend a target
Failing to provide a target with needed feedback
121

122
Table 2
Sample characteristics for Study 1
Characteristic Personal Contacts &
Program Alumni (N=97)
Undergraduates (N=113)
Age Mean 38.97 20.05 SD 10.93 1.90 Gender Male 51.1% 31.6% Female 48.9% 68.4% Ethnicity African-American 2.2% 5.1% American Indian - 1.3% Asian 5.5% 6.3% Caucasian 90.1% 77.2% Hispanic 2.2% 5.1% Other - 5.1% Years Worked Mean 19.65 - SD 11.59 - Years at Current Position Mean 4.97 1.86 SD 6.19 1.99 Hours Worked/Week Mean 41.29 23.63 SD 11.93 12.69 Industry of Work Healthcare 6.7% 4.2% Manufacturing 2.2% 4.2% Government 16.9% 5.6% Agriculture, Mining, or Construction 2.2% 4.2% Trade 6.7% 18.1% Transportation & Utilities 3.4% - Information 9.0% 4.2% Finance Activities 5.6% 2.8% Professional & Business Services 20.2% 4.2% Education 24.7% 12.5% Leisure & Hospitality 2.2% 40.3%

Table 3 List of negative leader behaviors generated in Study 1
Accepts financial kick-backs Fails to act on reports of sexual
misconduct of subordinates Leaves accidents/mistakes for others to clean up
*Sends signals or hints that subordinates should quit their job
Asks for sexual favors in return for preferential treatment
Fails to defend subordinates from attacks by others
Leaves own work for others to complete
Shows no clear standards for administering rewards and punishments
Assigns demeaning tasks *Fails to give subordinates credit for jobs requiring a lot of effort
Lets violations of company policy slide
*Spends too much time on non-work activities while at work
Avoids addressing important issues Fails to help subordinates when they need it
Lies Steals company funds
Belittles others behind their backs Fails to protect subordinates' welfare/personal safety
*Litters the work environment Steals company property/resources
Breaks the law while at work Fails to set goals for subordinates *Looks through subordinates' private mail/property without permission
Steals from subordinates
Brings inappropriate material to work (e.g., pornography)
Falsely accuses or punishes subordinates for something they were not responsible for
Makes inappropriate comments of a sexual nature to others
Subverts subordinates' authority
Creates tension/conflict among subordinates
Falsifies documents (e.g., expense reports, billable hours)
Makes inappropriate physical contact Swears at subordinates
Damages company property *Flaunts his/her status over subordinates in a condescending manner
Makes jokes at the expense of others Takes credit for others' work
*Demeans subordinates Flip flops on decisions *Makes obscene gestures (e.g., the finger) to subordinates
*Tells people outside the job what a lousy place he works for
Denies subordinates of things they are entitled to (e.g., lunch breaks, vacation time)
*Forges documents Makes offensive remarks Tells subordinates they are doing a good job and then gives them poor evaluations
*Disciplines for poor performance or rule infractions more than he praises good performance
Gives more rewards or punishments to some than others for the same work
Makes subordinates help the leader with a personal issue of his
Tells subordinates to do something and then criticizes them for their actions
123
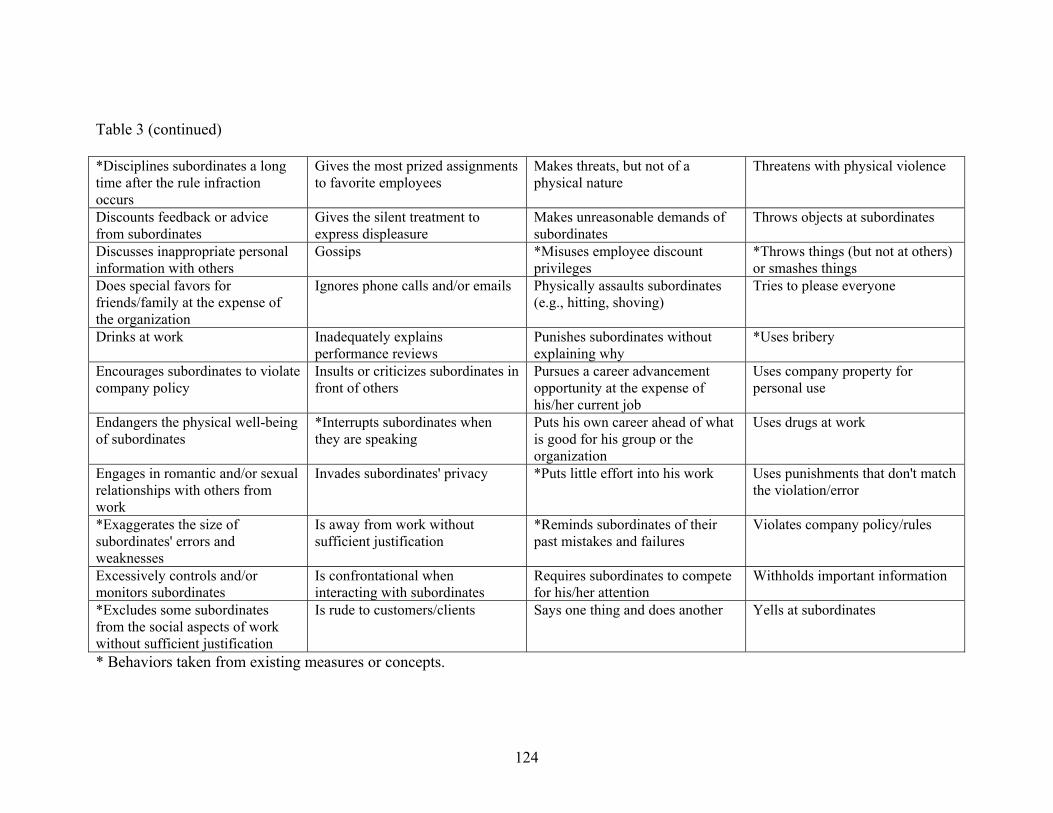
124
Table 3 (continued)
*Disciplines subordinates a long time after the rule infraction occurs
Gives the most prized assignments to favorite employees
Makes threats, but not of a physical nature
Threatens with physical violence
Discounts feedback or advice from subordinates
Gives the silent treatment to express displeasure
Makes unreasonable demands of subordinates
Throws objects at subordinates
Discusses inappropriate personal information with others
Gossips *Misuses employee discount privileges
*Throws things (but not at others) or smashes things
Does special favors for friends/family at the expense of the organization
Ignores phone calls and/or emails Physically assaults subordinates (e.g., hitting, shoving)
Tries to please everyone
Drinks at work Inadequately explains performance reviews
Punishes subordinates without explaining why
*Uses bribery
Encourages subordinates to violate company policy
Insults or criticizes subordinates in front of others
Pursues a career advancement opportunity at the expense of his/her current job
Uses company property for personal use
Endangers the physical well-being of subordinates
*Interrupts subordinates when they are speaking
Puts his own career ahead of what is good for his group or the organization
Uses drugs at work
Engages in romantic and/or sexual relationships with others from work
Invades subordinates' privacy *Puts little effort into his work Uses punishments that don't match the violation/error
*Exaggerates the size of subordinates' errors and weaknesses
Is away from work without sufficient justification
*Reminds subordinates of their past mistakes and failures
Violates company policy/rules
Excessively controls and/or monitors subordinates
Is confrontational when interacting with subordinates
Requires subordinates to compete for his/her attention
Withholds important information
*Excludes some subordinates from the social aspects of work without sufficient justification
Is rude to customers/clients Says one thing and does another Yells at subordinates
* Behaviors taken from existing measures or concepts.

Table 4
Stress values associated with dimensions 1 through 6
Number of Dimensions Stress Value Reduction in Stress
Value 1 .3013 2 .1617 .1396 3 .1091 .0526 4 .0895 .0196 5 .0720 .0175 6 .0605 .0115
125

Table 5 Behavior-dimension scores for the three-dimensional solution
Behavior Dimension 1
Score Dimension 2
Score Dimension 3
Score Accepts financial kickbacks 2.30 -1.16 -0.82 Asks for sexual favors in return for preferential treatment 0.77 -2.05 0.08
Assigns demeaning tasks -1.51 -0.05 -0.13 Avoids addressing important issues -0.52 1.91 0.07 Belittles others behind their backs -0.68 -0.26 1.09 Breaks the law while at work 2.26 -0.82 -1.07 Brings inappropriate material to work (e.g., pornography) 0.67 -0.70 1.64
Creates tension/conflict among subordinates -1.27 0.10 0.04 Damages company property 2.53 -0.57 -0.55 Demeans subordinates -1.22 -0.49 0.20 Denies subordinates of things they are entitled to (e.g., lunch breaks, vacation time) -0.69 -0.48 -0.46
Disciplines for poor performance or rule infractions more than he praises good performance
-1.41 0.55 -0.36
Disciplines subordinates a long time after the rule infraction occurs -1.45 0.40 -0.59
Discounts feedback or advice from subordinates -1.15 0.36 0.28 Discusses inappropriate personal information with others -0.33 -0.41 1.34
Does special favors for friends/family at the expense of the organization 1.76 0.67 -0.72
Drinks at work 1.81 -0.01 1.13 Encourages subordinates to violate policy 0.96 -0.18 -1.28 Endangers the physical well-being of subordinates 0.02 -1.08 -0.98
Engages in romantic and/or sexual relationships with others from work 0.42 -0.72 1.62
Exaggerates the size of subordinates' errors and weaknesses -1.30 0.00 0.28
Excessively controls and/or monitors subordinates -1.40 0.11 -0.29
Excludes some subordinates from the social aspects of work without sufficient justification -1.37 0.11 -0.05
Fails to act on reports of sexual misconduct of subordinates 0.13 -1.13 -0.31
Fails to defend subordinates from attacks by others -1.13 -0.20 -0.46
Fails to give subordinates credit for jobs requiring a lot of effort -1.47 0.47 -0.42
Fails to help subordinates when they need it -1.11 0.49 -0.21
126

Table 5 (continued)
Behavior Dimension 1 Score
Dimension 2 Score
Dimension 3 Score
Fails to protect subordinates' welfare/personal safety -0.57 -0.29 -1.03
Fails to set goals for subordinates -1.26 0.38 -0.74 Falsely accuses or punishes subordinates for something they were not responsible for -0.94 -0.42 -0.55
Falsifies documents 2.31 -0.93 -0.89 Flaunts his/her status over subordinates in a condescending manner -1.30 0.14 0.34
Flip flops on decisions -0.79 1.63 -0.16 Forges documents 2.16 -1.07 -0.84 Gives more rewards or punishments to some than others for the same work -1.44 0.39 -0.07
Gives the most prized assignments to favorite employees -1.35 0.37 -0.37
Gives the silent treatment to express displeasure -1.02 0.03 0.76
Gossips -0.57 0.15 1.41 Ignores phone calls and/or emails 0.68 1.22 0.84 Inadequately explains performance reviews -1.16 0.74 -1.07 Insults or criticizes subordinates in front of others -1.23 -0.51 0.34
Interrupts subordinates when they are speaking -1.30 -0.22 0.36
Invades subordinates' privacy -0.89 -0.45 0.46 Is away from work without sufficient justification 1.83 1.25 0.00
Is confrontational when interacting with subordinates -1.29 -0.55 0.24
Is rude to customers/clients 0.69 0.77 1.31 Leaves accidents/mistakes for others to clean up 0.11 0.94 0.75
Leaves own work for others to complete 0.05 1.35 0.17 Lets violations of company policy slide 1.30 0.79 -1.16 Lies 1.80 0.17 1.02 Litters the work environment 2.03 0.54 0.97 Looks through subordinates' private mail/property without permission -0.31 -0.72 -0.32
Makes inappropriate comments of a sexual nature to others 0.01 -1.05 1.52
Makes inappropriate physical contact 0.19 -1.63 0.83 Makes jokes at the expense of others -0.73 0.10 1.16 Makes obscene gestures (e.g., the finger) to subordinates -0.48 -1.26 0.58
Makes offensive remarks 0.34 -0.24 1.38
127

Table 5 (continued)
Behavior Dimension 1 Score
Dimension 2 Score
Dimension 3 Score
Makes subordinates help the leader with a personal issue of his -0.86 -0.46 -0.29
Makes threats, but not of a physical nature -1.12 -0.42 0.06 Makes unreasonable demands of subordinates -1.28 -0.23 0.02 Misuses employee discount privileges 2.33 0.15 -0.44 Physically assaults subordinates (e.g., hitting, shoving) 0.26 -1.85 -0.65
Punishes subordinates without explaining why -1.33 0.27 -0.42 Pursues a career advancement opportunity at the expense of his/her current job 1.60 1.40 -0.28
Puts his own career ahead of what is good for his group or the organization 1.20 1.40 -0.54
Puts little effort into his work 1.27 1.81 0.47 Reminds subordinates of their past mistakes and failures -1.28 -0.20 0.08
Requires subordinates to compete for his/her attention -1.20 0.24 -0.37
Says one thing and does another -0.05 1.60 0.24 Sends signals or hints that subordinates should quit their job -1.29 -0.28 0.04
Shows no clear standards for administering rewards and punishments -1.44 0.71 -0.46
Spends too much time on non-work activities while at work 1.76 1.47 0.01
Steals company funds 2.48 -0.99 -0.97 Steals company property and resources 2.49 -0.94 -0.96 Steals from subordinates 1.22 -1.10 -0.58 Subverts subordinates' authority -1.17 -0.11 -0.39 Swears at subordinates -1.14 -0.42 0.18 Takes credit for others' work -0.01 0.65 0.23 Tells people outside the job what a lousy place he works for 0.92 0.91 1.14
Tells subordinates they are doing a good job and then gives them poor evaluations -1.27 0.21 -0.51
Tells subordinates to do something and then criticizes them for their actions -1.28 0.19 -0.49
Threatens with physical violence 0.51 -1.62 -0.44 Throws objects at subordinates -0.07 -1.86 -0.54 Throws things (but not at others) or smashes things 1.65 -0.22 0.96
Tries to please everyone 0.17 2.12 0.16 Uses bribery 1.67 -0.82 -0.63 Uses company property for personal use 1.94 0.36 -1.11 Uses drugs at work 2.13 -0.54 0.78
128

129
Table 5 (continued)
Behavior Dimension 1 Score
Dimension 2 Score
Dimension 3 Score
Uses punishments that don't match the violation/error -1.36 0.55 -0.11
Violates company policy/rules 1.73 1.15 -0.52 Withholds important information -0.44 0.95 0.04 Yells at subordinates -1.19 -0.56 -0.02

Table 6 Behaviors included in the eight negative leader behavior categories
Organization Directed Subordinate Directed
Insidiously-Damaging Immediately-Damaging Insidiously-Damaging Immediately-Damaging Norm-Violating Rule-Violating Norm-Violating Rule-Violating Norm-Violating Rule-Violating Norm-Violating Rule-Violating Ignores phone calls/email Is away from work without sufficient justification Is rude to customers/clients Leaves accidents/mistakes for others to clean up Leaves own work for others to complete Lies Litters the work environment Puts little effort into his work Spends too much time on non-work activities while at work
Does special favors for friends/family at the expense of the organization Lets violations of company policy slide Misuses employee discount privileges Pursues a career advancement opportunity at the expense of his/her current job Puts his own career ahead of what is good for his group or the organization Uses company property for personal use
Asks for sexual favors in return for preferential treatment Brings inappropriate material to work (e.g., pornography) Drinks at work Engages in romantic and/or sexual relationships with others from work Makes inappropriate comments of a sexual nature to others Makes inappropriate physical contact Makes offensive remarks
Accepts financial kickbacks Breaks the law while at work Damages company property Encourages subordinates to violate policy Endangers the physical well-being of subordinates Fails to act on reports of sexual misconduct of subordinates Falsifies documents Forges documents
Avoids addressing important issues Creates tension/conflict among subordinates Discounts feedback or advice from subordinates Flaunts his/her status over subordinates in a condescending manner Gives the silent treatment to exp- ress displeasure Gossips Makes jokes at the expense of others Says one thing and does another
Disciplines for poor performan- ce or rule infract- ions more than he praises good performance Disciplines subordinates a long time after the rule infract- ion occurs Excessively controls/monit- ors subordinates Excludes some subordinates from the social aspects of work without sufficie- nt justification Fails to give sub- ordinates credit for jobs requiring a lot of effort Fails to help sub- ordinates when they need it
Belittles others behind their backs Demeans subordinates Discusses inappropriate personal inform- ation with others Exaggerates the size of subord- inates' errors and weaknesses Insults or criticizes subordinates in front of others Interrupts subordinates when they are speaking Invades subordinates' privacy
Assigns demean- ing tasks Denies sub- ordinates of things they are entitled to (e.g., lunch breaks, vacation time) Fails to defend subordinates from attacks by others Fails to protect subordinates' welfare/personal safety Falsely accuses or punishes subordinates for something they were not respon- sible for Looks through subordinates' private mail/ property without permission
130

Table 6 (continued)
Organization Directed Subordinate Directed Insidiously-Damaging Immediately-Damaging Insidiously-Damaging Immediately-Damaging
Norm-Violating Rule-Violating Norm-Violating Rule-Violating Norm-Violating Rule-Violating Norm-Violating Rule-Violating Tells people outside the job what a lousy place he works for Tries to please everyone
Violates company policy/rules
Throws things (but not at others) or smashes things Uses drugs at work
Physically assaults subordinates (e.g., hitting, shoving) Steals company funds Steals company property and resources Steals from subordinates Threatens with physical violence Uses bribery
Takes credit for other’s work Withholds important information
Fails to set goals for subordinates Flip flops on decisions Gives more rew- ards or punish-ments to some than others for the same work Gives the most prized assign- ments to favorite employees Inadequately explains perf-ormance reviews Punishes subord-inates without explaining why Requires subordinates to compete for his/her attention Shows no clear standards for administering rewards and punishments
Is confrontation-al when interacting with subordinates Makes obscene gestures (e.g., middle finger) to subordinates Makes threats, but not of a phy-sical nature Makes unreas-onable demands of subordinates Reminds sub-ordinates of their past mist-akes and failures Sends signals or hints that subordinates should quit their job Swears at subordinates
Makes subordin- ates help the leader with a personal issue of his Subverts subord- inates' authority Throws objects at subordinates Yells at Subordinates
131

132
Table 6 (continued)
Organization Directed Subordinate Directed Insidiously-Damaging Immediately-Damaging Insidiously-Damaging Immediately-Damaging
Norm-Violating Rule-Violating Norm-Violating Rule-Violating Norm-Violating Rule-Violating Norm-Violating Rule-Violating Tells sub-
ordinates they are doing a good job and then gives them poor evaluations Tells subordin-ates to do some-thing and then criticizes them for their actions Uses punish- ments that don't match the violation/error

Table 7 40-item measure of negative leader behavior created in Study 2
Ignores phone calls and/or email Is rude to customers/clients Litters the work environment Puts little effort into his/her work Tells people outside the job what a lousy place he/she works for Does special favors for friends/family at the expense of the organization Lets violations of company policy slide Puts his/her own career ahead of what is good for his/her group or the organization Uses company property for personal use Violates company policy/rules aAt times appears to be under the influence of alcohol or recreational drugs while at work Brings inappropriate material to work (e.g., pornography) Engages in romantic and/or sexual relationships with others from work bHints that sexual favors will result in preferential treatment Throws things (but not at others) or smashes things Accepts financial kickbacks Breaks the law while at work Falsifies documents Steals company funds Steals company property and resources Avoids addressing important issues Discounts feedback or advice from subordinates Gossips Makes jokes at the expense of others Says one thing and does another Disciplines subordinates a long time after the rule infraction occurs Fails to give subordinates credit for jobs requiring a lot of effort Fails to set goals for subordinates Inadequately explains performance reviews Shows no clear standards for administering rewards and punishments Discusses inappropriate personal information with others Insults or criticizes subordinates in front of others Invades subordinates’ privacy Is confrontational when interacting with subordinates Makes obscene gestures (e.g., the finger) to subordinates Denies subordinates of things they are entitle to (e.g., lunch breaks, vacation time) Fails to defend subordinates from attack by others Fails to protect subordinates’ welfare/personal safety Falsely accuses or punishes subordinates for something they were not responsible for Throws objects at subordinates
a Reworded from “Uses drugs at work” to make behavior more consistent with category b Reworded from “Asks for sexual favors in return for preferential treatment” to make behavior more consistent with category
133

134
Table 8 Results of dimension label-dimension score regression analysis
Outcome Dimension Label
Predictor Dimension 1 Scores
Dimension 2 Scores
Dimension 3 Scores
Malignant/Incompetent -.16 -.12 -.52** Organization-directed/Subordinate-directed
.25 -.24 .11
Physical/Verbal -.50** .00 .11 Serious/Not serious .15 .42 -.05 Violation of formal, clearly prescribed rules/Violation of less clear norms for behavior
.17 -.17 .40*
Note. Numbers represent standardized beta coefficients * p < .05 ** p < .01

Table 9 Mapping of previously studied constructs onto the eight negative leader behavior categories
Dimension 1 Dimension 2 Dimension 3 Factors/measures that map onto category Leader-specific constructs mapping onto category
Norm-Violating
Personalized leadership; Abuse (CWBC); Misuse of time and resources (G&S); NAQ; Organizational deviance (R&B); Sabotage (CWBC); Physical, passive, & direct (Buss); Poor attendance (G&S); Verbal, passive, & direct (Buss); Withdrawal (CWBC)
Personalized leadership Insidiously-
Damaging
Rule-Violating Theft (G&S) No
Norm-Violating
Abuse (CWBC); Alcohol use (G&S); Interpersonal deviance (R&B); Organizational deviance (R&B); Psychological aggression (WA); Verbal, active, & direct (Buss)
No Organization-Directed
Immediately-Damaging
Rule-Violating
Abuse (CWBC); Destruction of property (G&S); F&S; Inappropriate physical actions (G&S); Misuse of information (G&S); NAQ; Organizational deviance (R&B); Physical, active, & indirect (Buss); Sabotage (CWBC); Theft (CWBC); Theft (G&S); Unsafe behavior (G&S); Violence (WA)
No
Norm-Violating
Abusive supervision; Supervisor undermining; Discouraging initiative (PT); Forcing conflict resolution (PT); Personalized leadership; Ethical leadership; Laissez-faire; Abuse (CWBC); F&S; Interpersonal deviance (R&B); Misuse of information (G&S); NAQ; Physical, active, & indirect (Buss); Physical, passive, & direct (Buss); Psychological aggression (WA); Verbal, active, & indirect (Buss); Verbal, passive, & direct (Buss); Verbal, passive, & indirect (Buss)
Abusive supervision, Supervisor undermining, Petty tyranny, Personalized leadership, Ethical leadership, Laissez-faire leadership
Subordinate-Directed
Insidiously-Damaging
Rule-Violating
Abusive supervision; Arbitrariness & self-aggrandizement (PT); Non-contingent punishment (PT); Laissez-faire; MBE-Active; F&S; NAQ; Physical, passive, & direct (Buss); Verbal, active, & direct (Buss); Verbal, passive, & indirect (Buss)
Abusive supervision, Petty tyranny, Laissez-faire, Management-by-exception (Active)
135

136
Table 9 (continued)
Dimension 1 Dimension 2 Dimension 3 Factors/measures that map onto category Leader-specific constructs mapping onto category
Norm-Violating
Abusive supervision; Supervisor undermining; Belittling subordinates (PT); Abuse (CWBC); F&S; Inappropriate verbal actions (G&S); Interpersonal deviance (R&B); NAQ; Physical, active, & direct (Buss); Psychological aggression (WA); Verbal, active, & direct (Buss); Verbal, active, & indirect (Buss); Violence (WA)
Abusive supervision, Supervisor undermining, Petty tyranny Subordinate-
Directed Immediately-
Damaging
Rule-Violating
Supervisor undermining; Belittling subordinates (PT); Lack of consideration (PT); Abuse (CWBC); NAQ; Physical, active, & direct (Buss); Physical, active, & indirect (Buss); Physical, passive, & indirect (Buss); Psychological aggression (WA); Verbal, passive, indirect (Buss); Violence (WA)
Supervisor undermining, Petty tyranny
Note. Abusive supervision = Tepper’s (2000) measure; Buss = Buss’s (1961) typology of aggressive behaviors, using the behaviors applied to work by Neuman and Baron (2005); CWBC = Counterproductive Work Behavior Checklist (Fox & Spector, 2002); Ethical leadership = Brown, Treviño, and Harrison’s (2005) measure; F&S = Fox and Stallworth (2005); G&S = Gruys and Sackett (2003); Laissez-faire and MBE-Active items taken from example MLQ (Bass & Avolio, 1990) items; NAQ = Negative Acts Questionnaire (Einarsen & Hoel, 2001); Personalized leadership = Popper’s (2002) measure; PT = Petty tyranny (Ashforth, 1987); R&B = Bennett and Robinson (2000); Supervisor undermining = Duffy, Ganster, & Pagon (2002); WA = Strauss’s (1979) workplace aggression measure

Table 10
Sample characteristics for Study 3
Characteristic Statistic Age Mean 39.67 SD 13.65 Gender Male 33.2% Female 65.6% Ethnicity African-American 1.7% American Indian 0.5% Asian 4.4% Caucasian 86.3% Hispanic 2.4% Other 2.9% Years Worked Mean 19.95 SD 13.19 Number of Years Participant Worked with a Focal Leader Mean 3.48 SD 4.02 Experience in a Supervisory Position Yes 70.7% No 27.3% Industry of Work Healthcare 8.5% Manufacturing 5.9% Government 6.3% Agriculture, Mining, or Construction 3.9% Trade 5.9% Transportation & Utilities 2.2% Information 6.1% Finance Activities 4.9% Professional & Business Services 14.9% Education 20.7% Leisure & Hospitality 7.8% Military 1.0% Currently Unemployed 9.0%
137

Table 11
Results of Study 3’s CFA
Model Scaled χ2 df RMSEA CFI NFI SRMR Δ df Δ Scaled χ2 Final, 3 factor model
1876.83** 662 0.07 0.96 0.93 .10
8 factors 1852.01** 712 0.07 0.96 0.94 .09 22 319.61* 4 factorsa 2171.62** 734 0.07 0.95 0.93 .11 5 567.12* 4 factorsb 2574.85** 734 0.08 0.94 0.92 .11 4 factorsc 3993.42** 734 0.11 0.90 0.88 .11 2 factorsd 2738.74** 739 0.09 0.94 0.92 .11 1 1722.12* 2 factorse 4046.57** 739 0.11 0.89 0.87 .11 2 factorsf 4431.27** 739 0.12 0.88 0.86 .11 1 factor 4460.86** 740 0.12 0.88 0.86 .11 a Subordinate-directed/Insidiously-damaging, Subordinate-directed/Immediately-damaging, Organization-directed/Insidiously-damaging, Organization-directed/Immediately-damaging factors b Subordinate-directed/Norm-violating, Subordinate-directed/Rule-violating, Organization-directed/Norm-violating, Organization-directed/Rule-violating factors c Insidiously-damaging/Norm-violating, Insidiously-damaging/Rule-violating, Immediately-damaging/Norm-violating, Immediately-damaging/Rule-violating factors d Subordinate-directed and Organization-directed factors e Insidiously-damaging and Immediately-damaging factors f Norm-violating and Rule-violating factors Note. Scaled χ2 = Satorra-Bentler scaled chi-square test statistic; RMSEA = root-mean-square error of approximation; CFI = comparative fit index; NFI = normed fit index; SRMR = standardized root mean square residual
138

Table 12 Factors, Behaviors, and Factor Loadings Resulting from Study 3’s CFA
Subordinate-Directed Behavior (α=0.92) Avoids addressing important issues 0.61 Gossips 0.53 Denies subordinates of things they are entitled to (e.g., lunch breaks, vacation time)
0.61 Inadequately explains performance reviews
0.74
Disciplines subordinates a long time after the rule infraction occurs
0.72 Insults or criticizes subordinates in front of others
0.79
Discounts feedback or advice from subordinates
0.77 Invades subordinates' privacy 0.67
Discusses inappropriate personal information with others
0.57 Is confrontational when interacting with subordinates
0.69
Fails to defend subordinates from attacks by others
0.76 Makes jokes at the expense of others 0.56
Fails to give subordinates credit for jobs requiring a lot of effort
0.79 Says one thing and does another 0.76
Fails to protect subordinates' welfare/personal safety
0.64 Shows no clear standards for administering rewards and punishments
0.79
Fails to set goals for subordinates 0.55 Falsely accuses or punishes subordinates for something they were not responsible for
0.77 Throws objects at subordinates 0.37
Organization-Directed Behavior (α=0.88) Accepts financial kickbacks 0.47 Litters the work environment 0.52 At times appears to be under the influence of alcohol or recreational drugs while at work
0.52 Puts little effort into his work 0.66
Breaks the law while at work 0.63 Steals company funds 0.77 Does special favors for friends/family at the expense of the organization
0.64 Steals company property and resources 0.85
Falsifies documents 0.74 Tells people outside the job what a lousy place he works for
0.51
Ignores phone calls and/or emails 0.52 Throws things (but not at others) or smashes things
0.53
Is rude to customers/clients 0.50 Uses company property for personal use 0.79 Lets violations of company policy slide 0.74 Violates company policy/rules 0.85
Sexual Harassment Behavior (α=0.64) Brings inappropriate material to work (e.g., pornography)
0.62
Engages in romantic and/or sexual relationships with others from work
0.74
Hints that sexual favors will result in preferential treatment
0.99
139

Table 13 Sample characteristics for Study 4
Characteristic Statistic Age Mean 38.26 SD 14.05 Gender Male 42.2% Female 57.8% Ethnicity African-American 3.2% American Indian - Asian 8.4% Caucasian 78.6% Hispanic 4.9% Other 4.3% Years Worked Mean 18.91 SD 13.31 Number of Years Participant Worked with a Focal Leader Mean 3.22 SD 3.40 Experience in a Supervisory Position Yes 69.9% No 29.6% Industry of Work Healthcare 10.1% Manufacturing 8.1% Government 9.0% Agriculture, Mining, or Construction 1.4% Trade 6.2% Transportation & Utilities 3.0% Information 6.9% Finance Activities 4.2% Professional & Business Services 16.0% Education 13.0% Leisure & Hospitality 9.0% Military 0.7% Currently Unemployed 11.3% Completed Survey in Response to Effective Leader 48.4% Ineffective Leader 51.6%
140

141
Table 14 Final measure of negative leader behavior used in Study 4
Subordinate-Directed Behavior Factor Loadings
Avoids addressing important issues 0.62 Denies subordinates of things they are entitled to (e.g., lunch breaks, vacation time)
0.58
Disciplines subordinates a long time after the rule infraction occurs 0.57 Discounts feedback or advice from subordinates 0.63 Fails to defend subordinates form attacks by others 0.62 Fails to give subordinates credit for jobs requiring a lot of effort 0.65 Falsely accuses or punishes subordinates for something they were not responsible for
0.63
Ignores phone calls and/or email 0.56 Inadequately explains performance reviews 0.60 Insults or criticizes subordinates in front of others 0.63 Invades subordinates’ privacy 0.62 Is confrontational when interacting with subordinates 0.63 Says one thing and does another 0.65 Shows no clear standards for administering rewards and punishments 0.64
Organization-Directed Behavior Accepts financial kickbacks 0.60 At times appears to be under the influence of alcohol or recreational drugs while at work
0.61
Breaks the law while at work 0.61 Falsifies documents 0.62 Lets violations of company policy slide 0.56 Litters the work environment 0.57 Steals company funds 0.67 Steals company property and resources 0.66 Tells people outside the job what a lousy place he works for 0.52 Uses company property for personal use 0.61 Violates company policy/rules 0.61
Sexual Harassment Behavior Brings inappropriate material to work (e.g., pornography) 0.71 Engages in romantic and/or sexual relationships with others from work 0.59 Hints that sexual favors will result in preferential treatment 0.63
CFA Output: Scaled χ2(347)=728.10 RMSEA=.07 CFI=.99 NFI=.98 SRMR=.04

Table 15 Pearson correlation matrix for study 4 variables
Variable Mean s.d. 1 2 3 4 5 6 7 8 9 10 11 12 13 14 1. A ge 2 05 -38. 6 14. 2. Work experience (years)
18.91 13.31 .90** -
3. Time with leader (years)
3.22 3.40 .32** .29** -
4. Job satisfaction 3.53 1.11 .08* .09* .07† (.9 4) 5. Liking of Leader 3.38 1.12 -.05 -.05 .04 .64** (.9 2) 6. Turnover intent. 2.57 1.32 -.07† -.05 -.02 -.59** -.49** (.8 9) 7. Follower int. deviance
1.67 .89 -.21** -.18** .02 -.13** -.12** .19** (.8 1)
8. Follower org. deviance
1.87 .92 -.17** -.16** .05 -.31** -.27** .27** .65** (.8 6)
9. Overall follower deviance
1.80 .83 -.20** -.19** .04 -.27** -.24** .26** .85** .95** (.90)
10. Abusive Sup. 1.69 .84 .06 .08* .09* -.52** -.67** .53** .31** .41** .41** (.94) 11. Sub. NLB 2.10 1.07 .13** .17** .10** -.52** -.68** .51** .31** .43** .42** .81** (.96) 12. Org. NLB 1.48 .70 -.01 .03 .12** -.28** -.39** .32** .41** .45** .48** .62** .68** (.91) 13. SH NLB 1.23 .61 -.07† -.04 .13** -.10* -.19** .13** .37** .36** .40** .35** .40** .68** (.80) 14. NLB 1.76 .79 .08* .13** .12** -.46** -.61** .47** .39** .48** .49** .80** .95** .87** .59** (.96)
Note. N = 670. Follower int. deviance = Follower interpersonal deviance; Follower org. deviance = Follower organizational deviance; Sub. NLB = Subordinate-directed negative leader behavior; Org. NLB = Organization-directed negative leader behavior; SH NLB = Sexual harassment negative leader behavior; NLB = Negative leader behavior † p < .10 * p < .05 ** p < .01
142

143
Table 16 Kendall’s tau correlation matrix for study 4 variables
Variable Mean s.d. 1 2 3 4 5 6 7 8 9 10 11 12 13 14 1. Age 38.26 14.05 - 2. Work experience (years)
18.91 13.31 .76** -
3. Time with leader (years)
3.22 3.40 .27** .26** -
4. Job satisfaction 3.53 1.11 .06* .07* .10** (.9 4) 5. Liking of Leader 3.38 1.12 -.03 -.03 .05† .51** (.9 2) 6. Turnover intent. 2.57 1.32 -.05† -.04 -.05† -.45** -.37** (.8 9) 7. Follower int. deviance
1.67 .89 -.10** -.09** .03 -.14** -.15** .15** (.8 1)
8. Follower org. deviance
1.87 .92 -.08** -.08** .01 -.25** -.24** .20** .45** (.8 6)
9. Overall follower deviance
1.80 .83 -.10** -.09** .01 -.23** -.23** .21** .64** .85** (.9 0)
10. Abusive sup. 1.69 .84 .04 .05† .04 -.41** -.54** .41** .29** .34** .36** (.94) 11. Sub. NLB 2.10 1.07 .10** .13** .05† -.38** -.51** .36** .30** .37** .38** .69** (.96) 12. Org. NLB 1.48 .70 .02 .06* .05† -.24** -.34** .27** .35** .40** .41** .50** .58** (.91) 13. SH NLB 1.23 .61 -.03 -.03 .08** -.11** -.18** .15** .26** .23** .26** .32** .31** .42** (.80) 14. NLB 1.76 .79 .08** .10** .05† -.36** -.49** .35** .34** .41** .42** .67** .90** .70** .39** (.96)
Note. N = 670. Follower int. deviance = Follower interpersonal deviance; Follower org. deviance = Follower organizational deviance; Sub. NLB = Subordinate-directed negative leader behavior; Org. NLB = Organization-directed negative leader behavior; SH NLB = Sexual harassment negative leader behavior; NLB = Negative leader behavior † p < .10 * p < .05 ** p < .01

Table 17 Follower job satisfaction regressed on control variables and negative leader behavior factors and overall scores
Model 1 Model 2 (separate NLB factors)
Model 2 (general NLB factor) Variables and Statistics
B SE Beta B SE Beta B SE Beta Age -.00 .01 -.04 -.01 .01 -.08 -.01 .01 -.14† Work experience (years) .01 .01 .10 .02 .01 .25** .02 .01 .25** Time with leader (years) .01 .01 .04 .02 .01 .05 .03 .01 .09* Sub. NLB -.66 .05 -.67** Org. NLB .08 .06 .08 SH NLB .11 .04 .11*
Overall NLB
-.50 .04 -.50** R2 .01 .33** .25** Adjusted R2 .00 .33 .24
R2 .32** .24** df (regression, residual) 3, 654 3, 651 1, 653 Note. Sub. NLB = Subordinate-directed negative leader behavior; Org. NLB = Organization-directed negative leader behavior; SH NLB = Sexual harassment negative leader behavior; Overall NLB = Overall negative leader behavior † p < .10 * p < .05 ** p < .01
144

Table 18 Follower liking for leader regressed on control variables and negative leader behavior factors and overall scores
Model 1 Model 2 (separate NLB factors)
Model 2 (general NLB factor) Variables and Statistics
B SE Beta B SE Beta B SE Beta Age -.01 .01 -.11 -.01 .01 -.18** -.02 .01 -.24** Work experience (years) .00 .01 .03 .02 .01 .22** .02 .01 .22** Time with leader (years) .02 .01 .06 .03 .01 .09** .04 .01 .13** Sub. NLB -.78 .04 -.78** Org. NLB .09 .05 .09† SH NLB .04 .04 .04
Overall NLB
-.64 .03 -.64** R2 .01 .49** .41** Adjusted R2 .00 .49 .40
R2 .49** .40** df (regression, residual) 3, 654 3, 651 1, 653 Note. Sub. NLB = Subordinate-directed negative leader behavior; Org. NLB = Organization-directed negative leader behavior; SH NLB = Sexual harassment negative leader behavior; Overall NLB = Overall negative leader behavior † p < .10 * p < .05 ** p < .01
145

Table 19 Follower turnover intentions regressed on control variables and negative leader behavior factors and overall scores
Model 1 Model 2 (separate NLB factors)
Model 2 (general NLB factor) Variables and Statistics
B SE Beta B SE Beta B SE Beta Age -.01 .01 -.08 -.00 .01 -.02 .00 .01 .03 Work experience (years) .00 .01 .01 -.10 .01 -.13 -.01 .01 -.13 Time with leader (years) .00 .01 .01 -.00 .01 -.01 -.01 .01 -.04 Sub. NLB .54 .05 .55** Org. NLB .03 .06 .03 SH NLB -.11 .05 -.11*
Overall NLB
.48 .04 .48** R2 .00 .27** .23** Adjusted R2 -.00 .27 .22
R2 .27** .22** df (regression, residual) 3, 654 3, 651 1, 653 Note. Sub. NLB = Subordinate-directed negative leader behavior; Org. NLB = Organization-directed negative leader behavior; SH NLB = Sexual harassment negative leader behavior; Overall NLB = Overall negative leader behavior † p < .10 * p < .05 ** p < .01
146

Table 20 Follower interpersonal deviance regressed on control variables and negative leader behavior factors and overall scores
Model 1 Model 2 (separate NLB factors)
Model 2 (general NLB factor) Variables and Statistics
B SE Beta B SE Beta B SE Beta Age -.02 .01 -.26** -.01 .01 -.14† -.01 .01 -.17* Work experience (years) .00 .01 .03 -.01 .01 -.09 -.01 .01 -.09 Time with leader (years) .03 .01 .09* .01 .01 .04 .02 .01 .05 Sub. NLB .16 .05 .16** Org. NLB .19 .06 .19** SH NLB .15 .05 .15**
Overall NLB
.40 .04 .40** R2 .05** .22** .20** Adjusted R2 .05 .21 .20
R2 .17** .15** df (regression, residual) 3, 649 3, 646 1, 648 Note. Sub. NLB = Subordinate-directed negative leader behavior; Org. NLB = Organization-directed negative leader behavior; SH NLB = Sexual harassment negative leader behavior; Overall NLB = Overall negative leader behavior † p < .10 * p < .05 ** p < .01
147

Table 21 Follower organizational deviance regressed on control variables and negative leader behavior factors and overall scores
Model 1 Model 2 (separate NLB factors)
Model 2 (general NLB factor) Variables and Statistics
B SE Beta B SE Beta B SE Beta Age -.02 .01 -.21* -.01 .01 -.10 -.01 .01 -.11 Work experience (years) .01 .01 .01 -.01 .01 -.14† -.01 .01 -.14† Time with leader (years) .03 .01 .11* .02 .01 .05 .02 .01 .06† Sub. NLB .31 .05 .31** Org. NLB .16 .06 .16** SH NLB .10 .05 .10*
Overall NLB
.49 .03 .49** R2 .04** .27** .27** Adjusted R2 .04** .27 .27
R2 .23** .23** df (regression, residual) 3, 648 3, 645 1, 647 Note. Sub. NLB = Subordinate-directed negative leader behavior; Org. NLB = Organization-directed negative leader behavior; SH NLB = Sexual harassment negative leader behavior; Overall NLB = Overall negative leader behavior † p < .10 * p < .05 ** p < .01
148

149
Table 22 Overall follower deviance regressed on control variables and negative leader behavior factors and overall scores
Model 1 Model 2 (separate NLB factors)
Model 2 (general NLB factor) Variables and Statistics
B SE Beta B SE Beta B SE Beta Age -.02 .01 -.25** -.01 .01 -.12 -.01 .01 -.14† Work experience (years) .00 .01 .02 -.01 .01 -.13† -.01 .01 -.13† Time with leader (years) .03 .01 .12** .02 .01 .05 .02 .01 .06† Sub. NLB .28 .05 .28** Org. NLB .19 .06 .19** SH NLB .13 .05 .13**
Overall NLB
.50 .03 .50** R2 .05** .30** .29** Adjusted R2 .05 .29 .29
R2 .25** .24** df (regression, residual) 3, 648 3, 645 1, 647 Note. Sub. NLB = Subordinate-directed negative leader behavior; Org. NLB = Organization-directed negative leader behavior; SH NLB = Sexual harassment negative leader behavior; Overall NLB = Overall negative leader behavior † p < .10 * p < .05 ** p < .01

Table 23 Binary regression of followers’ leader effectiveness judgments on control variables and negative leader behavior factors and overall scores
Step 1 Step 2 (separate NLB factors) Step 2 (general NLB factor) Variables and Statistics B SE Wald Exp(B) B SE Wald Exp(B) B SE Wald Exp(B) Constant .24 .30 .64 - 2.91 .48 36.98** - 4.14 .46 79.72** - Age -.01 .01 .58 .99 -.03 .02 2.41 .98 -.03 .02 5.15* .97 Work experience (years)
.01 .01 .22 1.01 .05 .02 7.68** 1.05 .04 .02 7.27** 1.05
Time with leader (years)
-.01 .02 .08 .99 .00 .03 .00 1.00 .03 .03 1.03 1.03
Sub. NLB -2.40 .20 139.00** .09 Org. NLB .60 .30 4.04* 1.83 SH NLB .74 .26 8.00** 2.10
Overall NLB
-2.29 .19 141.97** .10 Note. Sub. NLB = Subordinate-directed negative leader behavior; Org. NLB = Organization-directed negative leader behavior; SH NLB = Sexual harassment negative leader behavior; Overall NLB = Overall negative leader behavior † p < .10 * p < .05 ** p < .01
150

Table 24 Welch’s t-tests of differences in negative leader behavior scores according to followers’ leader effectiveness judgment Variable t-statistic Subordinate-directed negative leader behavior -20.76**
Organization-directed negative leader behavior -8.83**
Sexual harassment negative leader behavior -3.25**
Overall negative leader behavior -16.94**
** p < .01
151
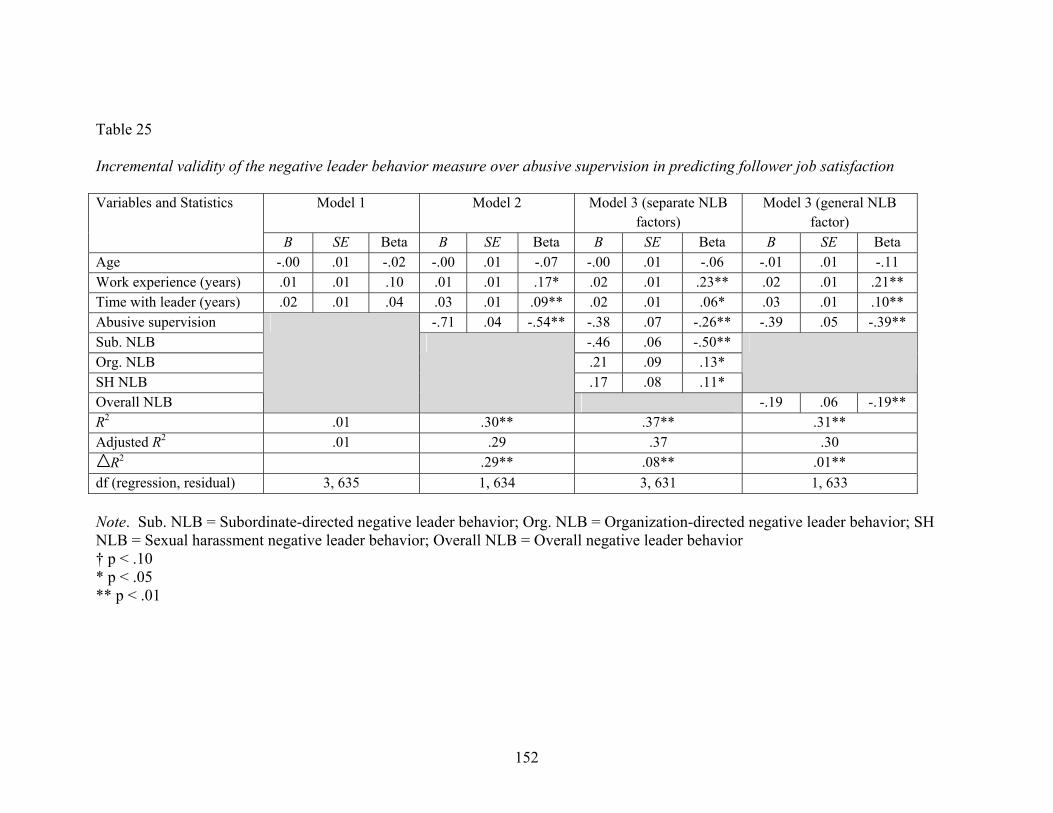
Table 25 Incremental validity of the negative leader behavior measure over abusive supervision in predicting follower job satisfaction
Model 1 Model 2 Model 3 (separate NLB factors)
Model 3 (general NLB factor)
Variables and Statistics
B SE Beta B SE Beta B SE Beta B SE Beta Age -.00 .01 -.02 -.00 .01 -.07 -.00 .01 -.06 -.01 .01 -.11 Work experience (years) .01 .01 .10 .01 .01 .17* .02 .01 .23** .02 .01 .21** Time with leader (years) .02 .01 .04 .03 .01 .09** .02 .01 .06* .03 .01 .10** Abusive supervision -.71 .04 -.54** -.38 .07 -.26** -.39 .05 -.39** Sub. NLB -.46 .06 -.50** Org. NLB .21 .09 .13* SH NLB .17 .08 .11*
Overall NLB
-.19 .06 -.19** R2 .01 .30** .37** .31** Adjusted R2 .01 .29 .37 .30
R2 .29** .08** .01** df (regression, residual) 3, 635 1, 634 3, 631 1, 633 Note. Sub. NLB = Subordinate-directed negative leader behavior; Org. NLB = Organization-directed negative leader behavior; SH NLB = Sexual harassment negative leader behavior; Overall NLB = Overall negative leader behavior † p < .10 * p < .05 ** p < .01
152

Table 26 Incremental validity of the negative leader behavior measure over abusive supervision in predicting follower liking for leader
Model 1 Model 2 Model 3 (separate NLB factors)
Model 3 (general NLB factor)
Variables and Statistics
B SE Beta B SE Beta B SE Beta B SE Beta Age -.01 .01 -.08 -.01 .01 -.14* -.01 .01 -.16* -.01 .01 -.19** Work experience (years) .00 .01 .02 .01 .01 .11 .01 .01 .19** .01 .01 .17* Time with leader (years) .01 .01 .05 .03 .01 .11** .03 .01 .09** .04 .01 .12** Abusive supervision -.68 .03 -.68** -.34 .05 -.35** -.46 .05 -.46** Sub. NLB -.55 .05 -.55** Org. NLB .16 .05 .16** SH NLB .03 .04 .03
Overall NLB
-.27 .05 -.28** R2 .01 .46** .54** .49** Adjusted R2 .00 .45 .54 .48
R2 .45** .08** .03** df (regression, residual) 3, 635 1, 634 3, 631 1, 633 Note. Sub. NLB = Subordinate-directed negative leader behavior; Org. NLB = Organization-directed negative leader behavior; SH NLB = Sexual harassment negative leader behavior; Overall NLB = Overall negative leader behavior † p < .10 * p < .05 ** p < .01
153

Table 27 Incremental validity of the negative leader behavior measure over abusive supervision in predicting follower turnover intentions
Model 1 Model 2 Model 3 (separate NLB factors)
Model 3 (general NLB factor)
Variables and Statistics
B SE Beta B SE Beta B SE Beta B SE Beta Age -.01 .01 -.11 -.01 .01 -.07 .00 .01 -.06 -.00 .01 -.04 Work experience (years) .00 .01 .04 -.00 .01 -.03 -.01 .01 -.07 -.01 .01 -.06 Time with leader (years) .00 .01 .01 -.01 .01 -.04 -.01 .01 -.02 -.01 .01 -.04 Abusive supervision .53 .03 .53** .35 .06 .35** .43 .06 .43** Sub. NLB .29 .06 .29** Org. NLB -.03 .06 -.03 SH NLB -.08 .05 -.08†
Overall NLB
.14 .06 .14* R2 .01 .29** .31** .29** Adjusted R2 .00 .28 .31 .29
R2 .28** .03** .01* df (regression, residual) 3, 635 1, 634 3, 631 1, 633 Note. Sub. NLB = Subordinate-directed negative leader behavior; Org. NLB = Organization-directed negative leader behavior; SH NLB = Sexual harassment negative leader behavior; Overall NLB = Overall negative leader behavior † p < .10 * p < .05 ** p < .01
154

Table 28 Incremental validity of the negative leader behavior measure over abusive supervision in predicting follower interpersonal deviance
Model 1 Model 2 Model 3 (separate NLB factors)
Model 3 (general NLB factor)
Variables and Statistics
B SE Beta B SE Beta B SE Beta B SE Beta Age -.02 .01 -.28** -.02 .01 -.25** -.01 .01 -.17† -.01 .01 -.19* Work experience (years) .00 .01 .04 .00 .01 -.00 -.01 .01 -.07 -.01 .01 -.08 Time with leader (years) .03 .01 .11** .02 .01 .08* .01 .01 .04 .02 .01 .06† Abusive supervision .33 .04 .33** .13 .06 .13* .06 .06 .06 Sub. NLB .06 .07 .06 Org. NLB .17 .06 .17** SH NLB .14 .05 .14**
Overall NLB
.34 .06 .35** R2 .05** .16** .22** .20** Adjusted R2 .05 .16 .21 .20
R2 .11** .06** .04** df (regression, residual) 3, 635 1, 634 3, 631 1, 633 Note. Sub. NLB = Subordinate-directed negative leader behavior; Org. NLB = Organization-directed negative leader behavior; SH NLB = Sexual harassment negative leader behavior; Overall NLB = Overall negative leader behavior † p < .10 * p < .05 ** p < .01
155

Table 29 Incremental validity of the negative leader behavior measure over abusive supervision in predicting follower organizational deviance
Model 1 Model 2 Model 3 (separate NLB factors)
Model 3 (general NLB factor)
Variables and Statistics
B SE Beta B SE Beta B SE Beta B SE Beta Age -.02 .01 -.26** -.02 .01 -.22** -.01 .01 -.14† -.01 .01 -.15† Work experience (years) .00 .01 .05 .00 .01 -.01 -.01 .01 -.08 -.01 .01 -.09 Time with leader (years) .04 .01 .13** .03 .01 .09* .02 .01 .06† .02 .01 .07* Abusive supervision .42 .04 .42** .15 .06 .15* .12 .06 .12* Sub. NLB .19 .06 .20** Org. NLB .13 .06 .13* SH NLB .10 .05 .10*
Overall NLB
.38 .06 .39** R2 .05** .22** .28** .28** Adjusted R2 .04 .22 .27 .27
R2 .18** .06** .05** df (regression, residual) 3, 634 1, 633 3, 630 1, 632 Note. Sub. NLB = Subordinate-directed negative leader behavior; Org. NLB = Organization-directed negative leader behavior; SH NLB = Sexual harassment negative leader behavior; Overall NLB = Overall negative leader behavior † p < .10 * p < .05 ** p < .01
156

157
Table 30 Incremental validity of the negative leader behavior measure over abusive supervision in predicting overall follower deviance
Model 1 Model 2 Model 3 (separate NLB factors)
Model 3 (general NLB factor)
Variables and Statistics
B SE Beta B SE Beta B SE Beta B SE Beta Age -.02 .01 -.29** -.02 .01 -.26** -.01 .01 -.17* -.01 .01 -.18* Work experience (years) .00 .01 .06 .00 .01 -.01 -.01 .01 -.09 -.01 .01 -.09 Time with leader (years) .04 .01 .13** .03 .01 .09* .02 .01 .06† .02 .01 .08* Abusive supervision .42 .04 .43** .16 .06 .16** .11 .06 .11† Sub. NLB .16 .06 .16* Org. NLB .16 .06 .16** SH NLB .13 .05 .13**
Overall NLB
.40 .06 .41** R2 .06** .24** .31** .30** Adjusted R2 .05 .23 .30 .29
R2 .18** .07** .06** df (regression, residual) 3, 634 1, 633 3, 630 1, 632 Note. Sub. NLB = Subordinate-directed negative leader behavior; Org. NLB = Organization-directed negative leader behavior; SH NLB = Sexual harassment negative leader behavior; Overall NLB = Overall negative leader behavior † p < .10 * p < .05 ** p < .01

Table 31 Incremental validity of the negative leader behavior measure over abusive supervision in predicting followers’ leader effectiveness judgment
Step 0 Step 1 Step 2 Step 3 (separate NLB factors) Step 3 (general NLB factor) Variable B SE Wald B SE Wald Exp(B) B SE Wald Exp(B) B SE Wald Exp(B) B SE Wald Exp(B)
Constant -.02 .08 .08 .24 .30 .64 - 3.62 .47 59.78** - 3.26 .52 38.61** - 4.48 .51 77.91** - Age -.01 .01 .58 .99 -.02 .02 1.15 .98 -.02 .02 .74 .99 -.03 .02 2.74† .97 Work experience (years)
.01 .01 .22 1.01 .02 .02 1.42 1.02 .04 .02 4.42* 1.04 .04 .02 4.18* 1.04
Time with leader (years)
-.01 .02 .08 .99 .02 .03 .31 1.02 -.00 .03 .00 1.00 .02 .03 .57 1.02
Abusive supervision
-2.20 .20 125.21** .11 -1.01 .25 15.93** .36 -1.26 .25 24.84** .29
Sub. NLB -2.11 .23 82.84** .12 Org. NLB .86 .32 7.16** 2.36 SH NLB .79 .28 8.33** 2.21
Overall NLB
-1.38 .26 28.41** .25
Note. Sub. NLB = Subordinate-directed negative leader behavior; Org. NLB = Organization-directed negative leader behavior; SH NLB = Sexual harassment negative leader behavior; Overall NLB = Overall negative leader behavior † p < .10 * p < .05 ** p < .01
158

Figure Captions
Figure 1. Illustration of the state of existing research on constructs related to negative leader behavior Figure 2. Scree plot of stress values for the MDS analysis
Figure 3. Factor structure of the negative leader behavior measure Figure 4. Standardized path coefficients for the validation model Figure 5. Overlap among negative leader behavior factors and other leader- and non-leader-specific constructs
159

Negative Leadership
Personalized Leadership
Petty Tyranny
Supervisor Undermining Management-by-
Exception
Laissez-Faire
Decision-Making Errors
“Dark” Charismatic Leadership
Unintentional Behaviors Intentional Behaviors
Abusive Supervision
Destructive Leadership
160

Scree Plot of Stress Values from the MDS Analysis
0
0.05
0.1
0.15
0.2
0.25
0.3
0.35
1 2 3 4 5 6
Number of Dimensions
Stress Value
161

162
Subordinate-Directed Behaviors
Organization-Directed Behaviors
.31
.54
.70
0.49
0.59
0.63
Negative Leader Behavior
Sexual Harassment Behaviors

* p < .05 ** p < .01
Subordinate-Directed NLB
Organization-Directed NLB
Organizational Deviance
Interpersonal Deviance
Turnover Intentions
Liking of Leader
Job Satisfaction
.35**
.45**
-.17**.20**
.20**
.32**.38**
.05
.10**
.09*
.19**
.19**
-.39**-.47**
.47**
..09.02
.29**
-.64**
-.44**
Abusive Supervision
Sexual Harassment
NLB
163

164
Organization-Directed Negative Leader Behavior •0% overlap with leader-specific constructs
Subordinate-Directed Negative Leader Behavior •38% overlap with leader-specific constructs •43% overlap with non-leader-specific constructs
•73% overlap with non- leader-specific constructs
Sexual Harassment Negative Leader Behavior •0% overlap with leader-specific constructs •100% overlap with non-leader-specific constructs

VITA
Brian W. Tate EDUCATION Doctor of Philosophy in Industrial/Organizational Psychology, August 2009 The Pennsylvania State University, University Park, Pennsylvania Master of Science in Industrial/Organizational Psychology, December 2006 The Pennsylvania State University, University Park, Pennsylvania Bachelor of Science in Psychology (Summa cum Laude), December 2003 Virginia Commonwealth University, Richmond, Virginia SELECTED PUBLICATIONS AND CONFERENCE PRESENTATIONS Hunter, S. T., Tate, B. W., Dzieweczynski, J., & Bedell-Avers, K. E. (in press). Leaders make mistakes: A multilevel consideration of why. Leadership Quarterly. Hunter, S. T., Tate, B. W., Dzieweczynski, J., & Pesin, L. (in press). A multilevel consideration of leader errors. In B. Schyns and T. Hasboro (Eds.), When leadership goes wrong: Destructive leadership, mistakes and ethical failures. Oxford, England: Elsevier. Tate, B. W., Lindsay, D. R., & Hunter, S. T. (2009, August). Implicit followership theories: Developing a measure of what leaders value in their followers. Paper to be presented at the 69th annual Academy of Management conference, Chicago, IL. Tate, B. W. & Jacobs, R. R. (2009, April). Bad to the bone: Empirically defining and measuring negative leadership. Paper presented at the 24th annual meeting of the Society for Industrial and Organizational Psychology, New Orleans, LA. Tate, B. W. (2008). A longitudinal study of the relationships between self-monitoring, authentic leadership, and perceptions of leadership. Journal of Leadership and Organizational Studies, 15 (1), 16-29. Tate, B. W. & McDaniel, M. A. (2008, August). Race differences in personality: An evaluation of moderators and publication bias. Paper presented at the 68th annual Academy of Management conference, Anaheim, CA. Lindsay, D. R., Tate, B. W., & Jacobs, R. R. (2008). Practicum: A teaching tool to highlight the scientist-practitioner model. The Industrial-Organizational Psychologist, 45 (3), 39-47. Day, D. V. & Tate, B. W. (2006). Continuous learning: Why is it still an issue? In F. Yammarino & F. Dansereau (Eds.), Multi-Level Issues in Social Systems (Vol. 5). Elsevier: New York. (pp. 173-188).