bacterial (free living and particle bound) cell- size …
TRANSCRIPT

Mahadevaswamy et al: Bacterial cell-size in the surface waters of river Cauvery and its upstream tributaires - 29 -
APPLIED ECOLOGY AND ENVIRONMENTAL RESEARCH 6(1): 29-47. http://www.ecology.uni-corvinus.hu ● ISSN 1589 1623
2008, Penkala Bt., Budapest, Hungary
BACTERIAL (FREE LIVING AND PARTICLE BOUND) CELL-
SIZE IN THE SURFACE WATERS OF RIVER CAUVERY AND ITS
UPSTREAM TRIBUTARIES IN KARNATAKA STATE, INDIA
M. MAHADEVASWAMY – S. M. YAMAKANAMARDI* – T.S. HARSHA
Aquatic Microbial Ecology Research Laboratory, Department of Studies in Zoology,
University of Mysore, Manasagangotri, Mysore 570 006, Karnataka State, India
(phone: 0821-2419776; fax: 0821-2421263)
e-mail: [email protected],
(Received 16th August 2006; accepted13th May 2007)
Abstract. Cell-size here refers to mean length, as only the lengths of bacterial cells were measured in this study. Cell breadths were not measured, hence calculation of biovolume and biomass was not possible. In this study, the mean cell-lengths of heterotrophic bacterioplankton as well as their relation with environmental (water-quality) variables were analyzed for two years in the main river Cauvery and its four important upstream tributaries from February 2000 to January 2002. The initial hypothesis that all the five water courses have similar bacterial mean cell-lengths was rejected, because mean cell-lengths of free living and particle bound planktonic bacteria was more and was also significantly different in the river Lakshmanatheertha, when compared to the other four water courses studied. Season-wise grouped data revealed that, the mean cell-length of free-living bacteria was significantly less in winter season as compared to rainy and summer seasons during the second year of study only in the river Lakshmanatheertha. A correlation (r) analysis between the mean cell-lengths of heterotrophic bacteria and environmental (water-quality) variables revealed significant relations. Also with the help of regression analysis (r2) the effect of some important environmental variables on the mean cell-length of heterotrophic bacteria has been discussed in the light of recent investigations in the field of fresh water microbial ecology. Keywords: bacterial cell length, planktonic food web, environmental factors, bacterial production
Introduction
Heterotrophic bacteria are accounted for the most important proportion of decomposers in the aquatic ecosystems, which are responsible for key process regulating the function and productivity of ecosystem through the microbial loop [3]. Heterotrophic bacteria in the fresh water ecosystem form a major part of the food web and mediate important processes in the carbon budget [12]. This food web plays an important role in the regulation of carbon transfer [26]. As in both fresh water and marine waters, the biomass and size distribution of bacteria are important parameters of ecosystem function. Given the important ecological role of bacterial factors, regulating the productivity (growth rate) and biomass (abundance and cell-size) of these communities are of interest. Bacterial cell-size may be related to metabolic state, as large bacterial cells are often the most active [27]. The role of large bacteria in the river is important as competitors; large bacteria limit the development of small ones, and also play a buffer role in the degradation of organic matter [14 and 26]. Further, the large allochthonous bacteria brought by the sewage are active in the river and able to grow in culture at rate twice those of smaller bacteria [14]. Use of radiolabeled thymidine and leucine incorporation techniques [4] showed lower metabolic activity for smaller-sized soil bacteria. A sharp and drastic decrease in the concentration and changes in composition of organic substrates may lead to reduction of bacterial cell-size. Reduction

Mahadevaswamy et al: Bacterial cell-size in the surface waters of river Cauvery and its upstream tributaires - 30 -
APPLIED ECOLOGY AND ENVIRONMENTAL RESEARCH 6(1): 29-47. http://www.ecology.uni-corvinus.hu ● ISSN 1589 1623
2008, Penkala Bt., Budapest, Hungary
or small sizes are said to be an adaptive mechanism of bacteria under starvation. Small cell-size has advantages, e.g., increased surface volume ratio, allowing a higher substrate incorporation rate per unit of biomass [47] and protection from zooplankton grazing in comparison to larger cells [21]. Furthermore, small or miniature bacteria can be obtained experimentally by starvation in culture [24], which implies morphological and physiological modifications. Thus, it is possible that cell-size diversity of the bacterioplankton corresponds to some aspects of the physiological state of the population, and may have a meaningful ecological role in the planktonic food-web [31]. The cell-size of planktonic bacteria is an important feature in the predator-prey relationship between bacteria and protistan predators, because grazing by predators is size selective and causes a profound shift in bacterial cell-size distribution [41, 36 and 6]. Larger cells are more likely to be grazed by zooplankton. After grazing of larger cells, the medium sized bacteria are then used as a food source [6]. Predation by bacterivorous protists in aquatic habitats can influence the morphological structure and physiological status of the bacterial communities [21]. However, in some habitats and seasons, metazoan grazing or lysis by phages may play an important factor in controlling bacterial size mortality [47]. Nevertheless, the effects of predation in the natural environment are difficult to demonstrate, as many other factors can affect the bacterioplankton cell-size distribution [9]. These factors include growth rate, temperature, oxic/anoxic conditions [10], resuspension [45], cell lysis initiated by abrasion, starvation or infected by viruses [27]. As far as authors know, only few studies are available in the literature on size spectra of planktonic bacteria. Examples are studies on marine plankton in the Mediterranean [38], in sediments of brackish water [11] and in sediments of Botany Bay [31]. Few studies analyzed the seasonal changes in abundance and cell size of heterotrophic bacteria in fresh water lakes, [5], on the effect of detrital addition on bacterial cell size [17], on bacterial biomass and cell size distribution [10], on role of cell size in microbial loop [9]. Further more in reservoir, specific bacterial cell size and size selective grazing [19 and 21] was also carried out. Few research studies on rivers documented that, physiological characteristic and ecological role of small and large sized bacteria in polluted rivers [14], on bacterial cell-size in three lowland water courses of North-East England [49], and on microbial food web with respect to diel fluctuation in bacterial biomass [26]. So far there are no studies on the mean cell-length of planktonic bacteria in river Cauvery and its important tributaries like Lakshmanatheertha, Harangi, Hemavathy and Lokapavani in Karnataka state, India. Hence, this investigation on the mean cell-lengths of planktonic bacteria was undertaken. The aims of this investigation were 1) to study and compare the mean cell-lengths of planktonic bacteria in the rivers Lakshmanatheertha, Harangi, Hemavathy, Lokapavani and Cauvery. 2) to test the initial hypothesis that, the mean cell-lengths of planktonic bacteria in four upstream tributaries are similar to each other, but are markedly different in the main river Cauvery. 3) to investigate the relationships between mean cell-lengths of planktonic bacteria and other microbial and water quality variables. 4) to know, the potential control of mean cell-lengths of planktonic bacteria by relevant water quality (bottom-up or nutrient) and by predation (top-down control or grazing) and/or by both.

Mahadevaswamy et al: Bacterial cell-size in the surface waters of river Cauvery and its upstream tributaires - 31 -
APPLIED ECOLOGY AND ENVIRONMENTAL RESEARCH 6(1): 29-47. http://www.ecology.uni-corvinus.hu ● ISSN 1589 1623
2008, Penkala Bt., Budapest, Hungary
Materials and methods
Collection and preservation of samples
The sampling sites on the main river Cauvery and its four important upstream tributaries are shown in (Fig 1.) Mid stream surface water samples were collected from the river Lakshmanatheertha at Kattemalawadi Anicut (site-1, Latitude 12o 17”N and Longitude 76o 17”E) near Hunsur town, river Harangi at Chunchanakatte village (site-2, Latitude 12o 50”N and Longitude 76o 05”E), river Hemavathy near Hampapura village (site-3, Latitude 12o 40”N and Longitude 76o 45”E), river Lokapavani at Bapurayanakoppal (site-4, Latitude 12o 25”N and Longitude 76o 41”E) and the main river Cauvery near Mahadevapura village (site-5, Latitude 12o 25”N and Longitude 76o 41”E) between 06.30 AM and 12.30 PM, at about fortnightly intervals, from February 2000 to January 2002.
Figure 1. Map showing sampling sites on the river Cauvery and its four important upstream
tributaries in Southern Karnataka State
Water samples were collected in sterile glass bottles from all the five water courses.
Ten ml of water sample from each site were preserved with 2% final concentration of 0.22µm filtered neutral formalin [23] immediately after collection. Preservation was not for more than 3-4 days before microscopical observations as sizes may change (due to cell shrinkage) on fixing for longer periods [13]. Bacteria were then stained with Acridine Orange concentrated on black 0.22µm polycarbonate membrane filters and examined under the Epifluroscence microscope. For the analysis of other water quality variables, water samples were collected in clean polythene bucket and transferred to 5 litre capacity polythene containers. Detailed methodology followed was based on APHA [2] and as described in Yamakanamardi [49].

Mahadevaswamy et al: Bacterial cell-size in the surface waters of river Cauvery and its upstream tributaires - 32 -
APPLIED ECOLOGY AND ENVIRONMENTAL RESEARCH 6(1): 29-47. http://www.ecology.uni-corvinus.hu ● ISSN 1589 1623
2008, Penkala Bt., Budapest, Hungary
Measurement of mean length of planktonic bacteria
The length of 100 to 150 free living bacteria (FLB) and 100 -150 particle bound bacteria (PBB) from each water sample were measured directly from the microscopic images using G-12 eyepiece graticule at magnification 1000X [33]. The graticule contained two series of circles i.e. clear and black of increasing diameter. These circles were overlaid on each bacterium chosen without bias, so that cell length was given by the appropriate circle diameters [49]. The bacteria were placed in ten length categories that increased in a root 2 progressions from < 0.44 µm to >7µm. The ten size categories were; 1= < 0.44µm, 2= 0.44 – 0.53µm, 3= 0.53 – 0.75µm, 4= 0.75 – 1.06µm, 5= 1.06 – 1.495µm, 6= 1.495 – 2.125µm, 7= 2.125 – 3.0µm, 8= 3.0 - 4.25µm, 9= 4.25 – 6.0µm and 10= >7µm. Mean length of both FLB and PBB were calculated, by ascribing lengths which were the mid point of the maximum and minimum lengths in 2-9 category. Cells in category 1 were treated as being 0.44µm while cells in category 10 were taken as 7µm. Estimation of percentage of bacterial cells in each size category
The percentage of FLB and PBB cell in each size category was calculated by dividing the number of bacterial cell in each size category by the total number of cells sized and then multiplied by 100. Statistical analysis
All the statistical analysis were carried out using SPSS for Window release 6.0 [35]. The Kolmogorov-Smirnov test was used to test for agreement with the normal distribution. Distribution of many variables were found to differ significantly (p<0.05) from the normal distribution. Therefore, values for all variables were scaled, if necessary and then log10 transformed. Student-Newman-Keuls one – way ANOVA post hoc test was applied for making multiple comparisons among the means. Correlations were examined using Pearson’s Correlation coefficients. Values of Pearson’s correlation coefficients, calculated after log10 transformation, were generally used to help interpret the results. Further, multiple regression analysis was also used with bacterial variables as dependent variables and environmental variables as independent variables. Variable were entered into the equation using the stepwise entry method, with p in set at 0.05 and p out set at 0.1.
Results
Cell size here refers to mean length, as only the lengths of bacterial cells were measured in this study. These are related to cell volume and biomass, although not linearly. Cell breadths were not measured, hence calculation of biovolume and biomass was not possible. In this study bacterial cell size (mean length) and size category distribution was measured over a period of two years (Feb. 2000 – Jan. 2002). The results are as follows.
Mean length of free-living bacteria
Summary of the overall mean cell length of free-living bacteria measured was similar in the river Cauvery (Mean 2.17 µm, range 1.41 - 3.04 µm), river Harangi (Mean

Mahadevaswamy et al: Bacterial cell-size in the surface waters of river Cauvery and its upstream tributaires - 33 -
APPLIED ECOLOGY AND ENVIRONMENTAL RESEARCH 6(1): 29-47. http://www.ecology.uni-corvinus.hu ● ISSN 1589 1623
2008, Penkala Bt., Budapest, Hungary
2.07 µm, range 1.22 - 3.24 µm), river Hemavathy (Mean 2.02 µm, range 1.15 - 3.24 µm), and in river Lokapavani (Mean 2.15 µm, range 1.49 - 3.55 µm), but it was more and also significantly different in the river Lakshmanatheertha (Mean 2.56 µm, range 1.36 - 3.80 µm) (Table 1). Mean values with different superscripts are significantly different (p< 0.05) as shown by one-way ANOVA post hoc non-parametric Student-Newman-Keuls test (SNK test) is also shown in this table.
Since, Indian season is mainly controlled by Monsoon climate, the seasonal study year (February-January) was divided into three well marked seasons viz. Pre-monsoon or summer (February-May), Monsoon or Rainy (June- September) and Post-monsoon or winter (October-January). Thus, the statistical analysis (Mean ± SD and F&P values obtained through ANOVA test) of the season wise grouped data of all the five water courses was carried out. In the river Lakshmanatheertha, during the second year of study the mean cell-length of free-living bacteria was significantly less in winter season than in rainy and summer seasons, both of which were similar when compared to other four water courses studied. Temporal variation of mean length of free-living bacterial cells in the river Lakshmanatheertha show more temporal fluctuations in the Pre-monsoon season of the first year and in all the five water courses during the Pre-monsoon and Monsoon seasons of the second year of study. In contrast, in all the five rivers there was greater fluctuation in the mean cell-lengths of free-living bacteria and there was a seasonal pattern, seemingly with smaller cells in winter than in summer (Fig. 2).
20022001
Mea
n L
engt
h of
Fre
e L
ivin
g B
acte
ria
( µ m
)
2000
�
River Harangi
River Cauvery
River Lokapavani
River Hemavathy
River Lakshmantheertha
___
_
____
0
2
4
0
2
4
0
2
4
0
2
4
F M A M J J A S O N D J F M A M J J A S O N D J0
2
4
Figure 2. Seasonal changes in Free living bacterial cell size in the surface water of river
Cauvery, Lokapavani, Hemavathy, Harangi and Lakshmantheertha,
February 2000 – January 2002.
The correlation between bacterial cell-size and other microbial variables is shown in
(Table 2.) In the river Lakshmanatheertha the mean cell-size of free-living bacteria showed positive correlations with abundance of free living bacteria, particle bound bacteria, and total bacteria, zooplankton and mean cell-length of particle bound bacteria

Mahadevaswamy et al: Bacterial cell-size in the surface waters of river Cauvery and its upstream tributaires - 34 -
APPLIED ECOLOGY AND ENVIRONMENTAL RESEARCH 6(1): 29-47. http://www.ecology.uni-corvinus.hu ● ISSN 1589 1623
2008, Penkala Bt., Budapest, Hungary
and negatively correlated with Colony Forming Units as % of Acridine Orange Direct Counts (CFUs as % of AODCs). In river Harangi, the mean cell-length of free-living bacteria was correlated with mean cell-length of particle bound bacterial. In river Hemavathy, the mean cell-length of free-living bacteria was correlated with specific growth rate, zooplankton and mean length of particle bound bacteria. In river Lokapavani, the mean cell-length of free-living bacteria was correlated only with the mean length of particle bound bacteria. However, in river Cauvery, the mean cell- length of free-living bacteria was positively correlated with mean length of particle bound bacterial cells and negatively with zooplankton among bacterial variables (Table 2). The correlation between bacterial cell size and environmental variables is shown in (Table 3). The concentration of mean cell size of free-living bacteria was positively correlated with conductivity, chloride, sulphate and total anions of strong acids, and negatively correlated with the surface water velocity and dissolved oxygen in the river Lakshmanatheertha, positively correlated with dissolved oxygen in the river Harangi, and with total anions of strong acids in the river Hemavathy among the environmental variables (Table 3).
Mean length of particle bound bacteria
Summary of the overall mean cell-lengths of particle bound bacteria was similar in the river Harangi (Mean 1.70 µm, range 1.10 - 2.69 µm), river Hemavathy (Mean 1.71 µm, range 1.13 - 3.32 µm), river Lokapavani (Mean 1.84 µm, range 1.18 - 3.27 µm), and in river Cauvery (Mean 1.85 µm, range 1.23 - 2.90 µm), but it was more and also significantly different in the river Lakshmanatheertha (Mean 2.05 µm, range 1.21 - 3.01 µm) (Table 1). Temporal variation of mean length of particle bound bacterial cells did not show any obvious seasonal pattern in all the five water courses during both the year of study (Fig. 3).
20022001
Mea
n L
engt
h of
Par
ticl
e B
ound
Bac
teri
a (µ
m)
2000
�
River Harangi
River Cauvery
River Lokapavani
River Hemavathy
River Lakshmantheertha
__
__
__
__
0
2
4
0
2
4
0
2
4
0
2
4
F M A M J J A S O N D J F M A M J J A S O N D J0
2
4
Figure 3. Seasonal changes in Particle Bound bacterial cell size in the surface water of river
Cauvery, Lokapavani, Hemavathy, Harangi and Lakshmantheertha,
February 2000 – January 2002.

Mahadevaswamy et al: Bacterial cell-size in the surface waters of river Cauvery and its upstream tributaires - 35 -
APPLIED ECOLOGY AND ENVIRONMENTAL RESEARCH 6(1): 29-47. http://www.ecology.uni-corvinus.hu ● ISSN 1589 1623
2008, Penkala Bt., Budapest, Hungary
Table 1. Summary of the overall mean cell-length of bacteria (µm) in the surface waters
from Rivers Lakshmanatheertha, Harangi, Hemavathy, Lokapavani and Cauvery: Seasonal
study, February 2000 to January 2002.
MLFLB (µm) MLPBB (µm)
Mean 02.56b 02.05b
Range 01.36 - 03.80 01.21 - 03.01
River Lakshmanatheertha
CV (%) 26 23
Mean 02.07a 01.70a
Range 01.22 - 03.24 01.10 - 02.69
River Harangi
CV (%) 25 23
Mean 02.02a 01.71a
Range 01.15 - 03.24 01.13 - 03.32
River Hemavathy
CV (%) 23 24
Mean 02.15a 01.84a
Range 01.49 - 03.55 01.18 - 03.27
River Lokapavani
CV (%) 24 26
Mean 02.17a 01.85a
Range 01.41 - 03.04 01.23 - 02.90
River Cauvery
CV (%) 20 19
Mean Values with different superscripts are significantly different (P<0.05, Student-Newman-Keuls test, after log10 transformation).
CV= Coefficient of Variation, MLFLB= Mean length of Free Living Bacteria, MLPBB= Mean length of Particle Bound Bacteria. In the river Lakshmanatheertha the mean cell-size of particle bound bacteria showed
correlations with abundance of free living bacteria, particle bound bacteria, and total bacteria, colony forming units, zooplankton and mean cell-length of free living bacteria. In river Hemavathy, the mean cell-size of particle bound bacteria was correlated with specific growth rate, zooplankton and mean length of free living bacteria. However, in other three water courses, the mean cell- length of particle bound bacteria correlated only with mean cell-length of free living bacteria among bacterial variables (Table 2). The concentration of mean cell size of particle bound bacteria was positively correlated with sulphate, phosphate and negatively with surface water velocity and dissolved oxygen in river Lakshmanatheertha, positively correlated with dissolved oxygen and negatively correlated with chlorophyll-a in river Harangi, positively correlated with chemical oxygen demand in river Hemavathy, dissolved oxygen, biological oxygen demand and chemical oxygen demand in river Lokapavani among the environmental variables (Table 3).
Percentage of free-living bacterial cells in each category
The overall percentage of free-living bacterial cells in each category was similar in the river Lakshmanatheertha (Mean 13.10, range 11.37 – 16.67 %), river Harangi (Mean 13.53, range 12.49 – 20.00 %), river Hemavathy (Mean 13.39, range 12.47 – 20.00 %), river Lokapavani (Mean 13.04, range 12.49 – 16.67 %), and in the river Cauvery (Mean 12.98, range 12.08 – 16.67 %). Notably, 11.37% in the river Lakshmanatheertha and 20.0% in the rivers Harangi and Hemavathy were the lowest and highest recorded percentage of free-living bacterial cells among the five water courses studied (Table 4).

Table 2. Relationships between mean cell-length of bacteria (µm) and other bacterial variables, February 2000 to January 2002
Sampling sites DC-
FLB
DC-
PBB
DC-TB CFUs %CCFUs CFUs
as % of
AODCs
SGR Phytoplankton Zooplankton Total
Plankton
ML-
FLB
ML-
PBB
Free Living Bacteria
River Lakshmanatheertha
0.56*** 0.51*** 0.56*** NS NS -0.40** NS NS 0.43** NS - 0.84***
River Harangi NS
NS NS NS NS NS NS NS NS NS - 0.84***
River Hemavathy NS
NS NS NS NS NS 0.43** NS 0.31* NS - 0.82***
River Lokapavani NS
NS NS NS NS NS NS NS NS NS - 0.85***
River Cauvery NS
NS NS NS NS NS NS NS -0.29* NS - 0.83***
Particle Bound Bacteria
River Lakshmanatheertha
0.40**
0.41** 0.41** 0.38* NS NS NS NS 0.36* NS 0.84*** -
River Harangi NS
NS NS NS NS NS NS NS NS NS 0.84*** -
River Hemavathy NS
NS NS NS NS NS 0.34* NS 0.29* NS 0.82*** -
River Lokapavani NS
NS NS NS NS NS NS NS NS NS 0.85*** -
River Cauvery NS
NS NS NS NS NS NS NS NS NS 0.83*** -
DC-FLB= Directly Counted Free Living Bacteria, DC-PBB= Directly Counted Particle Bound Bacteria, DC-TB= Directly Counted Total Bacteria, CFUs = Colony Forming Units, CCFUs =Chromogenic Colony forming Units, CFUs as % AODCs= Colony Forming Units as Percentage of Acridine Orange Direct Counts, SGR=Specific Growth Rate, ML-FLB= Mean Length of Free Living Bacteria, ML-PBB = Mean Length of Particle Bound Bacteria.
AP
PLIE
D E
CO
LO
GY
AN
D E
NV
IRO
NM
EN
TA
L R
ES
EA
RC
H 6(1): 29-47.
http://ww
w.ecology.uni-corvinus.hu ●
ISSN
1589 1623
2008, Penkala B
t., Budapest, H
ungary
Mahadevasw
amy et al: B
acterial cell-size in the surface waters of river C
auvery and its upstream tributaires
- 36 -

Table 3. Relationships between mean cell-length of bacteria (µm) and environmental variables, February 2000 to January 2002
Sampling Sites pH
(F)
pH
(L)
T
e
m
p
C
o
n
d
T
u
r
b
S
W
V
R
F
D
O
B
O
D
C
O
D
CO2 Cl2 NO3 SO4 T
A
S
A
Cal PO4 T
S
S
P
O
M
Chl-a
Free Living Bacteria
River Lakshmanatheertha
NS NS NS 0.30*
NS -0.43 **
NS -0.32 *
NS NS NS 0.30*
NS 0.31*
0.34 *
NS NS NS NS NS
River Harangi NS
NS NS NS NS NS NS 0.36 *
NS NS NS NS NS NS NS NS NS NS NS NS
River Hemavathy NS
NS NS NS NS NS NS NS NS NS NS NS NS NS 0.31 *
NS NS NS NS NS
River Lokapavani NS
NS NS NS NS NS NS NS NS NS NS NS NS NS NS NS NS NS NS NS
River Cauvery NS
NS NS NS NS NS NS NS NS NS NS NS NS NS NS NS NS NS NS NS
Particle Bound Bacteria
River Lakshmanatheertha
NS NS NS NS NS -0.33 *
NS -0.32 *
NS NS NS NS NS 0.36*
NS NS 0.29*
NS NS NS
River Harangi NS
NS NS NS NS NS NS 0.32 *
NS NS NS NS NS NS NS NS NS NS NS -0.29*
River Hemavathy NS
NS NS NS NS NS NS NS NS 0.33 *
NS NS NS NS NS NS NS NS NS NS
River Lokapavani NS
NS NS NS NS NS NS 0.40 **
0.32 *
0.28 *
NS NS NS NS NS NS NS NS NS NS
River Cauvery NS
NS NS NS NS NS NS NS NS NS NS NS NS NS NS NS NS NS NS NS
pH (F) = pH measured in the field, pH (L) = pH measured in the laboratory, Temp= Temperature, Cond= Conductivity, Turb= Turbidity, SWV= Surface Water Velocity, RF= Rainfall, DO= Dissolved Oxygen measured in the Field, BOD= Biological Oxygen Demand, COD= Chemical Oxygen Demand, CO2= Free Carbon di-Oxide, Cl2= Chloride, NO3=Nitrate, SO4= Sulphate, TASA= Total Anions of Strong Acids, Cal= Calcium, PO4= Inorganic Phosphate, TSS= Total Suspended Solids, POM= Particulate Organic Matter, Chl-a=Chlorophyll-a.
AP
PLIE
D E
CO
LO
GY
AN
D E
NV
IRO
NM
EN
TA
L R
ESE
AR
CH
6(1): 29-47. http://w
ww
.ecology.uni-corvinus.hu ● ISS
N 1589 1623
2008, P
enkala Bt., B
udapest, Hungary
Mahadevasw
amy et al: B
acterial cell-size in the surface waters of river C
auvery and its upstream tributaires
- 37 -

Mahadevaswamy et al: Bacterial cell-size in the surface waters of river Cauvery and its upstream tributaires - 38 -
APPLIED ECOLOGY AND ENVIRONMENTAL RESEARCH 6(1): 29-47. http://www.ecology.uni-corvinus.hu ● ISSN 1589 1623
2008, Penkala Bt., Budapest, Hungary
Table 4. Summary of the overall percentage of bacterial cells in each size category (%) in
the surface waters from River Lakshmanatheertha, Harangi, Hemavathy, Lokapavani and
Cauvery: Seasonal study, February 2000 to January 2002.
Microbial variables
River Lakshmanatheertha
River Harangi
River Hemavathy
River Lokapavani
River Cauvery
Mean Range Mean Range Mean Range Mean Range Mean Range
FLB (%) 13.10a 11.37 – 16.67
13.53a 12.49 – 20.00
13.39a 12.47 – 20.00
13.04a 12.49 – 16.67
12.98a 12.08 – 16.67
PBB (%) 13.39a 12.40 – 20.00
14.63b 12.49 – 20.00
14.39b 12.49 – 20.00
13.83ab 12.25 – 16.67
13.33a 12.34 – 20.00
Mean Values with superscripts are significantly different (P<0.05, Student-Newman-Keuls test, after log10 transformation).
Season wise grouped data revealed that, the percentage of free-living bacterial cells
in each size category was more and also significantly different in summer season as compared to rainy and winter seasons, both of which were similar in all the five rivers, during second year of study only (Table 5). The most frequent free-living bacterial cell-size categories in all the five water courses were 0.75 - 7.00 µm. Thus in river Lakshmanatheertha the 1.06 - 3.00 µm size categories were most frequent on 50 times out of 50 sampling days, followed by 7.00 µm (49 times), 6.00 µm (47 times), 4.25 µm (45 times) and 0.75 µm (42 times). In the river Harangi, the size category 1.06 – 3.00 µm, occurred all the 50 sampling days, followed by 0.75 µm (48 times), 4.25 µm (46 times), 7.00 µm (42 times) and 6.00 µm (38 times). In the river Hemavathy, the size category, 1.06 – 2.125 µm, occurred all the 50 sampling days, followed by 3.00 µm (49 times), 0.75 µm (47 times), 4.25 µm (45 times), 7.00 µm (43 times) and 6.00 µm (42 times). In the river Lokapavani, the most frequent category, 1.06 – 2.125 µm, occurred all the 50 times, followed by 3.00 - 4.25 µm (49 times), 0.75 µm (48 times), 7.00 µm (47 times) and 6.00 µm (43 times). Similarly, in the river Cauvery, the most frequent size category, 1.06 – 3.00 µm, occurred all the 50 sampling days, followed by 4.25 µm (49 times), 0.75 µm (48 times), 7.00 µm (47 times) and 6.00 µm (43 times). Whereas, the size category 6.00 µm occurs least in the rivers Harangi, Hemavathy, Lokapavani and Cauvery, while, the size category 0.75 µm was the least in the river Lakshmanatheertha (Table 7).
Percentage of particle bound bacterial cells in each category
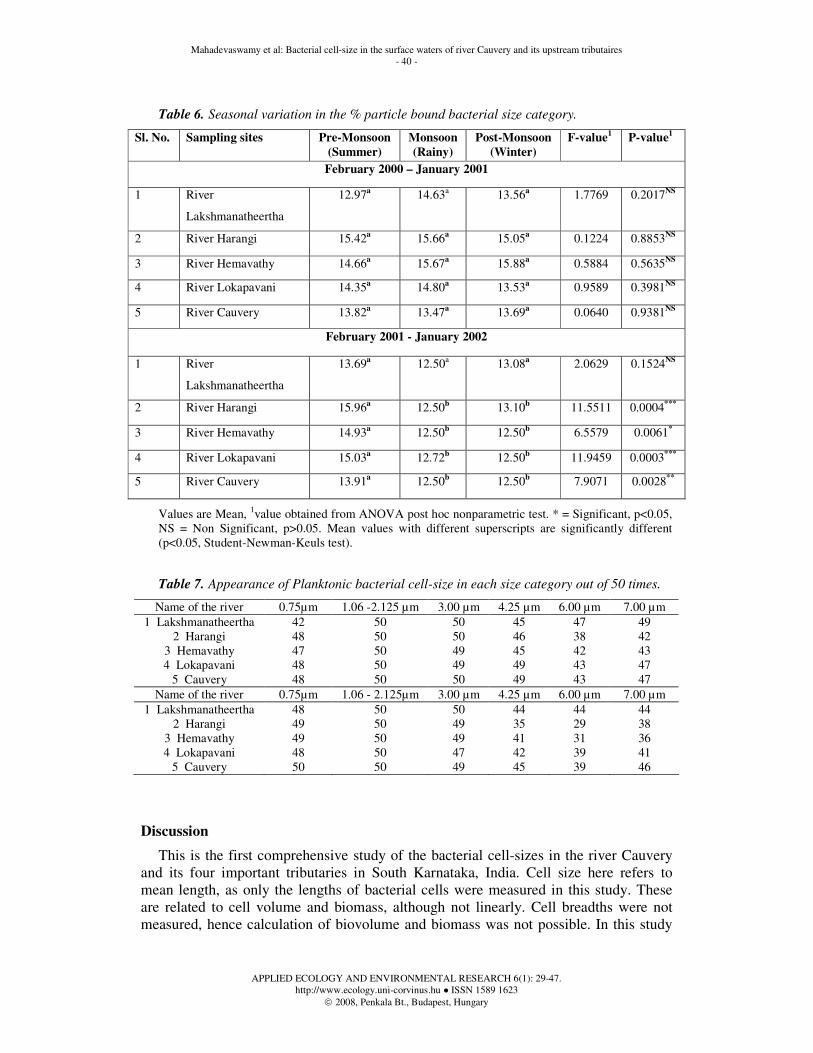
The overall percentage of particle bound bacterial cells in each category was similar in the river Lakshmanatheertha (Mean 13.39, range 12.40 – 20.00 %), river Lokapavani (Mean 13.83, range 12.25 – 16.67 %), and in river Cauvery (Mean 13.33, range 12.34 – 20.00 %), but was more and also significantly different in the river Harangi (Mean 14.63, range 12.49 – 20.00 %), and in river Hemavathy (Mean 14.39, range 12.49 – 20.00 %). However, the percentage of particle bound bacterial cells was similar in the river Harangi, Hemavathy and in river Lokapavani also. The 12.25 % in the river Lokapavani and 20.0% in the rivers Lakshmanatheertha, Harangi, Hemavathy and Cauvery were the lowest and highest recorded percentage of particle bound bacterial cells among the five water courses studied (Table 4). Season wise grouped data revealed that, except in the river Lakshmanatheertha, the percentage of particle bound bacterial cells in each size category was more and also significantly different during summer

Mahadevaswamy et al: Bacterial cell-size in the surface waters of river Cauvery and its upstream tributaires - 39 -
APPLIED ECOLOGY AND ENVIRONMENTAL RESEARCH 6(1): 29-47. http://www.ecology.uni-corvinus.hu ● ISSN 1589 1623
2008, Penkala Bt., Budapest, Hungary
season as compared to rainy and winter seasons in other water courses studied during second year of study only (Table 6).
The distribution of particle-bound bacteria between the size categories on each sampling day is given in the Table 5. All the particle bound bacterial size categories such as 0.75 - 7.00 µm occurs more frequently in all the five water courses. Thus in river Lakshmanatheertha the 1.06 - 3.00 µm size categories was most frequent on 50 times out of 50 sampling days, followed by 0.75 µm (48 times), 4.25 µm to 7.00 µm (44 times). In river Harangi, 1.06 – 2.125 µm size category, occurred all the 50 sampling days, followed by 0.75 µm and 3.00 µm (49 times), 7.00 µm (38 times), 4.25 µm (35 times) and 6.00 µm (29 times). In river Hemavathy, 1.06 – 2.125 µm, occurred all the 50 sampling days, followed by 0.75 µm and 3.00 µm (49 times), 4.25 µm (41 times), 7.00 µm (36 times) and 6.00 µm (31 times). Similarly in river Lokapavani, 1.06 – 2.125 µm, occurred all the 50 sampling days, followed by 0.75 µm (48 times), 3.00 µm (47 times), 4.25 µm (42 times), 7.00 µm (41 times) and 6.00 µm (39 times). In river Cauvery, the most frequent size category, 0.75 – 2.125 µm, occurred all the 50 sampling days, followed by 3.00 µm (49 times), 7.00 µm (46 times), 4.25 µm (45 times), and 6.00 µm (39 times). Of particular size category 6.00 µm occurred least time in all the five water courses (Table 7).
Table 5. Seasonal variation in the % free living bacterial size category.
Sl.
No.
Sampling sites Pre-
Monsoon
(Summer)
Monsoon
(Rainy)
Post-
Monsoon
(Winter)
F-value1 P-value1
February 2000 - January 2001
1 River Lakshmanatheertha 12.84a 12.41a 13.72a 2.529 0.1021NS
2 River Harangi 15.21a 13.34a 14.19a 1.734 0.1989NS
3 River Hemavathy 13.93a 13.52a 14.00a 0.1617 0.8524NS
4 River Lokapavani 13.63a 13.47a 12.50a 1.7903 0.1894NS
5 River Cauvery 12.90a 13.17a 13.07a 0.1858 0.8317NS
February 2001 - January 2002
1 River Lakshmanatheertha 14.14a 12.70b 12.74b 6.490 0.0064*
2 River Harangi 13.17a 12.50b 12.50b 4.2233 0.0287*
3 River Hemavathy 13.53a 12.69b 12.50b 5.8298 0.0097*
4 River Lokapavani 13.61a 12.50b 12.50b 11.7183 0.0004***
5 River Cauvery 13.76a 12.50b 12.50b 3.5685 0.0463*
Values are Mean, 1value obtained from ANOVA post hoc nonparametric test. * = Significant, p<0.05, NS = Non Significant, p>0.05. Mean values with different superscripts are significantly different (p<0.05, Student-Newman-Keuls test).
Mahadevaswamy et al: Bacterial cell-size in the surface waters of river Cauvery and its upstream tributaires - 40 -
APPLIED ECOLOGY AND ENVIRONMENTAL RESEARCH 6(1): 29-47. http://www.ecology.uni-corvinus.hu ● ISSN 1589 1623
2008, Penkala Bt., Budapest, Hungary
Table 6. Seasonal variation in the % particle bound bacterial size category.
Sl. No. Sampling sites Pre-Monsoon
(Summer)
Monsoon
(Rainy)
Post-Monsoon
(Winter)
F-value1 P-value1
February 2000 – January 2001
1 River
Lakshmanatheertha
12.97a 14.63a 13.56a 1.7769 0.2017NS
2 River Harangi 15.42a 15.66a 15.05a 0.1224 0.8853NS
3 River Hemavathy 14.66a 15.67a 15.88a 0.5884 0.5635NS
4 River Lokapavani 14.35a 14.80a 13.53a 0.9589 0.3981NS
5 River Cauvery 13.82a 13.47a 13.69a 0.0640 0.9381NS
February 2001 - January 2002
1 River
Lakshmanatheertha
13.69a 12.50a 13.08a 2.0629 0.1524NS
2 River Harangi 15.96a 12.50b 13.10b 11.5511 0.0004***
3 River Hemavathy 14.93a 12.50b 12.50b 6.5579 0.0061*
4 River Lokapavani 15.03a 12.72b 12.50b 11.9459 0.0003***
5 River Cauvery 13.91a 12.50b 12.50b 7.9071 0.0028**
Values are Mean, 1value obtained from ANOVA post hoc nonparametric test. * = Significant, p<0.05, NS = Non Significant, p>0.05. Mean values with different superscripts are significantly different (p<0.05, Student-Newman-Keuls test).
Table 7. Appearance of Planktonic bacterial cell-size in each size category out of 50 times.
Name of the river 0.75µm 1.06 -2.125 µm 3.00 µm 4.25 µm 6.00 µm 7.00 µm 1 Lakshmanatheertha 42 50 50 45 47 49
2 Harangi 48 50 50 46 38 42 3 Hemavathy 47 50 49 45 42 43 4 Lokapavani 48 50 49 49 43 47
5 Cauvery 48 50 50 49 43 47 Name of the river 0.75µm 1.06 - 2.125µm 3.00 µm 4.25 µm 6.00 µm 7.00 µm
1 Lakshmanatheertha 48 50 50 44 44 44 2 Harangi 49 50 49 35 29 38
3 Hemavathy 49 50 49 41 31 36 4 Lokapavani 48 50 47 42 39 41
5 Cauvery 50 50 49 45 39 46
Discussion
This is the first comprehensive study of the bacterial cell-sizes in the river Cauvery and its four important tributaries in South Karnataka, India. Cell size here refers to mean length, as only the lengths of bacterial cells were measured in this study. These are related to cell volume and biomass, although not linearly. Cell breadths were not measured, hence calculation of biovolume and biomass was not possible. In this study

Mahadevaswamy et al: Bacterial cell-size in the surface waters of river Cauvery and its upstream tributaires - 41 -
APPLIED ECOLOGY AND ENVIRONMENTAL RESEARCH 6(1): 29-47. http://www.ecology.uni-corvinus.hu ● ISSN 1589 1623
2008, Penkala Bt., Budapest, Hungary
bacterial cell size (mean length) and size category distribution was measured over a period of two years (Feb. 2000 – Jan. 2002). The size of bacteria is an important trait in the predator-prey relationship of aquatic bacteria and bacterivorous protests. Grazing by bacterivorous protests is size selective [16 and 41] and thus small and large bacteria may have a refuge from protozoan grazing. Filament formation or permanent filamentous growth is one highly effective, size dependent grazing defense mechanism of aquatic bacteria [19 and 20]. The initial hypothesis that the four upstream tributaries are similar to each other in having similar mean cell-lengths, but are markedly different from that of main river Cauvery was rejected, because the mean cell-length of planktonic bacteria in the river Lakshmanatheertha was more and also significantly different than the remaining four water courses studied. The low level of water, maximum anthropogenic activities at the sampling spot, surface algal bloom, discharge of sewage, agricultural wastes and other effluents contamination and eutrophic nature of the river, might be the reason for increased mean bacterial cell-lengths in the river Lakshmanatheertha. Similarly, higher mean cell-length of planktonic bacteria was reported from an artificial lake in tropical Cameron, which actually receives considerable amount of untreated waste waters [25]. Further, the planktonic bacterial cell-size was high during low water [1]. The temporal variation in the mean cell-length of free-living bacteria showed seasonal pattern with smaller cells in winter than in summer in all the five rivers (Fig 2). Thus, cell-size was measured, because small size has been associated with stress and starvation [49 and 30].
Generally, season wise grouped data of all the five rivers revealed no seasonal variation in the mean length of both free-living and particle bound bacterial cells, except, in the river Lakshmanatheertha during the second year of study, where the mean cell-length of free-living bacteria was significantly less in winter than in rainy and summer seasons. This may be due to physiological stress caused by seasonal environmental changes or variations in the supply of food by phytoplankton and also in the grazing pressure from higher trophic levels [48 and 9].
The mean cell-lengths of planktonic bacteria with other microbial variables showed significant positive correlation with the abundance of bacterioplankton in the river Lakshmanatheertha. This implies that, higher the bacterial abundance higher will be the mean cell-length, which may be because of low level of water and addition of sewage, agricultural run-off and other untreated effluent caused the growth of algal bloom, responsible for eutrophic condition of water [8 and 28]. However, the negative correlation between mean cell-length of free-living bacteria and CFUs as % of AODCs in the river Lakshmanatheertha, may be because all the viable bacteria are not capable to grow on the artificial nutrient media employed under laboratory conditions to form colonies or perhaps most of these bacteria are dead [34, 40 and 37]. In the rivers Lakshmanatheertha and Hemavathy, the mean cell-length of bacteria was positively correlated with zooplankton. Similarly, a significant positive correlation was noticed between bacterial cell-size and zooflagellates in the water column of Sep reservoir, pelagic and Benthic [7, 22 and 26] ecosystems. However, in the river Cauvery, the mean cell-length of free-living bacteria was negatively correlated with zooplankton. Zooplanktons are recognized as being the main consumers of bacteria in the aquatic ecosystem. Several studies have revealed that, grazing by protists or metazoa play a dominant factor controlling the bacterial cell mortality [47]. Further, the mean cell-length of bacteria in the river Hemavathy showed positive correlation with the specific

Mahadevaswamy et al: Bacterial cell-size in the surface waters of river Cauvery and its upstream tributaires - 42 -
APPLIED ECOLOGY AND ENVIRONMENTAL RESEARCH 6(1): 29-47. http://www.ecology.uni-corvinus.hu ● ISSN 1589 1623
2008, Penkala Bt., Budapest, Hungary
growth rate of bacterioplankton. Similar observation was made in the Holderness Drain of North-East England [49].
The examination of correlation between mean cell-size of bacteria and environmental variables showed the presence of more correlations in river Lakshmanatheertha, when compared to other four water courses studied (Table 6). Hence, in the river Lakshmanatheertha, environmental variables may also have an important role for affecting the changes in the cell-size of planktonic bacteria. Parnthaler, et al., [36] and Bergstein Ben-Dan, et al. [6] suggested several chemical and physical factors that might be influencing bacterial succession and changes in cell-size spectra in aquatic environments. Similarly, in the river Lakshmanatheertha, lesser DO concentration was noticed and the water in this river was slightly anoxic, due to pollution load and eutrophic condition. Hence, in the river Lakshmanatheertha the bacterial cell-size was negatively correlated with dissolved oxygen. This probably implies that, lesser the dissolved oxygen concentration more will be the bacterial cell-size [10].
The different distribution of the cell-size category in all the five water courses might be because of several chemical and physical factors [36 and 6], but the effects of predation in the natural environment are difficult to demonstrate [9]. However, based on recent intercomparison of cell-size, it would appear that much of the reported variation in bacterial cell-size is related to methodology which varies among the investigators [10]. Several studies have revealed grazing by protists as the dominant factor controlling the bacterial cell-size distribution [47]. Notable, lowest (11.37%) percentage of free-living bacterial cells in each size category in the river Lakshmanatheertha and lowest (12.25%) percentage of particle bound bacterial cells in each size category in the river Lokapavani was the lowest recorded values among five water courses studied (Table 6). The decrease in the percentage of bacterial cell-size may be due to grazing by protozoan or even larger predators such as rotifers [14 and 39] or due to nutrient poor environment [30]. However, the highest (20.0%) percentage of free-living bacterial cells in each size category in the rivers Harangi and Hemavathy and the highest (20.0%) percentage of particle bound bacterial cells in each size category in the rivers Lakshmanatheertha, Harangi, Hemavathy and Cauvery were the highest recorded values among the five water courses studied (Table 6). Large cell-size category in these water courses could have several explanations, viz. species shifts, reduced respiratory metabolism, reduced predation on large cells or greater availability of nutrients or organic substrate for growth due to anthropogenic activities [10].
In general, the more and significantly different seasonal variation in the percentage of bacterial cells in each size category during summer season in all the five water courses (Table 6) may be due to annual rain deficit, lack of water renewal, surface algal patches, sewage and other anthropogenic contaminations enriched nutrient level. There are only few supportive evidences, which explain that, dominance of smaller cells in nutrient poor environment to dominance of larger cells in nutrient rich environment [43 and 30]. Further, a pronounced variation in cell-size of bacteria with respect to larger cells during summer season [25] was noticed. The ups and downs in the bacterial cell-size in different season may be due to variation in the food supply and in the grazing pressure from higher trophic levels [14 and 26]. Further, bacteria are often the most stable component of planktonic communities. Refusing from grazing is one of the possible mechanisms buffering bacterioplankton against strong seasonal fluctuation in cell-size in both marine and fresh water habitats [29]. However, bacterial cell-sizes

Mahadevaswamy et al: Bacterial cell-size in the surface waters of river Cauvery and its upstream tributaires - 43 -
APPLIED ECOLOGY AND ENVIRONMENTAL RESEARCH 6(1): 29-47. http://www.ecology.uni-corvinus.hu ● ISSN 1589 1623
2008, Penkala Bt., Budapest, Hungary
respond to flagellate grazing with marked bidirectional shift in their size distribution [36 and 19].
The extent of the potential dependence of bacterial cell-size on environmental (water quality) variables was further investigated by step-wise multiple regression analysis. The results of all the five rivers are given in Table 8. The regression analysis revealed that, several key environmental variables were potentially responsible for much of the variation in bacterial cell-size, notable are SO4, DO, SWV, PO4, TASA, BOD, COD, Conductivity, Chl-a, and Chloride. Further, as many as 1-8 positive correlations were found to be affecting the bacterial cell-sizes in the present study. However, no environmental variables entered the regression equation in the river Lokapavani with respect to mean length of free-living bacteria and with both the (flb and pbb) bacterial cell-size in the river Cauvery. Similarly, several environmental variables such as PO4, Chloride, COD, SO4 and BOD were directly involved in the observed changes in the cell-size of planktonic bacteria in a flooded Sep reservoir of France [26]. The other reason for such dependence of bacterial cell-size may be due to substrate availability, nutrients, because bacterial growth in terms of size probably maintained at a maximum level by a density dependent factors such as carbon or other nutrients [11 and 15].
The 1992-1994 data from river Hull, Beverly and Barmston Drain and Holderness Drain [49], revealed that, physiological stress indicated by the presence of small cells was perhaps not the major cause of temporal variation in bacterial cell-size in river Hull and Beverly and Barmston Drain and they were less affected by the environmental factors. But it was quite opposite in the Holderness Drain, where bacterial variables were largely related to cell-length of planktonic bacteria and they might have influenced temporal variation of bacteria. The interrelationship between the cell-size of planktonic bacteria and environmental variables also showed the presence of many correlations in Holderness Drain. Particularly the environmental constraint like low pH might have stressed the bacterial population which resulted in less bacterial activity (Vmax and Vmax per bacterium), CFUs, CFUs as % of AODCs etc. However, in the river Hull and Beverly and Barmston Drain there was no evidence of environmental variables causing stress in sense of smaller cell-size [49]. Similarly, in the present investigation the mean cell-lengths of planktonic bacteria measured from 2000 to 2002, were more and also significantly different in the river Lakshmanatheertha when compared to rivers Cauvery, Harangi, Hemavathy and Lokapavani. Further, in the river Lakshmanatheertha, the mean cell-length of planktonic bacteria showed more correlations with environmental variables when compared to other four water courses studied (Table 6). Similar findings were noticed in the river Holderness Drain [49], and in the down stream tributaries of river Cauvery, such as river Arkavathy and river Shimsha (Unpublished data of Harsha from our laboratory). In contrast to this in the river Lokapavani the cell-size of free-living bacteria and the cell-size of both free-living and particle bound bacterial cells in the river Cauvery did not show any correlation with the environmental variables, which shows probably that no evidence of environmental variables, participating in the control of bacterial cell-size similar to the findings of Yamakanamardi [49] in river Hull and Beverley and Barmston Drain, and in the river Cauvery and its down steam tributaries like Suvarnavathy, Shimsha and Kapila.

Mahadevaswamy et al: Bacterial cell-size in the surface waters of river Cauvery and its upstream tributaires - 44 -
APPLIED ECOLOGY AND ENVIRONMENTAL RESEARCH 6(1): 29-47. http://www.ecology.uni-corvinus.hu ● ISSN 1589 1623
2008, Penkala Bt., Budapest, Hungary
Table 8. Results of stepwise multiple regression analysis between mean cell-length of
bacteria (µm) and environmental variables,in the river, Lakshmanatheertha, Harangi,
Hemavathy, Lokapavani and Cauvery, February 2000 to January 2002.
Bacterioplankton variables Environmental variables
River Lakshmanatheertha Mean Length of Free Living
Bacteria
Mean Length of Particle Bound Bacteria
River Harangi Mean Length of Free Living
Bacteria
Mean Length of Particle Bound Bacteria
River Hemavathy
Mean Length of Free Living Bacteria
Mean Length of Particle Bound Bacteria
River Lokapavani Mean Length of Free Living
Bacteria
Mean Length of Particle Bound Bacteria
River Cauvery
Mean Length of Free Living Bacteria
Mean Length of Particle Bound Bacteria
SWV (-), SO4 (+), (r2=0.35, F=12.86, P<0.001), COND (+), DO
(-), CL2 (+), TASA (+). SO4 (+), DO (-), (r2=0.23, F=7.17, P<0.005), PO4 (+), SWV (-).
DO (+), (r2=0.13, F=7.29, P<0.05). DO (+), (r2=0.10, F=5.48, P<0.05), Chl-a (-).
TASA (+), (r2=0.09, F=4.95, P<0.05). COD (+), (r2=0.11, F=5.76, P<0.05).
No environmental variables entered in the regression equation. DO (+), (r2=0.16, F=9.0, P<0.005), COD (+), BOD (+).
No environmental variables entered in the regression equation. No environmental variables entered in the regression equation.
Environmental (independent) variables in the final regression equation (P in=0.05, P out=0.1) are shown: multiple coefficients of determinations (r2) and overall F and P values for each equation are given in the parenthesis. Environmental variables which were not in the final equation but which are correlated (P<0.05) with the relevant Bacterioplankton variables are then listed in order of decreasing magnitude of correlation coefficient; the sign of the correlation is indicated in the parenthesis. The environmental variables were; COND=Conductivity, DO= Dissolved Oxygen, BOD= Biological Oxygen Demand, COD=Chemical Oxygen Demand, Cl2 =Chloride, Chl-a= Chlorophyll-a, TASA= Total Anions of Strong Acids, SO4 = Sulphate, SWV= Surface Water Velocity, PO4=Phosphate. However, the mean cell-lengths of planktonic bacteria were similar in the river
Cauvery and its down stream tributaries such as Kapila, Suvarnavathy, Shimsha and Arkavathy. Such variation may be due to the climatic condition, place to place geological variation, nutrient availability and grazing pressure by higher trophic level [26 and 31].
Thus, it could be concluded that the mean cell-length of planktonic bacteria in all these five watercourses studied, were controlled largely by environmental variables, which is in agreement with the other studies such as, low land water courses of north-east England [49], in a flooded Sep reservoir of France [26], in the hypertrophic Hamboldt Lake and Oligotrophic Redberry lake in Sasktchewan Canada [44], and in sediments of Botany bay in Sydney, Australia which is fed by two rivers, the Cooks river and the Georges river [31]. Further, the strength of the relationship between the
Mahadevaswamy et al: Bacterial cell-size in the surface waters of river Cauvery and its upstream tributaires - 45 -
APPLIED ECOLOGY AND ENVIRONMENTAL RESEARCH 6(1): 29-47. http://www.ecology.uni-corvinus.hu ● ISSN 1589 1623
2008, Penkala Bt., Budapest, Hungary
overall mean cell-length of planktonic bacteria and environmental variables in the river Lakshmanatheertha with more correlations suggests that, environmental variables have retained a degree of bottom-up (nutrients) control of variation in bacterioplankton cell-size. On the other hand, the massive input of allochthonous bacteria from land, from sewage water or due to rain or from agricultural field and other anthropogenic inputs in the rivers, may also influence the magnitude and seasonal variation of the abundance of heterotrophic bacterioplankton [8 and 42]. This may be the reason for a strong positive correlation noticed between the bacterial abundance and mean cell-length of planktonic bacteria in the river Lakshmanatheertha.
Acknowledgements. The Authors are thankful to the Chairman, DoS in Zoology for the facilities provided and Department of Science and Technology (DST), New Delhi for financial assistance.
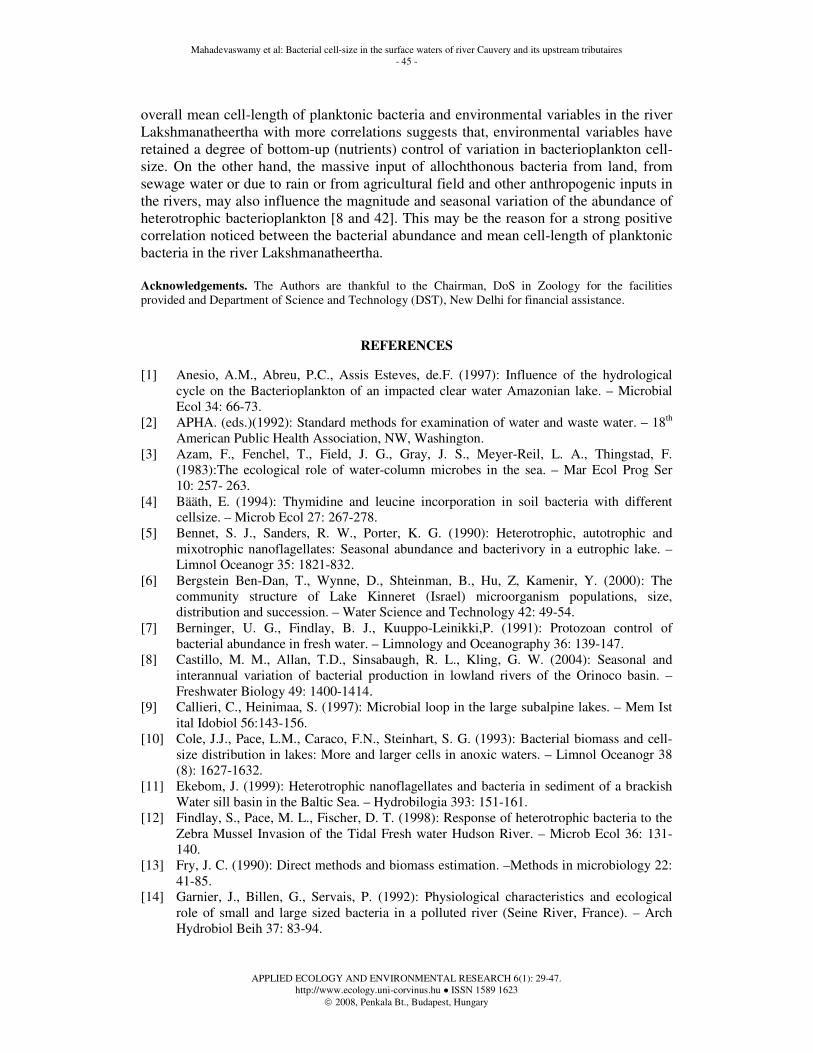
REFERENCES
[1] Anesio, A.M., Abreu, P.C., Assis Esteves, de.F. (1997): Influence of the hydrological cycle on the Bacterioplankton of an impacted clear water Amazonian lake. – Microbial Ecol 34: 66-73.
[2] APHA. (eds.)(1992): Standard methods for examination of water and waste water. – 18th American Public Health Association, NW, Washington.
[3] Azam, F., Fenchel, T., Field, J. G., Gray, J. S., Meyer-Reil, L. A., Thingstad, F. (1983):The ecological role of water-column microbes in the sea. – Mar Ecol Prog Ser 10: 257- 263.
[4] Bääth, E. (1994): Thymidine and leucine incorporation in soil bacteria with different cellsize. – Microb Ecol 27: 267-278.
[5] Bennet, S. J., Sanders, R. W., Porter, K. G. (1990): Heterotrophic, autotrophic and mixotrophic nanoflagellates: Seasonal abundance and bacterivory in a eutrophic lake. –Limnol Oceanogr 35: 1821-832.
[6] Bergstein Ben-Dan, T., Wynne, D., Shteinman, B., Hu, Z, Kamenir, Y. (2000): The community structure of Lake Kinneret (Israel) microorganism populations, size, distribution and succession. – Water Science and Technology 42: 49-54.
[7] Berninger, U. G., Findlay, B. J., Kuuppo-Leinikki,P. (1991): Protozoan control of bacterial abundance in fresh water. – Limnology and Oceanography 36: 139-147.
[8] Castillo, M. M., Allan, T.D., Sinsabaugh, R. L., Kling, G. W. (2004): Seasonal and interannual variation of bacterial production in lowland rivers of the Orinoco basin. – Freshwater Biology 49: 1400-1414.
[9] Callieri, C., Heinimaa, S. (1997): Microbial loop in the large subalpine lakes. – Mem Ist ital Idobiol 56:143-156.
[10] Cole, J.J., Pace, L.M., Caraco, F.N., Steinhart, S. G. (1993): Bacterial biomass and cell-size distribution in lakes: More and larger cells in anoxic waters. – Limnol Oceanogr 38 (8): 1627-1632.
[11] Ekebom, J. (1999): Heterotrophic nanoflagellates and bacteria in sediment of a brackish Water sill basin in the Baltic Sea. – Hydrobilogia 393: 151-161.
[12] Findlay, S., Pace, M. L., Fischer, D. T. (1998): Response of heterotrophic bacteria to the Zebra Mussel Invasion of the Tidal Fresh water Hudson River. – Microb Ecol 36: 131-140.
[13] Fry, J. C. (1990): Direct methods and biomass estimation. –Methods in microbiology 22: 41-85.
[14] Garnier, J., Billen, G., Servais, P. (1992): Physiological characteristics and ecological role of small and large sized bacteria in a polluted river (Seine River, France). – Arch Hydrobiol Beih 37: 83-94.

Mahadevaswamy et al: Bacterial cell-size in the surface waters of river Cauvery and its upstream tributaires - 46 -
APPLIED ECOLOGY AND ENVIRONMENTAL RESEARCH 6(1): 29-47. http://www.ecology.uni-corvinus.hu ● ISSN 1589 1623
2008, Penkala Bt., Budapest, Hungary
[15] Gasol, J. M., Vaque, D. (1993): Lack of coupling between heterotrophic nanoflagellates and bacteria: A general phenomenon across aquatic systems? – Limnol Oceanogr 38: 657-665.
[16] González, J. M., Sherr, E. B., Sherr B. F. (1990): Size selective grazing on bacteria by natural assemblages of estuarine flagellates and cillates. – Appl Environ Microbiol 56: 583-589.
[17] Hadas, O., Pinkas, R., Albert-Diez, C., Bloem, J., Cappenberg, T., Berman, T. (1990): The effect of detrial addition on the development of nanoflagellates and bacteria in lake Kinneret. – J Plankton Res 12 (1): 185-199.
[18] Hahn, M. W., Höfle, M. G. (1999): Flagellate predation on a bacterial model community: Interplay of size-selective grazing, specific bacterial cell size, and bacterial community composition. – Appl Environ Microbiol 65: 4863-4872.
[19] Hahn, M. W., Moore, E. R. B., Höfle, M. G. (1999): Bacterial filament formation, a defense mechanism against flagellate grazing, is growth rate controlled in bacteria of different phyla. – Appl Environ Microbiol 65: 25-35.
[20] Hahn, M. W., Moore, E. R. B., Höfle, M. G. (2000): Role of Microcolony formation in the protistan grazing defense of the aquatic bacterium Pseudomonas sp. MWH1. – Microb Ecol 39: 175-185.
[21] Hahn M. W., Höfle M. G. (2001): Grazing of protozoa and its effect on populations of aquatic bacteria. – FEMS Microbiol. Ecol 35: 113-121.
[22] Hwang,S.J., Heath,R.T, (1997): Bacterial productivity and protistan bacterivory in coastal and offshore communities of lake Erie. – Can J Fish Aquat Sci 54: 788-799.
[23] Hobbie, J. E., Daley, R., Jasper, S. (1977): Use of Nuclepore filters for counting bacteria by epifluorescence microscopy. – Appl Environ Microbiol 33: 1225-1228.
[24] Hood, M.A., McDonell, M.T.(1987): Distribution of ultra-microbacteria in a Gulf Coast estuary and induction of ultra-microbacteria. – Microbial Ecology 14: 113- 127.
[25] Jugnia, L.B., Tadonleke,R.D., Simi-Ngando,T., Foto,S., Kemka, N. (1998): Short-term variations of bacterioplankton in a tropical lake. – Hydrobiologia 385: 113-119.
[26] Jugnia, L. B., Tadonléké, R. D., Simi-Ngando, T., Devaux, J. (2000): The microbial food web in the recently flooded sep reservoir: diel fluctuations in bacterial biomass and metabolic activity in relation to phytoplankton and flagellate grazers. – Microb Ecol 40: 317-329.
[27] Kielleberg, S., Hermansson, M., Mårdén, P. (1987): The transient phase between growth and non growth heterotrophic bacteria, with emphasis on the marine environment. – Annual Reviews in Microbiology 41: 25-49.
[28] Klaus Gocke, Carlos Hernandez, Hanna Giesenhagen, Hans-Georg Hoppe. (2004): Seasonal variations of bacterial abundance and biomass and their relation to phytoplankton in the hypertrophic tropical lagoon Cienaga Grande de Santa Marta, Columbia. – Journal of plankton research 26: 1429-1439.
[29] Klaus Jurgens, Hans Gude (1994): The potential importance of grazing-resistant bacteria in planktonic systems. – Mar Ecol Prog Ser 112: 169-188.
[30] Kristina Samuelsson, Johnny Berglund, Pia Haccky, Agneta Andersson. (2002): Structural changes in an aquatic microbial food web caused by inorganic nutrient addition. – Aquat Microb Ecol 29: 29-38.
[31] Lee, W. J., Patterson, D. J. (2002): Abundance and biomass of heterotrophic flagellates, and factors controlling their abundance and distribution in sediments of Botany Bay. – Microb Ecol 43: 467-481.
[32] Letarte, Y., Pinel-Alloul, B. (1991): Relationships between bacterioplankton production and limnological variables: necessity of bacterial size considerations. – Limnol. Oceanogr 36:1208-1216.
[33] May, K. R. (1965): A new graticule for particle counting and sizing. – Journal of Scientific Instruments 42: 500-501.

Mahadevaswamy et al: Bacterial cell-size in the surface waters of river Cauvery and its upstream tributaires - 47 -
APPLIED ECOLOGY AND ENVIRONMENTAL RESEARCH 6(1): 29-47. http://www.ecology.uni-corvinus.hu ● ISSN 1589 1623
2008, Penkala Bt., Budapest, Hungary
[34] Maki, J. S., Lacroix, S. J., Hopkins, B. S., Staley, J.T. (1986): Recovery and diversity of heterotrophic bacteria from chlorinated drinking waters. – Appl Environ Microbiol 51: 1047-1055.
[35] Norusis, M.J. (1993): SPSS for Windows: Base System User’s Guide, Release 6.0. – SPSS Inc, Chicago: 828pp.
[36] Pernthaler, J. (1996): Top down effects on the size-biomass distribution of a fresh water bacterioplankton community. – Aquat Microb Ecol 10: 255-263.
[37] Perry, J.J., Staley, J.T. (1997): Microbiology: Dynamics and diversity. – Sounders College publishing Co., Inc, USA: 618-619.
[38] Rassoulzadegan, F., Sheldon, R.W. (1986): Predator-prey interactions of nano- zooplankton and bacteria in an oligotrophic marine environment. – Limnol. Oceanogr 31: 1010-1021.
[39] Sanders, R.W., Porter, K.G., Bennette, S.J., Debiase A.E. (1989): Seasonal pattern of bactivory by flagellates, cillates, rotifers and cladocerans in a freshwater planktonic community. – Limnol. Oceanogr 34: 673-687.
[40] Servais, P., Laurent, P., Billen, G., Levy, Y. (1992): Etude de la colonization bacterienne des reseaux de distribution. – Tech. Sci. Meth. Eau 87 (6): 321-326.
[41] Šimek, K., Chrzanowski, T.H. (1992): Direct and indirect evidence of size- selective grazing on pelagic bacteria by freshwater nanoflagellates. – Appl Environ Microbiol 58: 3715-3720.
[42] Sinsabaugh, R. L. (1997): Enzymatic analysis of riverine bacterioplankton production. – Limnobiology and Oceanography 42: 29-38.
[43] Thingstad,T.F., Sakshang, E. (1990): Control of Phytoplankton growth in nutrient recycling ecosystems. Theory and Terminology. – Mar Ecol Prog Ser 63: 261-272.
[44] Tumber, V.P., Roberts, R.D., Arts, M.T., Evans, M.S., Coldwell, De.E. (1993): The influence of environmental factors on seasonal changes in bacterial cell volume in two prairie saline lakes. – Microb Ecol 26: 9-20.
[45] Wanwright, S. (1990): Sediment to water fluxes of particulate material and microbes by resuspension and their contribution to the planktonic food web. – Mar Ecol Prog Ser 62: 271-281.
[46] Wiebe, W.J. (1984): Physiological and biochemical aspects of marine bacteria. – In Hobbie, J. E., Williams, P. J.(ed) Heterotrophic activity in the sea. – Plenum, New York, p. 55-82.
[47] Wommack, K.E., Colwell, R.R. (2000): Virioplankton; Viruses in aquatic ecosystems. – Microbiol Mol Biol Rev 37: 83-94.
[48] Wright, R. T. (1988): A model for short-term control of the bacterioplankton by substrate and grazing. – Hydrobiologia 159: 111-117.
[49] Yamakanamardi, S.M. (1995): Microbial ecology of three contrasting lowland water courses in Northeast England. – Ph. D., thesis, University of Hull, England, U K.