background guide for the calculation of land carbon stocks...
TRANSCRIPT

J R C R E F E R E N C E R E P O R T S
Background Guide for the Calculation of Land Carbon Stocks in the Biofuels Sustainability Scheme
Drawing on the 2006 IPCC Guidelines for National Greenhouse Gas Inventories
Florence Carré, Roland Hiederer, Viorel Blujdea, Renate Koeble
S e p t . 2 0 1 0
EUR 24573 EN


The mission of the JRC is to provide customer-driven scientific and technical support for the conception, de-velopment, implementation and monitoring of EU policies. As a service of the European Commission, the JRC functions as a reference centre of science and technology for the Union. Close to the policy-making process, it serves the common interest of the Member States, while being independent of special interests, whether private or national.
European Commission Joint Research Centre Institute for Environment and Sustainability
Contact information IES Communication Office [email protected] R. Hiederer JRC - IES Via Enrico Fermi, 2749 - 21027 Ispra (VA) Italy [email protected]
http://www.jrc.ec.europa.eu/
This publication is a Reference Report by the Joint Research Centre of the European Commission.
Legal Notice Neither the European Commission nor any person acting on behalf of the Commission is responsible for the use which might be made of this publication.
The use of trademarks in this publication does not constitute an endorsement by the European Commission.
The views expressed in this publication are the sole responsibility of the author(s) and do not necessarily reflect the views of the European Commission.
Europe Direct is a service to help you find answers to your questions about the European Union
Freephone number (*): 00 800 6 7 8 9 10 11
(*) Certain mobile telephone operators do not allow access to 00 800 numbers or these calls may be billed.
A great deal of additional information on the European Union is available on the Internet. It can be accessed through the Europa server http://europa.eu/.
PUBSY: JRC61098
EUR 24573 EN ISBN 978-92-79-17455-1 ISSN 1018-5593 doi 10.2788/34463
Luxembourg: Publications Office of the European Union
© European Union, 2010
Reproduction is authorised provided the source is acknowledged.
Printed in Italy

This document may be cited as follows:
F. Carré., R. Hiederer, R., Blujdea, V. and Koeble, R. (2010) Background Guide for the Calculation of Land Carbon Stocks in the Biofuels Sustainability Scheme
Drawing on the 2006 IPCC Guidelines for National Greenhouse Gas Inventories. EUR 24573 EN. Luxembourg: Office for Official Publications of the European
Communities. 109pp.
European Commission Joint Research Centre TA 3 (IES)
TP 261 21027 Ispra (VA)
Italy
Document prepared as part of
Administrative Arrangement
No.: TREN/D1/464-2009-SI2.539303
for providing
Technical assistance in evaluation of GHG emissions for biomass and biofuel pathways in the EU and 3rd countries and preparation of carbon stock guidelines


EXECUTIVE SUMMARY The Directive on Renewable Energy (Directive 2009/28/EC, RED) sets ambitious targets for all Member States. Under the RED the EU should reach by 2020 a 20% share of energy from renewable sources and a 10% share of renewable energy specifically in the transport sector. Renewable energy from biofuels, including those imported into the EU, should come from sustainable sources and deliver high greenhouse gas (GHG) savings, at least 35% when compared to fossil fuels. In growing biofuels land use changes can lead to changes in carbon stocks in soils and biomass and subsequent changes in GHG emissions, which forms an important factor in the sustainability assessment. To encourage industry, governments and NGOs to set up voluntary certification schemes for all types of biofuels a new scheme was adopted by the European Commission as Commission Decision of 10 June 2010 on guidelines for the calculation of land carbon stocks for the purpose of Annex V to Directive 2009/28/EC (notified under document C(2010) 3751).
This Guide for Calculation of Carbon Stock Changes in Soil and Above and Below Ground Vegetation due to Land Use Conversion was prepared in support of the Decision. It covers the all data sources and processing steps performed to establish the rules for the calculation of land carbon stock changes due to land conversion for biofuel production. The standard methodology and the carbon stock coefficients together with the data layers will enable economic operators to determine what changes in land carbon stocks might arise from the conversion of land for biofuels production. This report has substantially contributed to the new EU system established to ensure that European biofuels and bioliquids come from sustainable sources and meet the highest environmental standards.
The methodology put forward for estimating changes in GHG emissions in soil and biomass resulting from land use changes is based on the Tier 1 approach as developed under the 2006 IPCC Guidelines for National Greenhouse Gas Inventories. It is based on the definition of default values of carbon stocks for a set of soil, land cover and climate conditions. The default carbon stocks are modified according to changes in land use, management practices and inputs, which form a management system.
For soils the method distinguishes between mineral from organic soils. For mineral soils default values for carbon stocks are specified and coefficients of divergence from the default values are defined according to land use and land cover. For organic soils using a method based on emissions instead of stock changes is put forward. Default values for biomass carbon stocks are separated into those for above-ground vegetation and for below-ground vegetation.
To be used as a method for estimating GHG emissions from biofuel production the IPCC Tier 1 approach had to be adopted to the specifications of the scheme and modified in a number of key areas. One of the main changes is the use of spatial data layers to represent the parameters defining the default values and the changes in carbon stocks. This change required the creation of a harmonized database of all

parameters and the definition of an analytical framework to evaluate the feasibility of the methodology.
Generating the reference layers form basic data and to common spatial characteristics improves consistency for data integration and greatly reduces problems of data variation. For estimating stocks in soil organic carbon according to the default values new spatial data defining the climatic regions and the distribution of soil types had to be produced. The soil layer was generated from the most recent global data (Harmonized World Soil Database, March, 2009). The map of climatic regions is presented in the IPCC guidelines, but could not be obtained. For consistency with other climate data and the distribution of climatic regions a specific climate layer was generated from historic global weather data (WorldClim). This task also included computations of potential evapo-transpiration using two different methods. A land cover layer according to the RED classes was generated by adapting and merging several land cover maps (GlobCover and McGill University M3 Cropland).
As an important departure from the IPCC approach the Guide provides directly carbon stock values for climate and land use types. The values were defined following a review of the literature to provide values for all combinations. Since savannahs (and wooded savannahs) are not characterized in the IPCC guidelines they were treated as grasslands in the tropical moist IPCC climate region. Degraded lands are also not targeted in the IPCC guidelines except for grasslands (moderately and severely degraded). Thus, the same reduction percentages (or increase percentages) were applied on the management coefficients per climate zone for forests and croplands. A particular problem is presented by organic soils when estimating changes in GHG emissions as compared to mineral soils. For organic soils, such as peatlands, the method based on a default value of carbon stocks to estimate changes in soil carbon is not applicable. Organic soils cannot be assessed in terms of carbon stock changes because changes occur on the overall peat soil profile (not only on the first 30 cm). Drainage of organic soils have direct consequences not only on the amount of CO2 emissions but also on emissions of CH4 and N2O. Tables of coefficients of conversions are then proposed according to climate zone and continental boundaries for soil carbon stock changes and for above and below ground carbon stock changes in biomass in a Technical Annex.
This Guide should support economic operators to calculate the impact of land conversion on GHG emissions by using use actual values for the carbon stocks associated with the reference land use and the land use after conversion. While they should be able to use standard values for standard conditions, the Guide does not provide values for improbable combinations of climate and soil type, nor for the conversion of organic soils from undrained peatland, which is not allowed according to Directive 2009/28/EC for the purposes of sustainable biofuels and bioliquids production.

NOTE: This report has been prepared to serve as a scientific basis for the Commission's Decision on guidelines for the calculation of carbon stocks for the purpose of Annex V of Directive 2009/28/EC.


Background Guide for the Calculation of Land Carbon Stocks in the Biofuels Sustainability Scheme Drawing on the 2006 IPCC Guidelines for National Greenhouse Gas Inventories
i
Table of Contents
Page
1 INTRODUCTION ..............................................................................................................................1
2 TECHNICAL CONSIDERATIONS FOR CALCULATING LAND CARBON STOCK CHANGES ...................................................................................................................................................3
2.1 FACTORS DETERMINING LAND CARBON STOCK...........................................................................3 2.2 SPATIAL REPRESENTATION OF FACTORS DEFINING LAND CARBON STOCK UNDER THE IPCC AND
DIRECTIVE 2009/28/EC................................................................................................................3 2.2.1 Technical Specifications for Spatial Data Layers ...................................................................... 4 2.2.2 Climatic Zone Layer ................................................................................................................... 5 2.2.3 Land Use / Cover Layer.............................................................................................................. 9 2.2.4 Degraded Lands ....................................................................................................................... 15 2.2.5 Soil Classification and Default Reference Values for Soil Organic Carbon in Mineral Soils.. 16 2.2.6 Peatlands .................................................................................................................................. 23 2.2.7 Fertilizer Input.......................................................................................................................... 24 2.2.8 Geographic Stratification ......................................................................................................... 27
2.3 PROBLEMS OF UNCERTAINTIES IN SPATIAL DATASETS...............................................................27
3 METHODOLOGY FOR CALCULATING CHANGES IN LAND CARBON STOCK FROM LAND USE CONVERSION.....................................................................................................................29
3.1 THE IPCC GUIDE FOR SOIL CARBON-STOCK CHANGES .............................................................29 3.1.1 Soil Carbon Stock Changes in Mineral Soils............................................................................ 29 3.1.2 Soil Carbon Stock Changes in Organic Soils ........................................................................... 31
3.2 IDENTIFYING THE GAPS BETWEEN THE IPCC GUIDE AND THE BIOFUEL GUIDE REQUIREMENTS FOR SOIL CARBON STOCK CHANGES.................................................................................................31
3.2.1 Savannah and Wooded Savannah............................................................................................. 31 3.2.2 Degraded Land......................................................................................................................... 31 3.2.3 Drained Peatland ..................................................................................................................... 33
3.3 TABLES OF COEFFICIENTS FOR SOIL CARBON STOCK CHANGES.................................................35 3.3.1 Reference Default Soil Carbon Stock Values ........................................................................... 35 3.3.2 Coefficients of Soil Carbon Stock Changes according to Land Use Management Practices and Inputs 36
3.4 IPCC GUIDE FOR ABOVE- AND BELOW-GROUND CARBON STOCK CHANGES ............................36 3.5 IDENTIFYING GAPS BETWEEN THE IPCC AND THE BIOFUEL GUIDE REQUIREMENTS FOR BIOMASS
AND DEAD ORGANIC MATTER C-STOCK CHANGES....................................................................39 3.5.1 Biofuel Crops and their Global Distribution............................................................................ 39 3.5.2 Land Use Conversion Matrix.................................................................................................... 42 3.5.3 Carbon Stock and Change Default Data .................................................................................. 43
3.6 TABLE OF COEFFICIENTS FOR ABOVE- AND BELOW-GROUND CARBON STOCK CHANGES..........47
4 EXISTING TOOLS AND DATA SUPPORT.................................................................................49 4.1 EXISTING TOOLS FOR SOIL CARBON STOCK CHANGES...............................................................49 4.2 SPATIAL DATA FOR THE CALCULATION OF CARBON-STOCK CHANGES......................................50

Background Guide for the Calculation of Land Carbon Stocks in the Biofuels Sustainability Scheme Drawing on the 2006 IPCC Guidelines for National Greenhouse Gas Inventories
ii

Background Guide for the Calculation of Land Carbon Stocks in the Biofuels Sustainability Scheme Drawing on the 2006 IPCC Guidelines for National Greenhouse Gas Inventories
iii
List of Figures
Page
Figure 1: IPCC Classification Scheme for Default Climatic Regions (modified from IPCC, 2006) .................................................................................................6
Figure 2: IPCC Default Climatic Zones from the IPCC Report and the JRC Re-calculation.............................................................................................................8
Figure 3: Difference in Proportion by Grid Cell for Croplands in M3 and Re-Classified GlobCover Data.................................................................................13
Figure 4: Difference in Proportion by Grid Cell for Pasture in M3 and Re-Classified GlobCover Data.................................................................................14
Figure 5: Land Degradation Proxy (from Bai et al., 2008)................................................16
Figure 6: Classification of WRB Soil Types into IPCC Default Soil Classes ...................17
Figure 7: IPCC Soil Classification applied to Soil Type of Principal Mapping Unit of HWSD....................................................................................................18
Figure 8: Mapping Default Reference Values for Soil Organic Carbon Stock for Mineral Soils.......................................................................................................19
Figure 9: Difference between Topsoil Organic Carbon Density of the HWSD and IPCC Default Reference Values for Mineral Soils ......................................20
Figure 10: Difference between IPCC Default Reference values for Topsoil C-Densities and Mean C-Densities from HWSD for Native Vegetation ...............22
Figure 11: Distribution of Peatlands in Spatial Data Layer .................................................24
Figure 12: Mineral Fertilizer Application Rates (Mean Application Rates for Grid Cell) ....................................................................................................................26
Figure 13: Manure Application Rates (Mean Application Rates for Grid Cell)..................26
Figure 14: N-Deposits from Grazing Animals (Mean Application Rates for Grid Cell) ....................................................................................................................27

Background Guide for the Calculation of Land Carbon Stocks in the Biofuels Sustainability Scheme Drawing on the 2006 IPCC Guidelines for National Greenhouse Gas Inventories
iv
List of Tables
Page
Table 1: Technical Specifications of Spatial Data Layers..................................................4
Table 2: Weighting Factors for Converting GlobCover Level 1 Legend to Biofuel LUC Categories .....................................................................................12
Table 3: Default Reference (under native vegetation) Soil Organic Carbon Stocks (SOCREF) for Mineral Soils (C t ha-1 in 0-30 cm depth)......................18
Table 4: Topsoil Carbon Densities for IPCC Climate and Soil Classes Extracted from Processed HWSD Data for Native Vegetation ..........................................21
Table 5: Crops / Crop Groups Used to Disaggregate the Mineral Fertilizer Application .........................................................................................................25
Table 6: Default Reference (under native vegetation) Soil Organic Carbon Stocks (SOCREF) for mineral soils (0-30 cm depth).........................................35
Table 7: Geographical Distribution of Biofuel Crops within Climatic and Ecological Zones ................................................................................................41
Table 8: Land Conversion Matrix for Biofuel Crops (Y – possible land conversion) .........................................................................................................42
Table 9: Coefficients for Conversion from Grasslands and Savannahs ...........................58
Table 10: Coefficients of Conversion from Degraded Grasslands .....................................69
Table 11: Coefficients of Conversion from Forest and Wooded Savannah .......................80
Table 12: Coefficients of Conversion from Degraded Forest and Wooded Savannah.............................................................................................................84
Table 13: Data for Conversion from Grassland..................................................................88
Table 14: Data for Conversion from Forest (less than 30 % cover) ...................................89
Table 15: Data for Conversion from Forest (more than 30 % cover).................................92
Table 16: Data for Conversion from Shrubland .................................................................95
Table 17: Data for Conversion from Cropland (perennial crops).......................................96
Table 18: Data for Conversion from/to Forest Plantations.................................................97
Table 19: Data for Conversion from Degraded Grassland ...............................................102
Table 20: Data for Conversion from Degraded Forests....................................................103
Table 21: Data for Conversion to Cropland Biofuel Crops ..............................................106

Background Guide for the Calculation of Land Carbon Stocks in the Biofuels Sustainability Scheme Drawing on the 2006 IPCC Guidelines for National Greenhouse Gas Inventories
v
List of Acronyms ACRONYM TEXT AI Aridity Index C Carbon DM Dry matter EEA European Environment Agency ESA European Space Agency ETRS89 European Terrestrial Reference System 1989 FAO Food and Agriculture Organization of the United Nations GHG Greenhouse gas GIMMS Global Inventory Modeling and Mapping Studies GIS Geographic Information System GISCO Geographic Information System for the Commission
(Eurostat) GRID Global Resource Information Database HAC High-activity soils (IPCC) HWSD Harmonized World Soil Database IFA International Fertilizer Association IGBP International Geosphere-Biosphere Programme IIASA International Institute for Applied Systems Analyses IPCC Intergovernmental Panel on Climate Change ISRIC International Soil Reference and Information Centre ISS-CAS Institute of Soil Science, Chinese Academy of Sciences JRC European Commission Joint Research Centre LAC Low-activity soils (IPCC) LADA FAO Land Degradation Assessment in Drylands LCCS FAO Land Cover Classification System LUC Land use and cover LULUCF Land Use, Land Use Change and Forestry MODIS Moderate Resolution Imaging Spectroradiometer NDVI Normalized-Difference Vegetation Index NOAA National Oceanic and Atmospheric Administration ORNL DAAC Oak Ridge National Laboratory Distributed Active
Archive Center PET Potential evapo-transpiration SOC Soil organic carbon UNEP United Nations Environment Programme UNFCCC United Nations Framework Convention on Climate
Change WRB World Reference Base

Background Guide for the Calculation of Land Carbon Stocks in the Biofuels Sustainability Scheme Drawing on the 2006 IPCC Guidelines for National Greenhouse Gas Inventories
vi

Background Guide for the Calculation of Land Carbon Stocks in the Biofuels Sustainability Scheme Drawing on the 2006 IPCC Guidelines for National Greenhouse Gas Inventories
1
1 INTRODUCTION
The implementation of certain provisions of the Directive 2009/28/EC on the Promotion of the use of energy from renewable sources (hereafter referred to as the Directive) involves the conversion of lands for biofuel production in Europe and in other countries. Changes in land use frequently result in changes in vegetation which greatly impact on above- and below-ground carbon stocks (Guo & Gifford, 2002). The objective of this report is to establish a guide for the calculation of changes in land carbon stock as a consequence of a conversion of land cover or management practices and in view of growing biofuel.
The 2006 IPCC Guidelines for National Greenhouse Gas Inventories – Volume 4 (IPCC, 2006) provide a methodological framework on how to calculate land carbon stocks for different types of land use conversions. This framework is considered as a reference at the global level and forms the basis for this Guide.
This Guide covers the specific conditions stipulated by the Directive which are as follows:
o Areas excluded from conversion are wetlands, forests above 30% canopy cover
and undrained peatland. These areas are defined in terms of delineating features, i.e. where to draw the line between a land use for which conversion is forbidden and one for which conversion is reported in the methodology.
o Areas potentially available for the conversion of non-cropland to cropland concern the following categories:
- Grassland (including degraded pasture)
- Forest (less than 30% canopy cover)
- Savannah/Wooded savannah
- Degraded land
"Cropland" in this context includes any system for producing biofuels, which may also be forest plantations or perennial crops.
o Land carbon stock changes are stratified according to land use conversion, different types of soil (especially organic and mineral soils) and climatic zones across the world. Soil C-stock changes are expressed insofar as possible as the total changes in C stock, or the closest possible approximation, in particular for drained peatland.
o The Guide specifies coefficients for changes in carbon between land uses which can be applied by economic operators to determine the GHG impact of land conversion per major soil type and climatic zone.

Background Guide for the Calculation of Land Carbon Stocks in the Biofuels Sustainability Scheme Drawing on the 2006 IPCC Guidelines for National Greenhouse Gas Inventories
2
o For soil carbon stock calculation, links are nade to national and regional data on land C stock (particularly in soils) in the EU and in third countries.
o Where possible, the Guide draws on the 2006 IPCC Guidelines for National Greenhouse Gas Inventories – Volume 4. Additional scientific sources are used to complement the information provided therein.
After presenting the technical requirements for assessing land C-stock changes resulting from land use conversion, the Guide describes the common methodology to be used for this specific purpose where soil and above- and below-ground vegetation are differentiated. The methodology is then followed by a description of existing tools and datasets.

Background Guide for the Calculation of Land Carbon Stocks in the Biofuels Sustainability Scheme Drawing on the 2006 IPCC Guidelines for National Greenhouse Gas Inventories
3
2 TECHNICAL CONSIDERATIONS FOR CALCULATING LAND CARBON STOCK
CHANGES
The calculation of land carbon stock changes requires data inputs which should be available as spatial layers in order to cover all natural combinations. In the following section the factors determining land carbon stock are discussed.
2.1 Factors Determining Land Carbon Stock
As explained in IPCC (2006), land carbon stock depends on climate, soil type, land cover (vegetation type) and land management (mineral fertilizers and manures). In order to assess the actual situation of land carbon stock, these four defining factors need to be considered in combination. To cover the numerous combinations possible, a Geographical Information System (GIS) was used to generate and analyse data to suitably represent the factors in the spatial domain. The results of applying various scenarios of land use conversions give an overview of local land carbon stocks and are directly available in form of maps.
Tables for calculating land carbon stock changes according to modelled changes in land use and land management are available from IPCC (2006) and IPCC (2003). The parameters used in the tables are not fully compatible with the stipulations of the Directive and had to be amended. In particular for a spatial analysis, the layers representing the various defining factors had to be generated from basic data.
2.2 Spatial Representation of Factors Defining Land Carbon Stock under the IPCC and Directive 2009/28/EC
The first task to be performed in order to assess global land carbon stock changes due to land use conversion is to generate layers that represent the defining factors as spatial data layers. The preparation of one or more spatial data layer(s) for each factor is explained below. Problems of resolution and uncertainties are discussed in a second section.

Background Guide for the Calculation of Land Carbon Stocks in the Biofuels Sustainability Scheme Drawing on the 2006 IPCC Guidelines for National Greenhouse Gas Inventories
4
2.2.1 Technical Specifications for Spatial Data Layers The methodology used by the IPCC for estimating changes in land carbon stocks can be conveniently applied in a GIS by using raster layers and overlay functions. To simplify the procedure and to avoid incomplete results, all spatial layers should have the same extent and grid resolution. The technical specifications of the spatial data layers are given in Table 1.
Table 1: Technical Specifications of Spatial Data Layers
Feature Value
Data type 16-bit integer or real
File type Binary
No. of columns 4320
No. of rows 2160
Reference system ETRS89
Reference units Deg
Min. X-coordinate -180.00
Max. X-coordinate 180.00
Min. Y-coordinate -90.00
Max. Y-coordinate 90.00
As regards extent, full global coverage was considered necessary. The grid resolution was set to a regular size of 5 arc minutes (0.083333 deg). This grid spacing corresponds to approx. 10km at the equator. The grid size was chosen as a consequence of the spatial characteristics of the various spatial layers to be integrated and processing considerations. One of the most prominent factors for the analysis is soil data. Although global soil data are now distributed with a nominal resolution of 1km (FAO/IIASA/ISRIC/ISS-CAS/JRC, 2009), the spatial layer is derived from a scale 1:5mil. for large parts with mapping units spreading over larger areas a working resolution of 5 arc-minutes appeared to be justified. The data are arranged in geographic coordinates following the ETRS89 specifications (Annoni, et al., 2001).
To avoid arbitrary results in coastal areas, all spatial layers were adjusted to a standard land/sea mask. The mask was generated from the global GISCO (Geographic Information System of the European Commission) country coverage at a scale of 1:1mil. Coastal areas in the thematic data layers were revised using a distance function to allocate layer attributes to the common mask.

Background Guide for the Calculation of Land Carbon Stocks in the Biofuels Sustainability Scheme Drawing on the 2006 IPCC Guidelines for National Greenhouse Gas Inventories
5
2.2.2 Climatic Zone Layer The coefficients for changes in carbon stock of the IPCC Guidelines for National Greenhouse Gas Inventories distinguish between 12 climatic zones. The zones are defined by a set of rules based on
• annual mean daily temperature,
• total annual precipitation,
• total annual potential evapo-transpiration (PET) and
• elevation.
The rules defining the climatic zones are not compatible with the commonly used climate classification from Köppen-Geiger (Peel et al., 2007), largely due to the conditions set using PET. The rules defined by the IPCC are more suited to estimating SOC than one based on temperature and precipitation alone because it provides an indication of soil moisture conditions.
A graphical version of the IPCC classification scheme modified to better present the sequence of rules is given in Figure 1.
The classification presented as “Figure 3A.5.1 Delineation of major climate zones, updated from the 1996 IPCC Guidelines” (IPCC, 2006) could not be accessed in electronic form as a spatial layer so alternative sources of the data had to be used. The classification scheme applied by the IPCC resembles the delineation of life zones developed by Holdridge (1947). A dataset of the life zones was compiled by the International Institute for Applied Systems Analyses (IIASA) in Laxenburg, Austria (Leemans, 1990) and is available as, for example, the GNV5 dataset through the UNEP GRID (Global Resource Information Database) web-site1 or the NOAA Global Ecosystem Database (Global Ecosystems Database Project, 2000)2. The version where the original classes were aggregated with Olson's ecosystem classes appears to be most similar to the IPCC classification. By visual comparison, the data from the Global Ecosystems Database Project and GNV5 data do not completely correspond in all details. A further inconvenience of using any of those datasets is the lower spatial resolution, generally 30 arc min.
1 http://www.grid.unep.ch/data/summary.php?dataid=GNV5&category=biosphere&dataurl=http://www.grid.unep.ch/data/download/gnv005.zip&browsen=http://www.grid.unep.ch/data/download/gnv005-1.gif#preview 2 http://www.ngdc.noaa.gov/ecosys/cdroms/ged_iia/datasets/a06/lh.htm

Background Guide for the Calculation of Land Carbon Stocks in the Biofuels Sustainability Scheme Drawing on the 2006 IPCC Guidelines for National Greenhouse Gas Inventories
6
1 0 <M A T< = 1 8
S T A R T
0 <M A T < = 1 0
M M T < = 1 0 a l l m o n t h s
M A P > P E T
B o r e a l D r y
T A P > P E T
W a r m T e m p e r a t e
D r y
C o o l T e m p e r a t e
D r y
P o la r D r y
B o r e a l M o is t
W a r m T e m p e r a t e
M o is t
C o o l T e m p e r a t e
M o is t
P o la r M o is t
E le v a t io n > 1 0 0 0 m
T A P > 2 0 0 0 m m
1 0 0 0 m m < T A P < = 2 0 0 0 m m
T r o p ic a l D r yT A P > P E T
T A P > P E T
M A T > 1 8a n d < 7 d a y s
f r o s t /y e a r
T r o p ic a l M o n t a n e
T r o p ic a l W e t
T r o p ic a l M o is t
N o
N o
N o
N o
N o
N o
N o
N o
N o
N o
Y e s
Y e s Y e s
Y e s Y e s
Y e s Y e s
Y e s Y e s
Y e s
Y e s
N o
M A T : A n n u a l M e a n D a i ly T e m p e r a t u r eT A P : T o ta l A n n u a l P r e c ip i t a t io nP E T : T o ta l A n n u a l P o t . e v a p o - t r a n s p i r a t io nM M T : M e a n M o n t h ly T e m p e r a tu r e
Figure 1: IPCC Classification Scheme for Default Climatic Regions (modified
from IPCC, 2006)
One of the main disadvantages of using an existing dataset is the lack of access to the base data to which the classification scheme was applied. This will inevitably lead to

Background Guide for the Calculation of Land Carbon Stocks in the Biofuels Sustainability Scheme Drawing on the 2006 IPCC Guidelines for National Greenhouse Gas Inventories
7
inconsistencies when integrating the data in modelling tasks. The IPCC classification scheme was therefore applied to an independently developed set of base data layers. Climatic information on temperature and precipitation was provided by the 5 arc min. dataset Version 1.43 from the WorldClim project (Hijmans et al., 2005). The data summarize climatic conditions for the period 1950 - 2000. In the absence of a monthly mean temperature, the parameter was computed from the minimum and maximum temperatures. The elevation data was taken from the same source for reasons of consistency with the climate parameters. PET was computed according to the temperature-based formula investigated by Oudin et al. (2005) and used by Kay and Davis (2008) as
( )100
5×+
=w
aeT
TRPEλρ
m day-1 for Ta + 5 >0
where
Re extraterrestrial radiation (J m-2 s-1) Ta mean daily air temperature (°C) λ latent heat flux (MJ kg-1) ρw density of water (kg m-3)
The computation of extraterrestrial radiation was based on Duffie & Beckman (1991) and Allen et al. (1994). The formulas were supplemented by the information provided by the “Solar Radiation Basis” webpage of the University of Oregon4.
The IPCC classification scheme applied to the data was only modified to manage the first rule “<7 days of frost”. The rule could not be fully implemented because daily data were not available, only monthly averages. Therefore, the rule was adjusted to exclude any areas where the mean temperature was less than 0°C. The result of the re-calculation of the IPCC Climatic Regions compared to the map published in the IPCC 2006 report, Figure 3A.5.1, is presented in Figure 2.
3 http://www.worldclim.org/current 4 http://solardat.uoregon.edu/SolarRadiationBasics.html

Background Guide for the Calculation of Land Carbon Stocks in the Biofuels Sustainability Scheme Drawing on the 2006 IPCC Guidelines for National Greenhouse Gas Inventories
8
a) IPCC Default Climatic Regions, Figure 3A.5.1 (IPCC, 2006)
b) IPCC Default Climatic Regions, re-computed by the JRC
Figure 2: IPCC Default Climatic Zones from the IPCC Report and the JRC Re-calculation
The figure shows a general correspondence between the zones, in particular for the American continent. Differences occur mainly in the delineation of the “Tropical Dry” zone from the “Warm Temperate Dry” zone in the Sahara and the separation of the “Boreal Moist” from the “Boreal Dry” zone. The latter is almost non-existent in the IPCC map. However, the zone does appear in approximately the same areas in the

Background Guide for the Calculation of Land Carbon Stocks in the Biofuels Sustainability Scheme Drawing on the 2006 IPCC Guidelines for National Greenhouse Gas Inventories
9
aggregated Holdrige life zone data presented by the Oak Ridge National Laboratory Distributed Active Archive Center (ORNL DAAC5) and the UNEP Division of Early Warning and Assessment / Global Resource Information Database (DEWA/GRID-Europe) website6.
One reason for the difference in the boreal zone could be that the formula for PET is only applicable for conditions where Ta + 5 > 0 or where PET is set to 0. Under this constraint, and with the parameters set as given, PET does not become negative. It was found that this condition did not change the delineation except for central Greenland, where the “Polar Dry” zone could have been classified as “Polar Moist”. The source of the discrepancy in the delineation of the boreal zones could not be established and the re-computed layer was used in further analyses.
2.2.3 Land Use / Cover Layer Three sets of global land use / cover data were considered as sources from which the default land cover layer could be generated:
• The Global Land Cover 2000 product7 (GLC2000) vs1.1 (Global Land Cover 2000 Database, 2003) with the nominal spatial resolution of 1km at the Equator.
• The GlobCover project8 (Bicheron et al., 2008), an initiative of the ESA and a result of the JRC/EEA/FAO/UNEP/GOFC-GOLD/IGBP partnership. The images used in the project were acquired from December 2004 to June 2006 and the spatial resolution is 300m.
• The M3-Cropland and M3-Pasture data9 from McGill University (Ramankutty et al., 2008) with a 5 arc min. resolution.
GlobCover Version 2.2 (released 10.12.2008) is the most recent product and the one with the highest spatial resolution (300m). Because of the dates on which its images were acquired it was used as the basis for generating the layers of land cover type. The legend used is the Level 1 classification scheme (applied to the global map product) for which the categories are largely compatible with the FAO Land Cover Classification System (LCCS, di Greggio & Jansen, 2000). However, the legend does not correspond to the legends of the Directive.
The land cover classes which could be converted to grow biofuels are:
5 http://daac.ornl.gov/NPP/html_docs/hold2_npp.html 6 http://www.grid.unep.ch/data/download/gnv005-1.gif#preview 7 http://bioval.jrc.ec.europa.eu/products/glc2000/glc2000.php 8 ftp://us-ext-nas.eo.esa.int/global 9 http://www.geog.mcgill.ca/landuse/pub/Data/Agland2000/

Background Guide for the Calculation of Land Carbon Stocks in the Biofuels Sustainability Scheme Drawing on the 2006 IPCC Guidelines for National Greenhouse Gas Inventories
10
• Grassland, including degraded pastures
• Forest with <30% canopy cover
• Savannah and wooded savannah
• Degraded land
The 22 categories of the GlobCover Level 1 legend had to be aligned to correspond to these land use and cover (LUC) types of potential biofuel areas. The legend contains a combination of distinct and mixed land cover types. For distinct classes, an assignment to one of the LUC classes of the Directive is possible without particular difficulty (except for ‘degraded land’ which is assessed using a different dataset). Assigning land cover types to the mixed classes is less obvious and to some degree problematic. The main obstruction in aligning the LUC types of the image data were the classes containing a mixture of LUC types for biofuel production. These mixed classes represent a typical mosaic of several distinct LUC types, which could not be separated in the images. Although a proportion of a single class within the mosaic is indicated, this proportion at times refers to a group of LUC types without further differentiation. The solution adopted was to proportionally repartition the LUC types of the mixed classes to the biofuel LUC types.
A particular problem is generated by the Directive threshold of using the criteria of 30% forest cover to distinguish between areas which could be converted to grow biofuels and forest, which cannot be converted to this purpose. The GlobCover legend and the LCCS use thresholds of 15% and 40% to classify forests in open or closed forestland. According to the LCCS conversion table for GlobCover10, all classes with >15% forest cover are defined as forest. This does not lead to identifying a class of open forest with <30% cover. The extent of the convertible forest was therefore estimated by repartitioning the GlobCover forest classes. The process of repartitioning was supported by data from the Global Land Cover 2000 product (GLC2000) of the JRC. For that purpose, the GLC2000 global product Version 1.1 from 26.01.2004 with a nominal spatial resolution of 1km at the Equator was adjusted to the spatial properties of the biofuel layers by re-sampling the resolution first to 3 arc min. and then aggregating the data to 5 arc min. As with the GlobCover product, a single 5 arc min. thematic overlay containing the original legend categories was generated by sampling only the central pixels.
As a practical and conservative solution to the problem of identifying areas with <30% forest cover it was decided to allocate 60% of the open forest classes to forest with <30% cover and 40% to forest with >=30% cover. A category of shrubland not including herbaceous vegetation was included as the separate category “savannah and wooded savannah” in the LUC dataset. Wetland areas were also identified as a distinct category because they are treated separately when growing biofuel. The potential changes in organic carbon on wetlands following a transformation of land cover or use are treated by the IPCC using separate conversion factors, for example for changes in
10 ftp://uranus.esrin.esa.int/pub/globcover_v2/global/GLOBCOVER_Products_Description_Validation_Report_I2.1.pdf

Background Guide for the Calculation of Land Carbon Stocks in the Biofuels Sustainability Scheme Drawing on the 2006 IPCC Guidelines for National Greenhouse Gas Inventories
11
soil organic carbon. These variations could only be considered by allowing a specific treatment of wetlands.
The proportions assigned to the GlobCover Level 1 legend to generate the LUC classes for the biofuel project are given in Table 2. It was possible to assign some classes of the GlobCover classification scheme completely to classes defined for this project, e.g. Class 11 (Post-flooding or irrigated croplands), Class 150 (Sparse vegetation). For GlobCover classes covering two or more biofuel classes the areas were distributed according to the defined weighting factors. A factor of 0.7 was used to estimate the area of open forest with a tree cover of 15-30% from a class with 15-40% tree cover. For the complex land cover patterns of the mosaics, a repartition to biofuel classes according to the proportions given in the GlobCover legend was applied. For example, Class 120 (Mosaic grassland (50-70%) / forest or shrubland (20-50%)) was assigned to grassland (60%) with the remainder split equally between forest (20%) and shrubland (20%).
To ensure compatibility with other applications, such as deposition, substituting the categories “Cropland” and “Grassland” with data from M3-Cropland and M3-Pasture datasets11 produced by the Department of Geography, McGill University (Ramankutty et al., 2008) was investigated. The data were taken from the land cover products of Boston University (Friedel et al., 2002) and the GLC2000 dataset. The distribution of the cropland and pastures of 159 countries were adjusted to the national statistics as available from FAOSTAT12.
The data largely correspond to the spatial characteristics of the biofuel dataset and were only adjusted to the land/sea overlay. However, the data relate to conditions of the year 2000 rather than to those of 2006. This difference in time was considered acceptable because no extensive changes in the occurrence of cropland or pastures over the period of 6 years were expected.
The global area under McGill M3-Cropland extracted from the spatial layer is 15.1 mil. km2. The area extracted from the re-classified GlobCover data is 17.4 mil. km2. The 15% difference is just outside the range given for the McGill M3 data for a 90% confidence level (17.1 mil. km2). This difference could probably be accepted if one takes into consideration that users’ accuracy (percentage of land classified as a category that actually belongs to that category) for the 3 categories of croplands of the GlobCover data ranges from 60.9 to 84.4%13. However, the differences may be unevenly distributed and thus could lead to significantly conflicting identification of areas which could be converted to grow biofuel crops.
11 http://www.geog.mcgill.ca/landuse/pub/Data/Agland2000/ 12 http://faostat.fao.org 13 This figure for accuracy is derived for the category containing a single LUC type. When taking categories with mixed LUC types into account to compute the overall accuracy for a single LUC category the figure has to be adjusted. For example, from Table 8 in the GlobCover report for the combined categories of croplands (Categories 10+11+14) the users’ accuracy is computed as 84.9% and the producers’ accuracy (percentage of land of a category classified as that category) as 44.2%. Category 10 (Cultivated and managed areas) does not occur in the spatial layer. It appears to have been included in Category 14 (Rainfed croplands).

Background Guide for the Calculation of Land Carbon Stocks in the Biofuels Sustainability Scheme Drawing on the 2006 IPCC Guidelines for National Greenhouse Gas Inventories
12
Table 2: Weighting Factors for Converting GlobCover Level 1 Legend to Biofuel LUC Categories
Class
Label
Fore
st <
30%
Fore
st >
30%
Cro
plan
d
Gra
ssla
nd
Shru
b
Spar
se
Wet
land
s
Sett
lem
ents
Oth
er L
and
11 Post-flooding, or irrigated croplands (or aquatic) 1.00
14 Rainfed croplands 1.00
20 Mosaic cropland (50-70%) / vegetation (grassland/shrubland/forest) (20-50%)
0.10 0.10 0.60 0.10 0.10
30 Mosaic vegetation (grassland/shrubland/forest) (50-70%) / cropland (20-50%)
0.10 0.10 0.40 0.20 0.20
40 Closed to open (>15%) broadleaved evergreen or semi-deciduous forest (>5m)
1.00
50 Closed (>40%) broadleaved deciduous forest (>5m) 1.00
60 Open (15-40%) broadleaved deciduous forest/woodland (>5m)
0.70 0.30
70 Closed (>40%) needleleaved evergreen forest (>5m) 1.00
90 Open (15-40%) needleleaved deciduous or evergreen forest (>5m)
0.70 0.30
100 Closed to open (>15%) mixed broadleaved and needleleaved forest (>5m)
0.30 0.70
110 Mosaic forest or shrubland (50-70%) / grassland (20-50%)
0.10 0.20 0.40 0.30
120 Mosaic grassland (50-70%) / forest or shrubland (20-50%)
0.10 0.10 0.60 0.20
130 Closed to open (>15%) (broadleaved or needleleaved, evergreen or deciduous) shrubland (<5m)
1.00
140 Closed to open (>15%) herbaceous vegetation (grassland, savannahs or lichens/mosses)
1.00
150 Sparse (<15%) vegetation 1.00
160 Closed to open (>15%) broadleaved forest regularly flooded (semi-permanently or temporarily) - Fresh or brackish water
1.00
170 Closed (>40%) broadleaved forest or shrubland permanently flooded - Saline or brackish water
1.00
180 Closed to open (>15%) grassland or woody vegetation on regularly flooded or waterlogged soil -Fresh, brackish or saline water
1.00
190 Artificial surfaces and associated areas (Urban areas >50%)
1.00
200 Bare areas 1.00
210 Water bodies 1.00
220 Permanent snow and ice 1.00

Background Guide for the Calculation of Land Carbon Stocks in the Biofuels Sustainability Scheme Drawing on the 2006 IPCC Guidelines for National Greenhouse Gas Inventories
13
The difference in the proportion attributed to croplands using the McGill M3 data and the corresponding category of the re-classified GlobCover data has been calculated for the spatial layers and is shown in Figure 3.
Figure 3: Difference in Proportion by Grid Cell for Croplands in M3 and Re-
Classified GlobCover Data
Contrary to the differences in the occurrence of forest types between the re-classified GlobCover and GLC2000 datasets, the differences in the relative occurrence of croplands in a 5 arc min. grid cell between the McGill M3 and the GlobCover data show some distinct regional trends. The GlobCover data assigns larger portions of croplands mainly in eastern parts of South America, South-East Asia and southern Australia. The McGill M3 data shows more cropland in northern America and Europe. In Africa the differences are pronounced in sub-Sahelian regions, albeit more localized. The results are to some degree unexpected because the McGill M3 classification is based on the GlobCover data.
A similar evaluation was performed for the ‘pasture’ LUC type. The differences in the relative proportions assigned to the McGill M3 and the re-classified GlobCover data are presented in Figure 4.

Background Guide for the Calculation of Land Carbon Stocks in the Biofuels Sustainability Scheme Drawing on the 2006 IPCC Guidelines for National Greenhouse Gas Inventories
14
Figure 4: Difference in Proportion by Grid Cell for Pasture in M3 and Re-
Classified GlobCover Data
The disparity in the allocation of pastures between the two datasets is even more pronounced than for cropland. To ensure that the disparity was not caused by the re-classification procedure of the GlobCover data, the category containing only herbaceous vegetation (Class 140) was also compared to the M3-Pasture layer. For these data the regional differences were as prevalent as for the re-classified data.
An inverse trend in the identification in the GlobCover data by region is notable when comparing the distribution of the differences for cropland to those for grassland. Grassland in North America is defined as cropland in the McGill M3 data while for South America the inverse is found. A similar trend can be seen for East Asia. Another condition leading to the differences is the uncertainty in the separation of pastures from shrubland. This confusion dominates the disparity in eastern parts of North America and Africa. The herbaceous vegetation in central Asia and Australia is generally classified as sparse vegetation in the GlobCover data. The characteristics separating one category from the other also fluctuate for this LUC type.
The difference in the distribution of croplands and the likely confusion of cropland with pastures or shrubland poses a problem to the identification of potential areas for growing biofuel. Extensive areas in North America and Europe are classified as grassland in the GlobCover data, but according to the McGill M3 data they are confused with croplands. Reverse conditions dominate in South America, East Asia and southern Australia, with a more mixed situation in Africa.
The evaluation of the distribution of LUC types in the GlobCover and GLC2000 data with the McGill M3 data suggested using the McGill M3 data for cropland and merging the layer with the GlobCover data for all other LUC types. The advantage of using the M3-Cropland data is that this maintains a level of compatibility with FAO statistical data on the distribution of crops at national level. The reliability of the spatial distribution of crops at sub-national level is less evident. When comparing the M3-

Background Guide for the Calculation of Land Carbon Stocks in the Biofuels Sustainability Scheme Drawing on the 2006 IPCC Guidelines for National Greenhouse Gas Inventories
15
Cropland layer with GlobCover and GLC2000 data, the differences are largely due to different intensities of cropland rather than their presence.
A substantially different situation was found for the distribution of the M3-Pasture data. Variations to the GlobCover and GLC2000 data were marked by spatially divergent occurrences in the remote sensing data of pastures as compared to the classification of grassland. Areas covered up to 100% by pastures are indicated in desert areas (e.g. Sahara, Karoo) as well as in arid areas in North America and Australia. From the distribution of the data it appears that the delineation of pastures includes areas of sparse vegetation in the land cover data. This conjecture is supported by a map of the Aridity Index (AI) (UNEP, 1997) computed from the climatic data. The occurrence of pastures in hyper arid and arid areas is not supported by the climatic data. The option of re-classifying the M3-Pasture data to sparse vegetation where the AI indicates an arid climate (< 0.2) was not applied, as the layer would no longer correspond to the FAO statistical data and the result would have been insensitive to irrigated areas. Rather than over-interpreting the available data, the approach taken was to use the grassland derived from satellite data. With respect to identifying areas which could be converted to produce biofuels, the GlobCover data has the advantage over the GLC2000 data as it uses specific classes for open forests, albeit with an upper limit of 40% cover. Using a general ratio for separating GLC2000 forest classes into open and closed fractions has not yielded results comparable to those of the GlobCover data. The classes of the latter indicate that the proportion of open forest in the total forest area is spatially variable.
2.2.4 Degraded Lands In the Directive, severely degraded lands refer to soil which are:
• highly saline, and/or
• low in organic matter content and severely eroded
The spatial identification of soils affected by secondary salinization (as a consequence of irrigation), and/or severe erosion is quite difficult, particularly at the global level. These soils can be identified locally using a long-term monitoring network.
For the calculation, the severe degradation of lands is not mentioned (only ‘degraded lands’ in general). In the context of this Guide, land degradation was considered as being a long-term decline in ecosystem function and productivity. This definition is based on the LADA Project14. It has been assessed by using long-term, remotely sensed normalized-difference vegetation index (NDVI) data and rain-use efficiency calculated from the 23-year Global Inventory Modelling and Mapping Studies (GIMMS) NDVI satellite data (Bai et al., 2008). This proxy is an indicator for assessing not only how and where soil degradation affects the net primary production of biomass, but also how and where climate change affects it. Biofuel production is also a matter of net primary production of biomass, which is why we consider this proxy to be appropriate. Figure 5
14 http://www.fao.org/nr/lada/index.php?/Overview.html

Background Guide for the Calculation of Land Carbon Stocks in the Biofuels Sustainability Scheme Drawing on the 2006 IPCC Guidelines for National Greenhouse Gas Inventories
16
presents the map of location and intensity of land degradation (0.5 deg. map in the WGS84 coordinate system).
Figure 5: Land Degradation Proxy (from Bai et al., 2008)
Areas which are affected by land degradation are found mainly in Africa, south of the equator, South-East Asia and South China, north-central Australia, the Pampas and swaths of the Siberian and North American taiga. 1.5 billion people live in these areas.
2.2.5 Soil Classification and Default Reference Values for Soil Organic Carbon in Mineral Soils
To arrive at nominal values for the amount of organic carbon in soil, the IPCC guidelines apply default values of soil densities for the topsoil layer (0-30 cm) based on a matrix of soil type and climate zone. Soil types are grouped according to the World Reference Base (WRB) soil types. The scheme for translating soil types into IPCC classes is presented in Figure 6.
In the absence of an existing spatial layer of the default soil classes, the layer was generated from a suitable soil database. For global spatial layers on soil parameters, the most recent and complete dataset is available as the Harmonized World Soil Database (HWSD)15 (Fisher et al., 2008) from IIASA and the FAO.
15 http://www.iiasa.ac.at/Research/LUC/luc07/External-World-soil-database/HTML/index.html?sb=1

Background Guide for the Calculation of Land Carbon Stocks in the Biofuels Sustainability Scheme Drawing on the 2006 IPCC Guidelines for National Greenhouse Gas Inventories
17
START
Low Activity Clay Soils
Sand > 70%and
Clay <8%
Gleysol
Sandy Soils
Andosol
Podzol
Wetland Soils
Volcanic Soils
Spodic Soils
Albeluvisol, Alisols, Calcisols, Cambisols,
Chernozems, Gypsisols, Kastanozems, Leptosols,
Luvisols, Phaeozems, Regosols, Solonetz, Umbrisols, Vertisols
High Activity Clay Soils
Yes
Yes
Yes
Yes
Yes
No
No
No
No
No
AcrisolsAnthrosolsFluvisolsFerralsolsGreyzemsLixisolsNitisolsPodzoluvisolsPlanosolsPlinthosolsSolonchaks
Arenosols
Figure 6: Classification of WRB Soil Types into IPCC Default Soil Classes
The IPCC Soil Classification presented in Figure 6 has been applied to the soil mapping units of the HWSD. Figure 7 presents the resulting spatial distribution of the IPCC soil classes.

Background Guide for the Calculation of Land Carbon Stocks in the Biofuels Sustainability Scheme Drawing on the 2006 IPCC Guidelines for National Greenhouse Gas Inventories
18
Figure 7: IPCC Soil Classification applied to Soil Type of Principal Mapping Unit
of HWSD
The matrix of soil class and climate zone defining the default values of SOC under native vegetation is presented in Table 3.
Table 3: Default Reference (under native vegetation) Soil Organic Carbon
Stocks (SOCREF) for Mineral Soils (C t ha-1 in 0-30 cm depth)
Climate Region HAC Soils
LAC Soils
Sandy Soils
Spodic Soils
Volcanic Soils
Wetland Soils
C t ha-1 C t ha-1 C t ha-1 C t ha-1 C t ha-1 C t ha-1
Boreal 68 NA 10# 117 20# 146
Cold temperate, dry 50 33 34 NA 20# 87
Cold temperate, moist 95 85 71 115 130 87
Warm temperate, dry 38 24 19 NA 70# 88
Warm temperate, moist 88 63 34 NA 80 88
Tropical, dry 38 35 31 NA 50# 86
Tropical, moist 65 47 39 NA 70# 86
Tropical, wet 44 60 66 NA 130# 86
Tropical montane 88* 63* 34* NA 80* 86 Note: Data are derived from soil databases described by Jobbagy & Jackson (2000) and Bernoux et al.
(2002). Mean stocks are shown. # Indicates where no data were available and default values from 1996 IPCC Guidelines were retained. * Data were not available to directly estimate reference Carbon stocks for these soil types in the tropical
montane climate so the stocks were based on estimates derived for the warm temperate, moist region, which has similar mean annual temperatures and precipitation.

Background Guide for the Calculation of Land Carbon Stocks in the Biofuels Sustainability Scheme Drawing on the 2006 IPCC Guidelines for National Greenhouse Gas Inventories
19
Some combinations of soil type and climate zone are highly unlikely to occur so no default values are provided. The application of the default values to the soil class and climate zone spatial layers produces the spatial data layer depicted in Figure 8.
Figure 8: Mapping Default Reference Values for Soil Organic Carbon Stock for
Mineral Soils
In the interpretation of the data it should be considered that default values are only provided for mineral soils, under native vegetation and for the topsoil layer of 0-30 cm. To better evaluate the default values with actual conditions, a layer of SOC densities for the same characteristics was calculated from HWSD data. The difference between the HWSD map of topsoil stock densities and the IPCC map of default reference values is presented in Figure 9.
Background Guide for the Calculation of Land Carbon Stocks in the Biofuels Sustainability Scheme Drawing on the 2006 IPCC Guidelines for National Greenhouse Gas Inventories
20
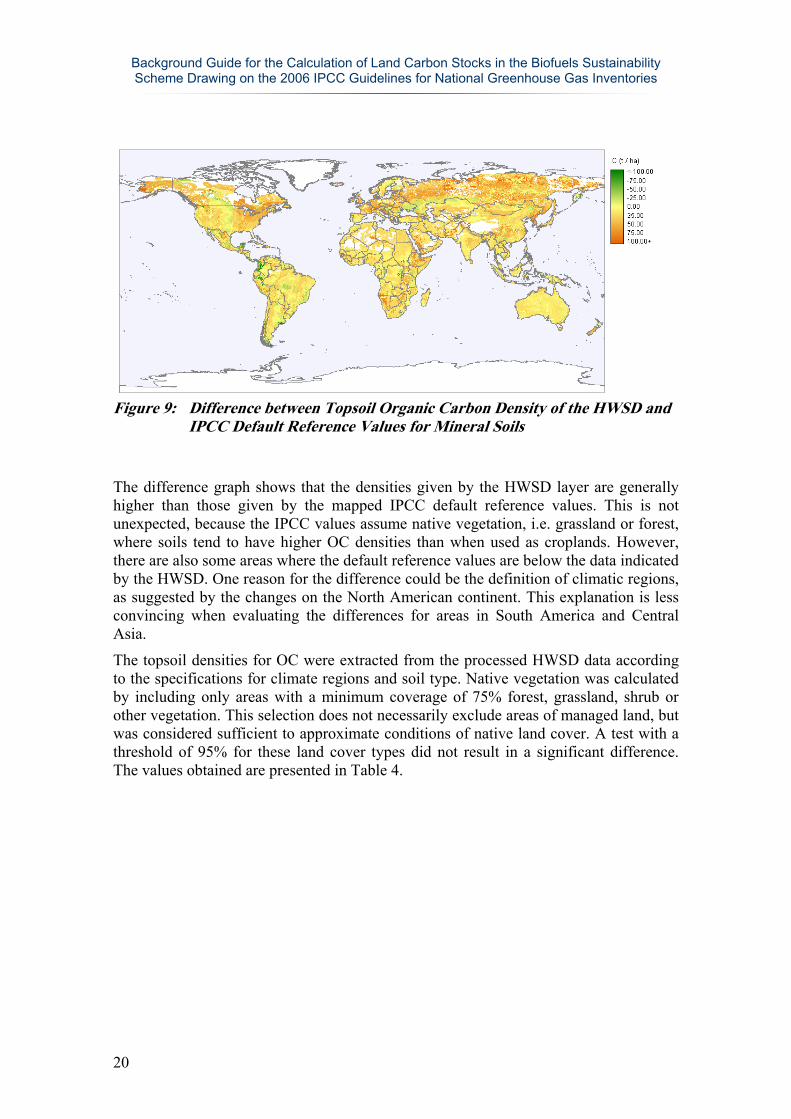
Figure 9: Difference between Topsoil Organic Carbon Density of the HWSD and
IPCC Default Reference Values for Mineral Soils
The difference graph shows that the densities given by the HWSD layer are generally higher than those given by the mapped IPCC default reference values. This is not unexpected, because the IPCC values assume native vegetation, i.e. grassland or forest, where soils tend to have higher OC densities than when used as croplands. However, there are also some areas where the default reference values are below the data indicated by the HWSD. One reason for the difference could be the definition of climatic regions, as suggested by the changes on the North American continent. This explanation is less convincing when evaluating the differences for areas in South America and Central Asia.
The topsoil densities for OC were extracted from the processed HWSD data according to the specifications for climate regions and soil type. Native vegetation was calculated by including only areas with a minimum coverage of 75% forest, grassland, shrub or other vegetation. This selection does not necessarily exclude areas of managed land, but was considered sufficient to approximate conditions of native land cover. A test with a threshold of 95% for these land cover types did not result in a significant difference. The values obtained are presented in Table 4.

Background Guide for the Calculation of Land Carbon Stocks in the Biofuels Sustainability Scheme Drawing on the 2006 IPCC Guidelines for National Greenhouse Gas Inventories
21
Table 4: Topsoil Carbon Densities for IPCC Climate and Soil Classes Extracted from Processed HWSD Data for Native Vegetation
Climate Region HAC Soils
LAC Soils
Sandy Soils
Spodic Soils
Volcanic Soils
Wetland Soils
C t ha-1 C t ha-1 C t ha-1 C t ha-1 C t ha-1 C t ha-1
Boreal, moist 46 81 26 77 97 79
Boreal, dry 51 55 24 67 116 81
Boreal 48 81 25 77 103 80
Cold temperate, dry 35 46 21 63 66 54
Cold temperate, moist 48 50 40 76 98 65
Warm temperate, dry 26 36 19 60 96 50
Warm temperate, moist 53 46 46 69 121 66
Tropical, dry 22 32 20 56 - 51
Tropical, moist 43 39 30 76 95 60
Tropical, wet 53 48 41 88 104 61
Tropical montane 33 45 19 94 112 56
One difference in the mean values of topsoil OC density between the IPCC default reference values and those extracted from the processed spatial data is that most fields of the matrix are now filled. Although the areas concerned are small, providing data for all combinations in the data avoids increasing the regions of missing information. The only exception is the combination of Volcanic soils x Tropical, dry, which is not present in the spatial data either. For Boreal regions, mean values were computed for the moist and dry variants. For reasons of comparability with the IPCC data, area-weighted means for a combined region are also included in the table.
Quantitative differences in carbon density in t ha-1 are presented in Figure 10.

Background Guide for the Calculation of Land Carbon Stocks in the Biofuels Sustainability Scheme Drawing on the 2006 IPCC Guidelines for National Greenhouse Gas Inventories
22
-100
-80
-60
-40
-20
0
20
40
60
80
100SO
C (I
PCC
- H
WSD
) [t/h
a]
BorealCT dry
CT moist WT dry
WT moist TR dry
TR moist TR wet
TR montane
Climatic Region
HAC LAC Sandy Spodic Volcanic Wetland
Figure 10: Difference between IPCC Default Reference values for Topsoil C-
Densities and Mean C-Densities from HWSD for Native Vegetation
The graph shows that, in general, the IPCC default values for native vegetation are higher than those found in the spatial data. On the whole the values computed from the spatial data are one third lower than the IPCC default reference values. Overall the IPCC default reference values amount to a global average of 66.5 t ha-1, while the average OC density in the topsoil derived from the spatial data is 43.8 t ha-1. For Boreal regions the SOC density in Wetlands is 45% lower in the spatial data than in the IPCC table. This can be attributed to the definition of wetlands in the soil layer, which excludes areas of organic soils. With peatlands being part of wetlands, the separation made by IPCC in this field is not fully consistent with the standard definition.
Notable exceptions in the correlation of SOC densities were found for Volcanic soils. The differences found are due not so much a difference in the range of values for OC density, but rather to a disparate combination of soil type and climatic zone between the IPCC and the spatial data. Mean topsoil SOC densities from the spatial data are also somewhat higher for sandy soils in Boreal and Warm temperate, moist regions, for LAC soils in Cool temperate, dry and Warm temperate, dry regions and for LAC soils in Tropical, wet regions. For Volcanic soils, the IPCC default reference values were not directly based on profile data but on inference from other data. For soils under a Tropical montane climate the default reference values were derived from the Warm temperate, moist region. As a consequence, the IPCC default reference values may be

Background Guide for the Calculation of Land Carbon Stocks in the Biofuels Sustainability Scheme Drawing on the 2006 IPCC Guidelines for National Greenhouse Gas Inventories
23
replaced by the values from the spatial data when integrating the spatial soil, climate and land cover data.
A nominal error estimate of 2 standard deviations is assumed for the IPCC default reference values. Without quoting the standard error of the mean or the standard deviation and the sample size, the range that the default reference estimates cover cannot be determined. An indicator for the range of values obtained as a result of relating SOC with climate and soil texture is given in the paper on which the IPCC default reference values are based. The coefficient of determination (r2) for a correlation of SOC with mean annual temperature, mean annual precipitation, clay or sand content for the upper 0-40cm ranges from -0.28 to +0.33. In other words, less than one third of the variation found in SOC is explained by the climate or texture parameters16.
The overall effect is still a significantly higher global SOC stock for the IPCC default reference map than for the spatial data, as given below:
• Spatial: 473 Pg
• IPCC: 697 Pg
The figures refer only to mineral soils and the climatic regions covered by IPCC default reference values. Batjes (1996) estimated the total amount of SOC in the upper 0-30cm of the soil layer globally to be 684 – 724 Pg. This figure includes carbon in peat.
Incidentally, the spatial data for a soil interval of 0-100 cm for all soil types provides a global SOC stock estimate of 1,208 Pg. This compares with the estimated global SOC stock quoted by the IPCC of 1,500 Pg. The latter estimate is based on Jobbágy & Jackson (2000). The global amount of OC in the soil layer from 0-100cm was estimated from profile samples to be 1,502 Pg, a figure now widely used. The confidence interval for this estimated mean is ±320 Pg (1 STD), meaning that one can be 68% confident that the mean of the population lies within the range of 1,182 – 1,822 Pg. Therefore, the estimates derived from the spatial data are within their range. The profile estimates were used to define the IPCC default reference values and, in a first approximation, similar ranges can be applied to those values.
2.2.6 Peatlands Peatlands are areas with organic soils or histosols formed from decaying organic matter. The definition of what constitutes peatland is not uniform between countries and international conventions. To define organic soils, the FAO uses the thickness of the layer, the organic carbon and clay content, the underlying material and the time of saturation with water (FAO, 1998). National definitions for organic soils are presented by Joost & Clarke, 2002.
16 The values for r2 given by Jobbágy & Jackson (2000) are sometimes negative. For linear correlations, the coefficient of determination should be the square of the sample correlation coefficient r, i.e. it is always $ 0. It can, however, be negative when a model-fitting procedure is used and data employed for the predictions differ from the data used to define the model.
Background Guide for the Calculation of Land Carbon Stocks in the Biofuels Sustainability Scheme Drawing on the 2006 IPCC Guidelines for National Greenhouse Gas Inventories
24
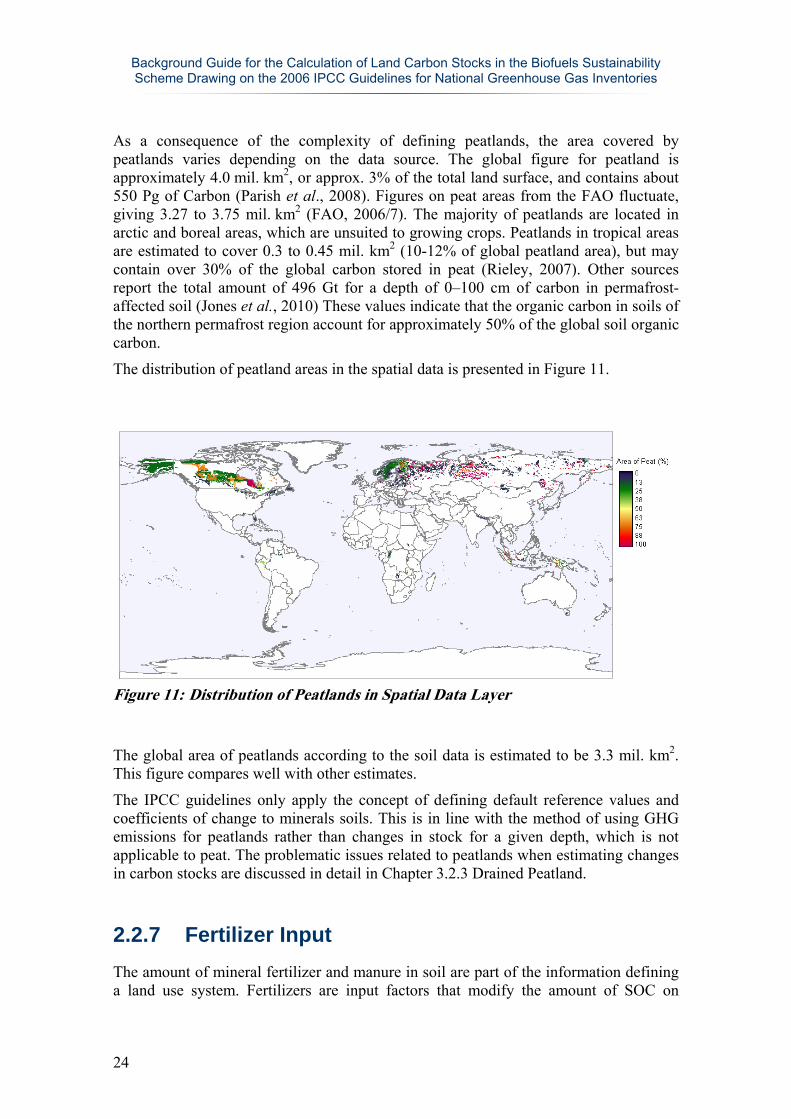
As a consequence of the complexity of defining peatlands, the area covered by peatlands varies depending on the data source. The global figure for peatland is approximately 4.0 mil. km2, or approx. 3% of the total land surface, and contains about 550 Pg of Carbon (Parish et al., 2008). Figures on peat areas from the FAO fluctuate, giving 3.27 to 3.75 mil. km2 (FAO, 2006/7). The majority of peatlands are located in arctic and boreal areas, which are unsuited to growing crops. Peatlands in tropical areas are estimated to cover 0.3 to 0.45 mil. km2 (10-12% of global peatland area), but may contain over 30% of the global carbon stored in peat (Rieley, 2007). Other sources report the total amount of 496 Gt for a depth of 0–100 cm of carbon in permafrost-affected soil (Jones et al., 2010) These values indicate that the organic carbon in soils of the northern permafrost region account for approximately 50% of the global soil organic carbon.
The distribution of peatland areas in the spatial data is presented in Figure 11.
Figure 11: Distribution of Peatlands in Spatial Data Layer
The global area of peatlands according to the soil data is estimated to be 3.3 mil. km2. This figure compares well with other estimates.
The IPCC guidelines only apply the concept of defining default reference values and coefficients of change to minerals soils. This is in line with the method of using GHG emissions for peatlands rather than changes in stock for a given depth, which is not applicable to peat. The problematic issues related to peatlands when estimating changes in carbon stocks are discussed in detail in Chapter 3.2.3 Drained Peatland.
2.2.7 Fertilizer Input The amount of mineral fertilizer and manure in soil are part of the information defining a land use system. Fertilizers are input factors that modify the amount of SOC on

Background Guide for the Calculation of Land Carbon Stocks in the Biofuels Sustainability Scheme Drawing on the 2006 IPCC Guidelines for National Greenhouse Gas Inventories
25
cropland and grassland. For croplands, the input factor represents the amount of crop residue and/or external organic amendments. On grassland the input factor represents the level of improvement over non-managed areas with an affect on primary productivity and carbon inputs to soil. Harmonized spatial data layers were generated for mineral fertilizer application rates (N-fertilizers) and for manure.
• Mineral Fertilizer Input
A very detailed map giving the mineral fertilizer N input was compiled based on country fertilizer input for the year 2000 from the International Fertilizer Association (IFA, 2009) and crop- and country-specific fertilizer application given in IFA/IFDC/FAO (1999). The latter data source is much more detailed but only includes data prior to 1999. Thus we disaggregated country level data for the year 2000 from IFA (2009) with crop specific data from IFA/IFDC/FAO (1999), assuming that the relative shares of N input to the individual crops remained stable (e.g. if N fertilizer input per hectare of wheat is 20% higher than N input to rye in the year 1997 in a specific country it will also be 20% higher in the year 2000, but the input in absolute terms might change).
The data sources allowed country specific fertilizer application rates to be calculated for 13 crops or crop groups for the year 2000, as presented in Table 5.
Table 5: Crops / Crop Groups Used to Disaggregate the Mineral Fertilizer
Application
Crop Group(s) Crop Group(s)
Cotton Fruits and Vegetables
Grassland Legumes
Maize Other coarse grains
Other crops Oil palm
Other Oilseeds Rice
Soybean Sugar crops
Wheat
Figure 12 shows the spatial distribution of mineral fertilizer input as average values for an entire grid cell. The inputs for individual crops within this cell can be quite different.

Background Guide for the Calculation of Land Carbon Stocks in the Biofuels Sustainability Scheme Drawing on the 2006 IPCC Guidelines for National Greenhouse Gas Inventories
26
Figure 12: Mineral Fertilizer Application Rates (Mean Application Rates for Grid
Cell)
• Organic Fertilizer Input
Total N input from manure on agricultural land per country was available on a country level from the EDGAR database (JRC/PBL, 2009) for the year 2000. The N input from manure was distributed homogeneously over crop and grassland areas within each country. The spatial distribution is given in Figure 13.
Figure 13: Manure Application Rates (Mean Application Rates for Grid Cell)
Nitrogen input from grazing animals based on FAO global animal density maps, animal specific excretion rates and considering different manure management systems was also available from the EDGAR database (JRC/PBL, 2009) on a 6 x 6 arc min. grid. The data was recalculated to fit with the grid size of 5 arc min. by 5 arc min.
Estimated N-deposits from grazing animals are given in Figure 14.

Background Guide for the Calculation of Land Carbon Stocks in the Biofuels Sustainability Scheme Drawing on the 2006 IPCC Guidelines for National Greenhouse Gas Inventories
27
Figure 14: N-Deposits from Grazing Animals (Mean Application Rates for Grid
Cell)
With fertilizer inputs being part of the system setup the effect depends on local application rates. These application rates may differ depending on whether a crop is grown for food or for biofuel The fertilizer input maps provide a guide on the amount of N-fertilizer presently used mainly for croplands under food production.
2.2.8 Geographic Stratification For biomass estimates, the IPCC Guidelines use geographic stratification at continent (i.e. Africa; Asia) or sub-continental level (i.e. continental or insular Asia) in order to make better use of data availability and to improve the appropriateness of default data and parameters for an area. This geographic stratification has particular importance for biological pools (i.e. biomass, dead organic matter) which show large variation under prevailing natural and management conditions at such scales.
2.3 Problems of Uncertainties in Spatial Datasets
As already explained, when two or more spatial datasets are combined, discrepancies between spatial datasets become increasingly apparent. This means that, at the global level and for a regular grid size of 5 arc min., spatial datasets usually contain uncertainties. The users of the map should be aware of this problem before indiscriminately applying the specified methodology for calculating carbon stock changes.
In this Guide the default data provided for biomass and dead organic matter Carbon stocks are marked by inherent uncertainty. Original sources are often not detailed and

Background Guide for the Calculation of Land Carbon Stocks in the Biofuels Sustainability Scheme Drawing on the 2006 IPCC Guidelines for National Greenhouse Gas Inventories
28
precise enough when providing methodological information on collected data on biomass or dead organic mater. Additionally, while some data is spatially averaged (i.e. default IPCC, remote sensing), other information is strictly local (i.e. local studies/research/experiments). Recent assessment of the biomass Carbon stock in forests showed that the IPCC’s spatially averaged data are within 1 SD (standard deviation) when compared with locally averaged values in a global synthesis of local data from major forest biomes (Keith et al., 2009). This also applies for tropical and boreal forest biomes, while for temperate forests there are larger differences which are explained by human intervention and the rate of natural disturbances (but temperate forests are not of significant interest for biofuel crops).
Monte Carlo simulations can be applied to assess the uncertainties within the carbon-stock change calculation, by using the probability density functions of the input spatial layers. This provides an idea of the overall uncertainty in the calculation. Monte Carlo simulations can be implemented stepwise by modifying each spatial data layer (the others being considered as accurate, i.e. without uncertainty). This method allows for quantifying the impact of the spatial data layer uncertainties on the final output. Considering uncertainties in data and findings should be an important aspect of data modelling and be added to the methodology of spatial analysis.

Background Guide for the Calculation of Land Carbon Stocks in the Biofuels Sustainability Scheme Drawing on the 2006 IPCC Guidelines for National Greenhouse Gas Inventories
29
3 METHODOLOGY FOR CALCULATING CHANGES IN LAND CARBON STOCK
FROM LAND USE CONVERSION
In the methodology for calculating land carbon-stock changes following land use conversion, soil and above- and below-ground vegetation have been treated separately. The methodology focuses first on soil carbon and then on above- and below-ground vegetation.
3.1 The IPCC Guide for Soil Carbon-Stock Changes
For calculating carbon-stock changes, the IPCC guidelines (2006) propose different approaches according to the targeted scale and the number and accuracy of measurements. In this Guide, the Tier 1 approach is considered because the relevant spatial extent considered by the Directive is the global level and the demands for the input data are less stringent than for higher-tier methods. In the Tier 1 approach, only organic carbon stock changes are considered (inorganic carbon stock changes are considered to be 0).
The Tier 1 approach models soil carbon stock changes according to climate, soil type, land use conversion and management practices.
3.1.1 Soil Carbon Stock Changes in Mineral Soils The following equation is used for calculating the annual change in organic carbon stocks in mineral soils:
DSOCSOC
C Teral
)( )0(0min
−−=δ
where SOC = iscIMGisc
LUREF AFFFSOCiscisciscisc ,,
,,,,,,,,,,××××∑
where
eralCminδ annual change in carbon stocks in mineral soils (tonnes C yr-1)

Background Guide for the Calculation of Land Carbon Stocks in the Biofuels Sustainability Scheme Drawing on the 2006 IPCC Guidelines for National Greenhouse Gas Inventories
30
0SOC soil organic carbon stock in the last year of an inventory time period (tonnes C)
)0( TSOC − soil organic carbon stock at the beginning of the inventory time period (tonnes C)
T number of years in a single inventory time period
D Time dependence of stock change factors which is the default time period for transition between equilibrium SOC values (years). Commonly 20 years, but depends on assumptions made in computing the factors FLU, FMG and FI. If T exceeds D, use the values for T to obtain an annual rate of change over the inventory time period (0-T years).
c represents the climate zones, s the soil types, and i the set of management systems that are present in a country.
REFSOC the reference carbon stock (tonnes C ha-1)
LUF stock-change factor for land-use systems or subsystem for a particular land-use
MGF stock-change factor for management regime
IF stock-change factor for input of organic matter
A land area of the stratum being estimated (ha)
All land in the stratum should have common biophysical conditions (i.e. climate and soil type) and management history over the inventory time period in order to be treated together for analytical purposes.
Inventory calculations are based on land areas that are stratified by climate regions (see Chapter 2.2.2 for the default classification of climate) and default soil types (see Chapter 2.2.5 Soil Classification and Default Reference Values for Soil Organic Carbon in Mineral Soils for the default classification of soils). The stock-change factors are very broadly defined and include:
1) a land-use factor (FLU) that reflects the carbon-stock changes associated with type of land use,
2) a management factor (FMG) representing the principal management practice specific to the land-use sector (e.g. different tillage practices in croplands), and
3) an input factor (FI) representing different levels of carbon input to soil.
On forest land FND is substituted for FLU to account for the influence of natural disturbance regimes (see Chapter 4 for further discussion). The stock change factors are provided in the sections below. Each of these factors represents the change over a specified number of years (D), which can vary across sectors, but is typically invariant

Background Guide for the Calculation of Land Carbon Stocks in the Biofuels Sustainability Scheme Drawing on the 2006 IPCC Guidelines for National Greenhouse Gas Inventories
31
within sectors (e.g. 20 years for cropland systems). In some inventories, the time period (T) may exceed D. In those cases an annual rate of change in carbon stock may be obtained by dividing the product of [(SOC0 – SOC0 –T) x A] by T instead of D. The default reference soil organic carbon stock (SOCref) for mineral soils are provided in Table 6 (Table 2.3 of the IPCC Guidelines).
3.1.2 Soil Carbon Stock Changes in Organic Soils The Directive excludes undrained peatlands and wetlands for conversion to lands dedicated to biofuel production. For drained organic soils, the IPCC Guidelines do not provide any values because they use GHG emission factors instead of changes in carbon stock for peatland (see also Chapter 3.2.3 Drained Peatland).
3.2 Identifying the Gaps between the IPCC Guide and the Biofuel Guide Requirements for Soil Carbon Stock Changes
The Tier 1 approach of the IPCC Guidelines provides carbon-stock change coefficients for grassland, forest, savannah and wooded savannah which have been converted to croplands. These coefficients are listed in Chapter 3.3 of this Guide. The Tier 1 approach gives no indication about carbon-stock change coefficients for savannah and wooded savannah, for degraded lands and drained peatlands.
3.2.1 Savannah and Wooded Savannah Kottek et al. (2006) defined savannah as being all sparse vegetations, grasslands, shrublands and open forests in the Equatorial climate zone with monthly summer and winter precipitation of less than 60 mm. According to the Köppen-Geiger climate classification, savannah is found in class Aw and As which correspond to the ‘Tropical Moist’ climate zone of the IPCC Guidelines. The carbon-stock change coefficients of savannah and wooded savannah are then applied to the grassland and forest areas of the ‘Tropical Moist’ IPCC Climate zone.
3.2.2 Degraded Land The long-term decline in ecosystem function and productivity is not necessarily to the consequence of a decline in organic matter. It can be due to normal soil processes, to human activities such as secondary salinisation, soil erosion, soil compaction, landslides or even contamination of soil by heavy metals, or to natural hazards like heavy storms, rising temperatures and so on. The decline in organic matter plays a currently

Background Guide for the Calculation of Land Carbon Stocks in the Biofuels Sustainability Scheme Drawing on the 2006 IPCC Guidelines for National Greenhouse Gas Inventories
32
unquantified role in land degradation. It is therefore difficult to assess coefficients of carbon stock changes or even to adjust the default carbon stock values as a result of land degradation. Smith et al. (2007) defined annual mitigation potentials in each climate region for non-livestock mitigation options and considered the restoration of degraded lands. They applied a systematic average change in soil carbon stocks (CO2) of 3.45 t CO2 ha-1 yr-1 within each climate zone with a minimum value of -0.37 and a maximum value of 7.26. The authors were not able to differentiate changes in soil carbon stocks according to climate zone and soil type because of the number of uncertainties in the studies and the lack of literature on this topic. The average values are approximately those of the cool-moist, warm-dry and warm-moist climate zones. However, the conversion of degraded grasslands or degraded forests into croplands does not mean a restoration of the soil carbon stock. This really depends on the land use and the management practices which are carried out on the degraded lands. Several studies have shown that tree plantations with long rotation periods represent good practices for restoring degraded lands (Dawson and Smith, 2007). If managed with conventional tillage, agricultural and tropical crops tend to exacerbate land degradation (Follet, 2001; Dawson & Smith, 2007). Thus, Izaurralde et al. (2001) concluded that strongly and extremely degraded soils should be taken out of agricultural and pastoral land uses and planted with tree, shrub or grass species that can be used as biofuel. Furthermore, Arrouays et al. (2002) and Seguin et al. (2007) showed that carbon stock usually takes twice as long to accumulate than it takes organic carbon to decrease. Thuille & Schulze (2006) suggested that at least 80 years are required for initial stock levels to recover after afforestation in Thuringia and the Alps. In terms of potential carbon stock sequestration, Arrouays et al. (2006) showed that it is usually better to restore carbon stock where organic carbon content is not too low. It is then better to try to conserve soil carbon stock than to allow it to decrease significantly and try to restore it. Furthermore, conservation is better with perennial crops than with annual crops (Freibauer et al., 2004).
Considering the different points explained above, we assume that default carbon stock values remain the same for degraded land for a given climate and soil type because there are too many uncertainties regarding whether local degradation is due to a decline of organic matter. When the soil is degraded, the coefficients of carbon-stock changes (FLU, FMG and FI) which are less than 1 (i.e. the coefficients which lead to a decrease in soil carbon stock) must be lower than their value under normal conditions of land use.. If however the coefficients are greater than 1, they do not necessarily lead to a change because soil restoration is very slow (in 20 years, there is no significant difference between an increase of carbon stock on non–degraded lands and an increase on degraded lands because the kinetics of soil carbon stock accumulation are slow for this length of time). Hence, for a moderately degraded grassland, the IPCC Guidelines (Table 6.2) provide an FMG of 0.95 to 0.97, depending on climate zones (5 to 3% less than on a non-degraded grassland) and for a severely degraded grassland, the FMG coefficient is 0.7 in all climatic zones (30% less then a non-degraded grassland). As,forest converted to cropland and grassland converted to cropland present the same rate of carbon decrease for 20 years after conversion, we apply the same percentage of decrease on FMG for degraded forest according to climate zone. We do the same for degraded croplands. For degraded croplands, we consider tillage to have a real negative impact on soil organic carbon stocks. If the land is degraded and fully tilled we consider

Background Guide for the Calculation of Land Carbon Stocks in the Biofuels Sustainability Scheme Drawing on the 2006 IPCC Guidelines for National Greenhouse Gas Inventories
33
the FMG to be 0.7 (as for severely degraded grassland) instead of 1, whatever the climatic zone. For degraded croplands which are not tilled, we do not change the coefficients of FMG compared to non-degraded croplands. For reduced tillage, we decrease the coefficients by 5% in temperate/boreal climatic zones, by 4% in Tropical montane and by 3% in other Tropical zones (as for moderately degraded grasslands).
3.2.3 Drained Peatland Peatlands are part of the wetland ecosystems, and about 60% of all wetlands are covered by peat. In peatlands, water, peat and the specific vegetation that grows in these ecosystems are strongly interconnected. If any one of these components is removed, or should the balance between them be significantly altered, the nature of the peatland fundamentally changes. There are many different variations of peatlands, depending on geographic region, altitude, terrain and vegetation. Peatlands may be naturally forested or naturally open and vegetated with mosses or sedges. A distinction can be made between peatlands where peat is currently being formed – known as mires – and areas which formerly had peat formation but in which, due to human interventions or climate change, peat is no longer developing (Parish et al., 2008). As a result of their high water concentration, undrained peatlands are a source of CH4 emissions and a sink of CO2.
Globally, between 60 and 80% of the peatlands are estimated to be pristine (Parish et al., 2008), which means that about 30% have been or are being drained. The drainage of peat due to conversion of peat for arable lands, forest plantations or grasslands leads to a net increase in radiative forcing due to large fluxes of CO2 and N2O (due to the presence of water, the high mineralization of organic matter and fertilization), despite decreases in emissions of CH4 (Kasimir- Klemedtsson et al., 1997). Once drained, most peat carbon above the drainage limit is released into the atmosphere over prolonged periods of time.
In order to use peatlands to grow crops, they are generally drained and frequently also limed. This combination of increasing aerobic conditions in the ground and raising the pH leads to oxidization of the organic material which has the effect of increasing CO2 and N2O emissions, but reducing emissions of CH4.
There are therefore several reasons why using the methodology developed for mineral soils for estimating the changes in soil carbon stocks following conversions of land are not pertinent to peatlands:
• Use of fixed layer depth
For mineral soils, the OC content in the upper 30cm is considered to be most affected by changes in land use / cover. At deeper levels, there is much less OC and it less affected by land use / cover (Hiederer, 2009). Furthermore, the concept of analysing OC in the topsoil is realistic, because changes in the amount of OC in this layer do not significantly change the volume of the soil section analysed. In contrast, when assessing the upper 30cm of peat, changes in organic carbon affect the depth of the layer. It is the material itself that is

Background Guide for the Calculation of Land Carbon Stocks in the Biofuels Sustainability Scheme Drawing on the 2006 IPCC Guidelines for National Greenhouse Gas Inventories
34
removed. It is therefore argued that, for peatlands, the use of a methodology of changes in carbon stocks should be applied to the total depth of peat rather than to a fixed layer. Otherwise, relatively small changes in carbon may be observed for an area where the organic material itself is being reduced because a different layer is actually being assessed with a reduction in total depth..
• Proxy
Changes in SOC are used as an indicator, or proxy, for estimating CO2 emissions from land use / cover changes in mineral soils. For peatlands, the changes in land use and management result in a variety of pathways for losses of carbon (dissolved, CH4, CO2) but also for emissions of N2O. As a consequence, changes in carbon stocks are only vaguely related to the effect of changes in land use / cover on emissions from peatlands (Joosten, 2009).
• Land Use / Cover vs. Re-Wetting
The effects of changes in land use / cover are considered to be marginal compared to the effect of draining peatlands. Carbon-stock losses from peatlands through drainage are estimated at 7 – 20 t C ha-1 year-1. This change is smaller than the error in estimating carbon stocks in peatlands, which argues against a stock-based approach in general for peatlands (Joosten, 2009). By rewetting drained peatlands, the areas can be restored to their original function as carbon sinks. The amount of GHG emissions avoided is considered to outweigh any production of biomass on drained peatlands (Couwenberg, 2009).
The IPCC therefore assesses changes of carbon in peatlands in terms of GHG emissions rather than changes in carbon stock. The whole issue of assessing emissions from peatlands, either drained, pristine or excavated, is still very much under discussion (Barthelmes et al., 2009) and will likely develop in the future.

Background Guide for the Calculation of Land Carbon Stocks in the Biofuels Sustainability Scheme Drawing on the 2006 IPCC Guidelines for National Greenhouse Gas Inventories
35
3.3 Tables of Coefficients for Soil Carbon Stock Changes
The coefficients for soil carbon stocks are separated into those relevant to define the default reference values and those modifying the default values as a consequence of land management practices.
3.3.1 Reference Default Soil Carbon Stock Values Table 6 presents the values used by the IPCC Guidelines (2006) as the default reference values for organic carbon in mineral soils.
Table 6: Default Reference (under native vegetation) Soil Organic Carbon
Stocks (SOCREF) for mineral soils (0-30 cm depth)
Climate Region HAC Soils
LAC Soils
Sandy Soils
Spodic Soils
Volcanic Soils
Wetland Soils
C t ha-1 C t ha-1 C t ha-1 C t ha-1 C t ha-1 C t ha-1
Boreal 68 NA 10 117 20 146
Cold temperate, dry 50 33 34 NA 20 87
Cold temperate, moist 95 85 71 115 130 87
Warm temperate, dry 38 24 19 NA 70 88
Warm temperate, moist 88 63 34 NA 80 88
Tropical, dry 38 35 31 NA 50 86
Tropical, moist 65 47 39 NA 70 86
Tropical, wet 44 60 66 NA 130 86
Tropical montane 88 63 34 NA 80 86 NA: no default available because of improbable combination of soil and climate
The default reference values from the IPCC Guidelines (2006) were not modified. For some combinations of soil type and climate default reference values occurring in the HWSD – Climate Zone layers, additional values could be defined for areas which are not covered by the IPCC table after more in-depth analysis of the conditions and possibly the use of measured soil profile data.

Background Guide for the Calculation of Land Carbon Stocks in the Biofuels Sustainability Scheme Drawing on the 2006 IPCC Guidelines for National Greenhouse Gas Inventories
36
3.3.2 Coefficients of Soil Carbon Stock Changes according to Land Use Management Practices and Inputs
The tables describing the coefficients of soil carbon-stock changes according to land use, management practices and inputs are described in the Technical Annex according to each type of conversion.
Note that the relative uncertainties of the final product coefficient (which is the product of the FLU, FMG and FI coefficients) correspond to the sum of the relative uncertainties of FLU, FMG and FI.
• Coefficients for Conversion from Grassland and Savannah to Croplands –
see Table 1 of the Technical Annex
• Coefficients for Conversion from Degraded Grassland to Degraded Croplands– see Table 2 of the Technical Annex
• Coefficients for Conversion from Forest and Wooded Savannah to Croplands– see Table 3 of the Technical Annex
• Coefficients for Conversion from Degraded Forest and Wooded Savannah to Croplands– see Table 4 of the Technical Annex
3.4 IPCC Guide for Above- and Below-Ground Carbon Stock Changes
This Guide describes the methodological principles, gives the step-by-step procedure, and provides the default data and factors necessary for the estimation of carbon emissions and removals as a result of land use conversions to biofuel crops. As such, it follows the “one stop shop” concept. It represents a low complexity approach, corresponding to IPCC methodological Tier 1, as it is based on the IPCC’s guidelines regarding Land use, Land Use Change and Forestry: the IPCC’s 2003 Good Practice Guidelines for Land Use, Land Use Change and Forestry and 2006 Guidelines for National Greenhouse Gas Inventories. A Tier 1 methodological approach has been used by several authors to assess the emissions arising as a result of changing land use to biofuel production (Wicke et al., 2008; Ruesch & Gibbs, 2008; Miles et al., 2008).
The Guide facilitates the estimation of carbon-stock changes (increases and decreases) in biomass and dead organic matter, i.e. the emissions/removal of CO2 from soils as a result of land conversion to cropland for biofuels. The estimation methodology is built on the mass balance principle, with the estimation of carbon-stock changes in relevant pools over an adequate period of time. The methodology, default carbon-stock data and factors provided in the Guide cover the conversions of land use categories (i.e. grassland, forestland, etc.) and strata (i.e. annual or perennial crops) to biofuel crops,

Background Guide for the Calculation of Land Carbon Stocks in the Biofuels Sustainability Scheme Drawing on the 2006 IPCC Guidelines for National Greenhouse Gas Inventories
37
while seeking to fit into various IPCC stratifications (climatic and ecological zones, geography, etc.).
It should be noted that the Guide allows for the estimation of “potential” CO2 emissions and removals as a result of land conversions. This means that the total CO2 emissions and removals are accurately estimated (under given default data uncertainty) over the land conversion period, but their precise occurrence in time is not given. Emissions as a result of carbon-stock changes in biomass are not at all steady or constant in time in land use conversion, given that “actual” emissions of CO2 occur mostly at the beginning of the period (i.e. from biomass removal). Consequently, large uncertainties are associated with the linear annualisation of biomass emissions. On the other hand, actual emissions resulting from land use conversions may be underestimated insofar as non-CO2 emissions (i.e. N2O and CH4 from soil disturbance, biomass burning, fertilization of crops, etc.) are not covered by this Guide17.
The Guide promotes the principle of “conservativeness” in order to avoid the risk of underestimating CO2 emissions (Grassi et al., 2008), while observing accuracy with current data
The methodology allows the estimation of the carbon stock changes for the relevant carbon pools per unit area (1 ha), the so-called Carbon stock-change factor (EF). For the estimation of emissions from a specific area, the EF should be applied to the land area on which conversion takes place (called activity data or AD). Carbon stock may increase or decrease as a result of land use conversion. From the perspective of CO2 exchange with the atmosphere, there could be the removal of CO2 by sinks (when CO2 is removed from atmosphere, conventionally indicated by “-”) or the emission of CO2 by sources (when CO2 is emitted into the atmosphere, conventionally indicated by “+”).
• Total Carbon Stock Change Computation
The general formula for estimating carbon stock change as a result of land use conversion is:
ΔCLUC = (CAFTER – CBEFORE)*ATO
where:
Δ CLUC carbon stock changes as a result of conversion from a generic land-use category to cropland (t C ha-1). If Δ CLUC is negative there is a decrease of C-stock in “after” compared to “before” land use, indicating emissions of CO2 to the atmosphere.
CBEFORE carbon stock on land before the conversion (t C ha-1)
CAFTER carbon stock on land after conversion (t C ha-1)
17 The administrative arrangement between the JRC and EC/DG TREN calls for, in this stage, a Tier 1 estimation of carbon stock changes, not the estimation of all non-CO2 GHG involved.

Background Guide for the Calculation of Land Carbon Stocks in the Biofuels Sustainability Scheme Drawing on the 2006 IPCC Guidelines for National Greenhouse Gas Inventories
38
ATO area of land use converted to another land use in a given year (ha yr-1).
By default, using this methodology ATO = 1 ha.
The appropriate method to compute carbon stocks (either before or after conversion) depends on availability of data:
CSTOCK = CBIOMASS + CDOM = (CAGB+ CBGB) + (CLI+ CDW) where:
CSTOCK total carbon stock (AFTER, BEFORE) in relevant pools (t C ha-1)
CBIOMASS carbon stock in biomass on land (t C ha-1)
CDOM carbon stock in dead organic matter on land (t C ha-1)
and/or,
CAGB carbon stock in above-ground biomass on land (t C ha-1)
CBGB carbon stock in below-ground biomass on land (t C ha-1)
CLI carbon stock in litter on land (t C ha-1)
CDW carbon stock in dead wood on land (t C ha-1)
• Computation of C-Stock in Biomass
When biomass data (before and/or after conversion) is available, the following formula is used to compute the associated carbon stock using dry matter (DM):
CBIOMASS = BAGB (1+R)* CF = (BAGB+ BBGB) * CF where:
CBIOMASS total carbon stock in biomass on land (t C ha-1)
BAGB above-ground biomass on land (t DM ha-1)
BBGB below-ground biomass on land (t DM ha-1) Alternatively, the ratio of root-to-shoot is used:
R ratio of below-ground to above-ground biomass
CF carbon fraction of DM (t C /t DM). The default IPCC 2006 value is 0.47 t C/t DM.

Background Guide for the Calculation of Land Carbon Stocks in the Biofuels Sustainability Scheme Drawing on the 2006 IPCC Guidelines for National Greenhouse Gas Inventories
39
• Computation of C-Stock in Dead Organic Matter
When dead organic matter data (before and/or after conversion) is available the following formula is used:
CDOM = CLI+ CDW= (DOMLI* CFLI)+(DOMDW * CFDW) where
CDOM total carbon stock in the dead organic matter pool on land (t C ha-1)
CLI carbon stock in the litter pool on land (t C ha-1)
CDW carbon stock in the dead wood pool on land (t C ha-1)
and/or alternatively,
DOMLI mass of litter on land (t DM ha-1)
DOMDW mass of dead wood on land (t DM ha-1)
CFLI/WD - carbon fraction of dry matter. The default IPCC 2006 values are 0.50 t C/t dm for dead wood and 0.40 t C/t dm for litter.
However, dead organic matter is of low significance in the land use conversion related to the establishment of biofuel crops.
3.5 Identifying Gaps between the IPCC and the Biofuel Guide Requirements for Biomass and Dead Organic Matter C-Stock Changes
The Guide provides the methodology and data for the computation of the carbon stock changes in land use conversion to biofuel crops. There are differences between the IPCC Guidelines and this Guide in the requirements for the stratification of land categories and the availability of biomass default data.
3.5.1 Biofuel Crops and their Global Distribution For the Tier 1 estimation of carbon stocks and carbon stock changes in conversion of land to biofuel crops, more explicit data on cropland categories and a breakdown on crop types are needed. For that purpose the crop types are categorized as
a) annual and

Background Guide for the Calculation of Land Carbon Stocks in the Biofuels Sustainability Scheme Drawing on the 2006 IPCC Guidelines for National Greenhouse Gas Inventories
40
b) perennial.
Perennials are further categorized as B.1) perennial non-woody and B.2) perennial woody, each of which is further stratified by biofuel crop relevant species. Such detailed stratification is consistent with the IPCC’s categorisation (climate and ecological zones, geographical regions, etc.) and allows for quick estimation of carbon stock changes. Global stratification of relevant biofuel crops is listed in Table 7 (note that this data is not relevant from the point of view of suitability for production).

Background Guide for the Calculation of Land Carbon Stocks in the Biofuels Sustainability Scheme Drawing on the 2006 IPCC Guidelines for National Greenhouse Gas Inventories
41
Table 7: Geographical Distribution of Biofuel Crops within Climatic and Ecological Zones
Species Crop Crop group
(FAO classes)
Annual/ Perennial
Herbaceous/Shrub/Tree Europe North
America
Central and South
America
Asia (continental,
insular) Africa Australia
Barley, Cassava, Cotton, Maize, Rapeseed, Rye, Safflower, Sorghum, Soybean, Sugar beet,
Sunflower, Triticale, Wheat
Various
cereals, roots & tubers, fibre, oil
crops, sugar crops
annual herbaceous Annual C stock “near zero”(i.e. annual net CO2 removal is nil)
Coconut Coconut fruits oil crops perennial tree
TAr TAWa TAWb
TAr TBSh TAWb TAWa
SCf
TAr TAWa TAWb TBSh
Oil palm Oil palm fruits oil crops perennial tree TAr
TAWa
TAr TAWa TAWb
TAr TAWa TBSh
Sugar cane Sugar cane biomass sugar crops perennial herbaceous
SCf SBSh
TAr TAWa
SCf
TAr TBSh TAWb
TAr TAWa
TAWb SCf
Jatropha Jatropha fruits bio fuels perennial shrub
TAr TAWa TAWb
SCf SCs
SBSh
TAr TAWb TAWa TBSh SCf
TeDo TeDc
TeBSk
TAr TBSh TAWb TAWa
SCf SCs
TBSh SBSh SCs SCf
TeDo
Legend (global ecological zones): Tropical rain forest (Tar); Tropical moist deciduous forest (TAWa); Tropical dry forest (TAWb); Tropical shrubland (TBSh); Tropical desert (TBWh); Tropical mountain systems (TM); Subtropical humid forest (SCf); Subtropical dry forest (SCs); Subtropical steppe (SBSh); Subtropical desert (SBWh); Subtropical mountain system (SM); Temperate oceanic forest (TeDo); Temperate continental forest (TeDc); Temperate steppe (TeBSk); Temperate desert (TeBWk); Temperate mountain system (TeM)

Background Guide for the Calculation of Land Carbon Stocks in the Biofuels Sustainability Scheme Drawing on the 2006 IPCC Guidelines for National Greenhouse Gas Inventories
42
3.5.2 Land Use Conversion Matrix The IPCC Guidelines define six broad land-use categories, namely: Forest Land, Cropland, Grassland, Wetlands, Settlements and Other Land. These definitions may incorporate land cover type, land use, or a combination of the two, depending on data availability. The broad land-use categories may be further stratified by climate or ecological zone, soil and vegetation type, biomass stock, etc.
“Before conversion” land categories are strictly defined by the Directive as the most probable sources of land for biofuel crop establishment. Nevertheless, other land use categories are considered in terms of the boundary of the system where emissions may occur directly and/or indirectly (i.e. “leakage”). On lands “after conversion”, the biofuel crops have various biological characteristics which directly determine the amount and duration of the carbon stocks. A matrix of possible land conversions to biofuel crops is shown in Table 8.
Table 8: Land Conversion Matrix for Biofuel Crops (Y – possible land
conversion)
After conversion
Cropland (biofuel crops)
Perennial crops Land use / activity Annual crops Non-woody Woody
Grassland Y (a) Y Y
Forest (<30% canopy cover) Y Y Y
Savannah, wooded savannah and shrublands Y Y Y
Degraded land (degraded forest, degraded grassland, degraded/ marginal cropland)
Y Y Y
Forest land(b) Y Y Y
Bef
ore
conv
ersi
on
Cropland(b) Y Y Y (a) Y - possible land conversion
(b) – these land use categories are considered in terms of boundary
Cropland and grassland are defined according to the IPCC Guidelines. Forest land (with <30% canopy cover) is defined above (i.e. woody vegetation height >5m). Savannah and wooded savannah are considered either as grassland communities with shrubs and trees (with max 10% coverage of area) in the ‘Tropical Moist’ IPCC climate zone (i.e.

Background Guide for the Calculation of Land Carbon Stocks in the Biofuels Sustainability Scheme Drawing on the 2006 IPCC Guidelines for National Greenhouse Gas Inventories
43
the cerrado in South America and savannahs in Africa) or as shrubland. Forest plantations are either under forest or cropland, according to their characteristics.
Degraded land does not fall under a specific land use category in the IPCC land classification, as the process may affect all basic land use types. Degradation is characterized by a lower NDVI, less productivity and production or other features (such as physical disturbances leading to soil erosion) compared to sustainably managed lands. All these make classification of degraded lands and assessment of biomass difficult except under large uncertainty.
On the other hand, it should be kept in mind that often the land may have experienced several successive uses or cover changes before it is finally converted to a biofuel crop. In this case, the initial land use over a reference period should be considered (i.e. 20 years before the biofuel crop is established), but not the intermediary land uses.
3.5.3 Carbon Stock and Change Default Data For their six broad land use categories, the IPCC Guidelines define default data for biomass and dead organic matter, which allow for a Tier 1 estimation of the carbon stock and carbon stock changes for lands which remain in the same category and those under conversion. Additionally, various default parameters are provided (i.e. root-to-shoot ratio; carbon fraction of matter in different pools).
According to the Biofuel Guide the estimation of carbon stock changes is made under the following conservative assumptions:
o for “before” conversion land it is assumed that all biomass and dead organic matter are cleared, thus “near zero” amounts of C remain in these pools and all CO2 is emitted into atmosphere. In natural ecosystems (i.e. grassland, forest land) the biomass/C stocks are assumed to be more or less constant in time (i.e. steady state) reaching a maximum quantity under prevailing natural and management conditions. Dead organic matter is considered to be present only in forest land (i.e. closed forests).
o for “after” conversion land it is assumed that the net CO2 removal from annual crops is nil, while in perennial crops there is a constant CO2 removal proportional to the permanent C stock in biomass (time averaged C stock). It is also assumed that the dead organic matter pool in such lands is nil.
Insofar as possible, consistency of the IPCC Guidelines data was ensured with more recent references (datasets, publications).
A description of the default data for the estimation of carbon stock changes provided by this Guide for each type of land use/activity follows (the data is presented in tables in the Technical Annex).

Background Guide for the Calculation of Land Carbon Stocks in the Biofuels Sustainability Scheme Drawing on the 2006 IPCC Guidelines for National Greenhouse Gas Inventories
44
• Grassland
Default data of the IPCC 2006 Guidelines for biomass are used. The data are consistent with the latest available data (Lasco, 2004; Yichun et al., 2009; Fargione et al., 2008; Germer & Sauerborn, 2008).
• Forest (more than 30% land cover) Considered in terms of boundary. Default IPCC 2006 Guidelines data for biomass and dead organic matter, as well as root-to-shoot IPCC default parameters are used to obtain aggregated forest land data on climatic and ecological zones and geographic domains.
• Forest (less than 30% cover) The definition of forest is important as a country may or may not consider a conversion as deforestation according selected thresholds for tree cover. The FAO18 defines a land as a forest if the tree cover is > 10% of the area, further split in ”open forest” if the tree cover is 10-40% or “closed forest” if it covers more than 40%. For the purpose of defining afforestation/reforestation in the CDM19 of the Kyoto Protocol of UNFCCC20, a “forest” is an area 0.05-1 ha with a minimum tree crown cover of 10–30%, with a ‘tree’ defined as a plant with the capability of growing to be >2–5m tall. So a non-Annex I Party that selected a high threshold for forest cover (i.e. 30%) may have more land available for conversion to cropland “without” carrying out deforestation, compared to a Party that selected a lower threshold for forest (i.e. 10%). Given the complex issue of harmonizing national definitions for forest, all lands with tree cover between 10-30% are considered to fall under this land category (as determined in Chapter 2.2.3).
Biomass/carbon stock data for different types of tree cover are not readily available from the IPCC Guidelines or other sources. In order to quantify the carbon stock on such lands, the Biofuel Guide assumes that tree cover is directly proportional to standing biomass. Thus biomass/carbon stock equals 20% of IPCC default data for forest land biomass under climatic and ecological zoning. This is a conservative approach given that the real amount of biomass/carbon
18 Food and Agriculture Organization of the United Nations. Forest definition available at: ftp://ftp.fao.org/docrep/fao/008/A0400E/A0400E13.pdf 19 Clean Development Mechanism, a flexible instrument of the Kyoto Protocol of the United Nations Framework Convention for Climate Change (UNFCCC) 20 UNFCCC (2002). Report of the Conference of the Parties on its seventh session, held at Marrakesh from 29 October to 10 November 2001 (FCCC/CP/2001/13/Add.1, UNFCCC, Marrakesh, Morocco, 2001). URL: http://unfccc.int/resource/docs/cop7/13a01.pdf

Background Guide for the Calculation of Land Carbon Stocks in the Biofuels Sustainability Scheme Drawing on the 2006 IPCC Guidelines for National Greenhouse Gas Inventories
45
stock is likely to be less than in the case where carbon stock is directly proportional to tree cover.
• Forest plantations
The above-ground biomass default data of the IPCC 2006 Guidelines is used to obtain time averaged carbon stocks in mature plantations (i.e. the value at half cycle), assuming that the land use is under successive cycles of forest plantations. IPCC default root-to-shoot parameters for forest land are used to compute below-ground biomass. Data is organized by main plantation species according to climatic and ecological zones and geographic domains.
• Savannah and wooded savannah The IPCC 2006 Guidelines default data for grassland is used. If more information is available on the regional particularities of the landscape concerned, Shrubland data may also be used for more conservative estimates of carbon stock changes.
• Shrubland An additional detailed table from the IPCC 2006 Guidelines regarding the carbon stock in shrublands across relevant climatic regions is provided and expanded to climatic and ecological zoning according to data from Ruesch and Gibbs (2008) and others (Goetz et al., 2008; Germer and Sauerborn, 2008; Fargione et al., 2008).
• Cropland The biomass/carbon stocks in this category are relevant both for “before” and “after” land conversions. Conservatively, the default biomass data of the IPCC 2006 Guidelines is used for perennial cropland “before” conversion (i.e. orchards, coffee/rubber plantations).
For “after conversion” this Guide provides default carbon stocks by crop type, ecological and climatic zone and geographical regions of the world. The Guide assumes that after the conversion the land use remains stable for several production cycles of the same biofuel crop.
Conservatively, it is assumed that there is no net carbon accumulation in the case of annual biofuel crops (i.e. cassava, cereals, soybean, etc.).
For non-woody perennial crops (sugar cane, miscanthus) only the carbon stock in the permanent compartment of biomass is considered (i.e. belowground: roots and rhizomes), as compiled from various sources (Benizoni, 1988; Ripoli et al., 2000; Kahle et al., 2001; Clifton-Brown et al., 2004; Heaton et al., 2004; Brijder et al., 2005;

Background Guide for the Calculation of Land Carbon Stocks in the Biofuels Sustainability Scheme Drawing on the 2006 IPCC Guidelines for National Greenhouse Gas Inventories
46
Boehmel et al., 2008; Fargione et al., 2008; Woltjer et al., 2008; Atkinson, 2009; Balat & Balata, 2009; Burner et al., 2009; Romjin, 2009). Root-to-shoot data is compiled from existing literature (Kahle et al., 2001; Smith et al., 2005).
In the case of woody perennial crops (oil palm, coconut, jatropha, jojoba), there is a gradual net accumulation of carbon in biomass followed by its sudden removal at the end of the cycle. Production cycle varies in accordance with species and local conditions: coconut (50 years); oil palm (25); jatropha (20); jojoba (20); miscanthus (15); sugarcane (15). Carbon stock is assumed to be the “average storage” as a time-integrated carbon accumulation in biomass occurs over the crop cycle (Schroeder, 1992). Thus, there is an overestimation of carbon stock in the first part of the production cycle and an underestimation for last half of the cycle, but a spatial-temporal compensation is expected under large areas with such crops. Biomass/carbon -stock data is compiled from the IPCC 2006 Guidelines and various other sources (Benizoni, 1988; Palm and Härdter, 2000; Lasco, 2002; Fairhurst & Härdter, 2003; Leigh, 2007; Jongschaap et al., 2007; Patolia et al., 2007; Wicke et al., 2008; Miles et al., 2008; Romjin, 2009).
When original data are reported as fresh matter, a humidity correction factor of 30% is applied in order to convert from air-dried fresh matter to dry matter.
• Degraded land
Biomass data is essentially missing for degraded land even in the lower Tiers. From a methodological perspective there are two situations here:
1) “before conversion” land falls under the cropland category (i.e. marginal or degraded) where it is expected that biofuel crop establishment would lead to an increase of the carbon stock in all pools. In the case of forest plantations established on such lands, it is conservatively assumed that the carbon stock equals to an amount corresponding to the time-averaged carbon stocks in mature plantations (i.e. value at the half cycle). Biomass data is derived from the IPCC 2006 Guidelines. Other pools are conservatively not considered. Where other non-woody biofuel crops are established on such lands, the default C stocks set for cropland should be used.
2) low carbon status in biomass on land “before conversion” (i.e. either forest or grassland). Degraded land pools are poorer in carbon than normal land (i.e. sustainably managed or natural land). Estimating carbon stocks in degraded land is problematic insofar as “degraded land” is a generic definition which does not allow for quantitative inferences. Under various types of degradation (i.e. intensity, duration), degraded forest land shows long term degradation with 25-50% less carbon than normal. For grasslands, this figure reaches 60-90% (Mutinho & Schwartzman, 2005; Miles et al., 2008; IPCC, 2000).

Background Guide for the Calculation of Land Carbon Stocks in the Biofuels Sustainability Scheme Drawing on the 2006 IPCC Guidelines for National Greenhouse Gas Inventories
47
Thus, on degraded grassland (including pasture, grazing land, etc.), in order to estimate the carbon stocks in a way that is consistent with IPCC stratification, it is considered that 40% of the IPCC Guidelines default biomass is still present on such lands.
For the purpose of this Biofuel Guide requirements, under Tier 1 we assume that the forest crown cover is proportional to the standing biomass. The superior limit of the FAO’s threshold forest cover range (between 10-30%) is selected as reflecting total C stock in the case of forest degradation. Thus we consider that 30% of default biomass is present on degraded forest lands, under a global stratification consistent with IPCC climatic, ecological and geographical zoning.
Uncertainty associated with carbon-stock data is allowed for in accordance with the source (IPCC Guidelines) or computed as 1 standard error relative to the average of available data.
3.6 Table of Coefficients for Above- and Below-Ground Carbon Stock Changes
Carbon stock data calculated according to climatic, ecological and geographic zoning are given in Tables 9 to 17 of the Technical Annexes according to each type of land use. For the computation of the C-stock change in land conversion, appropriate values from tables should be extracted; the value of “before” carbon stock value should subtracted from the “after” value, according to 3.4.1. In order to estimate the emissions as a result of carbon stock changes, the result should be multiplied by -1 (a negative result indicates the removal of CO2, a positive result indicates emissions of CO2).
• Data for conversion from Grassland – see Table 5 of the Technical Annex
• Data for conversion from Forestland (less than 30 % cover) – see Table 6 of the Technical Annex
• Data for conversion from Forestland (more than 30 % cover) – see Table 7 of the Technical Annex
• Data for conversion from Shrubland – see Table 8 of the Technical Annex
• Data for conversion from Perennial crops – see Table 9 of the Technical Annex
• Data for conversion from/to Forest plantations - see Table 10 of the Technical Annex
• Data for conversion from Degraded Grassland – see Table 11 of the Technical Annex
• Data for conversion from Degraded Forest – see Table 12 of the Technical Annex
• Data for conversion to Cropland on biofuel crops type - see Table 13 of the Technical Annex

Background Guide for the Calculation of Land Carbon Stocks in the Biofuels Sustainability Scheme Drawing on the 2006 IPCC Guidelines for National Greenhouse Gas Inventories
48

Background Guide for the Calculation of Land Carbon Stocks in the Biofuels Sustainability Scheme Drawing on the 2006 IPCC Guidelines for National Greenhouse Gas Inventories
49
4 EXISTING TOOLS AND DATA SUPPORT
In this section, we present the tools and data that an economic operator can use for calculating carbon stock changes.
4.1 Existing Tools for Soil Carbon Stock Changes
As part of the "Good Practice Guidance for Land Use, Land-Use Change and Forestry" software called "Tools for Estimation of Changes in Soil Carbon Stocks associated with management Changes in Croplands and Grazing Lands based on IPCC Default Data"21 is provided under Annex 4A.1. This tool is a database implementation which combines the default reference values with the change coefficients by country.
The data tables of the tool and the accompanying help files also contain information on the classification of the input maps. The information on the classification of the soil and climate layer shows some differences with the procedures documented in the main text:
• Climate zones are defined for 9 classes instead of 12. The reduction is achieved
by merging the classes of Polar regions with those of Boreal regions. Not included is the class of Tropical Montane.
• The Warm Temperate, dry region was defined as having a mean annual precipitation of < 600mm instead of a positive difference between mean annual precipitation and potential evapo-transpiration.
• The temperature range for the Tropical zones was set at 20°C instead of the 18°C specified in the IPCC classification scheme.
• Sandy Soils were defined as Arenosols in the WRB classification instead of according to the texture-based rule (Sand > 70% AND Clay < 8%).
No differences were found in the default values or the coefficients between the tool’s data tables and the information provided under the help functionality.
21 http://www.ipcc-nggip.iges.or.jp/public/gpglulucf/annex4a1.html

Background Guide for the Calculation of Land Carbon Stocks in the Biofuels Sustainability Scheme Drawing on the 2006 IPCC Guidelines for National Greenhouse Gas Inventories
50
4.2 Spatial Data for the Calculation of Carbon-Stock Changes
All the spatial data which are useful for the calculation of soil carbon-stock changes according to land use conversion and which are presentation in this Guide will be available from the SOIL Action website of the JRC at: http://eusoils.jrc.ec.europa.eu/.
Acknowledgements The authors would like to thank Paul Hodson and Ewout Deurwaarder (DG ENER) for giving guidance where specific details of the Directive were concerned and providing invaluable comments on the presentation in this Guide. Further thanks go to Luisa Marelli (JRC-IE) for her initiative and enthusiasm to launch the work to this Guide. The authors and any reader are further indebted to Grainne Mulhern (JRC-IES) for her patience in going through all corners of the text and making this Guide so much more accessible to a wider audience.

Background Guide for the Calculation of Land Carbon Stocks in the Biofuels Sustainability Scheme Drawing on the 2006 IPCC Guidelines for National Greenhouse Gas Inventories
51
References
Allen, R.G., M. Smith, A. Perrier and L.S. Pereira, 1994. An update for the calculation of reference Evapotranspiration. ICID Bulletin of the International Commission on Irrigation and Drainage 43(2). p. 35-92.
Annoni, A., C. Luzet, E. Gubler and J. Ihnde (2001) Map Projections for Europe. European Commission Joint Research Centre, Ispra, Italy. EUR 20120 EN. 131pp.
Arrouays, D., Balesdent, J., Germon, J.C, Jayet, P.A., Soussana, J.F., Stengel, P., 2002. Increasing carbon stocks in French agricultural soils? Synthesis of an assessment report, INRA Paris, 33pp.
Arrouays, D., Saby, N., Walter , C., Lemercier, B., Schvartz, C., 2006. Relationships between particle-size distribution and organic carbon in French arable topsoils . Soil Use and Management, 22, p. 48-51.
Atkinson, C.J., 2009. Establishing perennial grass energy crops in the UK: A review of current propagation options for Mischanthus – Review., Biomass and Bioenergy 33 (2009), p. 752–759
Bai, Z.G., D.L Dent, L. Olsson, and M.E Schaepman, 2008. Proxy global assessment of land degradation. Soil Use and Management, 24, p. 223–234.
Balat, M. and Balata, H., 2009. Recent trends in global production and utilization of bio-ethanol fuel. In Applied Energy, Volume 86, Issue 11, November 2009, p. 2273-2280
Barthelmes, A., J. Couwenberg and H. Joosten, 2009. Peatlands in national inventory submissions 2009 – an inventory of 10 European countries. Wetlands International Ede., June, 2009. 26pp.
Batjes, N.H., 1996. Total carbon and nitrogen in the soils of the World. European Journal of Soil Science, June 1996, Vol. 47. p. 151-163.
Benizoni, A., 1988. Water status and its control in Jojoba (Simmondsia chinensis L.). In proceedings of the Seventh International Conference on Jojoba and its uses (Eds. AR Baldwin). American Oil Chemist’society, Champaign, Illionois
Bernoux, M., M.D.S.Carvalho, B. Volkoff and C.C. Ceri, 2002. Brazil’s carbon stocks. Soil Science Society of America Journal 66, p. 888-896.
Bicheron P., P. Defourny, C. Brockmann, L. Schouten, C. Vancutsem, M. Huc, S. Bontemps, M. Leroy, F. Achard, M. Herold, F. Ranera and O. Arino (2008) CLOBCOVER: Products Descroption and Validation Report. MEDIAS France, 18, avenue E. Belin, bpi 2102, 31401 Toulouse Cedex 9, France. 47pp. ftp://us-ext-nas.eo.esa.int/global/GLOBCOVER_Products_Description_Validation_Report_I2.1.pdf
Boehmel, C., Lewandowski, I. and Claupein, W., 2008. Comparing annual and perennial energy cropping systems with different management intensities. Agricultural Systems 96: 224–236
Brijder, S., van Breugel, JV., Hesselink, LK., van Klink, J.I., Oosterling, P.A., Oosterling, J.I. and Muller. P., 2005. Feasibility study on an effective and sustainable bio-ethanol production program by Least Developed Countries as alternative to cane sugar export, Dutch Sustainable Development Group.

Background Guide for the Calculation of Land Carbon Stocks in the Biofuels Sustainability Scheme Drawing on the 2006 IPCC Guidelines for National Greenhouse Gas Inventories
52
http://www.swilion.nl/documenten/DSD%20Rapport.pdf (last accessed: September, 2009).
Burner. D.M., Tew. T.L., Harvey. J.J. and Belesky. D.P., 2009. Dry matter partitioning and quality of Miscanthus, Panicum and Saccharum genotypes in Arkansas, USA, Biomass and Bioenergy 33(2009): 610–619
Clifton-Brown. J.C., Stampfel. P.F. and Jones, M.B., 2004. Miscanthus biomass production for energy in Europe and its potential contribution to decreasing fossil fuel carbon emissions, Global Change Biology 10, 509–518, doi: 10.1111/j.1529-8817.2003.00749.x (last accessed: September, 2009).
Dawson, J.J.C., and P. Smith, 2007. Carbon losses from soil and its consequences for land-use management. Science of the Total Environment 382, 165-190pp.
Couwenberg, J., 2009. Emission factors for managed peat soils – An analysis of IPCC default values. Wetlands International Ede., June, 2009. 13pp.
Di Greggio, A, and L.J.M. Jansen, 2000. Land Cover Classification System (LCCS): Classification Concepts and User Manual. FAO, Rome. ISBN 92-5-104216-0. http://www.fao.org/docrep/003/x0596e/x0596e00.HTM
Duffie, J. A. and W.A. Beckman, 1991. Solar Engineering of Thermal Processes, 2nd ed. J. Wiley and Sons, New York. 919pp.
Fairhurst, T. and Härdter, R. (Eds), 2003. Oil palm plantation Malaysia, PPI/PPIC and IPI, Singapore. 384p.
FAO, 1998. World reference base for soil resources. World Soil Resources Reports 84, 88pp.
FAO, 2006/7. World Reference Base for Soil Resources 2006, first update 2007. World Soil Resources. Reports 103, ix+116pp.
FAO/IIASA/ISRIC/ISS-CAS/JRC, 2008. Harmonized World Soil Database (version 1.0). FAO, Rome, Italy and IIASA, Laxenburg, Austria.
Fargione, J., Hill J., Tilman, D., Polasky, S. and Hawthorne, P., 2008. Land clearing and biofuel carbon debt, www.sciencemag.org/cgi/content/full/1152747/DC1, DOI:10.1126/science.1152749 (last accessed: September, 2009).
Fischer, G., F. Nachtergaele, S. Prieler, H.T. van Velthuizen, L. Verelst, and D.Wiberg, 2008. Global Agro-ecological Zones Assessment for Agriculture (2008). IIASA, Laxenburg, Austria and FAO, Rome, Italy.
Friedl, M.A., D.K. McIver, J C F. Hodges, X.Y. Zhang, D. Muchoney, A.H. Strahler, C.E. Woodcock, S. Gopal, A. Schneider, A. Cooper, A. Baccini, F. Gao and C. Schaaf, 2002. Global land cover mapping from MODIS: Algorithms and early results. Remote Sens. Environ., 83. p. 287–302.
Follet, R.F., 2001. Soil management concepts and carbon sequestration in croplands. Soil and Tillage Research 61, p. 77-92.
Freibauer, A. , M. D.A. Rounsevell, P. Smith, J. Verhagen, 2004. Carbon sequestration in the agricultural soils of Europe. Geoderma 122, p. 1-23.

Background Guide for the Calculation of Land Carbon Stocks in the Biofuels Sustainability Scheme Drawing on the 2006 IPCC Guidelines for National Greenhouse Gas Inventories
53
Germer, J. and Sauerborn, J., 2008. Estimation of the impact of oil palm plantation establishment on greenhouse gas balance; Environ Dev Sustain (2008) 10:697–716.., DOI 10.1007/s10668-006-9080-1 (last accessed: September, 2009).
Global Ecosystems Database Project, 2000. Global Ecosystems Database Version II: Database, User's Guide, and Dataset Documentation. US Department of Commerce, National Oceanic and Atmospheric Administration, National Geophysical Data Center, Boulder, Colorado. KGRD #35.
Global Land Cover 2000 database. European Commission, Joint Research Centre (2003) http://bioval.jrc.ec.europa.eu/products/glc2000/glc2000.php
Goetz, S.J., Baccini, A., Laporte, N.T., Johns, T.,Walker, W., Kellndorfer, J., Houghton, R.A. and Sun, M.,2009. Mapping and monitoring carbon stocks with satellite observations: a comparison of methods. Carbon Balance and Management 2009, 4:2. http://www.cbmjournal.com/content/4/1/2 (last accessed: September, 2009).
Grassi, G., Monni, S., Federici, S., Achard, F. and Mollicone, D., 2008. Applying the conservativeness principle to REDD to deal with the uncertainties of the estimates, In Environ. Res. Lett. 3,Volume 3, Number 3 2008; doi: 10.1088/1748-9326/3/3/035005 (last accessed: September, 2009)
Guo L.B., R.M. Gilford, 2002. Soil carbon stocks and land use change: a meta analysis. Global Change Biology, 8, p. 345-360.
Heaton, E.A., Clifton-Brown, J., Voight, T.B., Jones, B. and Long, S.P., 2004. Miscanthus for renewable energy generation: European Union experience and projections for Illinois., Mitigation and Adaptation Strategies for Global Change 9: 433–451
Hiederer, R., 2009. Distribution of Organic Carbon in Soil Profile Data. EUR 23980 EN. Luxembourg: Office for Official Publications of the European Communities. 126pp.
Hijmans, R.J., S.E. Cameron, J.L. Parra, P.G. Jones and A. Jarvis, 2005. Very high resolution interpolated climate surfaces for global land areas. International Journal of Climatology 25, p.1965-1978.
Holdridge, L.R., 1947. Determination of world plant formations from simple climatic data. Science, 105, p.367-368.
IFA 2009. Website of the International Fertilizer Association http://www.fertilizer.org/ifa/ifadata/search
IFA/IFDC/FAO 1999. Fertilizer use by crop, 4th edition, compiled by the International Fertilizer Industry Association, the International Fertilizer Development Center and Food and Agriculture Organization of the United Nations.
Intergovernmental Panel on Climate Change (IPCC), 2000. IPCC special report on land use, land-use change, and forestry. ISBN 92-9169-114-3.
Intergovernmental Panel on Climate Change (IPCC), 2003. Good Practice Guidance for Land Use, land-Use Change and Forestry. Penman, J., Gytarsky, M., Hiraishi, T., Kruger, D., Pipatti, R., Buendia, L., Miwa, K., Ngara, T., Tanabe, K. and Wagner, F. (Eds). Intergovernmental Panel on Climate Change (IPCC), IPCC/IGES, Hayama, Japan.
Intergovernmental Panel on Climate Change (IPCC) (2006) 2006 Guidelines for National Greenhouse Gas Inventories. Eggelstone, S., L. Buemdia, K. Miwa, T. Ngara and K. Tanabe (Eds.). IPCC/OECD/IEA/IGES, Hayama, Japan.

Background Guide for the Calculation of Land Carbon Stocks in the Biofuels Sustainability Scheme Drawing on the 2006 IPCC Guidelines for National Greenhouse Gas Inventories
54
Izaurralde, C.R., N.J. Rosenberg, R. Lal, 2001. Mitigation of climatic change by soil carbon sequestration: issues of science, monitoring, and degraded lands. Advances in Agronomy 70. Academic Press Eds. 75pp.
Jobbagy, E.G. and R.B. Jackson, 2000. The vertical distribution of soil organic carbon and its relation to climate and vegetation. Ecological Applications 19, 2, p. 423-436.
Jongschaap, R.E.E., Corre, W.J., Bindraban, P.S., Brandenburg, W.A., 2007. Claims and facts on Jatropha curcas L., Global Jatropha curcas evolution, breeding and propagation programme, Report 158, Stichting Het Groene Woudt, Laren, Plan Reasearch International BV, Wageningen
Joosten, H., 2009. The long and winding peatland road to Copenhagen, stage Bonn III. IMCG Newsletter 2009(2): p. 20-23.
Joosten, H. and D. Clarke, 2002. Wise use of mires and peatlands – Background and principles including a framework for decision-making. International Mire Conservation Group / International Peat Society, 304pp.
Jones, A., V. Stolbovoy, C. Tarnocai, G. Broll, O. Spaargaren and L. Montanarella (eds.), 2010, Soil Atlas of the Northern Circumpolar Region. European Commission, Office for Official Publications of the European Communities, Luxembourg. 142 pp.
JRC/PBL 2009: Emissions Database for Global Atmospheric Research (EDGAR v4.0) Online available at http://edgar.jrc.ec.europa.eu/.
Kahle, P., Beuchb, S., Boelckeb, B., Leinweberb, P., Schultenb, H.R. 2001. Cropping of Miscanthus in Central Europe: biomass production and influence on nutrients and soil organic matter. European Journal of Agronomy, Volume 15, Issue 3, November 2001, p. 171-184
Kay, A.L. and H.N. Davis, 2008. Calculating potential evapotranspiration from climate model data: A source of uncertainty for hydrological climate change impacts. Journal of Hydrology (358) p. 221-239.
Kasimir-Klemedtsson, Å., Klemedtsson, L., Berglund, K., Martikainen, P.J., Silvola, J. and Oenema, O. 1997. Greenhouse gas emissions from farmed organic soils: a review. Soil Use and Management 13: p. 245-250.
Keith, H., B.G. Mackey, and D.B. Lindenmayer, 2009. Re-evaluation of forest biomass carbon stocks and lessons from the world’s most carbon-dense forests. Proceeding of the National Academy of Sciences of the United States of America. vol. 106 no. 28 11635-11640.
Kottek, M., J. Grieser, C. Beck, B. Rudolf and F. Rubel, 2006. World Map of the Köppen-Geiger climate classification updated. Meteorol. Z., 15, 259-263. DOI: 10.1127/0941-2948/2006/0130.
Lasco, R.D., 2002. Forest carbon budgets in Southeast Asia following harvesting and land cover change, Vol. 45 Supp. Science in China (Series C), October 2002
Leemans, R., 1990. Possible Changes in Natural Vegetation Patterns Due to a Global Warming. IIASA Working Paper WP90-08 and Publication Number 108 of the Biosphere Dynamics Project. Laxenburg, Austria: International Institute of Applied Systems Analysis. 22pp.
Leigh, D., 2007. Jatropha Biomass: Energy for the Future. http://www.agmrc.org/media/cms/Sustainable_Energy_Student_Presenta_B2E661150F5F8.ppt (last accessed: September 2009)

Background Guide for the Calculation of Land Carbon Stocks in the Biofuels Sustainability Scheme Drawing on the 2006 IPCC Guidelines for National Greenhouse Gas Inventories
55
Miles, L., Kapos, V., Gibbs, H.K., Lysenko, I. and Campbell A., 2008. Mapping vulnerability of tropical forest to conversion and resulting potential CO2 emissions. A rapid assessment for the Eliasch Review. UNEP World Conservation Monitoring Centre
Moutinho, P. and Schwartzman, S. (Eds), 2005. Tropical Deforestation and Climate Change, Amazon Institute for Environmental Research, 131 pages
Oudin, L., F. Hervieu, C. Michel, C. Perrin, V. Andréassian, F. Anctil and C. Loumagne, 2005. Which potential evapotranspiration input for a limped rainfall-runoff model? Part 2 - Towards a simple and efficient potential evaportranspiration model for rainfall-runoff modelling. Journal of Hydrology 303, p. 290-306.
Palm, C.A., Woomer, P.L. et al. 2000. Strategic Information On Changes In Carbon Stocks And Land-Use. http://www.asb.cgiar.org/data/dataset/cstock.asp (last accessed: September 2009)
Parish, F., Sirin, A., Charman, D., Joosten, H., Minayeva, T., Silvius, M. and Stringer, L. (Eds.) 2008. Assessment on Peatlands, Biodiversity and Climate Change: Main Report. Global Environment Centre, Kuala Lumpur and Wetlands International, Wageningen. 179pp.
Patolia, J.S., Ghosh, A., Chikara, J., Chaudhary, D.R., Parmar, D.R. and Bhuva H.M., 2007. Response of Jatropha curcas grown on wasteland to N and P fertilization, Fact seminar CSM CRI
Peel, M. C., B.L. Finlayson and T.A. McMahon, 2007. "Updated world map of the Köppen-Geiger climate classification". Hydrol. Earth Syst. Sci. 11, p. 1633–1644. ISSN 1027-5606.
Ramankutty, N., A. T. Evan, C. Monfreda, and J. A. Foley, 2008. Farming the planet: 1. Geographic distribution of global agricultural lands in the year 2000. Global Biogeochemical Cycles, Vol. 22, GB1003, doi:10.1029/2007GB002952.
Rieley, J., 2007. Tropical Peatlands. International Peat Society. Peatlands and Peat: http://www.peatsociety.org/index.php?id=222 (last accessed: September, 2009).
Ripoli, T.C.C., Molina, W.F. and Ripoli, M.L., 2000. Energetic potential of the sugar cane biomass in Brazil, Riv. Di Ing. Agr. (2000), 1, p. 2-7
Romijn, H.A., 2009. Land clearing and greenhouse gas emissions from Jatropha biofuels on African Miombo woodland. http://www.fact-foundation.com/en/Publications/Media_Library/Full_Library (last accessed: September, 2009)
Ruesch, A. and Gibbs, H.K., 2008. New IPCC Tier1Global Biomass Carbon Map For the Year 2000. Available online from the Carbon Dioxide Information Analysis Center [http://cdiac.ornl.gov], Oak Ridge National Laboratory, Oak Ridge, Tennessee
Schroeder, P.E., 1992. Carbon storage potential of short rotation tropical tree plantations. Forest Ecology and Management, Vol. 50, no. 1-2, p. 31-41
Seguin B., D. Arrouays, J. Balesdent, J.F. Soussana, A. Bondeau, P. Smith, S. Zaehle, N. de Noblet, N. Viovy, 2007. Moderating the impact of agriculture on climate. Agricultural and Forest Meteorology 142, p. 278–287.
Smith, D.M., Inman-Bamber N.G. and Thorburn P.J., 2005. Sugarcane physiology: Integrating from cell to crop to advance sugarcane production. Field Crops Research, Volume 92, Issues 2-3, p. 169-183

Background Guide for the Calculation of Land Carbon Stocks in the Biofuels Sustainability Scheme Drawing on the 2006 IPCC Guidelines for National Greenhouse Gas Inventories
56
Smith, P., D. Martino, Z. Cai, D. Gwary, H. Janzen, P. Kumar, B. McCarl, S. Ogle, F. O’Mara, C. Rice, B. Scholes, O. Sirotenko, 2007. Agriculture. In Climate Change 2007: Mitigation. Contribution of Working Group III to the Fourth Assessment Report of the Intergovernmental Panel on Climate Change [B. Metz, O.R. Davidson, P.R. Bosch, R. Dave, L.A. Meyer (eds)], Cambridge University Press, Cambridge, United Kingdom and New York, NY, USA.
Thuille, A., and E.-D. Schulze. 2006. Carbon dynamics in successional and afforested spruce stands in Thuringia and the Alps. Global Change Biology, 12, p. 325–342.
UNEP (1997) World atlas of desertification (2nd edition). United Nations Environmental Programme, Nairobi, Kenya.
Wicke, B., Dornburg V., Junginger M. and Faaij A., 2008. Different palmoil production systems for energy purposes and their greenhouse gas implications. Biomass and Bioenergy 32 (2008), p. 1322–1337
Woltjer, G., Guliet, M., Brouwer, F., Nowicki, P., 2008. Background note - Technologies and pathways of bioenergy production, WUR-LEI/Biomass Normandie, April 2008. http://agrinergy.ecologic.eu/download/Background-note-WG2_Technologies.pdf (last accessed: September, 2009)
Yichun, X., Shab, Z., Yua, M, Baic, Y. and Zhange, L., 2009. A comparison of two models with Landsat data for estimating above ground grassland biomass in Inner Mongolia, China. Ecological Modelling 220 (2009), p. 1810–1818

Background Guide for the Calculation of Land Carbon Stocks in the Biofuels Sustainability Scheme Drawing on the 2006 IPCC Guidelines for National Greenhouse Gas Inventories
57
ANNEX to
Background Guide for the Calculation of Land Carbon Stocks in the Biofuels Sustainability Scheme Drawing on the 2006 IPCC
Guidelines for National Greenhouse Gas Inventories

Background Guide for the Calculation of Land Carbon Stocks in the Biofuels Sustainability Scheme Drawing on the 2006 IPCC Guidelines for National Greenhouse Gas Inventories
58
Table 9: Coefficients for Conversion from Grasslands and Savannahs
Table 9a- Coefficients for conversion from grasslands and savannahs (DC: Default Carbon Value) Fraction Land use (FLU) = 1
Climate Zone Land Use Management Input
Temperate Regime
Moisture Regime
FLU FMG FI
Dc*FLU*FMG*FI Final Error
Temperate/Boreal Dry Grassland Non degraded Medium DC*1*1*1 NA High DC*1*1*1.11 NA Improved Medium DC*1*1.14*1 NA High DC*1*1.14*1.11 NA Moist/wet Grassland Non degraded Medium DC*1*1*1 NA High DC*1*1*1.11 NA Improved Medium DC*1*1.14*1 NA High DC*1*1.14*1.11 NA Tropical Dry Grassland Non degraded Medium DC*1*1*1 NA High DC*1*1*1.11 NA Improved Medium DC*1*1.17*1 NA High DC*1*1.17*1.11 NA Moist/wet Savannah Non degraded Medium DC*1*1*1 NA High DC*1*1*1.11 NA Improved Medium DC*1*1.17*1 NA High DC*1*1.17*1.11 NA Tropical Montane Dry Grassland Non degraded Medium DC*1*1*1 NA High DC*1*1*1.11 NA Improved Medium DC*1*1.16*1 NA High DC*1*1.16*1.11 NA

Background Guide for the Calculation of Land Carbon Stocks in the Biofuels Sustainability Scheme Drawing on the 2006 IPCC Guidelines for National Greenhouse Gas Inventories
59
Table 9b- Coefficients for conversion to croplands (DC: Default Carbon Value)
Climate Zone Land Use Management Input
Temperate Regime
Moisture Regime FLU FMG FI
Dc*FLU*FMG*FI Final Error
Temperate/Boreal Dry Long-term cultivated Full-tillage Low DC*0.8*1*0.95 NA Medium DC*0.8*1*1 NA High with manure DC*0.8*1*1.37 NA High without manure DC*0.8*1*1.04 NA Reduced tillage Low DC*0.8*1.02*0.95 28% Medium DC*0.8*1.02*1 NA High with manure DC*0.8*1.02*1.37 27% High without manure DC*0.8*1.02*1.04 28% No till Low DC*0.8*1.1*0.95 27% Medium DC*0.8*1.1*1 NA High with manure DC*0.8*1.1*1.37 26% High without manure DC*0.8*1.1*1.04 27% Moist/wet Long-term cultivated Full-tillage Low Dc*0.69*1*0.92 NA Medium Dc*0.69*1*1 NA High with manure Dc*0.69*1*1.44 NA High without manure Dc*0.69*1*1.11 NA Reduced tillage Low Dc*0.69*1.08*0.92 31% Medium Dc*0.69*1.08*1 NA High with manure Dc*0.69*1.08*1.44 30% High without manure Dc*0.69*1.08*1.11 27% No till Low Dc*0.69*1.15*0.92 30% Medium Dc*0.69*1.15*1 NA High with manure Dc*0.69*1.15*1.44 29% High without manure Dc*0.69*1.15*1.11 26%

Background Guide for the Calculation of Land Carbon Stocks in the Biofuels Sustainability Scheme Drawing on the 2006 IPCC Guidelines for National Greenhouse Gas Inventories
60
Climate Zone Land Use Management Input
Temperate Regime
Moisture Regime FLU FMG FI
Dc*FLU*FMG*FI Final Error
Tropical Dry Long-term cultivated Full-tillage Low DC*0.58*1*0.95 NA Medium DC*0.58*1*1 NA High with manure DC*0.58*1*1.37 NA High without manure DC*0.58*1*1.04 NA Reduced tillage Low DC*0.58*1.09*0.95 83% Medium DC*0.58*1.09*1 NA High with manure DC*0.58*1.09*1.37 82% High without manure DC*0.58*1.09*1.04 83% No till Low DC*0.58*1.17*0.95 82% Medium DC*0.58*1.17*1 NA High with manure DC*0.58*1.17*1.37 81% High without manure DC*0.58*1.17*1.04 82% Moist/wet Long-term cultivated Full-tillage Low DC*0.48*1*0.92 NA Medium DC*0.48*1*1 NA High with manure DC*0.48*1*1.44 NA High without manure DC*0.48*1*1.11 NA Reduced tillage Low DC*0.48*1.15*0.92 68% Medium DC*0.48*1.15*1 NA High with manure DC*0.48*1.15*1.44 67% High without manure DC*0.48*1.15*1.11 64% No till Low DC*0.48*1.22*0.92 68% Medium DC*0.48*1.22*1 NA High with manure DC*0.48*1.22*1.44 66% High without manure DC*0.48*1.22*1.11 63% Tropical Montane n/a Long-term cultivated Full-tillage Low DC*0.64*1*0.94 NA Medium DC*0.64*1*1 NA High with manure DC*0.64*1*1.41 NA

Background Guide for the Calculation of Land Carbon Stocks in the Biofuels Sustainability Scheme Drawing on the 2006 IPCC Guidelines for National Greenhouse Gas Inventories
61
Climate Zone Land Use Management Input
Temperate Regime
Moisture Regime FLU FMG FI
Dc*FLU*FMG*FI Final Error
High without manure DC*0.64*1*1.08 NA Reduced tillage Low DC*0.64*1.09*0.94 150% Medium DC*0.64*1.09*1 NA High with manure DC*0.64*1.09*1.41 150% High without manure DC*0.64*1.09*1.08 150% No till Low DC*0.64*1.16*0.94 150% Medium DC*0.64*1.16*1 NA High with manure DC*0.64*1.16*1.41 150% High without manure DC*0.64*1.16*1.08 150% Temperate/Boreal Dry Paddy rice Full-tillage Low DC*1.1*1*0.95 NA Medium DC*1.1*1*1 NA High with manure DC*1.1*1*1.37 NA High without manure DC*1.1*1*1.04 NA Reduced tillage Low DC*1.1*1.02*0.95 69% Medium DC*1.1*1.02*1 NA High with manure DC*1.1*1.02*1.37 68% High without manure DC*1.1*1.02*1.04 59% No till Low DC*1.1*1.1*0.95 68% Medium DC*1.1*1.1*1 NA High with manure DC*1.1*1.1*1.37 67% High without manure DC*1.1*1.1*1.04 68% Moist/wet Paddy rice Full-tillage Low DC*1.1*1*0.92 NA Medium DC*1.1*1*1 NA High with manure DC*1.1*1*1.44 NA High without manure DC*1.1*1*1.11 NA Reduced tillage Low DC*1.1*1.08*0.92 70% Medium DC*1.1*1.08*1 NA

Background Guide for the Calculation of Land Carbon Stocks in the Biofuels Sustainability Scheme Drawing on the 2006 IPCC Guidelines for National Greenhouse Gas Inventories
62
Climate Zone Land Use Management Input
Temperate Regime
Moisture Regime FLU FMG FI
Dc*FLU*FMG*FI Final Error
High with manure DC*1.1*1.08*1.44 69% High without manure DC*1.1*1.08*1.11 66% No till Low DC*1.1*1.15*0.92 69% Medium DC*1.1*1.15*1 NA High with manure DC*1.1*1.15*1.44 68% High without manure DC*1.1*1.15*1.11 65% Tropical Dry Paddy rice Full-tillage Low DC*1.1*1*0.95 NA Medium DC*1.1*1*1 NA High with manure DC*1.1*1*1.37 NA High without manure DC*1.1*1*1.04 NA Reduced tillage Low DC*1.1*1.09*0.95 72% Medium DC*1.1*1.09*1 NA High with manure DC*1.1*1.09*1.37 71% High without manure DC*1.1*1.09*1.04 72% No till Low DC*1.1*1.17*0.95 71% Medium DC*1.1*1.17*1 NA High with manure DC*1.1*1.17*1.37 70% High without manure DC*1.1*1.17*1.04 71% Moist/wet Paddy rice Full-tillage Low DC*1.1*1*0.92 NA Medium DC*1.1*1*1 NA High with manure DC*1.1*1*1.44 NA High without manure DC*1.1*1*1.11 NA Reduced tillage Low DC*1.1*1.15*0.92 72% Medium DC*1.1*1.15*1 NA High with manure DC*1.1*1.15*1.44 71% High without manure DC*1.1*1.15*1.11 68% No till Low DC*1.1*1.22*0.92 71%

Background Guide for the Calculation of Land Carbon Stocks in the Biofuels Sustainability Scheme Drawing on the 2006 IPCC Guidelines for National Greenhouse Gas Inventories
63
Climate Zone Land Use Management Input
Temperate Regime
Moisture Regime FLU FMG FI
Dc*FLU*FMG*FI Final Error
Medium DC*1.1*1.22*1 NA High with manure DC*1.1*1.22*1.44 70% High without manure DC*1.1*1.22*1.11 67% Tropical Montane n/a Paddy rice Full-tillage Low DC*1.1*1*0.94 NA Medium DC*1.1*1*1 NA High with manure DC*1.1*1*1.41 NA High without manure DC*1.1*1*1.08 NA Reduced tillage Low DC*1.1*1.09*0.94 150% Medium DC*1.1*1.09*1 NA High with manure DC*1.1*1.09*1.41 150% High without manure DC*1.1*1.09*1.08 150% No till Low DC*1.1*1.16*0.94 150% Medium DC*1.1*1.16*1 150% High with manure DC*1.1*1.16*1.41 150% High without manure DC*1.1*1.16*1.08 150% Temperate/Boreal Dry Perennial/ Tree crop Full-tillage Low DC*1*1*0.95 NA Medium DC*1*1*1 NA High with manure DC*1*1*1.37 NA High without manure DC*1*1*1.04 NA Reduced tillage Low DC*1*1.02*0.95 69% Medium DC*1*1.02*1 NA High with manure DC*1*1.02*1.37 68% High without manure DC*1*1.02*1.04 69% No till Low DC*1*1.1*0.95 68% Medium DC*1*1.1*1 NA High with manure DC*1*1.1*1.37 67% High without manure DC*1*1.1*1.04 68%

Background Guide for the Calculation of Land Carbon Stocks in the Biofuels Sustainability Scheme Drawing on the 2006 IPCC Guidelines for National Greenhouse Gas Inventories
64
Climate Zone Land Use Management Input
Temperate Regime
Moisture Regime FLU FMG FI
Dc*FLU*FMG*FI Final Error
Moist/wet Perennial/ Tree crop Full-tillage Low DC*1*1*0.92 NA Medium DC*1*1*1 NA High with manure DC*1*1*1.44 NA High without manure DC*1*1*1.11 NA Reduced tillage Low DC*1*1.08*0.92 69% Medium DC*1*1.08*1 NA High with manure DC*1*1.08*1.44 68% High without manure DC*1*1.08*1.11 65% No till Low DC*1*1.15*0.92 68% Medium DC*1*1.15*1 NA High with manure DC*1*1.15*1.44 67% High without manure DC*1*1.15*1.11 64% Tropical Dry Perennial/ Tree crop Full-tillage Low DC*1*1*0.95 NA Medium DC*1*1*1 NA High with manure DC*1*1*1.37 NA High without manure DC*1*1*1.04 NA Reduced tillage Low DC*1*1.09*0.95 72% Medium DC*1*1.09*1 NA High with manure DC*1*1.09*1.37 71% High without manure DC*1*1.09*1.04 72% No till Low DC*1*1.17*0.95 71% Medium DC*1*1.17*1 NA High with manure DC*1*1.17*1.37 70% High without manure DC*1*1.171.04 71% Moist/wet Perennial/ Tree crop Full-tillage Low DC*1*1*0.92 NA Medium DC*1*1*1 NA High with manure DC*1*1*1.44 NA

Background Guide for the Calculation of Land Carbon Stocks in the Biofuels Sustainability Scheme Drawing on the 2006 IPCC Guidelines for National Greenhouse Gas Inventories
65
Climate Zone Land Use Management Input
Temperate Regime
Moisture Regime FLU FMG FI
Dc*FLU*FMG*FI Final Error
High without manure DC*1*1*1.11 NA Reduced tillage Low DC*1*1.15*0.92 72% Medium DC*1*1.15*1 NA High with manure DC*1*1.15*1.44 71% High without manure DC*1*1.15*1.11 68% No till Low DC*1*1.22*0.92 71% Medium DC*1*1.22*1 NA High with manure DC*1*1.22*1.44 70% High without manure DC*1*1.22*1.11 67% Tropical Montane n/a Perennial/ Tree crop Full-tillage Low DC*1*1*0.94 NA Medium DC*1*1*1 NA High with manure DC*1*1*1.41 NA High without manure DC*1*1*1.08 NA Reduced tillage Low DC*1*1.09*0.94 150% Medium DC*1*1.09*1 150% High with manure DC*1*1.09*1.41 150% High without manure DC*1*1.09*1.08 150% No till Low DC*1*1.16*0.94 150% Medium DC*1*1.16*1 NA High with manure DC*1*1.16*1.41 150ù High without manure DC*1*1.16*1.08 150% Temperate/Boreal Dry Set aside (<20 yrs) Full-tillage Low DC*0.93*1*0.95 NA Medium DC*0.93*1*1 NA High with manure DC*0.93*1*1.37 NA High without manure DC*0.93*1*1.04 NA Reduced tillage Low DC*0.93*1.02*0.95 30% Medium DC*0.93*1.02*1 NA

Background Guide for the Calculation of Land Carbon Stocks in the Biofuels Sustainability Scheme Drawing on the 2006 IPCC Guidelines for National Greenhouse Gas Inventories
66
Climate Zone Land Use Management Input
Temperate Regime
Moisture Regime FLU FMG FI
Dc*FLU*FMG*FI Final Error
High with manure DC*0.93*1.02*1.37 29% High without manure DC*0.93*1.02*1.04 30% No till Low DC*0.93*1.1*0.95 28% Medium DC*0.93*1.1*1 NA High with manure DC*0.93*1.1*1.37 28% High without manure DC*0.93*1.1*1.04 29% Moist/wet Set aside (<20 yrs) Full-tillage Low DC*0.82*1*0.92 NA Medium DC*0.82*1*1 NA High with manure DC*0.82*1*1.44 NA High without manure DC*0.82*1*1.11 NA Reduced tillage Low DC*0.82*1.08*0.92 36% Medium DC*0.82*1.08*1 NA High with manure DC*0.82*1.08*1.44 35% High without manure DC*0.82*1.08*1.11 32% No till Low DC*0.82*1.15*0.92 35% Medium DC*0.82*1.15*1 NA High with manure DC*0.82*1.15*1.44 34% High without manure DC*0.82*1.15*1.11 31% Tropical Dry Set aside (<20 yrs) Full-tillage Low DC*0.93*1*0.95 NA Medium DC*0.93*1*1 NA High with manure DC*0.93*1*1.37 NA High without manure DC*0.93*1*1.04 NA Reduced tillage Low DC*0.93*1.09*0.95 33% Medium DC*0.93*1.09*1 NA High with manure DC*0.93*1.09*1.37 32% High without manure DC*0.93*1.09*1.04 33% No till Low DC*0.93*1.17*0.95 32%

Background Guide for the Calculation of Land Carbon Stocks in the Biofuels Sustainability Scheme Drawing on the 2006 IPCC Guidelines for National Greenhouse Gas Inventories
67
Climate Zone Land Use Management Input
Temperate Regime
Moisture Regime FLU FMG FI
Dc*FLU*FMG*FI Final Error
Medium DC*0.93*1.17*1 NA High with manure DC*0.93*1.17*1.37 31% High without manure DC*0.93*1.17*1.04 32% Moist/wet Set aside (<20 yrs) Full-tillage Low DC*0.82*1*0.92 NA Medium DC*0.82*1*1 NA High with manure DC*0.82*1*1.44 NA High without manure DC*0.82*1*1.11 NA Reduced tillage Low DC*0.82*1.15*0.92 39% Medium DC*0.82*1.15*1 NA High with manure DC*0.82*1.15*1.44 38% High without manure DC*0.82*1.15*1.11 35% No till Low DC*0.82*1.22*0.92 38% Medium DC*0.82*1.22*1 NA High with manure DC*0.82*1.22*1.44 37% High without manure DC*0.82*1.22*1.11 34% Tropical Montane n/a Set aside (<20 yrs) Full-tillage Low DC*0.88*1*0.94 NA Medium DC*0.88*1*1 NA High with manure DC*0.88*1*1.41 NA High without manure DC*0.88*1*1.08 NA Reduced tillage Low DC*0.88*1.09*0.94 150% Medium DC*0.88*1.09*1 NA High with manure DC*0.88*1.09*1.41 150% High without manure DC*0.88*1.09*1.08 150% No till Low DC*0.88*1.16*0.94 150% Medium DC*0.88*1.16*1 NA High with manure DC*0.88*1.16*1.41 150% High without manure DC*0.88*1.16*1.08 150%

Background Guide for the Calculation of Land Carbon Stocks in the Biofuels Sustainability Scheme Drawing on the 2006 IPCC Guidelines for National Greenhouse Gas Inventories
68

Background Guide for the Calculation of Land Carbon Stocks in the Biofuels Sustainability Scheme Drawing on the 2006 IPCC Guidelines for National Greenhouse Gas Inventories
69
Table 10: Coefficients of Conversion from Degraded Grasslands
Table 10a- Coefficients of conversion from degraded grasslands (and savannahs) (DC: Default Carbon Value) Fraction Land use (FLU) = 1 Climate Zone Land Use Management Input
Temperate Regime
Moisture Regime FLU FMG FI
Dc*FLU*FMG*FI Final Error
Temperate/Boreal Dry Grassland Medium DC*1*0.95*1 NA
Moderately degraded High DC*1*0.95*1.11 NA
Medium DC*1*0.7*1 NA
Severely degraded High DC*1*0.7*1.11 NA
Moist/wet Grassland Medium DC*1*0.95*1 NA
Moderately degraded High DC*1*0.95*1.11 NA
Medium DC*1*0.7*1 NA
Severely degraded High DC*1*0.7*1.11 NA
Tropical Dry Grassland Medium DC*1*0.97*1 NA
Moderately degraded High DC*1*0.97*1.11 NA
Medium DC*1*0.7*1 NA
Severely degraded High DC*1*0.7*1.11 NA
Moist/wet Savannah Medium DC*1*0.97*1 NA
Moderately degraded High DC*1*0.97*1.11 NA
Medium DC*1*0.7*1 NA
Severely degraded High DC*1*0.7*1.11 NA
Tropical Montane n/a Grassland Medium DC*1*0.96*1 NA
Moderately degraded High DC*1*0.96*1.11 NA
Medium DC*1*0.7*1 NA
Severely degraded High DC*1*0.7*1.11 NA

Background Guide for the Calculation of Land Carbon Stocks in the Biofuels Sustainability Scheme Drawing on the 2006 IPCC Guidelines for National Greenhouse Gas Inventories
70
Table 10b - Coefficients of conversion to degraded croplands (DC: Default Carbon Value)
Climate Zone Land Use Management Input
Temperate Regime
Moisture Regime FLU FMG FI
Dc*FLU*FMG*FI Final Error
Temperate/Boreal Dry Full-tillage Low DC*0.8*0.7*0.95 NA
Long-term cultivated Medium DC*0.8*0.7*1 NA
High with manure DC*0.8*0.7*1.37 NA High without manure DC*0.8*0.7*1.04 NA Reduced tillage Low DC*0.8*1*0.95 28% Medium DC*0.8*1*1 NA High with manure DC*0.8*1*1.37 27% High without manure DC*0.8*1*1.04 28% No till Low DC*0.8*1.1*0.95 27% Medium DC*0.8*1.1*1 NA High with manure DC*0.8*1.1*1.37 26% High without manure DC*0.8*1.1*1.04 27% Moist/wet Full-tillage Low Dc*0.69*0.7*0.92 NA
Long-term cultivated Medium Dc*0.69*0.7*1 NA
High with manure Dc*0.69*0.7*1.44 NA High without manure Dc*0.69*0.7*1.11 NA Reduced tillage Low Dc*0.69*1.03*0.92 31% Medium Dc*0.69*1.03*1 NA High with manure Dc*0.69*1.03*1.44 30% High without manure Dc*0.69*1.03*1.11 27% No till Low Dc*0.69*1.15*0.92 30% Medium Dc*0.69*1.15*1 NA High with manure Dc*0.69*1.15*1.44 29% High without manure Dc*0.69*1.15*1.11 26%

Background Guide for the Calculation of Land Carbon Stocks in the Biofuels Sustainability Scheme Drawing on the 2006 IPCC Guidelines for National Greenhouse Gas Inventories
71
Climate Zone Land Use Management Input
Temperate Regime
Moisture Regime FLU FMG FI
Dc*FLU*FMG*FI Final Error
Tropical Dry Full-tillage Low DC*0.58*0.7*0.95 NA
Long-term cultivated Medium DC*0.58*0.7*1 NA
High with manure DC*0.58*0.7*1.37 NA High without manure DC*0.58*0.7*1.04 NA Reduced tillage Low DC*0.58*1.06*0.95 83% Medium DC*0.58*1.06*1 NA High with manure DC*0.58*1.06*1.37 82% High without manure DC*0.58*1.06*1.04 83% No till Low DC*0.58*1.17*0.95 82% Medium DC*0.58*1.17*1 NA High with manure DC*0.58*1.17*1.37 81% High without manure DC*0.58*1.17*1.04 82% Moist/wet Full-tillage Low DC*0.48*0.7*0.92 NA
Long-term cultivated Medium DC*0.48*0.7*1 NA
High with manure DC*0.48*0.7*1.44 NA High without manure DC*0.48*0.7*1.11 NA Reduced tillage Low DC*0.48*1.12*0.92 68% Medium DC*0.48*1.12*1 NA High with manure DC*0.48*1.12*1.44 67% High without manure DC*0.48*1.12*1.11 64% No till Low DC*0.48*1.22*0.92 68% Medium DC*0.48*1.22*1 NA High with manure DC*0.48*1.22*1.44 66% High without manure DC*0.48*1.22*1.11 63% Tropical Montane n/a Full-tillage Low DC*0.64*0.7*0.94 NA
Long-term cultivated Medium DC*0.64*0.7*1 NA
High with manure DC*0.64*0.7*1.41 NA

Background Guide for the Calculation of Land Carbon Stocks in the Biofuels Sustainability Scheme Drawing on the 2006 IPCC Guidelines for National Greenhouse Gas Inventories
72
Climate Zone Land Use Management Input
Temperate Regime
Moisture Regime FLU FMG FI
Dc*FLU*FMG*FI Final Error
High without manure DC*0.64*0.7*1.08 NA Reduced tillage Low DC*0.64*1.05*0.94 150% Medium DC*0.64*1.05*1 NA High with manure DC*0.64*1.05*1.41 150% High without manure DC*0.64*1.05*1.08 150% No till Low DC*0.64*1.16*0.94 150% Medium DC*0.64*1.16*1 NA High with manure DC*0.64*1.16*1.41 150% High without manure DC*0.64*1.16*1.08 150% Temperate/Boreal Dry Paddy rice Full-tillage Low DC*1.1*0.7*0.95 NA Medium DC*1.1*0.7*1 NA High with manure DC*1.1*0.7*1.37 NA High without manure DC*1.1*0.7*1.04 NA Reduced tillage Low DC*1.1*1*0.95 69% Medium DC*1.1*1*1 NA High with manure DC*1.1*1*1.37 68% High without manure DC*1.1*1*1.04 59% No till Low DC*1.1*1.1*0.95 68% Medium DC*1.1*1.1*1 NA High with manure DC*1.1*1.1*1.37 67% High without manure DC*1.1*1.1*1.04 68% Moist/wet Paddy rice Full-tillage Low DC*1.1*0.7*0.92 NA Medium DC*1.1*0.7*1 NA High with manure DC*1.1*0.7*1.44 NA High without manure DC*1.1*0.7*1.11 NA Reduced tillage Low DC*1.1*1.03*0.92 70% Medium DC*1.1*1.03*1 NA

Background Guide for the Calculation of Land Carbon Stocks in the Biofuels Sustainability Scheme Drawing on the 2006 IPCC Guidelines for National Greenhouse Gas Inventories
73
Climate Zone Land Use Management Input
Temperate Regime
Moisture Regime FLU FMG FI
Dc*FLU*FMG*FI Final Error
High with manure DC*1.1*1.03*1.44 69% High without manure DC*1.1*1.03*1.11 66% No till Low DC*1.1*1.15*0.92 69% Medium DC*1.1*1.15*1 NA High with manure DC*1.1*1.15*1.44 68% High without manure DC*1.1*1.15*1.11 65% Tropical Dry Paddy rice Full-tillage Low DC*1.1*0.7*0.95 NA Medium DC*1.1*0.7*1 NA High with manure DC*1.1*0.7*1.37 NA High without manure DC*1.1*0.7*1.04 NA Reduced tillage Low DC*1.1*1.06*0.95 72% Medium DC*1.1*1.06*1 NA High with manure DC*1.1*1.06*1.37 71% High without manure DC*1.1*1.06*1.04 72% No till Low DC*1.1*1.17*0.95 71% Medium DC*1.1*1.17*1 NA High with manure DC*1.1*1.17*1.37 70% High without manure DC*1.1*1.17*1.04 71% Moist/wet Paddy rice Full-tillage Low DC*1.1*0.7*0.92 NA Medium DC*1.1*0.7*1 NA High with manure DC*1.1*0.7*1.44 NA High without manure DC*1.1*0.7*1.11 NA Reduced tillage Low DC*1.1*1.12*0.92 72% Medium DC*1.1*1.12*1 NA High with manure DC*1.1*1.12*1.44 71% High without manure DC*1.1*1.12*1.11 68% No till Low DC*1.1*1.22*0.92 71%

Background Guide for the Calculation of Land Carbon Stocks in the Biofuels Sustainability Scheme Drawing on the 2006 IPCC Guidelines for National Greenhouse Gas Inventories
74
Climate Zone Land Use Management Input
Temperate Regime
Moisture Regime FLU FMG FI
Dc*FLU*FMG*FI Final Error
Medium DC*1.1*1.22*1 NA High with manure DC*1.1*1.22*1.44 70% High without manure DC*1.1*1.22*1.11 67% Tropical Montane n/a Paddy rice Full-tillage Low DC*1.1*0.7*0.94 NA Medium DC*1.1*0.7*1 NA High with manure DC*1.1*0.7*1.41 NA High without manure DC*1.1*0.7*1.08 NA Reduced tillage Low DC*1.1*1.05*0.94 150% Medium DC*1.1*1.05*1 NA High with manure DC*1.1*1.05*1.41 150% High without manure DC*1.1*1.05*1.08 150% No till Low DC*1.1*1.16*0.94 150% Medium DC*1.1*1.16*1 150% High with manure DC*1.1*1.16*1.41 150% High without manure DC*1.1*1.16*1.08 150% Temperate/Boreal Dry Perennial/ Full-tillage Low DC*1*0.7*0.95 NA Tree crop Medium DC*1*0.7*1 NA High with manure DC*1*0.7*1.37 NA High without manure DC*1*0.7*1.04 NA Reduced tillage Low DC*1*1*0.95 69% Medium DC*1*1.*1 NA High with manure DC*1*1*1.37 68% High without manure DC*1*1*1.04 69% No till Low DC*1*1.1*0.95 68% Medium DC*1*1.1*1 NA High with manure DC*1*1.1*1.37 67% High without manure DC*1*1.1*1.04 68%

Background Guide for the Calculation of Land Carbon Stocks in the Biofuels Sustainability Scheme Drawing on the 2006 IPCC Guidelines for National Greenhouse Gas Inventories
75
Climate Zone Land Use Management Input
Temperate Regime
Moisture Regime FLU FMG FI
Dc*FLU*FMG*FI Final Error
Moist/wet Perennial/ Full-tillage Low DC*1*0.7*0.92 NA Tree crop Medium DC*1*0.7*1 NA High with manure DC*1*0.7*1.44 NA High without manure DC*1*0.7*1.11 NA Reduced tillage Low DC*1*1.03*0.92 69% Medium DC*1*1.03*1 NA High with manure DC*1*1.03*1.44 68% High without manure DC*1*1.03*1.11 65% No till Low DC*1*1.15*0.92 68% Medium DC*1*1.15*1 NA High with manure DC*1*1.15*1.44 67% High without manure DC*1*1.15*1.11 64% Tropical Dry Perennial/ Full-tillage Low DC*1*0.7*0.95 NA Tree crop Medium DC*1*0.7*1 NA High with manure DC*1*0.7*1.37 NA High without manure DC*1*0.7*1.04 NA Reduced tillage Low DC*1*1.06*0.95 72% Medium DC*1*1.06*1 NA High with manure DC*1*1.06*1.37 71% High without manure DC*1*1.06*1.04 72% No till Low DC*1*1.17*0.95 71% Medium DC*1*1.17*1 NA High with manure DC*1*1.17*1.37 70% High without manure DC*1*1.171.04 71% Moist/wet Perennial/ Full-tillage Low DC*1*0.7*0.92 NA Tree crop Medium DC*1*0.7*1 NA High with manure DC*1*0.7*1.44 NA

Background Guide for the Calculation of Land Carbon Stocks in the Biofuels Sustainability Scheme Drawing on the 2006 IPCC Guidelines for National Greenhouse Gas Inventories
76
Climate Zone Land Use Management Input
Temperate Regime
Moisture Regime FLU FMG FI
Dc*FLU*FMG*FI Final Error
High without manure DC*1*0.7*1.11 NA Reduced tillage Low DC*1*1.12*0.92 72% Medium DC*1*1.12*1 NA High with manure DC*1*1.12*1.44 71% High without manure DC*1*1.12*1.11 68% No till Low DC*1*1.22*0.92 71% Medium DC*1*1.22*1 NA High with manure DC*1*1.22*1.44 70% High without manure DC*1*1.22*1.11 67% Tropical Montane n/a Perennial/ Full-tillage Low DC*1*1*0.94 NA Tree crop Medium DC*1*0.7*1 NA High with manure DC*1*0.7*1.41 NA High without manure DC*1*0.7*1.08 NA Reduced tillage Low DC*1*1.05*0.94 150% Medium DC*1*1.05*1 150% High with manure DC*1*1.05*1.41 150% High without manure DC*1*1.05*1.08 150% No till Low DC*1*1.16*0.94 150% Medium DC*1*1.16*1 NA High with manure DC*1*1.16*1.41 150% High without manure DC*1*1.16*1.08 150% Temperate/Boreal Dry Set aside (<20 yrs) Full-tillage Low DC*0.93*0.7*0.95 NA Medium DC*0.93*0.7*1 NA High with manure DC*0.93*0.7*1.37 NA High without manure DC*0.93*0.7*1.04 NA Reduced tillage Low DC*0.93*12*0.95 30% Medium DC*0.93*1*1 NA

Background Guide for the Calculation of Land Carbon Stocks in the Biofuels Sustainability Scheme Drawing on the 2006 IPCC Guidelines for National Greenhouse Gas Inventories
77
Climate Zone Land Use Management Input
Temperate Regime
Moisture Regime FLU FMG FI
Dc*FLU*FMG*FI Final Error
High with manure DC*0.93*1*1.37 29% High without manure DC*0.93*1*1.04 30% No till Low DC*0.93*1.1*0.95 28% Medium DC*0.93*1.1*1 NA High with manure DC*0.93*1.1*1.37 28% High without manure DC*0.93*1.1*1.04 29% Moist/wet Set aside (<20 yrs) Full-tillage Low DC*0.82*0.7*0.92 NA Medium DC*0.82*0.7*1 NA High with manure DC*0.82*0.7*1.44 NA High without manure DC*0.82*0.7*1.11 NA Reduced tillage Low DC*0.82*1.03*0.92 36% Medium DC*0.82*1.03*1 NA High with manure DC*0.82*1.03*1.44 35% High without manure DC*0.82*1.03*1.11 32% No till Low DC*0.82*1.15*0.92 35% Medium DC*0.82*1.15*1 NA High with manure DC*0.82*1.15*1.44 34% High without manure DC*0.82*1.15*1.11 31% Tropical Dry Set aside (<20 yrs) Full-tillage Low DC*0.93*0.7*0.95 NA Medium DC*0.93*0.7*1 NA High with manure DC*0.93*0.7*1.37 NA High without manure DC*0.93*0.7*1.04 NA Reduced tillage Low DC*0.93*1.06*0.95 33% Medium DC*0.93*1.06*1 NA High with manure DC*0.93*1.06*1.37 32% High without manure DC*0.93*1.06*1.04 33% No till Low DC*0.93*1.17*0.95 32%

Background Guide for the Calculation of Land Carbon Stocks in the Biofuels Sustainability Scheme Drawing on the 2006 IPCC Guidelines for National Greenhouse Gas Inventories
78
Climate Zone Land Use Management Input
Temperate Regime
Moisture Regime FLU FMG FI
Dc*FLU*FMG*FI Final Error
Medium DC*0.93*1.17*1 NA High with manure DC*0.93*1.17*1.37 31% High without manure DC*0.93*1.17*1.04 32% Moist/wet Set aside (<20 yrs) Full-tillage Low DC*0.82*0.7*0.92 NA Medium DC*0.82*0.7*1 NA High with manure DC*0.82*0.7*1.44 NA High without manure DC*0.82*0.7*1.11 NA Reduced tillage Low DC*0.82*1.12*0.92 39% Medium DC*0.82*1.12*1 NA High with manure DC*0.82*1.12*1.44 38% High without manure DC*0.82*1.12*1.11 35% No till Low DC*0.82*1.22*0.92 38% Medium DC*0.82*1.22*1 NA High with manure DC*0.82*1.22*1.44 37% High without manure DC*0.82*1.22*1.11 34% Tropical Montane n/a Set aside (<20 yrs) Full-tillage Low DC*0.88*0.7*0.94 NA Medium DC*0.88*0.7*1 NA High with manure DC*0.88*0.7*1.41 NA High without manure DC*0.88*0.7*1.08 NA Reduced tillage Low DC*0.88*1.05*0.94 150% Medium DC*0.88*1.05*1 NA High with manure DC*0.88*1.05*1.41 150% High without manure DC*0.88*1.05*1.08 150% No till Low DC*0.88*1.16*0.94 150% Medium DC*0.88*1.16*1 NA High with manure DC*0.88*1.16*1.41 150% High without manure DC*0.88*1.16*1.08 150%

Background Guide for the Calculation of Land Carbon Stocks in the Biofuels Sustainability Scheme Drawing on the 2006 IPCC Guidelines for National Greenhouse Gas Inventories
79

Background Guide for the Calculation of Land Carbon Stocks in the Biofuels Sustainability Scheme Drawing on the 2006 IPCC Guidelines for National Greenhouse Gas Inventories
80
Table 11: Coefficients of Conversion from Forest and Wooded Savannah
Climate Zone Land Use Management Input
Temperate Regime
Moisture Regime FLU FMG FI
Dc*FLU*FMG*FI Final Error
Temperate/Boreal Dry Perennial/ Full-tillage Low DC*1*1*0.95 NA Tree crop Medium DC*1*1*1 NA High with manure DC*1*1*1.37 NA High without manure DC*1*1*1.04 NA Reduced tillage Low DC*1*1.02*0.95 69% Medium DC*1*1.02*1 NA High with manure DC*1*1.02*1.37 68% High without manure DC*1*1.02*1.04 69% No till Low DC*1*1.1*0.95 68% Medium DC*1*1.1*1 NA High with manure DC*1*1.1*1.37 67% High without manure DC*1*1.1*1.04 68% Moist/wet Perennial/ Full-tillage Low DC*1*1*0.92 NA Tree crop Medium DC*1*1*1 NA High with manure DC*1*1*1.44 NA High without manure DC*1*1*1.11 NA Reduced tillage Low DC*1*1.08*0.92 69% Medium DC*1*1.08*1 NA High with manure DC*1*1.08*1.44 68% High without manure DC*1*1.08*1.11 65% No till Low DC*1*1.15*0.92 68% Medium DC*1*1.15*1 NA High with manure DC*1*1.15*1.44 67% High without manure DC*1*1.15*1.11 64% Tropical Dry Perennial/ Full-tillage Low DC*1*1*0.95 NA

Background Guide for the Calculation of Land Carbon Stocks in the Biofuels Sustainability Scheme Drawing on the 2006 IPCC Guidelines for National Greenhouse Gas Inventories
81
Climate Zone Land Use Management Input
Temperate Regime
Moisture Regime FLU FMG FI
Dc*FLU*FMG*FI Final Error
Tree crop Medium DC*1*1*1 NA High with manure DC*1*1*1.37 NA High without manure DC*1*1*1.04 NA Reduced tillage Low DC*1*1.09*0.95 72% Medium DC*1*1.09*1 NA High with manure DC*1*1.09*1.37 71% High without manure DC*1*1.09*1.04 72% No till Low DC*1*1.17*0.95 71% Medium DC*1*1.17*1 NA High with manure DC*1*1.17*1.37 70% High without manure DC*1*1.171.04 71% Moist/wet Perennial/ Full-tillage Low DC*1*1*0.92 NA Tree crop Medium DC*1*1*1 NA High with manure DC*1*1*1.44 NA High without manure DC*1*1*1.11 NA Reduced tillage Low DC*1*1.15*0.92 72% Medium DC*1*1.15*1 NA High with manure DC*1*1.15*1.44 71% High without manure DC*1*1.15*1.11 68% No till Low DC*1*1.22*0.92 71% Medium DC*1*1.22*1 NA High with manure DC*1*1.22*1.44 70% High without manure DC*1*1.22*1.11 67% Tropical Montane n/a Perennial/ Full-tillage Low DC*1*1*0.94 NA Tree crop Medium DC*1*1*1 NA High with manure DC*1*1*1.41 NA High without manure DC*1*1*1.08 NA

Background Guide for the Calculation of Land Carbon Stocks in the Biofuels Sustainability Scheme Drawing on the 2006 IPCC Guidelines for National Greenhouse Gas Inventories
82
Climate Zone Land Use Management Input
Temperate Regime
Moisture Regime FLU FMG FI
Dc*FLU*FMG*FI Final Error
Reduced tillage Low DC*1*1.09*0.94 150% Medium DC*1*1.09*1 NA High with manure DC*1*1.09*1.41 150% High without manure DC*1*1.09*1.08 150% No till Low DC*1*1.16*0.94 150% Medium DC*1*1.16*1 NA High with manure DC*1*1.16*1.41 150% High without manure DC*1*1.16*1.08 150% All All Native Forest n/a n/a DC*1*..*..*.. NA
Or wooded savannah
(non degraded) All All Managed forest All All DC*1*1*1*1 NA
Tropical Moist/dry
Shifting cultivation-shortened fallow: clear native forest for 3 years and natural regrowth n/a n/a DC*0.64*1*..*.. NA
Moist/dry
Shifting cultivation- mature fallow: clear native forest for 3 years and natural regrowth n/a n/a DC*0.8*1*..*.. NA
Temperate/Boreal Moist/dry
Shifting cultivation-shortened fallow: clear native forest for 3 years and natural regrowth n/a n/a DC*1*1*..*.. NA

Background Guide for the Calculation of Land Carbon Stocks in the Biofuels Sustainability Scheme Drawing on the 2006 IPCC Guidelines for National Greenhouse Gas Inventories
83
Climate Zone Land Use Management Input
Temperate Regime
Moisture Regime FLU FMG FI
Dc*FLU*FMG*FI Final Error
Moist/dry
Shifting cultivation- mature fallow: clear native forest for 3 years and natural regrowth n/a n/a DC*1*1*..*.. NA

Background Guide for the Calculation of Land Carbon Stocks in the Biofuels Sustainability Scheme Drawing on the 2006 IPCC Guidelines for National Greenhouse Gas Inventories
84
Table 12: Coefficients of Conversion from Degraded Forest and Wooded Savannah
Climate Zone Land Use Management Input
Temperate Regime
Moisture Regime FLU FMG FI
Dc*FLU*FMG*FI Final Error
Temperate/Boreal Dry Perennial/ Full-tillage Low DC*1*0.7*0.95 NA Tree crop Medium DC*1*0.7*1 NA High with manure DC*1*0.7*1.37 NA High without manure DC*1*0.7*1.04 NA Reduced tillage Low DC*1*1*0.95 69% Medium DC*1*1.*1 NA High with manure DC*1*1*1.37 68% High without manure DC*1*1*1.04 69% No till Low DC*1*1.1*0.95 68% Medium DC*1*1.1*1 NA High with manure DC*1*1.1*1.37 67% High without manure DC*1*1.1*1.04 68% Moist/wet Perennial/ Full-tillage Low DC*1*0.7*0.92 NA Tree crop Medium DC*1*0.7*1 NA High with manure DC*1*0.7*1.44 NA High without manure DC*1*0.7*1.11 NA Reduced tillage Low DC*1*1.03*0.92 69% Medium DC*1*1.03*1 NA High with manure DC*1*1.03*1.44 68% High without manure DC*1*1.03*1.11 65% No till Low DC*1*1.15*0.92 68% Medium DC*1*1.15*1 NA High with manure DC*1*1.15*1.44 67% High without manure DC*1*1.15*1.11 64% Tropical Dry Perennial/ Full-tillage Low DC*1*0.7*0.95 NA

Background Guide for the Calculation of Land Carbon Stocks in the Biofuels Sustainability Scheme Drawing on the 2006 IPCC Guidelines for National Greenhouse Gas Inventories
85
Climate Zone Land Use Management Input
Temperate Regime
Moisture Regime FLU FMG FI
Dc*FLU*FMG*FI Final Error
Tree crop Medium DC*1*0.7*1 NA High with manure DC*1*0.7*1.37 NA High without manure DC*1*0.7*1.04 NA Reduced tillage Low DC*1*1.06*0.95 72% Medium DC*1*1.06*1 NA High with manure DC*1*1.06*1.37 71% High without manure DC*1*1.06*1.04 72% No till Low DC*1*1.17*0.95 71% Medium DC*1*1.17*1 NA High with manure DC*1*1.17*1.37 70% High without manure DC*1*1.17*1.04 71% Moist/wet Perennial/ Full-tillage Low DC*1*0.7*0.92 NA Tree crop Medium DC*1*0.7*1 NA High with manure DC*1*0.7*1.44 NA High without manure DC*1*0.7*1.11 NA Reduced tillage Low DC*1*1.12*0.92 72% Medium DC*1*1.12*1 NA High with manure DC*1*1.12*1.44 71% High without manure DC*1*1.12*1.11 68% No till Low DC*1*1.22*0.92 71% Medium DC*1*1.22*1 NA High with manure DC*1*1.22*1.44 70% High without manure DC*1*1.22*1.11 67% Tropical Montane n/a Perennial/ Full-tillage Low DC*1*1*0.94 NA Tree crop Medium DC*1*0.7*1 NA High with manure DC*1*0.7*1.41 NA High without manure DC*1*0.7*1.08 NA

Background Guide for the Calculation of Land Carbon Stocks in the Biofuels Sustainability Scheme Drawing on the 2006 IPCC Guidelines for National Greenhouse Gas Inventories
86
Climate Zone Land Use Management Input
Temperate Regime
Moisture Regime FLU FMG FI
Dc*FLU*FMG*FI Final Error
Reduced tillage Low DC*1*1.05*0.94 150% Medium DC*1*1.05*1 NA High with manure DC*1*1.05*1.41 150% High without manure DC*1*1.05*1.08 150% No till Low DC*1*1.16*0.94 150% Medium DC*1*1.16*1 NA High with manure DC*1*1.16*1.41 150% High without manure DC*1*1.16*1.08 150% All All Native Forest n/a n/a DC*1*..*..*.. NA
or wooded savannah
(non degraded) All All Managed Forest All All DC*1*1*1*1 NA
Tropical Moist/dry
Shifting cultivation-shortened fallow: clear native forest for 3 years and natural regrowth n/a n/a DC*0.64*1*..*.. NA
Shifting cultivation- mature fallow: clear native forest for 3-5 years and natural regrowth n/a n/a DC*0.8*1*..*.. NA
Temperate/Boreal Moist/dry
Shifting cultivation-shortened fallow: clear native forest for 3-5 years and natural regrowth n/a n/a DC*1*1*..*.. NA

Background Guide for the Calculation of Land Carbon Stocks in the Biofuels Sustainability Scheme Drawing on the 2006 IPCC Guidelines for National Greenhouse Gas Inventories
87
Climate Zone Land Use Management Input
Temperate Regime
Moisture Regime FLU FMG FI
Dc*FLU*FMG*FI Final Error
Shifting cultivation- mature fallow: clear native forest for 3-5 years and natural regrowth n/a n/a DC*1*1*..*.. NA

Background Guide for the Calculation of Land Carbon Stocks in the Biofuels Sustainability Scheme Drawing on the 2006 IPCC Guidelines for National Greenhouse Gas Inventories
88
Table 13: Data for Conversion from Grassland
Climate Region Total C stock in non-woody biomass
(above- and below-ground) (IPCC default)
Uncertainty (IPCC default)
t C ha-1 %
Boreal – Dry & Wet 4.3 ± 75%
Cool Temperate – Dry 3.3 ± 75%
Cool Temperate –Wet 6.8 ± 75%
Warm Temperate – Dry 3.1 ± 75%
Warm Temperate –Wet 6.8 ± 75%
Tropical – Dry 4.4 ± 75%
Tropical - Moist & Wet 8.1 ± 75%

Background Guide for the Calculation of Land Carbon Stocks in the Biofuels Sustainability Scheme Drawing on the 2006 IPCC Guidelines for National Greenhouse Gas Inventories
89
Table 14: Data for Conversion from Forest (less than 30 % cover)
Formula: = 0.2*B*(1+R)*CF Domain Ecological zone Continent Total C
stock in biomass
(above- and below-
ground)
Range of total
carbon stock
Factor B:
Forest Average above-ground
biomass (IPCC
default)
Factor R:
Root-to-shoot ratio
(IPCC default)
t C ha-1 t C ha - 1 t dm ha-1 Tropical Tropical rain forest Africa 40 17 - 66 310 0.37 North and South America 39 15 - 52 300 0.37 Asia (continental) 36 15 - 88 280 0.37 Asia (insular) 45 36 - 67 350 0.37 Africa 30 19 - 50 260 0.24
Tropical moist deciduous forest North and South America 26 24 - 33 220 0.24
Asia (continental) 21 1 - 65 180 0.24 Asia (insular) 34 290 0.24 Tropical dry forest Africa 14 14 - 16 120 0.28 North and South America 25 24 - 49 210 0.28 Asia (continental) 16 12 - 19 130 0.28 Asia (insular) 19 160 0.28 Tropical mountain systems Africa 13 5 - 22 115 0.24 North and South America 17 7 - 27 145 0.24 Asia (continental) 16 6 - 26 135 0.24 Asia (insular) 26 6 - 43 220 0.28 Subtropical Subtropical humid forest North and South America 26 25 - 34 220 0.28 Asia (continental) 22 1 - 67 180 0.28

Background Guide for the Calculation of Land Carbon Stocks in the Biofuels Sustainability Scheme Drawing on the 2006 IPCC Guidelines for National Greenhouse Gas Inventories
90
Domain Ecological zone Continent Total C stock in biomass
(above- and below-
ground)
Range of total
carbon stock
Factor B:
Forest Average above-ground
biomass (IPCC
default)
Factor R:
Root-to-shoot ratio
(IPCC default)
t C ha-1 t C ha - 1 t dm ha-1 Asia (insular) 35 290 0.28 Subtropical dry forest Africa 17 140 0.28 North and South America 26 25 - 51 210 0.32 Asia (continental) 16 12 - 20 130 0.32 Asia (insular) 20 160 0.32 Subtropical steppe Africa 9 2 - 25 70 0.32 North and South America 10 5 - 11 80 0.32 Asia (continental) 7 60 0.32 Asia (insular) 9 70 0.32 Temperate Temperate oceanic forest Europe 14 120 0.27 North America 79 10 - 143 660 0.27 New Zealand 43 25 - 51 360 0.27 South America 21 11 - 37 180 0.27
Temperate continental forest Asia, Europe (≤20 y) 2 20 0.27
Asia, Europe (>20 y) 14 2 - 38 120 0.27 North and South America (≤20 y) 7 1 - 16 60 0.27 North and South America (>20 y) 16 6 - 24 130 0.27 Asia, Europe (≤20 y) 12 2 - 21 100 0.27
Temperate mountain systems Asia, Europe (>20 y) 16 2 - 72 130 0.27
North and South America (≤20 y) 6 2 - 13 50 0.27

Background Guide for the Calculation of Land Carbon Stocks in the Biofuels Sustainability Scheme Drawing on the 2006 IPCC Guidelines for National Greenhouse Gas Inventories
91
Domain Ecological zone Continent Total C stock in biomass
(above- and below-
ground)
Range of total
carbon stock
Factor B:
Forest Average above-ground
biomass (IPCC
default)
Factor R:
Root-to-shoot ratio
(IPCC default)
t C ha-1 t C ha - 1 t dm ha-1 North and South America (>20 y) 6 5 - 33 50 0.27 Boreal Boreal coniferous forest Asia, Europe, North America 12 1 - 10 100 0.24 Boreal tundra woodland Asia, Europe, North America (≤20 y) 0 4 0.24 Asia, Europe, North America (>20 y) 2 15 0.24 Boreal mountain systems Asia, Europe, North America (≤20 y) 2 1 - 2 15 0.24 Asia, Europe, North America (>20 y) 6 5 - 6 50 0.24

Background Guide for the Calculation of Land Carbon Stocks in the Biofuels Sustainability Scheme Drawing on the 2006 IPCC Guidelines for National Greenhouse Gas Inventories
92
Table 15: Data for Conversion from Forest (more than 30 % cover)
Domain Ecological Zone Continent Total C stock in biomass
(above- and below-ground)
and dead organic matter
(IPCC default)
Range of total carbon stock
t C ha-1 t C ha-1 Tropical Tropical rain forest Africa 204 94 - 355 North and South America 198 87 - 279 Asia (continental) 185 87 - 471 Asia (insular) 230 197 - 361 Tropical moist deciduous
forest Africa 156 104 - 272
North and South America 133 135 - 179 Asia (continental) 110 11 - 352 Asia (insular) 174 186 - 186 Tropical dry forest Africa 77 82 - 88 North and South America 131 133 - 268 Asia (continental) 83 69 - 108 Asia (insular) 101 108 - 109 Tropical mountain systems Africa 77 31 - 127 North and South America 94 43 - 153 Asia (continental) 88 37 - 145 Asia (insular) 130 37 - 234 Subtropical Subtropical humid forest North and South America 132 134 - 178 Asia (continental) 109 10 - 351 Asia (insular) 173 184 - 184 Subtropical dry forest Africa 88 94 - 94

Background Guide for the Calculation of Land Carbon Stocks in the Biofuels Sustainability Scheme Drawing on the 2006 IPCC Guidelines for National Greenhouse Gas Inventories
93
Domain Ecological Zone Continent Total C stock in biomass
(above- and below-ground)
and dead organic matter
(IPCC default)
Range of total carbon stock
t C ha-1 t C ha-1 North and South America 130 132 - 267 Asia (continental) 82 68 - 107 Asia (insular) 100 107 - 108 Subtropical steppe Africa 46 17 - 132 North and South America 53 31 - 64 Asia (continental) 41 44 - 44 Asia (insular) 47 50 - 50 Temperate Temperate oceanic forest Europe 84 90 - 90 North America 406 64 - 775 New Zealand 227 146 - 286 South America 120 70 - 210 Temperate continental forest Asia, Europe (≤20 y) 27 29 - 30 Asia, Europe (>20 y) 87 29 - 219 North and South America (≤20 y) 51 22 - 99 North and South America (>20 y) 93 48 - 143 Temperate mountain
systems Asia, Europe (≤20 y) 75 29 - 130
Asia, Europe (>20 y) 93 29 - 397 North and South America (≤20 y) 45 29 - 86 North and South America (>20 y) 93 41 - 194 Boreal Boreal coniferous forest Asia, Europe, North America 53 31 - 82 Boreal tundra woodland Asia, Europe, North America (≤20 y) 26 27 - 27

Background Guide for the Calculation of Land Carbon Stocks in the Biofuels Sustainability Scheme Drawing on the 2006 IPCC Guidelines for National Greenhouse Gas Inventories
94
Domain Ecological Zone Continent Total C stock in biomass
(above- and below-ground)
and dead organic matter
(IPCC default)
Range of total carbon stock
t C ha-1 t C ha-1 Asia, Europe, North America (>20 y) 35 34 - 37 Boreal mountain systems Asia, Europe, North America (≤20 y) 32 32 - 34 Asia, Europe, North America (>20 y) 53 50 - 56

Background Guide for the Calculation of Land Carbon Stocks in the Biofuels Sustainability Scheme Drawing on the 2006 IPCC Guidelines for National Greenhouse Gas Inventories
95
Table 16: Data for Conversion from Shrubland
Domain Continent Total C stock in biomass
Uncertainty
t C ha-1 % Tropical Africa 46 ± 60 % North and South America 53 ± 60 % Asia (continental) 39 ± 60 % Asia (insular) 46 ± 60 % Australia 46 ± 60 % Subtropical Africa 43 ± 60 % North and South America 50 ± 60 % Asia (continental) 37 ± 60 % Europe 37 ± 60 % Asia (insular) 43 ± 60 % Temperate Global 7.4 ± 60 %

Background Guide for the Calculation of Land Carbon Stocks in the Biofuels Sustainability Scheme Drawing on the 2006 IPCC Guidelines for National Greenhouse Gas Inventories
96
Table 17: Data for Conversion from Cropland (perennial crops)
Climate Region Total C stock in biomass
above- and bellow-ground
(0.5 x IPCC default)22
Uncertainty (IPCC default)
t C ha-1 % Temperate (all moisture regimes) 43.2 ± 75% Tropical, dry 6.2 ± 75% Tropical, moist 14.4 ± 75% Tropical, wet 34.3 ± 75%
22 IPCC figures apply to mature woody crops, figures in table are 0.5 x IPCC default values..

Background Guide for the Calculation of Land Carbon Stocks in the Biofuels Sustainability Scheme Drawing on the 2006 IPCC Guidelines for National Greenhouse Gas Inventories
97
Table 18: Data for Conversion from/to Forest Plantations
Formula: = B*(1+R)*CF Domain Ecological Zone Continent Total C stock
in biomass (above- and
below-ground)
Factor B: Above-ground
biomass (IPCC
default)
Factor R: Root-to-
shoot ratio (IPCC
default)
t C ha-1 t dm ha-1 Tropical Tropical rain forest Africa broadleaf > 20 y 87 300 0.24 Africa broadleaf ≤ 20 y 29 100 0.24 Africa Pinus sp. > 20 y 58 200 0.24 Africa Pinus sp. ≤ 20 y 17 60 0.24 Americas Eucalyptus sp. 58 200 0.24 Americas Pinus sp. 87 300 0.24 Americas Tectona grandis 70 240 0.24 Americas other broadleaf 44 150 0.24 Asia broadleaf 64 220 0.24 Asia other 38 130 0.24 Tropical moist deciduous forest Africa broadleaf > 20 y 44 150 0.24 Africa broadleaf ≤ 20 y 23 80 0.24 Africa Pinus sp. > 20 y 35 120 0.24 Africa Pinus sp. ≤ 20 y 12 40 0.24 Americas Eucalyptus sp. 26 90 0.24 Americas Pinus sp. 79 270 0.24 Americas Tectona grandis 35 120 0.24 Americas other broadleaf 29 100 0.24 Asia broadleaf 52 180 0.24 Asia other 29 100 0.24 Tropical dry forest Africa broadleaf > 20 y 21 70 0.28 Africa broadleaf ≤ 20 y 9 30 0.28 Africa Pinus sp. > 20 y 18 60 0.28
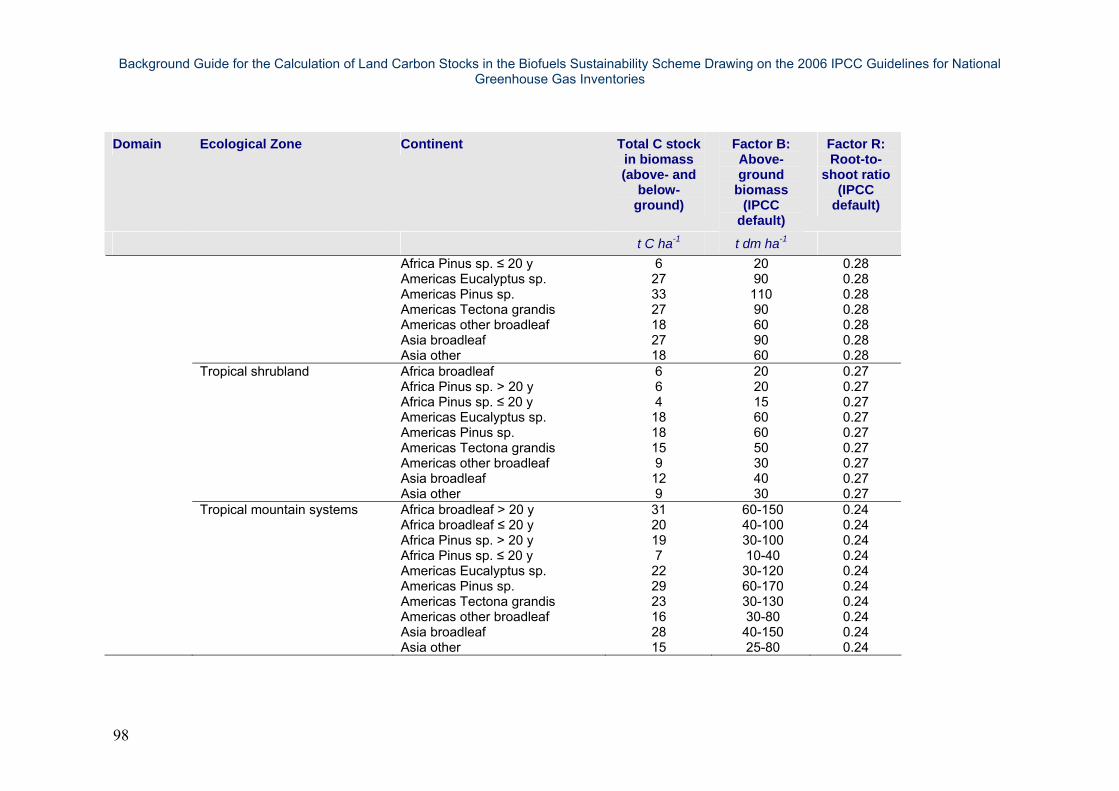
Background Guide for the Calculation of Land Carbon Stocks in the Biofuels Sustainability Scheme Drawing on the 2006 IPCC Guidelines for National Greenhouse Gas Inventories
98
Domain Ecological Zone Continent Total C stock in biomass (above- and
below-ground)
Factor B: Above-ground
biomass (IPCC
default)
Factor R: Root-to-
shoot ratio (IPCC
default)
t C ha-1 t dm ha-1 Africa Pinus sp. ≤ 20 y 6 20 0.28 Americas Eucalyptus sp. 27 90 0.28 Americas Pinus sp. 33 110 0.28 Americas Tectona grandis 27 90 0.28 Americas other broadleaf 18 60 0.28 Asia broadleaf 27 90 0.28 Asia other 18 60 0.28 Tropical shrubland Africa broadleaf 6 20 0.27 Africa Pinus sp. > 20 y 6 20 0.27 Africa Pinus sp. ≤ 20 y 4 15 0.27 Americas Eucalyptus sp. 18 60 0.27 Americas Pinus sp. 18 60 0.27 Americas Tectona grandis 15 50 0.27 Americas other broadleaf 9 30 0.27 Asia broadleaf 12 40 0.27 Asia other 9 30 0.27 Tropical mountain systems Africa broadleaf > 20 y 31 60-150 0.24 Africa broadleaf ≤ 20 y 20 40-100 0.24 Africa Pinus sp. > 20 y 19 30-100 0.24 Africa Pinus sp. ≤ 20 y 7 10-40 0.24 Americas Eucalyptus sp. 22 30-120 0.24 Americas Pinus sp. 29 60-170 0.24 Americas Tectona grandis 23 30-130 0.24 Americas other broadleaf 16 30-80 0.24 Asia broadleaf 28 40-150 0.24 Asia other 15 25-80 0.24

Background Guide for the Calculation of Land Carbon Stocks in the Biofuels Sustainability Scheme Drawing on the 2006 IPCC Guidelines for National Greenhouse Gas Inventories
99
Domain Ecological Zone Continent Total C stock in biomass (above- and
below-ground)
Factor B: Above-ground
biomass (IPCC
default)
Factor R: Root-to-
shoot ratio (IPCC
default)
t C ha-1 t dm ha-1 Subtropical Subtropical humid forest Americas Eucalyptus sp. 42 140 0.28 Americas Pinus sp. 81 270 0.28 Americas Tectona grandis 36 120 0.28 Americas other broadleaf 30 100 0.28 Asia broadleaf 54 180 0.28 Asia other 30 100 0.28 Subtropical dry forest Africa broadleaf > 20 y 21 70 0.28 Africa broadleaf ≤ 20 y 9 30 0.32 Africa Pinus sp. > 20 y 19 60 0.32 Africa Pinus sp. ≤ 20 y 6 20 0.32 Americas Eucalyptus sp. 34 110 0.32 Americas Pinus sp. 34 110 0.32 Americas Tectona grandis 28 90 0.32 Americas other broadleaf 19 60 0.32 Asia broadleaf 28 90 0.32 Asia other 19 60 0.32 Subtropical steppe Africa broadleaf 6 20 0.32 Africa Pinus sp. > 20 y 6 20 0.32 Africa Pinus sp. ≤ 20 y 5 15 0.32 Americas Eucalyptus sp. 19 60 0.32 Americas Pinus sp. 19 60 0.32 Americas Tectona grandis 16 50 0.32 Americas other broadleaf 9 30 0.32 Asia broadleaf > 20 y 25 80 0.32 Asia broadleaf ≤ 20 y 3 10 0.32 Asia coniferous > 20 y 6 20 0.32

Background Guide for the Calculation of Land Carbon Stocks in the Biofuels Sustainability Scheme Drawing on the 2006 IPCC Guidelines for National Greenhouse Gas Inventories
100
Domain Ecological Zone Continent Total C stock in biomass (above- and
below-ground)
Factor B: Above-ground
biomass (IPCC
default)
Factor R: Root-to-
shoot ratio (IPCC
default)
t C ha-1 t dm ha-1 Asia coniferous ≤ 20 y 34 100-120 0.32 Subtropical mountain systems Africa broadleaf > 20 y 31 60-150 0.24 Africa broadleaf ≤ 20 y 20 40-100 0.24 Africa Pinus sp. > 20 y 19 30-100 0.24 Africa Pinus sp. ≤ 20 y 7 10-40 0.24 Americas Eucalyptus sp. 22 30-120 0.24 Americas Pinus sp. 34 60-170 0.24 Americas Tectona grandis 23 30-130 0.24 Americas other broadleaf 16 30-80 0.24 Asia broadleaf 28 40-150 0.24 Asia other 15 25-80 0.24 Temperate Temperate oceanic forest Asia, Europe, broadleaf > 20 y 60 200 0.27 Asia, Europe, broadleaf ≤ 20 y 9 30 0.27 Asia, Europe, coniferous > 20 y 60 150-250 0.27 Asia, Europe, coniferous ≤ 20 y 12 40 0.27 North America 52 50-300 0.27 New Zealand 75 150-350 0.27 South America 31 90-120 0.27 Asia, Europe, broadleaf > 20 y 60 200 0.27
Temperate continental forest and mountain systems Asia, Europe, broadleaf ≤ 20 y 4 15 0.27
Asia, Europe, coniferous > 20 y 52 150-200 0.27 Asia, Europe, coniferous ≤ 20 y 7 25-30 0.27 North America 52 50-300 0.27 South America 31 90-120 0.27 Boreal Boreal coniferous forest and
mountain systems Asia, Europe > 20 y 12 40 0.24

Background Guide for the Calculation of Land Carbon Stocks in the Biofuels Sustainability Scheme Drawing on the 2006 IPCC Guidelines for National Greenhouse Gas Inventories
101
Domain Ecological Zone Continent Total C stock in biomass (above- and
below-ground)
Factor B: Above-ground
biomass (IPCC
default)
Factor R: Root-to-
shoot ratio (IPCC
default)
t C ha-1 t dm ha-1 Asia, Europe ≤ 20 y 1 5 0.24 North America 13 40-50 0.24 Boreal tundra woodland Asia, Europe > 20 y 7 25 0.24 Asia, Europe ≤ 20 y 1 5 0.24 North America 7 25 0.24

Background Guide for the Calculation of Land Carbon Stocks in the Biofuels Sustainability Scheme Drawing on the 2006 IPCC Guidelines for National Greenhouse Gas Inventories
102
Table 19: Data for Conversion from Degraded Grassland
Formula: = 0.4*B*CF Climate region Total C stock in
non-woody biomass
(above- and below-ground)
Factor B: Total C stock in non-woody biomass (above- and below-
ground) (IPCC default)
Uncertainty
t C ha-1 t C ha-1 %
Boreal – Dry & Wet 1.7 4.3 ± 100%
Cool Temperate – Dry 1.3 3.3 ± 100%
Cool Temperate –Wet 2.7 6.8 ± 100%
Warm Temperate – Dry 1.2 3.1 ± 100%
Warm Temperate –Wet 2.7 6.8 ± 100%
Tropical – Dry 1.7 4.4 ± 100%
Tropical - Moist & Wet 3.2 8.1 ± 100%

Background Guide for the Calculation of Land Carbon Stocks in the Biofuels Sustainability Scheme Drawing on the 2006 IPCC Guidelines for National Greenhouse Gas Inventories
103
Table 20: Data for Conversion from Degraded Forests
Formula: = 0.3*B*(1+R)*CF Domain Ecological zone Continent Total C
stock in biomass (above-
and below-
ground)
Factor B:
Biomass (above- ground) (IPCC
default)
Factor R: Root to shoot
ratio (IPCC
default)
Uncertainty
t C ha-1 t d.m. ha-1 % Tropical Tropical rain forest Africa 60 310 0.37 ± 100% North and South America 58 300 0.37 ± 100% Asia (continental) 54 280 0.37 ± 100% Asia (insular) 68 350 0.37 ± 100% Tropical moist deciduous forest Africa 45 260 0.24 ± 100% North and South America 38 220 0.24 ± 100% Asia (continental) 31 180 0.24 ± 100% Asia (insular) 51 290 0.24 ± 100% Tropical dry forest Africa 22 120 0.28 ± 100% North and South America 38 210 0.28 ± 100% Asia (continental) 23 130 0.28 ± 100% Asia (insular) 29 160 0.28 ± 100% Tropical shrubland Africa 21 70 0.27 ± 100% North and South America 27 80 0.27 ± 100% Asia (continental) 25 60 0.27 ± 100% Asia (insular) 38 70 0.27 ± 100% Subtropical Tropical mountain systems Africa 38 115 0.24 ± 100% North and South America 31 145 0.24 ± 100% Asia (continental) 51 135 0.24 ± 100% Asia (insular) 25 220 0.28 ± 100% Subtropical humid forest North and South America 38 220 0.28 ± 100%

Background Guide for the Calculation of Land Carbon Stocks in the Biofuels Sustainability Scheme Drawing on the 2006 IPCC Guidelines for National Greenhouse Gas Inventories
104
Domain Ecological zone Continent Total C stock in biomass (above-
and below-
ground)
Factor B:
Biomass (above- ground) (IPCC
default)
Factor R: Root to shoot
ratio (IPCC
default)
Uncertainty
t C ha-1 t d.m. ha-1 % Asia (continental) 23 180 0.28 ± 100% Asia (insular) 29 290 0.28 ± 100% Subtropical dry forest Africa 13 140 0.28 ± 100% North and South America 15 210 0.32 ± 100% Asia (continental) 11 130 0.32 ± 100% Asia (insular) 13 160 0.32 ± 100% Subtropical steppe Africa 9 70 0.32 ± 100% North and South America 28 80 0.32 ± 100% Asia (continental) 26 60 0.32 ± 100% Asia (insular) 39 70 0.32 ± 100% Temperate Temperate oceanic forest Europe 21 120 0.27 ± 100% North America 118 660 0.27 ± 100% New Zealand 64 360 0.27 ± 100% South America 32 180 0.27 ± 100% Temperate continental forest Asia, Europe (≤20 y) 4 20 0.27 ± 100% Asia, Europe (>20 y) 21 120 0.27 ± 100% North and South America (≤20 y) 11 60 0.27 ± 100% North and South America (>20 y) 23 130 0.27 ± 100% Temperate mountain systems Asia, Europe (≤20 y) 18 100 0.27 ± 100% Asia, Europe (>20 y) 23 130 0.27 ± 100% North and South America (≤20 y) 9 50 0.27 ± 100% North and South America (>20 y) 23 50 0.27 ± 100% Boreal Boreal coniferous forest Asia, Europe, North America 9 100 0.24 ± 100% Boreal tundra woodland Asia, Europe, North America (≤20 y) 1 4 0.24 ± 100% Asia, Europe, North America (>20 y) 3 15 0.24 ± 100%

Background Guide for the Calculation of Land Carbon Stocks in the Biofuels Sustainability Scheme Drawing on the 2006 IPCC Guidelines for National Greenhouse Gas Inventories
105
Domain Ecological zone Continent Total C stock in biomass (above-
and below-
ground)
Factor B:
Biomass (above- ground) (IPCC
default)
Factor R: Root to shoot
ratio (IPCC
default)
Uncertainty
t C ha-1 t d.m. ha-1 % Boreal mountain systems Asia, Europe, North America (≤20 y) 3 15 0.24 ± 100% Asia, Europe, North America (>20 y) 9 50 0.24 ± 100%

Background Guide for the Calculation of Land Carbon Stocks in the Biofuels Sustainability Scheme Drawing on the 2006 IPCC Guidelines for National Greenhouse Gas Inventories
106
Table 21: Data for Conversion to Cropland Biofuel Crops
Domain Climate Region Ecological Zone Continent Biofuel Crop Type
Total C stock in
total biomass
Uncertainties
t C ha-1 % Tropical Tropical dry Tropical dry forest Africa Jatropha 17.5 ± 75 % Africa Oil palm 60 ± 60 % Africa Sugar cane 4.2 ± 50 % Africa Jojoba 2.4 NA Asia (continental, insular) Oil palm 60 ± 60 % Asia (continental, insular) Coconuts 75 ± 60 % Asia (continental, insular) Sugar cane 4 ± 50 % Asia (continental, insular) Jojoba 2.4 NA Central and South America Coconuts 75 ± 60 % Central and South America Jojoba 2.4 NA Tropical shrubland Asia (continental, insular) Sugar cane 4 ± 50 % Asia (continental, insular) Coconuts 75 ± 60 % Asia (continental, insular) Jatropha 17.5 ± 75 % Australia Coconuts 75 ± 60 % Australia Oil palm 60 ± 60 % Australia Jojoba 2.4 NA Central and South America Jatropha 17.5 ± 75 % Central and South America Jojoba 2.4 NA Tropical moist Africa Coconuts 75 ± 60 %
Tropical moist decidous forest Africa Sugar cane 4.2 ± 50 %
Africa Jatropha 17.5 ± 75 % Africa Oil palm 60 ± 60 % Asia (continental, insular) Oil palm 60 ± 60 % Asia (continental, insular) Jatropha 17.5 ± 75 % Asia (continental, insular) Coconuts 75 ± 60 % Central and South America Coconuts 75 ± 60 %

Background Guide for the Calculation of Land Carbon Stocks in the Biofuels Sustainability Scheme Drawing on the 2006 IPCC Guidelines for National Greenhouse Gas Inventories
107
Domain Climate Region Ecological Zone Continent Biofuel Crop Type
Total C stock in
total biomass
Uncertainties
t C ha-1 % Central and South America Oil palm 60 ± 60 % Central and South America Sugar cane 5 ± 50 % Central and South America Jatropha 17.5 ± 75 % Tropical wet Tropical rain forest Africa Jatropha 17.5 ± 75 % Africa Coconuts 75 ± 60 % Asia (continental, insular) Sugar cane 4 ± 50 % Asia (continental, insular) Coconuts 75 ± 60 % Asia (continental, insular) Oil palm 60 ± 60 % Asia (continental, insular) Jatropha 17.5 ± 75 % Central and South America Coconuts 75 ± 60 % Central and South America Oil palm 60 ± 60 % Central and South America Sugar cane 5 ± 50 % Central and South America Jatropha 17.5 ± 75 % Subtropical Subtropical dry forest Africa Jatropha 17.5 ± 75 %
Warm temperate dry Australia Jatropha 17.5 ± 75 %
Central and South America Jatropha 17.5 ± 75 % Europe Miscanthus 10 ± 70 % North America Miscanthus 14.9 ± 70 % Subtropical steppe Australia Jatropha 17.5 ± 75 % Australia Jojoba 2.4 NA Central and South America Jatropha 17.5 ± 75 % Central and South America Jojoba 2.4 NA North America Sugar cane 4.8 ± 50 % North America Jojoba 2.4 NA North America Miscanthus 14.9 ± 70 % Subtropical humid forest Africa Jatropha 17.5 ± 75 %
Warm temperate moist Asia (continental, insular) Jatropha 17.5 ± 75 %
Asia (continental, insular) Coconuts 75 ± 60 %

Background Guide for the Calculation of Land Carbon Stocks in the Biofuels Sustainability Scheme Drawing on the 2006 IPCC Guidelines for National Greenhouse Gas Inventories
108
Domain Climate Region Ecological Zone Continent Biofuel Crop Type
Total C stock in
total biomass
Uncertainties
t C ha-1 % Australia Jatropha 17.5 ± 75 % Australia Coconuts 75 ± 60 % Central and South America Sugar cane 5 ± 50 % Central and South America Jatropha 17.5 ± 75 % North America Sugar cane 4.8 ± 50 % Temperate Cool temperate
dry Temperate steppe Asia (continental, insular) Jatropha 17.5 ± 75 %
Cool temperate moist
Temperate continental forest
Asia (continental, insular) Jatropha 17.5 ± 75 %
Temperate oceanic forest Asia (continental, insular) Jatropha 17.5 ± 75 % Australia Oil palm 60 ± 60 %

Background Guide for the Calculation of Land Carbon Stocks in the Biofuels Sustainability Scheme Drawing on the 2006 IPCC Guidelines for National Greenhouse Gas Inventories
109


European Commission
EUR 24573 EN – Joint Research Centre Institute for Environment and Sustainability
Title: Background Guide for the Calculation of Land Carbon Stocks in the Biofuels Sustainability Scheme Drawing on the 2006 IPCC Guidelines for National Greenhouse Gas Inventories
Authors: Florence Carré, Roland Hiederer, Viorel Blujdea, Renate Koeble
Luxembourg: Publications Office of the European Union 2010 – 109 pp. – 21.0 x 29.7 cm EUR – Scientific and Technical Research series – ISSN 1018-5593 ISBN 978-92-79-17455-1 Catalogue number LB-NA-24573-EN-C doi 10.2788/34463
Abstract This Guide covers the calculation of carbon-stock changes in soil and above- and below-ground vegetation due to land use conversion in support of Directive 2009/28/EC on the promotion of the use of energy from renewable sources, particularly for assessing carbon-stock changes due to land conversion for biofuel production. The methodology put forward is based on the Tier 1 approach as developed under the IPCC Guidelines 2006. It is based on specifying default values for carbon stocks and using coefficients of divergence from the default values according to land use/cover. The methodological approach of the IPCC was adapted for use with spatial layers instead of data tables. The spatial layers of the factors influencing carbon-stock changes were generated with global coverage and thematically aligned to comply with stipulations made in the Directive. According to the types of land use/cover conversion, a review is made of the methodology of the IPCC (2006). Particular problems regarding peatlands are presented. Drained peatlands cannot be assessed in terms of carbon-stock changes because drainage occurs on the overall peat soil profile (not only on the first 30 cm). This has direct consequences not only on CO
2 emissions
but also on CH4
and N2O. Tables of coefficients of conversions are then proposed according to climate zone and continental boundaries for
soil carbon-stock changes and for above- and below-ground carbon stock changes in biomass in a Technical Annex.

The mission of the Joint Research Centre (JRC) is to provide customer-driven scientific and technical sup-port for the conception, development, implementation and monitoring of European Union policies. As a service of the European Commission, the JRC functions as a reference centre of science and technology for the Union. Close to the policy-making process, it serves the common interest of the Member States, while being independent of special interests, whether private or national.
LBNA24573EN
C