background and method - ofgem · base: those who pay for their energy with a regular direct debit...
TRANSCRIPT

1
Accent is registered to the market, opinion and social research International Standard ISO 20252
Household Consumer Perceptions of the energy market
Wave 2: January – February 2019
22
Switching
Complaints
Tariffs and information provision
Satisfaction with supplier
Background and method
Sample profile
Contents
4
5
6
3
1
2
The price cap7
Smart Meters8

3
Background and method

44
Background
This report presents findings from a tracking survey commissioned jointly by Ofgem and Citizens Advice.
The Gas and Electricity Markets Authority (GEMA) is the regulator of Britain’s gas and electricity markets, and its principal objective is to protect the interests of both current and future consumers. Ofgem carries out the day to day functions of GEMA.
Citizens Advice helps millions of people every year to find a way forward, across all sectors, whatever their problems. This informs its role as the statutory energy consumer advocate, fighting for the best outcomes for current and future consumers.
The tracker is a representative survey of domestic energy bill-payers and provides Ofgem and Citizens Advice with ongoing measures of consumer engagement in and experiences of the energy market.

55
Methodology
Data was collected using a mixed-mode survey of 3,200 domestic energy bill-payers in Great Britain (GB). Fieldwork was carried out using:
An online survey via a commercial online panel (n = 2,900)
A face-to-face in-home survey with the digitally excluded population (n = 300). Participants were considered to be digitally excluded if they did not have access to the internet or had not used the internet in the previous six months.
All participants were responsible (solely or jointly) for the energy bills in their household or for choosing their energy supplier.
The survey used quotas to achieve a sample representative of the Great Britain (GB) bill-payer population. Quotas were set on age, gender, social grade and region. Data were weighted to the known profile of the GB population. Quotas (other than gender) were based on census Household Reference Person (HRP)*, as a proxy for bill-payer.
* https://www.nomisweb.co.uk/datasets/st067
66
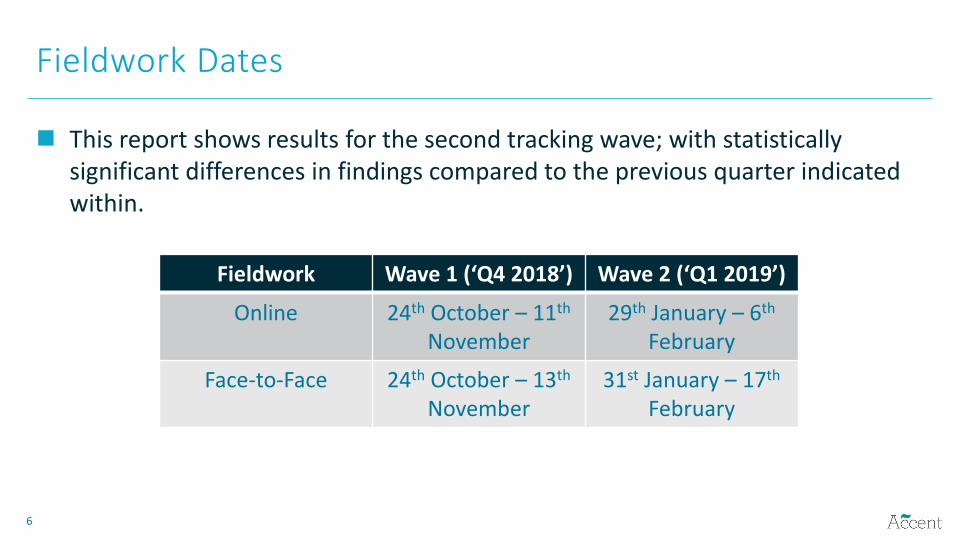
Fieldwork Dates
This report shows results for the second tracking wave; with statistically significant differences in findings compared to the previous quarter indicated within.
Fieldwork Wave 1 (‘Q4 2018’) Wave 2 (‘Q1 2019’)
Online 24th October – 11th
November29th January – 6th
February
Face-to-Face 24th October – 13th
November31st January – 17th
February

7
Sample profile

88
Sample profile
Base: All Participants (3,200)
SW: 9%
Wales: 5%
NW: 12%
NE: 4%
East: 9%
London: 13%
SE: 14%
Scotland: 9%
Y&H: 9%
EM: 7%WM: 9%
Gender
Social Grade
Age
Region
AB27%
C129%
C2
19%
DE25%

99
Electricity and gas suppliers – breakdown by supplier size
Please can you tell me which company you pay your electricity bill to? Base: All with mains electricity (3,186)
Please can you tell me which company you pay your gas bill to? Base: All with mains gas (2,840)
Electricity supplier Gas supplier
Small10%
Medium19%
Largest Six71%
Small10%
Medium20%
Largest Six70%
16
28
27
28
18
31
27
24
18
30
27
25
Aged 16 - 34
Aged 35 - 49
Aged 50 - 64
Aged 65 or older
Largest Six
Medium Tier
Small Tier

1010
Contextualising the survey results: Key events in the energy market from Q4 2018 – Q1 2019
Launch of the default tariff price cap: The final decision on the design and implementation of the default tariff cap took place in
November 2018. Ofgem engaged with stakeholders in December 2018. The cap came into effect in January 2019.
Energy price increase notifications: A number of suppliers issued price increase notices in the third quarter of 2018, but this
activity reduced in Q4 2018.
Suppliers exiting the market: Seven suppliers exited the market between October 2018 and January 2019, six of them
through a Supplier of Last Resort route. While customers have been migrated to a new supplier without loss of supply, it is possible that the experience has impacted their perceptions of the energy market.

11
Satisfaction with supplier

1212
Generally results are stable between the two tracking waves. The only statistically significant changes are summarised below:
Measure Q4 2018 Q1 2019 % Difference
Satisfaction with ease of understanding bills
72% 75% +3%
Satisfaction with ease of making contact with supplier (among those
trying to contact supplier)
76% 72% -4%
Recall of notification of a price increase (among those on an SVT*)
60% 49% -11%
Use of a price comparison website to switch supplier (among those who have
ever switched supplier)
62% 66% +4%
Awareness of the default tariff price cap
20% 25% +5%
Informed awareness of the price cap**
15% 19% +4%
** Informed awareness = Had heard of the price cap and correctly identified the principal behind it* SVT = Standard Variable Tariff

1313
Overall satisfaction with supplier
Variations in the % who are satisfied with their supplier:
Tariff
– On fixed (78% satisfied overall) vs SVT (73%)
Payment method
– Pay by direct debit (77%) vs PPM* (70%) and standard credit (65%)
Contact with supplier in last 3 months
– Have not contacted supplier (76%) vs contacted supplier (72%)
Switching history
– Switched tariff in last 12 months (80%) vs switched supplier in last 12 months (70%)
Age
– Aged 65+ (81%) vs aged 50-64 (72%), aged 35-49 (70%) and aged 16-34 (72%)
Overall, how satisfied or dissatisfied are you with (...) as your supplier of (gas/electricity/gas and electricity)?Base: All Participants (3,200)
74% are satisfied with their supplier
Very
dissatisfied3%
Dissatisfied5%
Neither
satisfied nor dissatisfied
18%
Satisfied40%
Very
satisfied34%
Unsure1%
* PPM = Pre-payment meter
1414
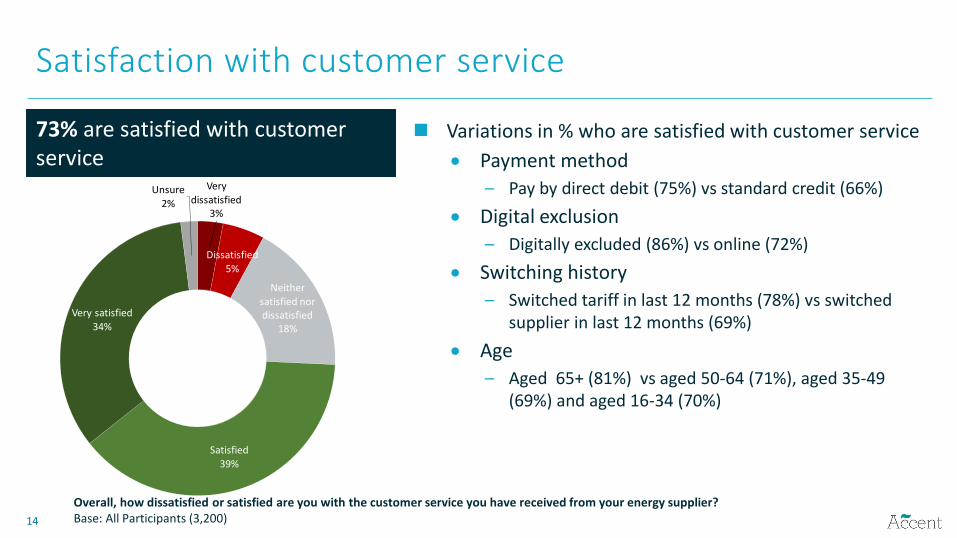
Satisfaction with customer service
Overall, how dissatisfied or satisfied are you with the customer service you have received from your energy supplier?Base: All Participants (3,200)
73% are satisfied with customer service
Variations in % who are satisfied with customer service
Payment method
– Pay by direct debit (75%) vs standard credit (66%)
Digital exclusion
– Digitally excluded (86%) vs online (72%)
Switching history
– Switched tariff in last 12 months (78%) vs switched supplier in last 12 months (69%)
Age
– Aged 65+ (81%) vs aged 50-64 (71%), aged 35-49 (69%) and aged 16-34 (70%)
Very
dissatisfied3%
Dissatisfied
5%
Neither satisfied nor dissatisfied
18%
Satisfied
39%
Very satisfied34%
Unsure2%

1515
3
2
6
5
15
16
44
42
31
33
1
2
Ease of understanding the bill
The accuracy of your bill
Very dissatisfied Dissatisfied Neither satisfied nor dissatisfied Satisfied Very satisfied Unsure
Satisfaction with bill
‘% satisfied’ with ease of understanding is lower among those: Dissatisfied overall with supplier (42%) vs satisfied (86%)
Using the Largest Six suppliers (74%) vs Medium Tier customers (81%)
On Standard Credit (67%) vs Direct debit (76%)
Unaware or don’t understand the price cap (74%) vs aware of and understand it (81%)
Aged 16-34 (70%) and aged 35-49 (71%) vs aged 50-64 (77%) and aged 65+ (80%)
C2DE (72%) vs ABC1 (77%)
Please can you tell me how dissatisfied or satisfied you are with the following aspects of your energy supplier`s bills? Base: Those who pay for their energy with a regular direct debit or standing order or with cash/cheque/credit card/BACS/App (2,659)
75% are satisfied with accuracy and ease of understanding bills
The proportion satisfied rose from 72% in Q4 2018 to 75% in Q1 2019.

1616
3
8
37
40
77
Other
Font too small
Difficult to find key information quickly
Language used is too complicated
Unclear how the bill is calculated
Reasons for dissatisfaction with ease of understanding the bill
Why are you very dissatisfied/dissatisfied with the ease of understanding your bill from your energy supplier? (%)Base: Those who are dissatisfied with the ease of understanding their bill from their energy supplier (231)
Clarity of calculation of bill continues to be the most common problem

1717
2
4
10
16
19
59
By writing a letter
Social media
Live chat on their website
A form on their website
By email
By phone
Yes - contacted30% Yes - tried to contact
but wasn't able to3%
30% tried to contact their supplier in last three months
Recent contact with supplier (last 3 months)
Those most likely to contact or attempt to contact are: Small Tier customers (43%) vs Largest Six suppliers (31%) Dissatisfied customers (57%) vs satisfied (31%) Ever switched (36%) vs never switched (24%)
Have you contacted, or tried to contact, your energy supplier within the last 3 months?Base: All Participants (3,200)
Preferred contact method
How did you (try to) make contact with your energy supplier on that last occasion? (%)Base: All who contacted or have tried to make contact (1,068)
1818
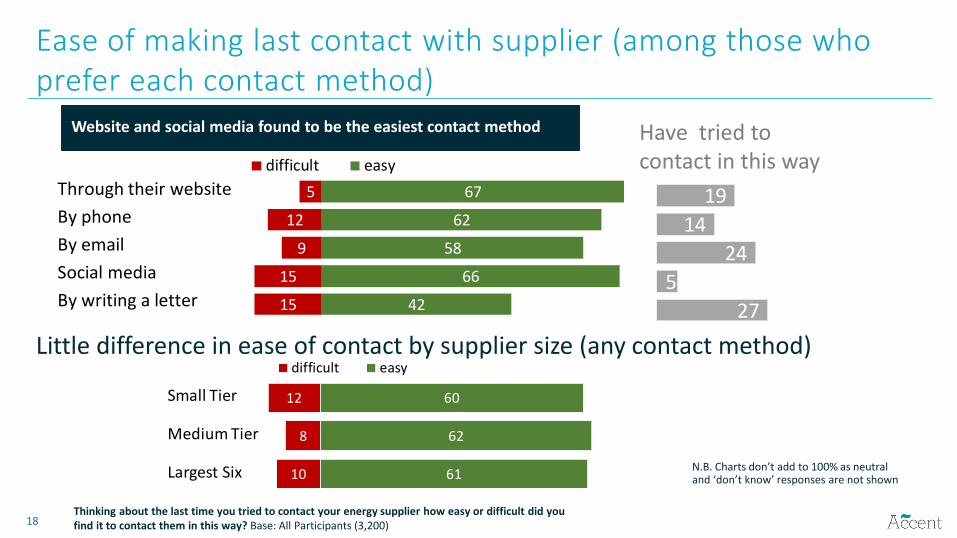
15
15
9
12
5
42
66
58
62
67
difficult easy
Through their website
By phone
By email
Social media
By writing a letter
Ease of making last contact with supplier (among those who prefer each contact method)
Website and social media found to be the easiest contact method
Little difference in ease of contact by supplier size (any contact method)
Have tried to contact in this way
Thinking about the last time you tried to contact your energy supplier how easy or difficult did you find it to contact them in this way? Base: All Participants (3,200)
N.B. Charts don’t add to 100% as neutral and ‘don’t know’ responses are not shown
27
5
24
14
19
10
8
12
61
62
60
difficult easy
Small Tier
Medium Tier
Largest Six

1919
10
5
26
58
Other reason
My email bounced back
I could not find the relevant contactdetails
They did not respond when I got in touch
Reasons for failed contact
Reasons for failed contact (%) Least successful contact channels (% trying to contact but failing)
Thinking of the last time you tried to make contact with your energy supplier, why were you not able to? (%)Base: Those who failed to contact their energy supplier (112)
Have you contacted, or tried to contact, your energy supplier within the last 3 months?Base: All who contacted or have tried to make contact (1,068)
9
10
13
18
26
Live chat on theirwebsite
By phone
Form on their website
Social media

2020
17
5
9
10
11
12
15
23
31
Other reason
About switching to a new supplier
To change the way I pay for my energy
To make a complaint or about a previous complaint
A question about my smart meter/a smart meter
To enquire about the products or services they offer
To find out about changing my tariff
A query over a bill I received
To give a meter reading
Reasons for last contacting supplier
How do reasons for contact vary?
(Among those who contacted their supplier):
41% without a smart meter contacted to give a meter reading
24% with a smart meter asked a question about it
33% who switched tariff in last 12 months contacted to find out about changing tariff
Thinking of the last time you (made/tried to make) contact with your energy supplier, what was it about? (%)Base: Those who contacted / tried to contact their energy supplier (1,068)
10%
8%
5%
4%
4%*
4%
3%
2%
6%
% of all participants
* Contact relating to smart meters will include all forms of contact (e.g. installations, ongoing use, changing smart meter etc)
% among those who contacted their supplier in past 3 months

2121
Satisfaction with contact
Groups more satisfied with ease of making contact are:
Satisfied overall with supplier (84%) vs dissatisfied overall (29%)
Pay by direct debit (74%) vs standard credit (63%) and PPM (65%)
Switchers (79%) vs non switchers (68%)
Have smart meter (75%) vs no smart meter (67%)
Aged 65+ (79%) vs aged 16-34 (67%) and aged 35-49 (69%)
Please can you tell me how dissatisfied or satisfied you were with the following…?Base: Those who contacted or tried to contact their energy supplier (1,068)
About three in four satisfied with ease of contacting supplier
Groups more satisfied with finding contact details are
Satisfied overall with supplier (86%) vs dissatisfied overall (35%)
Have a smart meter (78%) vs no smart meter (72%)
Aged 65+ (86%) vs aged 16-34 (73%), aged 35-49 (71%) and aged 50-64 (75%)
The proportion satisfied dropped from 76% in Q4 2018 to 72% in Q1 2019. The most significant declines were for: Aged 65+ (Q4 2018 87% vs Q1 2019 79%) Direct debit customers (Q4 2018 79% vs Q1 2019
74%)12
15
76
72
dissatisfied satisfied
Ease of making contact with them
Ease of finding the right contact details
N.B. Charts don’t add to 100% as neutral and ‘don’t know’ responses are not shown

22
Complaints

2323
Complaints to suppliers
Reason for complaints (%)
Base: Those who contacted their energy supplier to make a complaint (112)
10% of those contacting their supplier in the past 3 months did so to make or follow up a complaint
This equates to 4% of all consumers
The groups more likely to have complained:
• Dissatisfied overall with their supplier (29%) vs satisfied (7%) or neutral (12%)
• Have a smart meter (13%) vs no smart meter (9%)
Base: Those who contacted or tried to contact their energy supplier (1,068)
11
5
6
7
8
9
9
10
10
10
12
17
20
20
29
Other
A discount not applied
Missed appointment
Privacy issue
Managing my payments
A problem with a refund
Received marketing material I didn`t want
Installing or removing a meter
Attitude or behaviour of staff
Switching supplier
A problem with my direct debit
The accuracy of my meter
Some other problem with my meter
Pricing/cost of energy
A problem with my bill
2424
Reached the end of a
formal complaints process
31%
The process is still ongoing
40%
I've given up pursuing the complaint
25%
Unsure4%
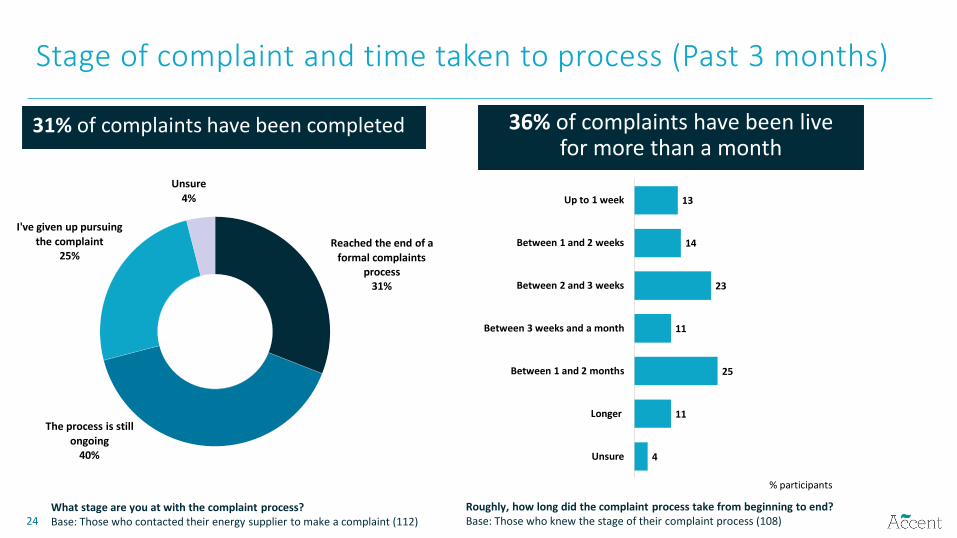
Stage of complaint and time taken to process (Past 3 months)
What stage are you at with the complaint process?Base: Those who contacted their energy supplier to make a complaint (112)
31% of complaints have been completed
Roughly, how long did the complaint process take from beginning to end?Base: Those who knew the stage of their complaint process (108)
36% of complaints have been live for more than a month
4
11
25
11
23
14
13
Unsure
Longer
Between 1 and 2 months
Between 3 weeks and a month
Between 2 and 3 weeks
Between 1 and 2 weeks
Up to 1 week
% participants

2525
51
9
27
71
dissatisfied satisfied
The outcome of the complaint
The overall handling of the complaint
Satisfaction with the complaint process
Satisfaction with complaints process
Please can you tell me how satisfied or dissatisfied you are with the following aspects of your complaint. Base: Those who contacted their energy supplier to make a complaint (112); Outcome reached (35)
N.B. Charts don’t add to 100% as neutral and ‘don’t know’ responses are not shown

26
Tariff understanding and information provision

2727
Tariff type
For each fuel, 86% know what tariff type they are on Those who are unsure are most likely to be:
What kind of gas / electricity tariff are you on?Base: Gas (2,731), Electricity (3,075)
Gas Electricity
A fixed rate tariff
59%
Standard variable
tariff26%
Other1%
Unsure14%
A fixed rate tariff
59%
Standard variable
tariff26%
Other
1%
Unsure14%
% who are unsure what their tariff is
Group Gas Electricity
Price capUnaware of price cap 16% 16%
Aware of price ca[ 6% 5%
Age Aged 16-34 9% 9%
Aged 35+ 45% 46%
Payment Method
Pay by direct Debit 10% 9%
Pay by PPM 30% 32%
Pay by standard credit 16% 16%
Supplier Contact Contacted in P3M 10% 11%
No contact in P3M 16% 15%
Switched suppliers Ever switched 11% 11%
Never switched 21% 21%
Online/Offline Online 12% 13%
Digitally Excluded 28% 29%
Unaware or don’t understand the price cap
Consumers using a PPM Not contacted in last 3 months
Never switched Aged 35+ Digitally excluded

2828
Cheapness of tariff
61% believe they are on their supplier’s cheapest tariff
The smaller the provider the more likely consumers are to feel they’re on the cheapest tariff: Small Tier (76%) Medium Tier (71%) Largest Six suppliers (56%)
Consumers more likely to believe they’re on the cheapest tariff: Dual fuel (62%) Fixed tariff (76%) ABC1 (65%) Online consumers (62%) Consumers who have switched (71%)
To what extent do you feel you are on the cheapest tariffs offered by your energy supplier?Base: All Participants (3,200)
I am definitely on the cheapest tariff
24%
I am probably on the cheapest tariff
37%
I am probably not on the cheapest tariff
19%
I am definitely not on the cheapest tariff
5%
Unsure15%

2929
6
5
5
4
3
5
12
39
37
39
39
36
41
43
53
54
52
53
59
52
42
What information you need to compare energy prices
What to do if you need assistance with paying yourenergy bills
What to do if you want to change your energy tariff
How to make a complaint
What to do in an emergency (e.g. a gas leak or faultymeter)
The choice of energy tariffs they offer
Notification of a price increase
Not well Fairly well Very well
Information received in last six months, including tariffs
Information received How well information met needs
Do you recall if your energy supplier has given you information about any of the following in the last six months? Base: All participants (3,200), apart from ‘Notification of price increase’: All on SVT (866)
How well did the information you received meet your needs? Bases: those receiving information (individual bases are in brackets)
(420)
(1,087)
(1,271)
(1,438)
(1,426)
(1,478)
(1,492)
Proportion saying recall receivingThe proportion who recall receiving notification of a price increase dropped from 60% in Q4 2018 to 49% in Q1 2019

30
Switching

3131
1
3
4
4
5
8
14
17
44
45
68
Other
Housing Association
Local authority
Unsure
I would not be interested in comparing products or services
Citizens Advice
By phoning different energy companies yourself
Seek advice from a friend or relative
Financial advice website/service
By looking at different energy company websites yourself
A price comparison website
Where would you go to find information that would allow you to compare the products and services offered by different companies? (%) Base: All Participants (3,200)
Information that would be used to compare suppliers
Over two thirds (68%) would use a price comparison website (PCW) to compare suppliers
Consumers more likely to use a PCW are:
Customers of Medium (78%) and Small Tier suppliers (76%)
On a fixed tariff (74%)
Ever switched supplier (78%)
Aware of and understand the price cap (76%)
Pay by direct debit (72%)
ABC1 social grade (73%)
Aged 35-64 (74%) vs aged 16-34 (63%) and aged 65+ (58%)
No disability (71%) vs have a disability (60%)
On average, two sources are cited
Sources used to compare suppliers (%)
3232
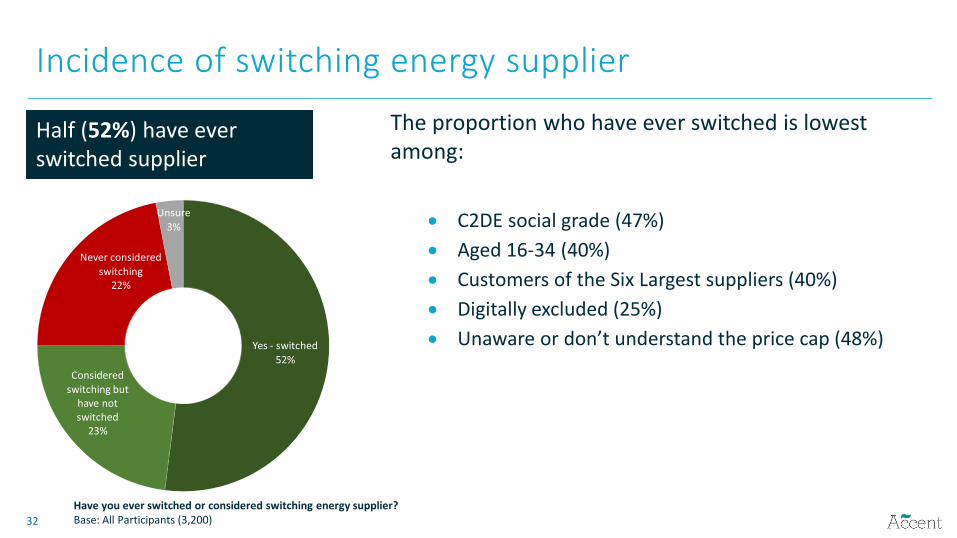
Incidence of switching energy supplier
The proportion who have ever switched is lowest among:
C2DE social grade (47%)
Aged 16-34 (40%)
Customers of the Six Largest suppliers (40%)
Digitally excluded (25%)
Unaware or don’t understand the price cap (48%)
Have you ever switched or considered switching energy supplier?Base: All Participants (3,200)
Half (52%) have ever switched supplier
Yes - switched52%
Considered switching but
have not switched
23%
Never considered
switching22%
Unsure
3%
3333
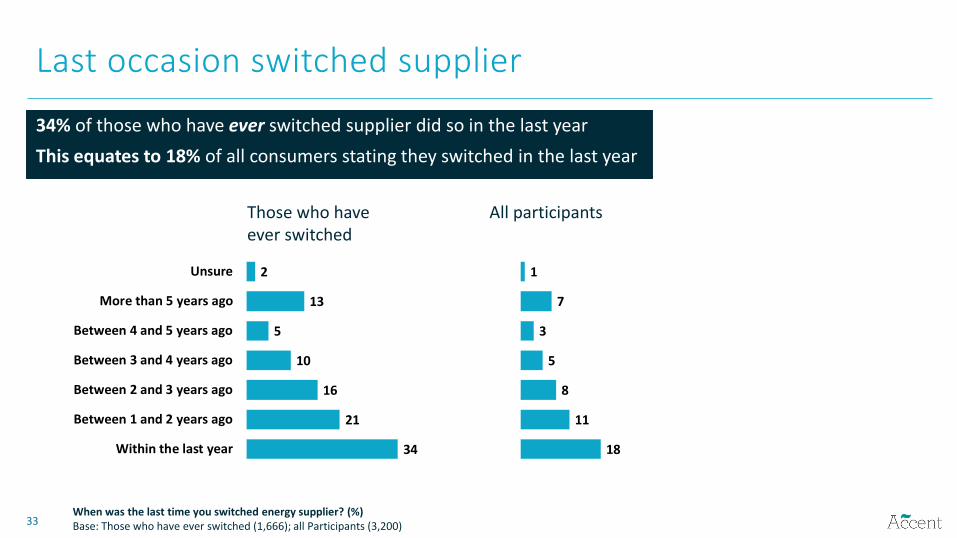
18
11
8
5
3
7
1
Within the last year
Between 1 and 2 years ago
Between 2 and 3 years ago
Between 3 and 4 years ago
Between 4 and 5 years ago
More than 5 years ago
Unsure
34
21
16
10
5
13
2
Within the last year
Between 1 and 2 years ago
Between 2 and 3 years ago
Between 3 and 4 years ago
Between 4 and 5 years ago
More than 5 years ago
Unsure
Last occasion switched supplier
When was the last time you switched energy supplier? (%)Base: Those who have ever switched (1,666); all Participants (3,200)
34% of those who have ever switched supplier did so in the last year
This equates to 18% of all consumers stating they switched in the last year
Those who have ever switched
All participants

3434
Reasons for choosing supplier
Once you had made the decision to switch to another energy supplier,what were the main reasons you chose the company you went with?Base: Those who have ever switched (1,666)
The key reasons for selecting a supplier are cost related
1
2
3
7
8
9
13
15
16
16
33
50
52
Unsure
No particular reason
Offered additional services beyond energy
To get a smart meter
Other
They offered green energy
Given an incentive for switching to them
They are a well known brand
They have a good reputation
They have good customer service
To get a fixed term /fixed price deal
They had a good/the best tariff
They had a better tariff than my old supplier
Even when prompting with non-cost reasons, service, reputation, incentives and green tariffs are secondary considerations
Were there any other reasons for selecting them apart from the tariff?Base: Those who have ever switched (1,666). Dark blue shows those who only selected financial reasons when first asked (721)
1
2
3
7
8
9
13
15
16
16
33
50
52
4
1
1
2
1
4
3
3
3
6
Unsure
No particular reason
Offered additional services beyond energy
To get a smart meter
Other
They offered green energy
Given an incentive for switching to them
They are a well known brand
They have a good reputation
They have good customer service
To get a fixed term /fixed price deal
They had a good/the best tariff
They had a better tariff than my old supplier
Primary reasons Additional (non financial) reasons

3535
Yes66%
No30%
Unsure4%
Use of Price Comparison Websites
66% who switched used a Price Comparison Website. Up from 62% in Q4 2018
The biggest increases in use of PCWs* are among: Small tier customers (+7 pps*)
Customers aged 50+ (+6 pps)
Social grade D/E (+8 pps)
Without smart meter (+6 pps)
Customers without a disability (+5pps)
Use of PCWs is lower among: Largest Six suppliers (62%)
Those with smart meter (60%)
Social grade C2DE (56%)
Aged 65+ (55%)
Have a disability (55%)
Electricity and gas from different suppliers (50%)
Using a PPM (41%)
The digitally excluded (8%)
Did you use a price comparison website to help you switch energy supplier?Base: Those who have ever switched supplier (1,666) * PCW = Price Comparison Website, pps = percentage points

3636
8
1
1
1
2
2
2
2
3
21
27
34
34
38
Unsure
My Utility Genius
Quotezone
The Energy Shop
Energy Helpline
Simply Switch
Switch Gas and Electric
Other
Which?Switch
Go Compare
Money Supermarket
Compare the Market
Money Saving Expert
USwitch
Which price comparison websites did you use? (%)Base: All who used price comparison website (1,102)
Price Comparison Websites (PCWs) used
1.7 sites are used on average
Did you use the price comparison website only to compare suppliers or did you also use it to make the switch?Base: Those who used a price comparison website to help them switch energy supplier (1,102)
63% of those using PCWs used them to make the switch
Unsure 6%
To compare suppliers only 31%
To make comparisons
and make the switch63%
3737
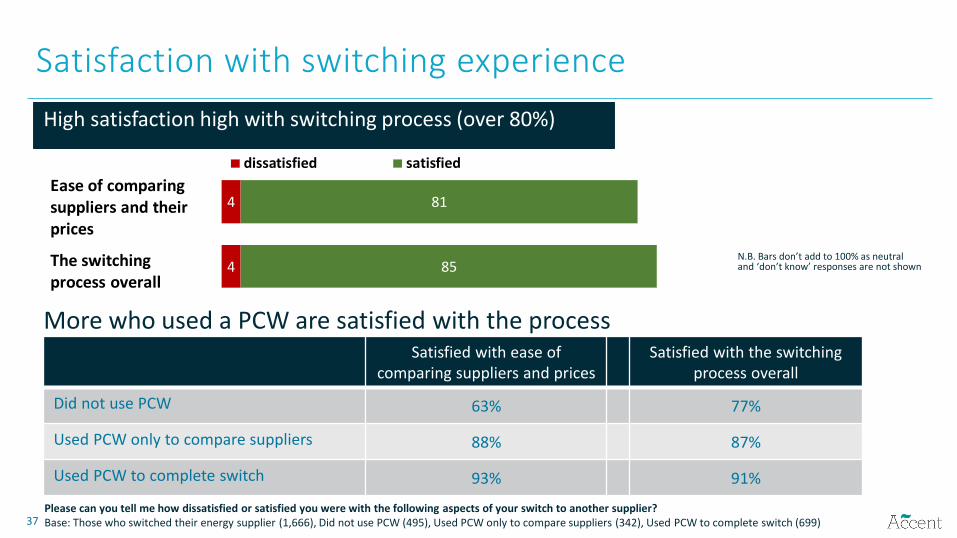
Satisfaction with switching experience
High satisfaction high with switching process (over 80%)
More who used a PCW are satisfied with the process
Please can you tell me how dissatisfied or satisfied you were with the following aspects of your switch to another supplier?Base: Those who switched their energy supplier (1,666), Did not use PCW (495), Used PCW only to compare suppliers (342), Used PCW to complete switch (699)
Satisfied with ease of comparing suppliers and prices
Satisfied with the switching process overall
Did not use PCW 63% 77%
Used PCW only to compare suppliers 88% 87%
Used PCW to complete switch 93% 91%
N.B. Bars don’t add to 100% as neutral and ‘don’t know’ responses are not shown4
4
85
81
dissatisfied satisfied
Ease of comparing suppliers and their prices
The switching process overall

3838
Yes21%
No61%
Unsure18%
Consumers currently considering switching
The proportion considering switching is highest among:
Dissatisfied customers (65%)
Aged 16-34 (30%) or 35-49 (25%)
Small Tier customers (27%)
ABC1 social grade (23%)
Those with a disability (24%)
Online (22%) vs digitally excluded (6%)
Aware of and understand the price cap (24%)
Little difference by whether switched before (22% switched v 19% never switched)
Are you currently considering changing your energy supplier?Base: All Participants (3,200)
21% are thinking of switching supplier

39
The energy price cap
4040
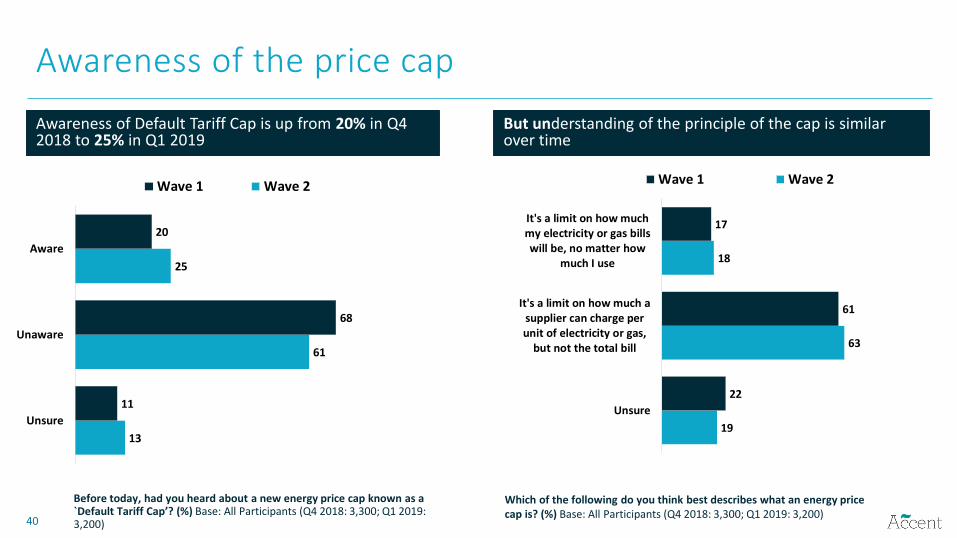
Awareness of the price cap
Awareness of Default Tariff Cap is up from 20% in Q4 2018 to 25% in Q1 2019
But understanding of the principle of the cap is similar over time
Before today, had you heard about a new energy price cap known as a `Default Tariff Cap’? (%) Base: All Participants (Q4 2018: 3,300; Q1 2019: 3,200)
Which of the following do you think best describes what an energy price cap is? (%) Base: All Participants (Q4 2018: 3,300; Q1 2019: 3,200)
13
61
25
11
68
20
Unsure
Unaware
Aware
Wave 1 Wave 2
19
63
18
22
61
17
Unsure
It's a limit on how much asupplier can charge perunit of electricity or gas,
but not the total bill
It's a limit on how muchmy electricity or gas billswill be, no matter how
much I use
Wave 1 Wave 2

4141
Informed awareness of the cap has risen
15% had heard of the cap in Q4 2018 and understood it. This rose to 19% in Q1 2019
Before today, had you heard about a new energy price cap known as a `Default Tariff Cap’? / Which of the following do you think best describes what an energy price cap is? (%) Base: All Participants (Q4 2018: 3,300; Q1 2019: 3,200)
Greater increases in informed awareness among:
Age 50+ (+6 pps)
Fixed tariffs (+7 pps)
Customers who have contacted supplier about switching (+14 pps)
Higher awareness among following customers:
With Small Tier suppliers (26%)
Ever switched supplier (25%)
On a fixed tariff (24%)
Contacted supplier in last 3 months (23%)
Aged 65+ (23%)
ABC1 (23%)
Paying by direct debit (21%)
Consumers living in England (20%)
Online consumers (20%)75
6
19
80
5
15
Unaware
Aware and don'tunderstand
Aware and understand
Wave 1 Wave 2

4242
Perceived relevance of cap
27% feel the cap could apply to them (48% for those on a mixed tariff)
No changes from previous wave
Knowing this, do you think that the default tariff price cap will apply to your energy bills? (%)Base: All Participants (3,200), Mixed Tariff (40), Fixed (1767), SVT (718)
Deemed most applicable by:
Younger consumers: Aged 16-34 (38%) and 35-49 (32%)
Never switched supplier (34%)
Aware of and understand the price cap (35%)
27
38
24
48
29
20
38
27
43
42
39
25
SVT
Fixed
Mixed tariff
Tota
lTa
riff
typ
e
Yes No Unsure

43
Smart meters
4444
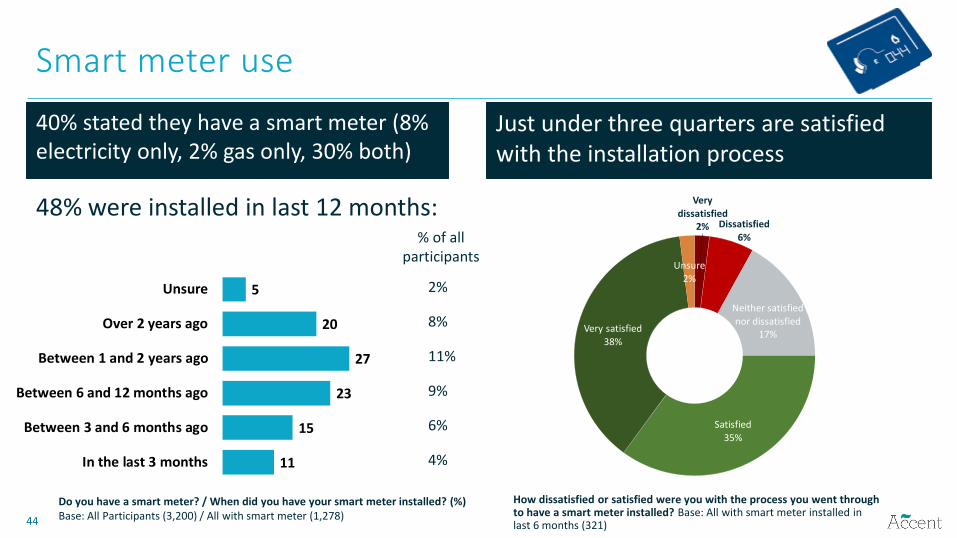
11
15
23
27
20
5
In the last 3 months
Between 3 and 6 months ago
Between 6 and 12 months ago
Between 1 and 2 years ago
Over 2 years ago
Unsure
Smart meter use
40% stated they have a smart meter (8% electricity only, 2% gas only, 30% both)
Just under three quarters are satisfied with the installation process
Do you have a smart meter? / When did you have your smart meter installed? (%)Base: All Participants (3,200) / All with smart meter (1,278)
48% were installed in last 12 months:
How dissatisfied or satisfied were you with the process you went through to have a smart meter installed? Base: All with smart meter installed in last 6 months (321)
2%
8%
11%
9%
6%
4%
% of all participants
Very dissatisfied
2% Dissatisfied6%
Neither satisfied nor dissatisfied
17%
Satisfied35%
Very satisfied38%
Unsure
2%

4545
Satisfaction with smart meter
65% are satisfied with their smart meter
Overall, how satisfied or dissatisfied are you with your smart meter? Base: All with a smart meter (1,277)
Higher satisfaction among:
The digitally excluded (81%)
Satisfied with supplier overall (76%)
Those with pre-payment meters (68% satisfied including 39% very satisfied)
Customers of the Largest Six suppliers (67%)
Very dissatisfied
4% Dissatisfied5%
Neither satisfied
nor dissatisfied23%
Satisfied35%
Very satisfied
30%
Unsure2%

46
Annexes

4747
Abbreviations/terms used in this report
Suppliers:
Largest Six suppliers = British Gas, EDF, E.On, nPower, SSE and Scottish Power
Medium Tier suppliers = Bulb, Co-operative Energy, First Utility, Green Star, Octopus Energy, Ovo, Utilita, Utility Warehouse
Small Tier suppliers = all other suppliers
Tariffs / Payment:
Fixed = Consumer is on a fixed tariff for their electricity and gas
SVT = Consumer is on a Standard Variable Tariff for their electricity and gas
Mixed tariff = on different types of tariff for gas and electricity
Dual Fuel = Consumer uses the same supplier for electricity and gas
PPM = Pre-payment Meter
Demographics:
SEG = Socio-Economic grade
ABC1 = Consumers falling into the top three socio-economic bands
C2DE = Consumers falling into the bottom three socio-economic bands
Online = Survey sample sourced from an online consumer panel
Digitally excluded = Sample sourced from face-to-face in-home interviews. All selected on the basis they have no or limited access to the internet
Other:
PCW = Price Comparison Website
PPS = Percentage points
4848
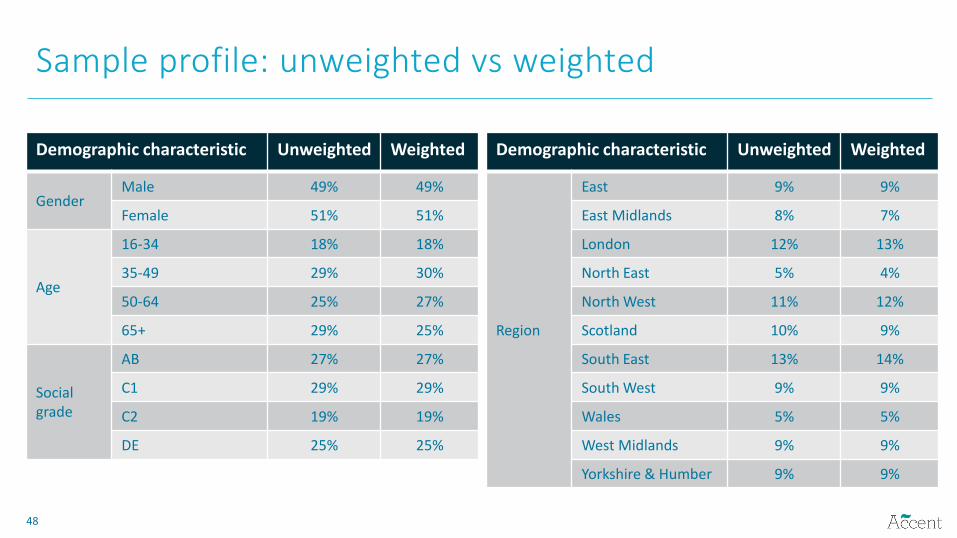
Sample profile: unweighted vs weighted
Demographic characteristic Unweighted Weighted
GenderMale 49% 49%
Female 51% 51%
Age
16-34 18% 18%
35-49 29% 30%
50-64 25% 27%
65+ 29% 25%
Social grade
AB 27% 27%
C1 29% 29%
C2 19% 19%
DE 25% 25%
Demographic characteristic Unweighted Weighted
Region
East 9% 9%
East Midlands 8% 7%
London 12% 13%
North East 5% 4%
North West 11% 12%
Scotland 10% 9%
South East 13% 14%
South West 9% 9%
Wales 5% 5%
West Midlands 9% 9%
Yorkshire & Humber 9% 9%
