back to the future – assessing two decades of energy projections and scenarios using times for...
TRANSCRIPT
Back to the Future Assessing two decades of energy
projections and scenarios using
TIMES for Portugal
ETSAP Workshop Nov 2014
Sofia Simoes, João Pedro Gouveia.
Patrícia Fortes, Luís Dias, Júlia Seixas
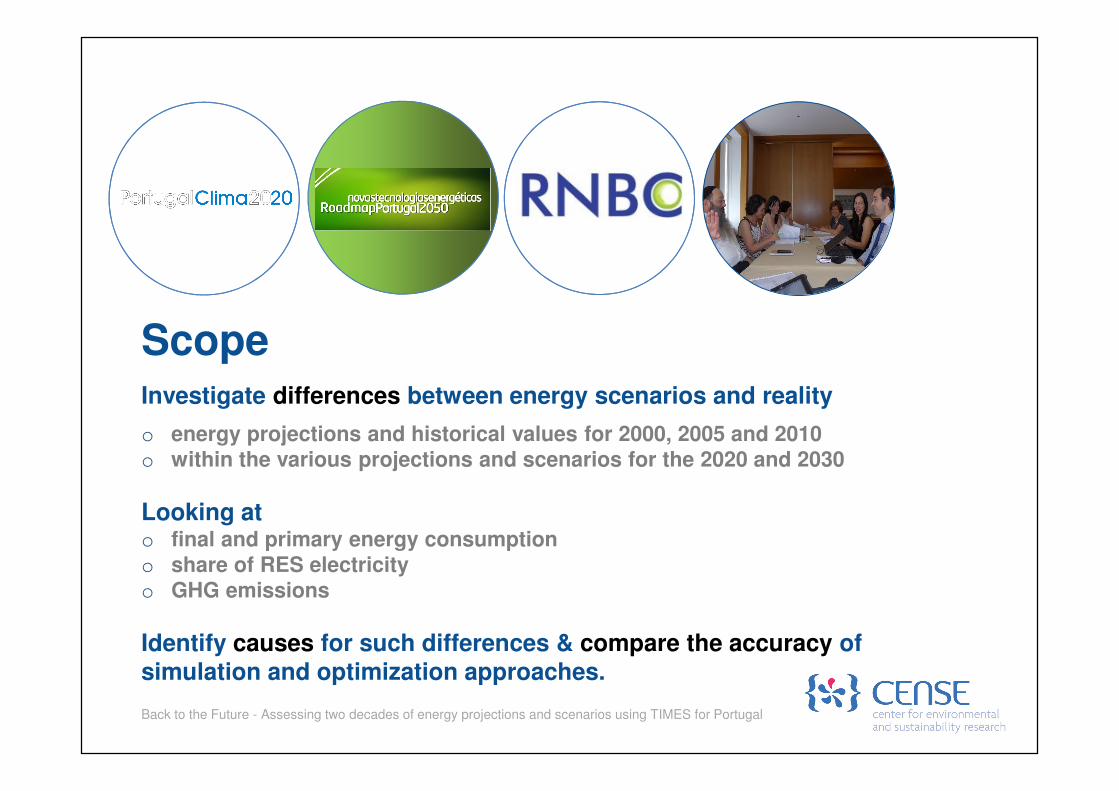
ScopeInvestigate differences between energy scenarios and reality
o energy projections and historical values for 2000, 2005 and 2010
o within the various projections and scenarios for the 2020 and 2030
Looking at o final and primary energy consumption
o share of RES electricity
o GHG emissions
Identify causes for such differences & compare the accuracy of
simulation and optimization approaches.
Back to the Future - Assessing two decades of energy projections and scenarios using TIMES for Portugal
Back to the Future - Assessing two decades of energy projections and scenarios using TIMES for Portugal
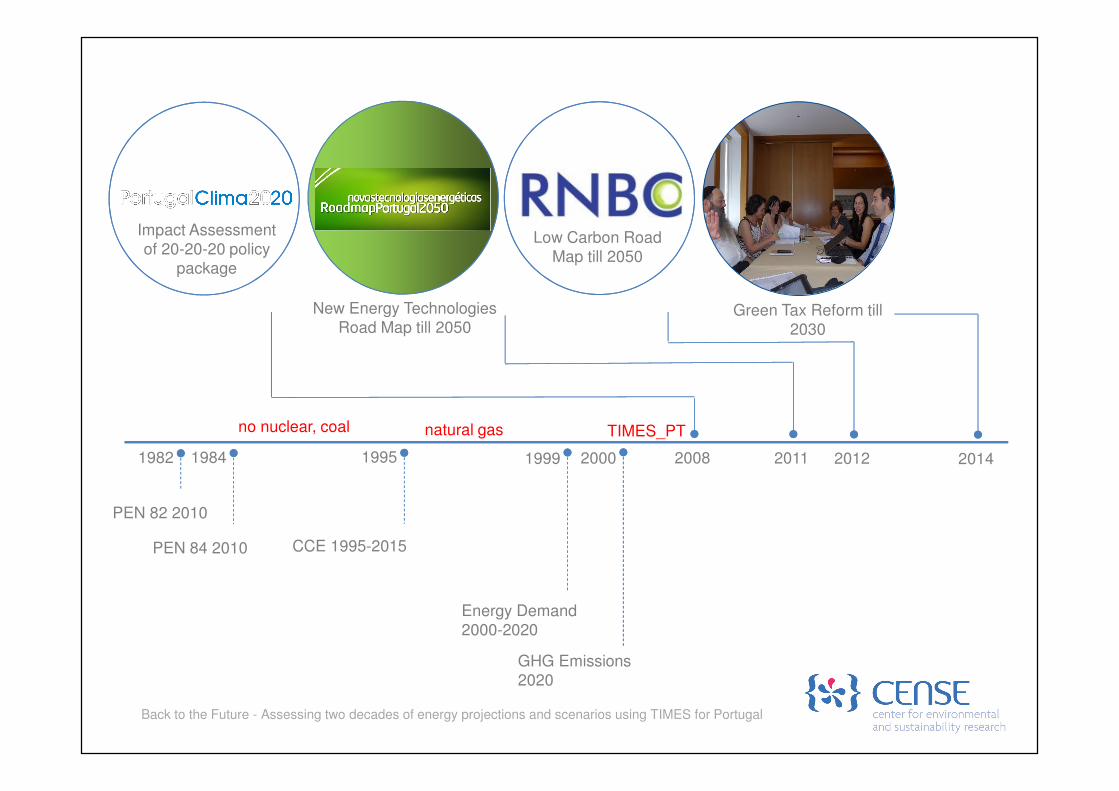
Impact Assessment
of 20-20-20 policy
package
Low Carbon Road
Map till 2050
New Energy Technologies
Road Map till 2050Green Tax Reform till
2030
2014201220112008
PEN 82 2010
PEN 84 2010 CCE 1995-2015
natural gas
Energy Demand
2000-2020
GHG Emissions
2020
no nuclear, coal
1982 1984 1995 1999 2000
TIMES_PT

Differences in projections - FEC
Back to the Future - Assessing two decades of energy projections and scenarios using TIMES for Portugal
4 to 35% difference - differences increase with age of studies,
change for sector discount rates, reviewed energy demand
forecasts
(for real data 2015 shows in fact 2012 values)
10
12
14
16
18
20
22
24
26
1995 2000 2005 2010 2015 2020 2025 2030 2035
Final Energy Consumption (Mtep)
PEN84L PEN84H CCEL CCEH ED20
GHG PT20L PT20H NETRL NETRH
LCRL LCRH NCCPL NCCPH REAL

Differences in projections – FEC (ii)
Back to the Future - Assessing two decades of energy projections and scenarios using TIMES for Portugal
population projections varied along time; earlier study with higher
FEC is average in FEC per capita
(for real data 2015 shows in fact 2012 values)
1.0
1.2
1.4
1.6
1.8
2.0
2.2
1995 2000 2005 2010 2015 2020 2025 2030 2035
Final Energy Consumption per capita (tep.inhab.)
PEN84L PEN84H CCEL CCEH ED20
GHG PT20L PT20H NETRL NETRH
LCRL LCRH NCCPL NCCPH REAL

Differences in projections - PEC
Back to the Future - Assessing two decades of energy projections and scenarios using TIMES for Portugal
27 to 40% difference - no increase in variation with age of studies
(for real data 2015 shows in fact 2012 values)
10
12
14
16
18
20
22
24
26
28
30
1995 2000 2005 2010 2015 2020 2025 2030 2035
Primary Energy Consumption (Mtep)
PEN84L PEN84H CCEL CCEH ED20
GHG PT20L PT20H NETRL NETRH
LCRL LCRH NCCPL NCCPH REAL
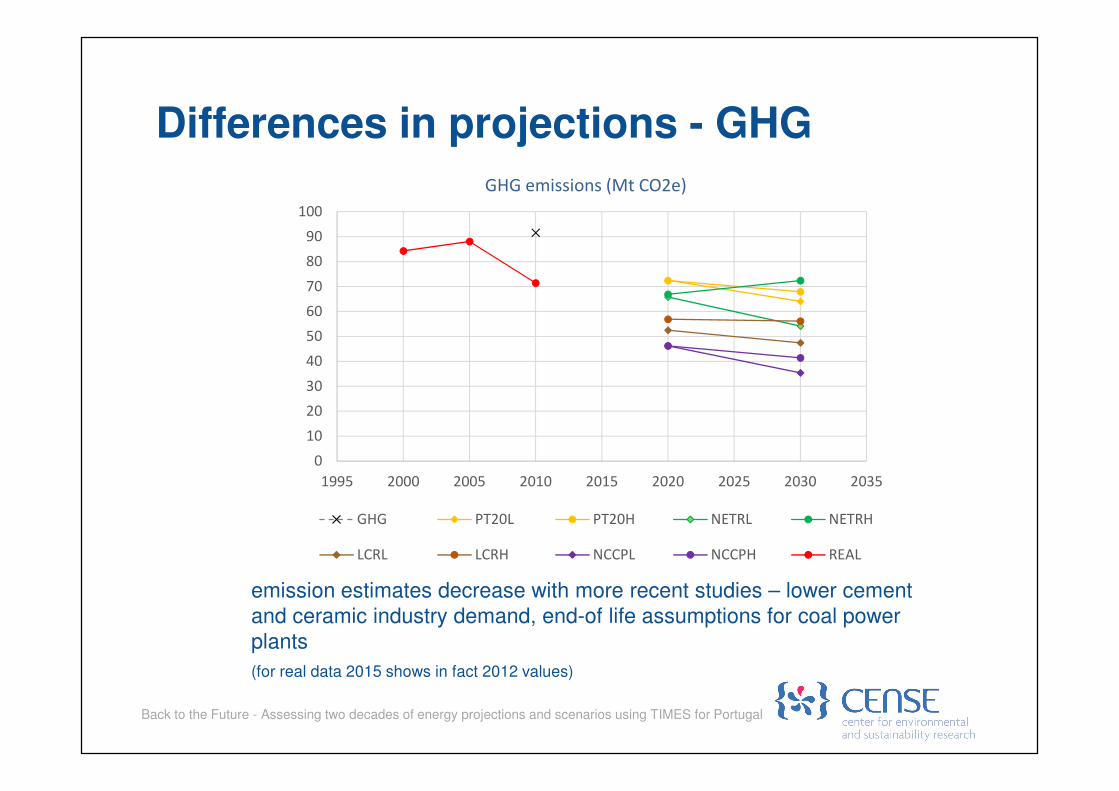
Differences in projections - GHG
Back to the Future - Assessing two decades of energy projections and scenarios using TIMES for Portugal
emission estimates decrease with more recent studies – lower cement
and ceramic industry demand, end-of life assumptions for coal power
plants
(for real data 2015 shows in fact 2012 values)
0
10
20
30
40
50
60
70
80
90
100
1995 2000 2005 2010 2015 2020 2025 2030 2035
GHG emissions (Mt CO2e)
GHG PT20L PT20H NETRL NETRH
LCRL LCRH NCCPL NCCPH REAL

Differences in projections – electricity consumed
Back to the Future - Assessing two decades of energy projections and scenarios using TIMES for Portugal
0
1000
2000
3000
4000
5000
6000
1995 2000 2005 2010 2015 2020 2025 2030 2035
Electricity Consumption (ktep)
PEN84L PEN84H CCEL CCEH ED20
GHG PT20L PT20H NETRL NETRH
LCRL LCRH NCCPL NCCPH REAL
studies of the ‘80s completely off mark!
(for real data 2015 shows in fact 2012 values)

Differences in projections – share of RES electricity
Back to the Future - Assessing two decades of energy projections and scenarios using TIMES for Portugal
51-73% electricity generated from RES with more recent projections
more optimistic
(for real data 2015 shows in fact 2012 values)
0.00
0.10
0.20
0.30
0.40
0.50
0.60
0.70
0.80
1995 2000 2005 2010 2015 2020 2025 2030 2035
Share RES electricity (%)
PT20L PT20H NETRL NETRH LCRL
LCRH NCCPL NCCPH REAL
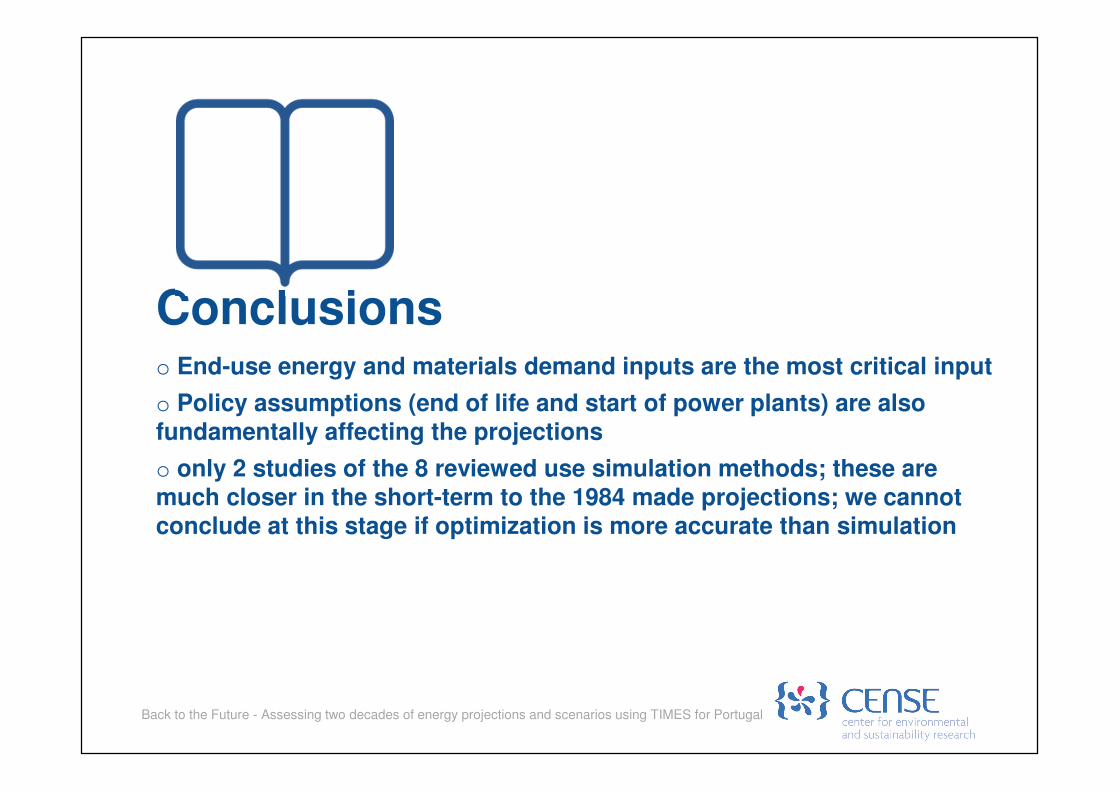
Conclusionso End-use energy and materials demand inputs are the most critical input
o Policy assumptions (end of life and start of power plants) are also fundamentally affecting the projections
o only 2 studies of the 8 reviewed use simulation methods; these are
much closer in the short-term to the 1984 made projections; we cannot
conclude at this stage if optimization is more accurate than simulation
Back to the Future - Assessing two decades of energy projections and scenarios using TIMES for Portugal
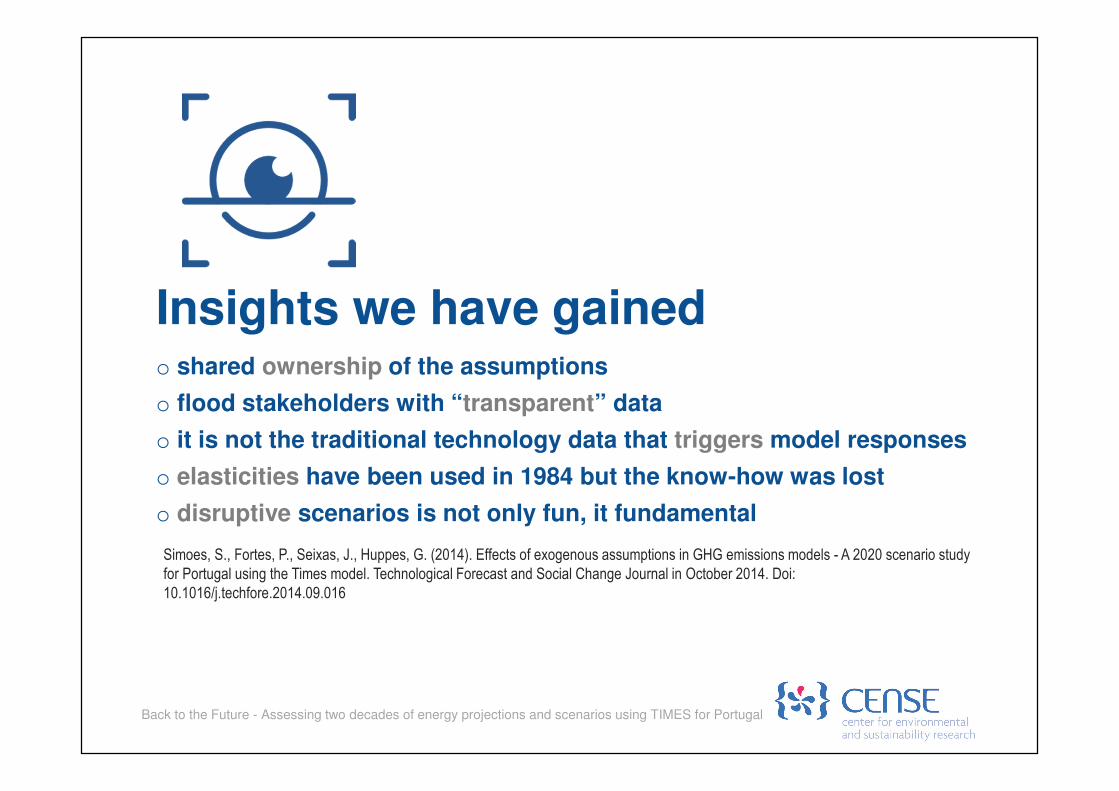
Insights we have gainedo shared ownership of the assumptions
o flood stakeholders with “transparent” data
o it is not the traditional technology data that triggers model responses
o elasticities have been used in 1984 but the know-how was lost
o disruptive scenarios is not only fun, it fundamental
Back to the Future - Assessing two decades of energy projections and scenarios using TIMES for Portugal
Simoes, S., Fortes, P., Seixas, J., Huppes, G. (2014). Effects of exogenous assumptions in GHG emissions models - A 2020 scenario study
for Portugal using the Times model. Technological Forecast and Social Change Journal in October 2014. Doi:
10.1016/j.techfore.2014.09.016

Energy flows in Portugal in 1980 – Portugal Energy Plan (1984)
Back to the Future - Assessing two decades of energy projections and scenarios using TIMES for Portugal
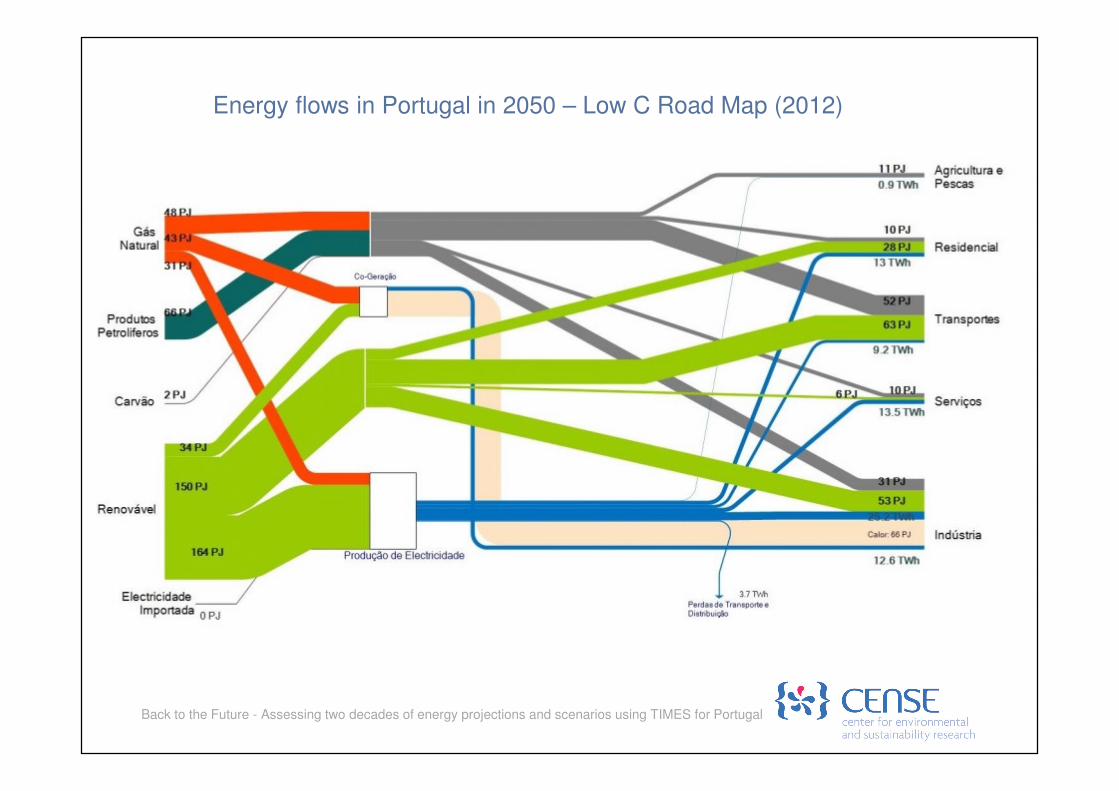
Energy flows in Portugal in 2050 – Low C Road Map (2012)
Back to the Future - Assessing two decades of energy projections and scenarios using TIMES for Portugal
http://cense.fct.unl.pt
https://www.facebook.com/
https://twitter.com/CENSE_FCT_UNL
https://www.linkedin.com/groups/CENSE-6694329
Sofia [email protected]
PEst-OE/AMB/UI4085/2013