author - unicef projections for macro level health system scenarios ... using the spreadsheet tool...
TRANSCRIPT


2
Author: Jeff Muschell
This document was written by and produced with the financial assistance of the European Union. The views
expressed herein can in no way be taken to reflect the official opinion of the European Union.

3
Acronyms .............................................................................................................................4
Part I Costing the EPHS.................................................................................................5
1. Introduction ................................................................................................................6
1.1 Background to the EPHS .............................................................................................................. 6
1.2 Assumptions underlying the EPHS cost projections .................................................................... 8
1.2.1 . General assumptions ......................................................................................................... 8
1.2.2 . Specific assumptions for staffing and salaries ................................................................... 9
1.2.3 . Specific assumptions for drug supplies and consumable medical supplies/equipment .. 10
1.2.4 . Specific assumptions for transportation expenditures ..................................................... 10
1.2.5 . Specific assumptions for construction expenditures ...................................................... 11
2. Cost projections for individual health facilities ............................................................................. 12
3. Cost projections for macro level health system scenarios ........................................................... 15
3.1 Scenario 1: Distribution of health facilities by population-based norms ..................................... 15
3.2 Scenario 2: Currently functioning health facilities ...................................................................... 18
3.3 Scenario 3: Capacity-based distribution ...................................................................................... 20
3.4 HR Projections ............................................................................................................................ 22
4. Discussion .......................................................................................................................................... 23
Part II User’s guide for the EPHS Cost Projections Tool ..............................................25
A. Introduction ....................................................................................................................................... 26
B. Using the spreadsheet tool for “macro” analyses ........................................................................ 28
B.1 The basics .................................................................................................................................. 28
B.2 Yellow tabs: salary scales ........................................................................................................... 28
B.2.1 . Salary Scales NWZ ........................................................................................................... 29
B.2.2 . Salary Scales NEZ ............................................................................................................ 29
B.2.3 . Salary Scales NEZ ............................................................................................................ 29
B.3 Pink tabs: EPHS budget line items ............................................................................................. 29
B.3.1 . Staff Costs ....................................................................................................................... 29
B.3.2 . Drug supplies ................................................................................................................... 30
B.3.3 . Consumable supplies and equipment .............................................................................. 31
B.3.4 . Non-consumable supplies and equipment ....................................................................... 31
B.3.5 . Transportation .................................................................................................................. 31
B.3.6 . Renovation & construction ............................................................................................... 32
B.3.7 . Foreign exchange rates .................................................................................................... 32
Contents

4
B.4 Green tabs: selecting the number of facilities in each zone ....................................................... 32
B.5 Purple tabs: summary pages for capital and recurrent costs ..................................................... 33
C. Using the spreadsheet tool for “micro” analyses ......................................................................... 34
C.1 The basics .................................................................................................................................. 34
C.2 Red tabs: cost projections for individual facilities ....................................................................... 34
D. The Human Resources Calculator ................................................................................................... 36
Annex 1 Schematic Representation of the Regional Health System ....................................................... 37
Annex 2 Staff cadres for the EPHS and two alternate salary ranges ....................................................... 38
Annex 3 Projected Staff needs for each Scenario .................................................................................... 39

5
CHW Community Health WorkerCSZ Central South ZoneEPHS Essential Package of Health ServicesH HospitalHC Health CentreHP Health PostMCH Maternal and Child Health (clinic)MOH Ministry of HealthNEZ North East ZoneNGO Non Governmental OrganizationNWZ North West ZoneOPD Out Patient DepartmentPHU Primary Health UnitRHC Referral Health Centre RHO Regional Health OfficeRMO Regional Medical OfficeRMS Regional Medical StoresSCZ South Central ZoneTB TuberculosisUN United NationsUNICEF United Nations Children’s Fund USD United States Dollars
Acronyms

6
I CosTIng THe ePHs

7
1.1 Background to the EPHSIn May 2008, UNICEF Somalia commissioned a team of
consultants to develop an “Essential Package of Health
Services” (EPHS) for the three Somali zones. In 2009,
UNICEF established that nearly 900 primary health
facilities are functioning (see Table 1 below).
Introduction1
However, these facilities operate to greatly differing
standards, with different levels of:
Infrastructure – (for example roughly 50 percent •
of all health posts are estimated to not have any
formal building/s at all, operating out of a private
house or shop);
Staffing – some MCHs have as many as 12 •
professional staff assigned to them, but most rural
MCHs do not have a single professional nurse or
midwife, relying solely on auxiliaries and TBAS;
Service packages – all MCHs are supplied with •
UNICEF’s basic and renewable kits. To a certain
extent the range of services that are offered
depend on the supplies given. However, these
vast differences in staffing and capacity result in
Table 1: Numbers of Health Posts and Maternal and Child Health Centres, by zone
Zone no. of HPs no. of MCHsSomaliland 150 70Puntland 119 48Central South 356 138Totals 625 256
some MCHs having quite high-level services with
some degree of inpatient capacity and the ability to
assist in deliveries (births), while others are barely
functional above the HP level.
The differing standards of operation, combined with
different geographical locations (urban, rural, next to
roads), opening hours and costs of services, result
in very different levels of utilization. The location and
degree of support a facility receives is driven more by
the presence of a supporting NGO programme and
security/access constraints, than by a national public
health/equity logic (they are too low in number to do
so, anyway). In general, services are underutilized with
low public trust in quality of services, low availability of
services (e.g. limited opening hours and frequent stock
outs of drugs), poor management and limited ability to
refer to a higher level facility when needed. While the health services are underfinanced, they also offer very poor return on investment.

8
It is clear that reform is needed. Too little money is
available to meaningfully assist the numbers of facilities
running, and too little is achieved with the current levels
of investment. Reform will therefore require:
expanding investment in health services to increase •
quality, build user trust and improve the utility of
each facility and the network as a whole (e.g.,
increased referral); or
reducing the number of facilities to ensure higher-•
quality services in the facilities that are affordable,
or
both of the above.•
As a first step in defining, analyzing and proposing a
way out of this conundrum, the various health sector
actors in Somalia (MoHs, donors, UN, NGOs and local
organizations) agreed to the formation of an Essential
Package of Health Services (EPHS), which set out to
define a relevant standardised model for the different
tiers of an eventual health system. The EPHS is similar
in many ways to those developed for other post-conflict
countries such as Afghanistan or Southern Sudan,
which sought to define a template for nationwide
implementation. The Somali EPHS however, was not
designed as a countrywide blanket roll-out. While the
EPHS could serve as a template for reconstruction
of the entire health system, current realities on the
ground (e.g. insecurity, lack of governance, poor
human resource availability and insufficient strategic
investment in health) resulted in the EPHS being
designed to be flexible and deployable at local and sub-
national levels. As such, the EPHS sought to define
operationally-relevant standardized health facilities in
order to:
define a level of service required to achieve real •
return on investment in the public health sector
(and serve as a platform to allow genuine advances
to be made in public health);
ensure investment in like units to construct the •
foundations for a future health system;
estimate inputs necessary to achieve each tier of •
service delivery and therefore allow projections of
cost, staffing, medical supplies and infrastructure
needs; and
provide a model to aim for (for each facility, region •
or zone) as well as an operational framework
around which to plan and predict resource
requirements.
The EPHS does not define the “health system” or how
many units of each type of facility should exist in which
geospatial relationship. The EPHS does not define a
path towards construction of a health system. These
are decisions outside of the remit of the work and have
enormous financial and political ramifications. Using the
EPHS as a set of guidelines, one could:
start upgrading all facilities that now exist;•
do a performance review and begin upgrading the •
best performing facilities;
take a regional view and establish coherent local •
systems with referral and coverage; or
implement a mix of the strategies suggested above.•
A strategy needs to be developed with knowledge of
the extent of resources available now and over time
(e.g., finances, staff, management, drugs). The EPHS
permits projections of costs (the subject of this report),
staffing needs and infrastructure needs (standard
blueprints), to allow an appreciation of what might or
might not be possible within current funding limitations.
The EPHS consists of essential health services
implemented across four levels of service provision
(building blocks), each with a standardised service
profile and each supported by a standardised set of
management and support components. Any system,
as elaborate or as simple as is affordable, could then be
constructed out of the building blocks.

9
There is no well established district health system
at present; for this reason, the focus in the short- to
medium-term will be to develop the health system
on a regional basis (see Annex 1 for a schematic
representation of the “regional health system”).
To facilitate a health systems development approach to
regional services provision, Regional Health offices
need to be established or strengthened in each region
to provide managerial, supervisory and health systems
support inputs to each of the four levels of care. As
capacities are built up at the regional level, efforts in the
longer term can move towards the establishment of a
district health system1.
In some regions, particularly in more rural areas,
Referral Health Centres will be established where
there are no hospitals. Although “district hospitals”
are in place in many districts, many of those facilities
do not presently provide hospital-level care and the
health system cannot bear the costs of starting and
running a district hospital in all districts. Hence, a more
pragmatic approach needs to be taken, prioritising
geographic areas/populations for services and then
developing outwards as and when the system can
manage it. In such cases, existing district hospitals may
be downgraded to the level of a Referral Health Centre
or Health Centre. Cost projections in this document
provide for both RHCs and “generic” hospitals.
1 Further details of the EPHS are available in reports 2 and 3 - Essential Package of Health Services – 2009.
1.2 Assumptions underlying the EPHS cost projectionsAs the EPHS was designed to be a flexible planning
tool, its costing depends on how many of each kind of
facility to be developed, in which areas. This document
provides a set of cost projections at both at the “micro”
level of the individual health facility (section 2 below)
and at the “macro” level of the health system (section 3
below). Projections were produced using a spreadsheet
tool developed to complement the EPHS model. The
reader should note that the spreadsheet tool is limited
and meant only for developing cost projections for
discussion, advocacy and initial planning purposes. The
tool reflects design elements of the EPHS and in its
current format is inappropriate for other basic health
service packages, and cannot be used for retrospective
cost analyses.
The costing tool is based on a set of spreadsheets
of estimated costs around a range of functions. As
experience with implementing the EPHS grows, these
costing sheets should be revised and the costing tool
made progressively more accurate and useful.
1.2.1 general assumptionsThe spreadsheet tool is based on the standard concept
of a cost profile for a health facility, and includes a
range of assumptions elaborated on below. Some cost
elements that are normally considered in a costing
estimate exercise are not included in the EPHS cost
projections. For example, there is no consideration
of recurrent costs associated with vehicles allocated
to the central Ministry of Health offices. Specific cost
elements included in the projections are deliberate and
Table 2: Current and equivalent health facility tiers
ePHs standard Facility Current Comparable Facility LevelPrimary health unit (PHU) Health Post (HP)Health Centre (HC) Maternal and Child Health centre (MCH)Referral Health Centre (RHC) District HospitalHospital (H) Regional Hospital

10
assumed to be those elements that will be funded
primarily by donors, at least in a short- to medium-term
implementation timeframe.
The EPHS design also omits potential construction or
renovation expenditures in all but two cases: maternity
wards will be constructed for many, if not most, HCs
- and RHOs may decide to construct a new Regional
Medical Stores (RMS) building. No construction
expenditures are included for PHUs, RHCs or “generic”
hospitals. Finally, cost projections in this document do
not include projections for national/referral hospitals,
TB facilities or mental health hospitals. The EPHS
spreadsheet tool covers the cost elements shown in
Table 3 below.
Table 3: Cost elements included in the EPHS spreadsheet tool
Capital cost elements Recurrent cost elementsVehicles StaffingConstruction (for HCs and RHOs) Drug supplyNon-consumable equipment Consumable supplies & equipment
TransportationMaintenance of non-consumable equipmentMaintenance of physical plant
It is envisaged that the EPHS will be implemented in
two phases. During Phase 1 each health facility will
have a minimum complement of appropriately-trained
health workers. In Phase 2 each facility is allocated
additional staff, resulting in an adequate number of
health workers of each cadre being present. The
phased introduction of EPHS is to account for the time
it will take to train and deploy sufficient numbers of
health workers, particularly the higher-skilled cadres.
As an example, during Phase 1 a Health Centre is
required to have one registered midwife and one
registered nurse. During Phase 2, an HC would be
allocated two registered nurses and two registered
midwives. Other staff cadres would be added to the
HC during Phase 2, including an additional auxiliary
nurse and a laboratory assistant. For the purposes of
this document, costs are projected only for Phase 1
staffing levels, both to reduce any possible confusion
and complexity resulting from switching from Phases 1
to 2 and also because it is not yet clear how long Phase
1 staffing levels are likely to persist. It should be clear
that staff costs will be higher in Phase 2 than in Phase 1.
Specific assumptions concerning some of the more
important cost elements are discussed in the following
sub-sections. The macro level cost projections in
section 3 below will include additional scenario-specific
assumptions.
1.2.2 specific assumptions for staffing and salariesThe EPHS explicitly requires larger numbers of
appropriately skilled staff than are currently available
in the present health care system. For some cadres
of health workers (e.g. Community Health Workers
or CHWs) new training programmes need to be
implemented, providing for a higher skill level than
presently exists among CHWs. Other cadres of health
worker such as registered nurses and midwives are
currently being trained through donor-supported training
programmes at training institutes throughout the zones,
but these cadres need to be incorporated and retained
within the public sector health system.
A key sticking point will be the salary level offered
to each cadre. Currently, official salary scales are far
too low to retain skilled personnel in the public sector
health system. Two alternate salary scales are used in
cost projections in this document: a) US dollar amounts
based on a “standard proposal” salary scale developed
11
locally (which is higher than current official salary scales)
and b) US dollar amounts based on a UNICEF-proposed
salary scale which incorporates a system of graduated
factors for increasing both the absolute amount of
pay for many cadres, as well as the differences in pay
between grades.
Both the standard proposal and the UNICEF-proposed
salary scales increase the base levels of pay over the
current official pay scales, but the UNICEF proposal
is considerably higher, particularly for grades A and
B. The table below provides several examples. See
Annex 2 for a table outlining all currently considered
grades (note: the table in Annex 2 is not complete, as
a final determination of cadres and their grades is still
underway).
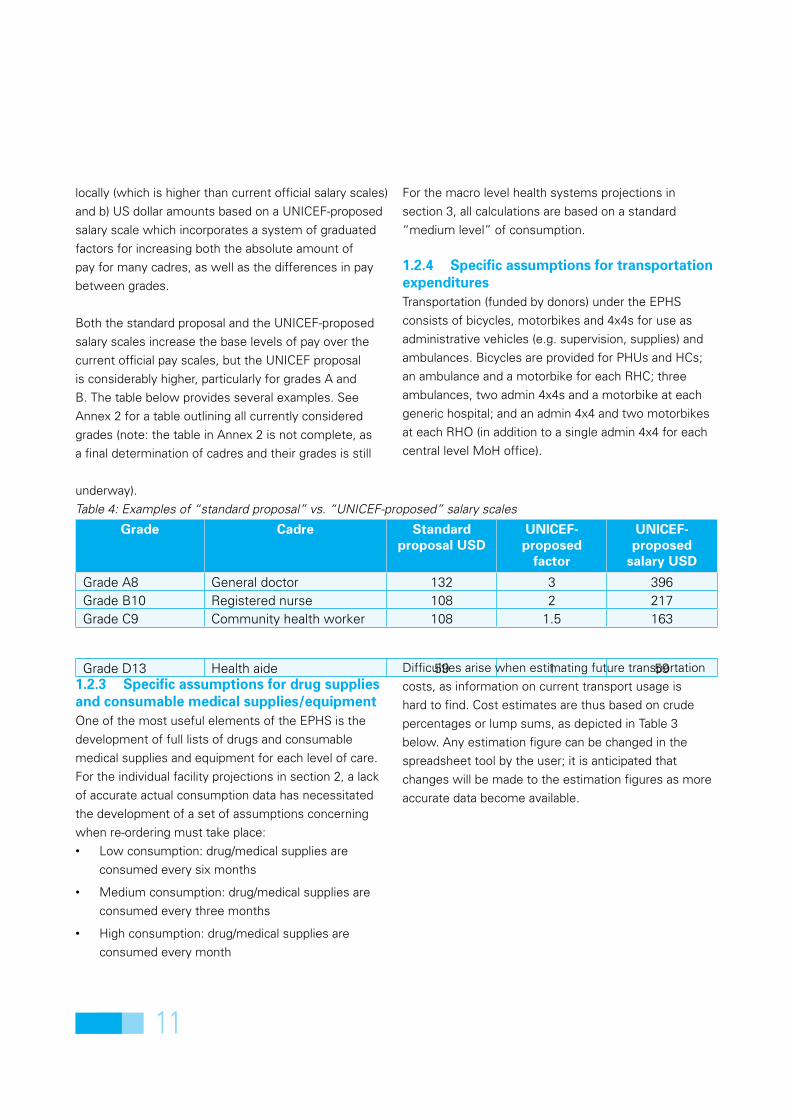
Table 4: Examples of “standard proposal” vs. “UNICEF-proposed” salary scales
grade Cadre standard proposal UsD
UnICeF-proposed
factor
UnICeF-proposed
salary UsD
Grade A8 General doctor 132 3 396Grade B10 Registered nurse 108 2 217Grade C9 Community health worker 108 1.5 163
Grade D13 Health aide 59 1 591.2.3 specific assumptions for drug supplies and consumable medical supplies/equipmentOne of the most useful elements of the EPHS is the
development of full lists of drugs and consumable
medical supplies and equipment for each level of care.
For the individual facility projections in section 2, a lack
of accurate actual consumption data has necessitated
the development of a set of assumptions concerning
when re-ordering must take place:
Low consumption: drug/medical supplies are •
consumed every six months
Medium consumption: drug/medical supplies are •
consumed every three months
High consumption: drug/medical supplies are •
consumed every month
For the macro level health systems projections in
section 3, all calculations are based on a standard
“medium level” of consumption.
1.2.4 specific assumptions for transportation expendituresTransportation (funded by donors) under the EPHS
consists of bicycles, motorbikes and 4x4s for use as
administrative vehicles (e.g. supervision, supplies) and
ambulances. Bicycles are provided for PHUs and HCs;
an ambulance and a motorbike for each RHC; three
ambulances, two admin 4x4s and a motorbike at each
generic hospital; and an admin 4x4 and two motorbikes
at each RHO (in addition to a single admin 4x4 for each
central level MoH office).
Difficulties arise when estimating future transportation
costs, as information on current transport usage is
hard to find. Cost estimates are thus based on crude
percentages or lump sums, as depicted in Table 3
below. Any estimation figure can be changed in the
spreadsheet tool by the user; it is anticipated that
changes will be made to the estimation figures as more
accurate data become available.
12
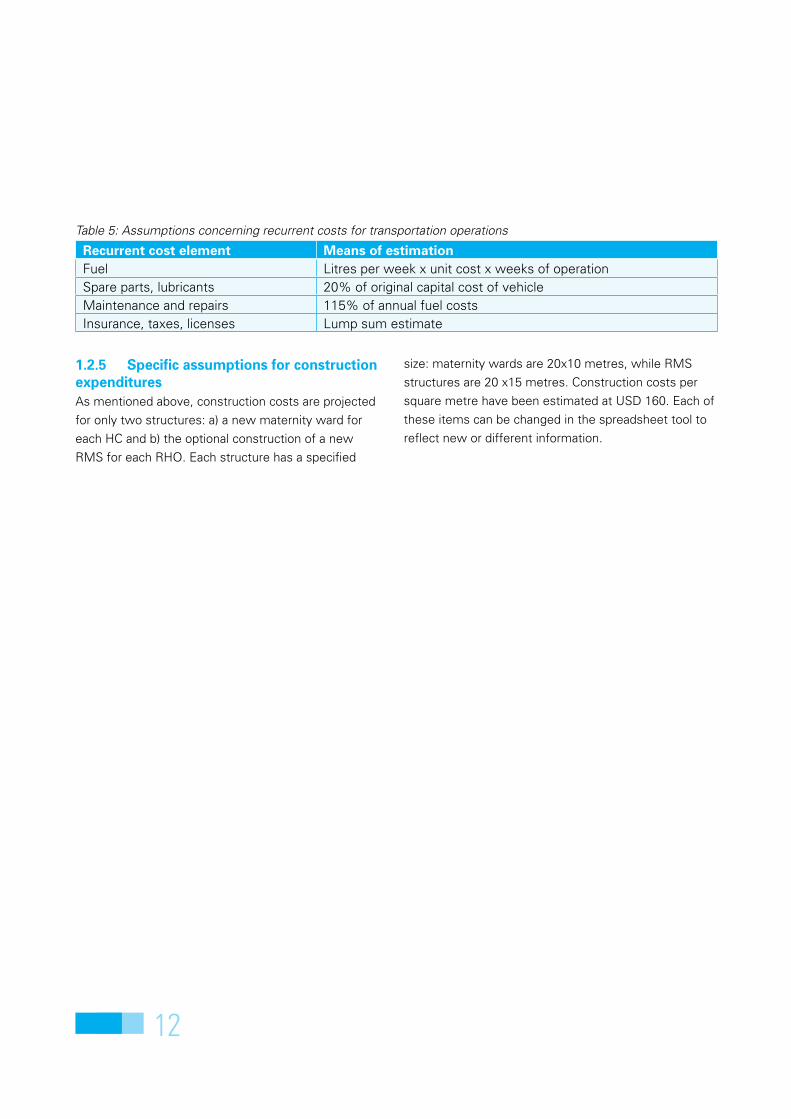
1.2.5 specific assumptions for construction expendituresAs mentioned above, construction costs are projected
for only two structures: a) a new maternity ward for
each HC and b) the optional construction of a new
RMS for each RHO. Each structure has a specified
size: maternity wards are 20x10 metres, while RMS
structures are 20 x15 metres. Construction costs per
square metre have been estimated at USD 160. Each of
these items can be changed in the spreadsheet tool to
reflect new or different information.
Table 5: Assumptions concerning recurrent costs for transportation operations
Recurrent cost element Means of estimationFuel Litres per week x unit cost x weeks of operationSpare parts, lubricants 20% of original capital cost of vehicleMaintenance and repairs 115% of annual fuel costsInsurance, taxes, licenses Lump sum estimate

13
The cost projections in this section provide estimates
of how much it might cost to operate a particular type
of EPHS facility for one year. The facility projections
provided below represent “annualised costs” in that
they include allocations for capital expenditures spread
across the lifespan of the capital item. New physical
plant is estimated to last 10 years; new vehicles and
equipment have an estimated lifespan of five years.
Recurrent costs include those listed in Table 3 above.
For salaries, each example below uses the UNICEF-
proposed salary scales. In addition, allocations are
made for sea freight and overland shipping (15% and
20% respectively) for drugs and consumable medical
supplies. Maintenance and repair of non-consumable
equipment is estimated at 15% of annualised capital
costs, while maintenance of physical plant plus
utilities is estimated at 110% of the annual equipment
maintenance amount.
Cost projections for individual health facilities2
Annualised costs are calculated for three of the key
facilities in the EPHS: PHUs, HCs and RHCs. It is
anticipated that these facilities will be crucial to the
successful implementation of the EPHS on any scale,
so health system planners will need to focus on the
costs of these facilities.
With these assumptions in mind, Table 6 provides low
and high end estimates of the annualised costs for
PHUs, HCs and RHUs, based on low and high levels of
“utilization” (modelled via estimates of consumption of
drugs and consumable medical supplies & equipment)2.
As can be seen in the charts below, the percentage of
total facility costs accounted for by salary expenditures
decreases (as absolute salary costs remain constant)
as “utilization” increases, with major differences
arising in terms of larger percentages of total facility
costs allocated to drugs and consumable supplies &
equipment.
2 The reader should note the EPHS spreadsheet tool uses separate spreadsheets to estimate the costs ofty drug supply (purple in the charts) and consumable medical supplies & equipment (medium blue in the charts), e.g., bandages, syringes, etc.
Facility Level Low end High endPrimary Health Unit 15,868 53,444Health Centre 56,858 158,211Referral Health Centre 146,884 329,552
Table 6: Low to high end annualised costs (USD) for specific EPHS facilities

14
Chart 1: Primary Health Unit
PHU Annualised Costs - Low End0.149476758
0.002520757
0.32353922
0.127169252
0.346427698
0.003781136
0.022421514
0.024663665
Non-consumable equipment
Vehicles
Staff salaries
Drug supply
Medical supplies; otherconsumablesTransportation operation &maintenanceHealth equipmentmaintenance & repairPHU maintenance, repair &utilities
PHU Annualised Costs - High End4% 0%
10%
23%
61%
0%
1%1%
Non-consumable equipment
Vehicles
Staff salaries
Drug supply
Medical supplies; otherconsumablesTransportation operation &maintenanceHealth equipmentmaintenance & repairPHU maintenance, repair &utilities
For Primary Health Units, the largest cost is for
drug supplies and consumable medical supplies &
equipment (48% for the low end estimate and 85%
for the high end estimate). In other words, if the
PHU becomes busier, this portion of costs grows
while other budget line items become proportionately
smaller. Hence if PHUs are to “earn” a good return on
investment they need to increase their patient loads.

15
HC Annualised Costs - Low End
16%
0%
39%
5%
33%
0%
2%
2%
3%
Non-consumable equipment
Vehicles
Staff salaries
Drug supply
Medical supplies; otherconsumablesTransportation operation &maintenanceHealth equipmentmaintenance & repairMaternity ward maintenance& repairHC maintenance, repair &utilities
HC Annualised Costs - High End
6% 0%
13%
10%
68%
0%1%1%1% Non-consumable equipment
Vehicles
Staff salaries
Drug supply
Medical supplies; otherconsumablesTransportation operation &maintenanceHealth equipmentmaintenance & repairMaternity ward maintenance& repairHC maintenance, repair &utilities
Chart 2: Health Centre
Roughly the same situation obtains for the Health Centre
level. Salary costs are a higher proportion of the cost
profile at both low and high ends, primarily because
higher-trained (and thus higher-paid) cadres are based
at HCs. Also note that the cost profile at the HC level
includes an additional annualised capital cost related to
the construction of a new maternity ward.
16
RHC Annualised Costs - Low End15%
5%
32%
3%
22%
19%
2%
2%
Non-consumable equipment
Vehicles
Staff salaries
Drug supply
Medical supplies; otherconsumablesTransportation operation &maintenanceHealth equipmentmaintenance & repairRHC maintenance, repair &utilities
RHC Annualised Costs - High End7%
2%
14%
8%
58%
9%
1%
1%
Non-consumable equipment
Vehicles
Staff salaries
Drug supply
Medical supplies; otherconsumablesTransportation operation &maintenanceHealth equipmentmaintenance & repairRHC maintenance, repair &utilities
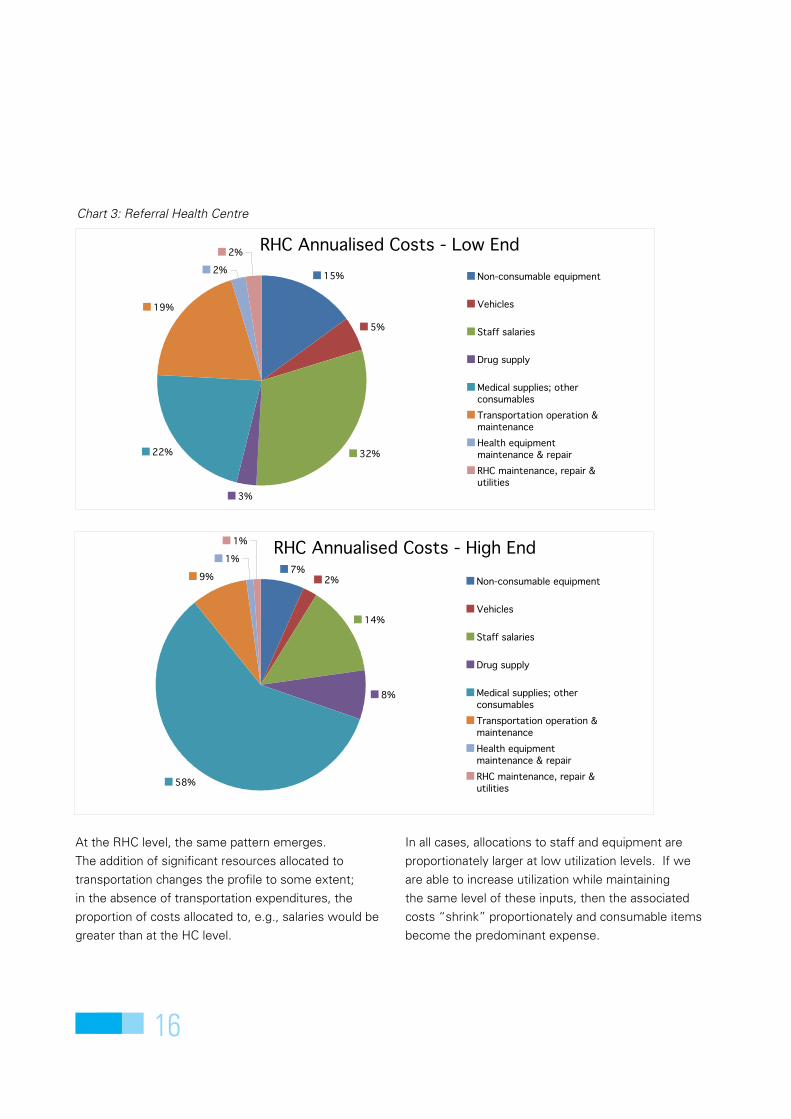
At the RHC level, the same pattern emerges.
The addition of significant resources allocated to
transportation changes the profile to some extent;
in the absence of transportation expenditures, the
proportion of costs allocated to, e.g., salaries would be
greater than at the HC level.
In all cases, allocations to staff and equipment are
proportionately larger at low utilization levels. If we
are able to increase utilization while maintaining
the same level of these inputs, then the associated
costs “shrink” proportionately and consumable items
become the predominant expense.
Chart 3: Referral Health Centre

17
Three macro level scenarios are considered in this
section, each of which is based on a different approach
to determining the number of health facilities for
EPHS implementation and donor support. Each macro
scenario is also based on 3 common assumptions, all of
which are specifically related to capital costs:
Capital cost assumptions under each macro level scenario
1. each region in each zone establishes and staffs a
Regional Health Office (RHO).
2. each RHO purchases equipment for a Regional
Medical Stores (RMS), but does not construct
a building for the RMS, on the assumption that
existing physical plant is available.
3. each Health Centre constructs a new 20x10m
maternity ward.
Based on the common assumptions above, the capital
costs for each scenario below will be quite high. The
reader will recognise that any of these assumptions
can be relaxed in order to lower up-front capital costs.
However, the common assumptions reflect several
important considerations built into the EPHS model.
First, each regional health system will require extensive
supervisory support from the RHO (assumption 1).
The current drug supply system is deeply flawed
and it is expected that a regional approach to drug
supply procurement and distribution will strengthen
and rationalise the system (assumption 2). Finally, a
high priority of the EPHS is to improve the quality of
maternal and child care, which will be facilitated by
strengthening the capabilities of Health Centres to
conduct facility-based deliveries assisted by a trained
birth attendant (assumption 3).
Also note that for each macro scenario below, the
regions of Sool and Sanaaq are kept separate from both
NWZ and NEZ.
3.1 Scenario 1: Distribution of health facilities by population-based normsAs discussed in section 1 above, the ultimate costs of
the EPHS-based health system will be highly dependent
on the salary scales eventually agreed by the three
zonal Ministries of Health and the donor community.
For Scenario 1, health facilities are assumed to be
distributed across the three zones according to a set
of standard international population-based norms,
specifically:
1 PHU per 7,500 population in rural areas only•
1 HC per 20,000 in all areas (rural + urban)•
1 RHC per 100,000 in rural areas only•
1 Hospital (district or “generic”) per 150,000 in all •
areas (rural + urban)
Cost projections for macro level health system scenarios3
18
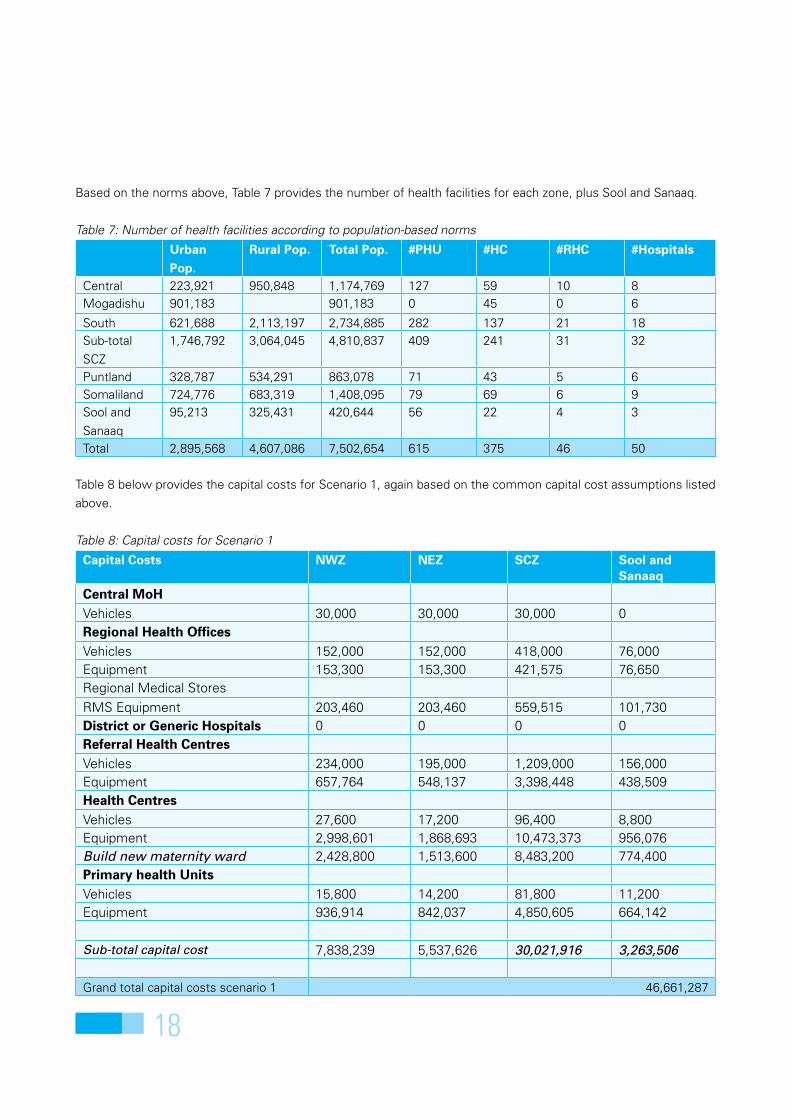
Based on the norms above, Table 7 provides the number of health facilities for each zone, plus Sool and Sanaaq.
Table 7: Number of health facilities according to population-based norms
Urban Pop.
Rural Pop. Total Pop. #PHU #HC #RHC #Hospitals
Central 223,921 950,848 1,174,769 127 59 10 8Mogadishu 901,183 901,183 0 45 0 6
South 621,688 2,113,197 2,734,885 282 137 21 18Sub-total
SCZ
1,746,792 3,064,045 4,810,837 409 241 31 32
Puntland 328,787 534,291 863,078 71 43 5 6Somaliland 724,776 683,319 1,408,095 79 69 6 9Sool and
Sanaaq
95,213 325,431 420,644 56 22 4 3
Total 2,895,568 4,607,086 7,502,654 615 375 46 50
Table 8 below provides the capital costs for Scenario 1, again based on the common capital cost assumptions listed
above.
Table 8: Capital costs for Scenario 1
Capital Costs nWZ neZ sCZ sool and sanaaq
Central MoHVehicles 30,000 30,000 30,000 0Regional Health officesVehicles 152,000 152,000 418,000 76,000Equipment 153,300 153,300 421,575 76,650Regional Medical Stores
RMS Equipment 203,460 203,460 559,515 101,730District or generic Hospitals 0 0 0 0Referral Health CentresVehicles 234,000 195,000 1,209,000 156,000Equipment 657,764 548,137 3,398,448 438,509Health CentresVehicles 27,600 17,200 96,400 8,800Equipment 2,998,601 1,868,693 10,473,373 956,076Build new maternity ward 2,428,800 1,513,600 8,483,200 774,400Primary health UnitsVehicles 15,800 14,200 81,800 11,200Equipment 936,914 842,037 4,850,605 664,142
Sub-total capital cost 7,838,239 5,537,626 30,021,916 3,263,506
Grand total capital costs scenario 1 46,661,287

19
The total capital cost for all three zones is a
considerable sum, but the reader should bear in mind
that this amount is likely to be an outer bound for
capital expenditures, as in reality some HCs may not
need new maternity ward construction (i.e., only ward
equipment will be needed if sufficient space is already
available) and it is likely that some regions will continue
to rely on central level procurement for drugs and
consumable medical supplies and equipment, and will
thus not require equipment for a RMS.
For recurrent costs under Scenario 1, a comparison is
made between the “standard proposal” salary scales
and the UNICEF-proposed salary scales, to assess the
extent to which a system focused on more realistic
income incentives will impact the overall recurrent cost
structure. Recurrent costs under both salary scales are
provided in table 9.
Table 9: Comparison of recurrent costs under Scenario 1 for lower vs. higher salaries
Recurrent Costs
Lower range of salaries Higher (UnICeF) proposed salariesnWZ neZ sCZ sool +
sanaaqnWZ neZ sCZ sool +
sanaaq
Central MoH 0 0 0 0 0 0 0 0
Regional
Health
offices
215,331 215,331 592,160 107,665 289,315 289,315 795,616 107,665
RMS
Equipment
6,104 6,104 16,785 3,052 6,104 6,104 16,785 3,052
District or
generic
Hospitals
3,024,400 2,016,267 10,753,422 1,008,133 3,437,878 2,291,919 12,223,566 1,008,133
Referral
Health
Centres
413,092 344,243 2,134,309 275,395 521,272 434,393 2,693,239 275,395
Health
Centres
3,176,783 1,979,734 11,095,720 1,012,887 3,6679,793 2,293,204 12,852,610 1,012,887
HC maternity
wards
36,432 22,704 127,248 11,616 36,432 22,704 127,248 11,616
Primary
health Units
1,297,553 1,166,155 6,717,710 919,784 1,348,903 1,212,305 6,983,560 919,784
Sub-total
recurrent
costs
8,169,695 5,750,538 31,437,355 3,338,533 9,319,697 6,549,944 35,692,625 3,338,533
Grand total capital costs scenario 1 48,696,121 54,900,799

20
Table 9 indicates that although differences in salary
levels between the two proposed scales vary from 0%
(for grade D) to 300% (for grade A), the overall impact
on annual recurrent costs of introducing the UNICEF-
proposed scales is an increase of approximately 13%.
This relatively low increase in total recurrent costs is
due to the fact that large numbers of lower-paid (but
adequately trained) workers are needed to staff many
PHUs and HCs, while smaller numbers of higher-
paid staff are based in fewer numbers of RHCs and
hospitals, as well as the fact that the UNICEF-proposed
graduated factors are considerably lower for grades C
and D (1.5 and 1, respectively) than for grades A and B
(3 and 2, respectively).
To the extent that higher salary scales provide a
sufficient incentive for recruitment, deployment and
retention of professional and semi-professional staff,
it is likely that such investments would result in good
value for money, given the impact of adequate staffing
and management on overall productivity. Or looking at
it another way given the huge investments (e.g., capital
and recurrent costs) needed to construct a public sector
health system – and the relatively small proportion
of costs that go to staff – it is essential to deploy
appropriately trained and adequate numbers of staff in
order to optimize the effective and efficient use of the
total investment.
3.2 Scenario 2: Currently functioning health facilitiesUnder Scenario 2, the number of health facilities for
assessment is based on “currently functioning” health
facilities.3 The notion is that the EPHS service and staff
profiles would be introduced at all facilities that are
currently operational. The problem is that estimates of
currently functioning facilities are quite variable. Zonal
Ministries of Health have their own estimates, while
UNICEF has developed a separate set of estimates
based on whether or not a facility has (at least
periodically) received direct UNICEF support.
In some cases, the two sources of information provide
similar estimates. For example, the number of MCH-
OPDs in CSZ is estimated by the MoH as 126, while
UNICEF’s estimate is 130. In other cases, the two
sources diverge considerably. The MoH in CSZ lists 131
operational HPs, while UNICEF estimates 356. For the
purposes of projecting costs for Scenario 2, a smoothed
estimate has been established for each type of facility
in each zone, as shown in Table 10 below.
Note that Scenario 2 does not include allocations for
RHCs as none are “currently functioning.” Allocations
are still included for Regional Health Offices however,
as regional-level supervision is another high priority of
the EPHS model. Additionally, the common assumption
of a new maternity ward for each MCH-OPDs is
included in the capital cost projections.
Salary scales for Scenario 2 are assumed to be the
UNICEF-proposed levels.
3 Current health facilities are Health Posts (HPs), MCH-OPDs and district hospitals.

21
Tables 11 and 12 provide capital and recurrent costs projections for Scenario 2.
Table 11: Capital costs for Scenario 2
Capital Costs nWZ neZ sCZ sool and sanaaq
Central MoHVehicles 30,000 30,000 30,000 0Regional Health officesVehicles 152,000 152,000 418,000 76,000Equipment 153,300 153,300 421,575 76,650Regional Medical Stores
RMS Equipment 203,460 203,460 559,515 101,730District or generic Hospitals 0 0 0 0Referral Health CentresVehicles 0 0 0 0Equipment 0 0 0 0Health CentresVehicles 22,000 14,000 68,000 6,000Equipment 2,390,189 1,521,029 5,649,537 651,870Build new maternity ward 1,936,000 1,232,000 4,576,000 528,000Primary health UnitsVehicles 18,000 22,000 68,000 12,000Equipment 1,067,370 1,304,564 4,032,288 711,580
Sub-total capital cost 5,972,319 4,632,353 15,822,915 2,163,830
Grand total capital costs scenario 2 28,591,417
Table 10: number of health facilities identified as “currently functioning”
scenario 2 – Current functioning health facilities# HPs # MCHs # Distr. Hospitals
SCZ 340 130 15Puntland 110 35 4Somaliland 90 55 6Sool & Sanaaq 60 15 2
Total no. facilities 600 235 27
Note that capital costs are considerably less than in
Scenario 1, due to a much smaller number of Health
Centres (or MCH-OPDs in the terminology of the current
health system), and no allocations were made for Referral
Health Centres. The number of district hospitals is also
roughly half of the number provided for under Scenario 1.

22
Table 12: Recurrent costs under Scenario 2 (at UNICEF-proposed salary scales)
Recurrent Costs Lower range of salariesnWZ neZ sCZ sool + sanaaq
Central MoH 0 0 0 0
Regional Health offices 289,315 289,315 795,616 144,657RMS Equipment 6,104 6,104 16,785 3,052
District or generic Hospitals 2,291,919 2,291,919 5,729,797 763,973
Referral Health Centres 0 0 0 0
Health Centres 2,933,168 1,866,562 6,932,943 799,955HC maternity wards 29,040 18,480 68,640 7,920
Primary health Units 1,536,725 1,878,219 5,805,405 1,024,483
Sub-total recurrent costs 7,086,270 6,350,598 19,349,186 2,744,040
Grand total capital costs scenario 2 35,530,095
Total recurrent costs are less than the lower-end
estimates under Scenario 1, again due to the
significantly lower number of facilities in the projection.
Both Scenarios 1 and 2 are likely to be too expensive
to enable sustainable support from either the zonal
Ministries of Health or the donor community, however.
A more realistic approach is necessary.
3.3 Scenario 3: Capacity-based distributionThe final macro scenario represents a more rational
distribution of health facilities, based on the short- to
medium-term capacities of the zones to implement
a high-quality health system, and on the ability of the
various health training institutes to turn out sufficient
numbers of qualified graduates.
For this scenario, the numbers of EPHS-enabled
facilities are based on a bias towards PHUs and RHCs
in rural areas with low population density, and a bias
towards HCs and district hospitals in urban and high
population density areas.
Table 13: Capacity-based distribution of health facilities
scenario 3 – Projections based on capacity and rational distributions
PHUs # HCs # RHCs Distr./generic hospitals
SCZ 165 94 17 11Puntland 37 14 3 2Somaliland 59 24 4 4Sool and Sanaaq 22 9 2 2Total no. facilities 283 141 26 19

23
Tables 14 and 15 provide capital and recurrent costs for Scenario 3.
Table 14: Capital costs for Scenario 3
Capital Costs nWZ neZ sCZ sool and sanaaq
Central MoHVehicles 30,000 30,000 30,000 0Regional Health officesVehicles 152,000 152,000 418,000 76,000Equipment 153,300 153,300 421,575 76,650Regional Medical Stores
RMS Equipment 203,460 203,460 559,515 101,730District or generic Hospitals 0 0 0 0Referral Health CentresVehicles 156,000 117,000 663,000 78,000Equipment 438,509 328,882 1,863,665 219,255Health CentresVehicles 9,600 5,600 37,600 3,600Equipment 1,042,992 608,412 4,085,050 391,122Build new maternity ward 844,800 492,800 3,308,800 316,800Primary health UnitsVehicles 11,800 7,400 33,000 4,400Equipment 699,721 438,808 1,956,846 260,913
Sub-total capital cost 3,742,181 2,537,662 13,377,050 1,528,469
Grand total capital costs scenario 3 21,185,363
Capital costs under Scenario 3 are approaching levels
that might entice medium- to longer-term donor support.
The reader will note that capital costs associated with
the Regional Health Offices have stayed constant in all
three scenarios, by way of the common assumptions.

24
Table 15: Recurrent costs under Scenario 3 (at UNICEF-proposed salary scales)
Recurrent Costs Lower range of salariesnWZ neZ sCZ sool +
sanaaq
Central MoH 0 0 0 0
Regional Health offices 289,315 289,315 795,616 144,657RMS Equipment 6,104 6,104 16,785 3,052
District or generic Hospitals 1,527,946 763,973 4,201,851 763,973
Referral Health Centres 347,515 260,636 1,476,938 173,757
Health Centres 1,279,928 746,625 5,013,051 479,973HC maternity wards 12,672 7,392 49,632 4,752
Primary health Units 1,007,408 631,765 2,817,329 375,644
Sub-total recurrent costs 4,470,888 2,705,809 14,371,202 1,945,808
Grand total capital costs scenario 3 23,493,707
3.4 HR projectionsThe number of staff required is not just an issue of
cost. There are few health professionals being trained
inside Somalia and even fewer who enter the public
system. There is a major time lag in production of
professionals and in particular the production of higher-
level professionals (it takes seven years to produce a
medical doctor).
In Annex 3 we present a projection of staff
requirements for the three costed scenarios. The table
is daunting as large numbers of staff are required,
needing to be distributed across the public health
system.
In particular there is a need for mass production of
specific cadres, ranked in order of numbers needed:
Nurse1.
Community Health Worker – trained (CHW)2.
Midwife (MW)3.
Auxiliary nurse4.
Auxiliary midwife5.
Health professional able to perform C-section6.
Medical Doctor7.
Lab assistant8.
Lab technician9.

25
The scenarios above have demonstrated that there is
no cheap way of introducing EPHS on a wider scale,
particularly if one applies international norms and
standards for facilities per population4. Considerable
resources will be needed to support the training
institutes and pay health workers at a level that will
entice them to stay in the public sector, to adequately
supply each facility and to ensure that sufficient levels
of supervision and managerial oversight are available.
However, if resources are aggregated in a fully
functioning health system one can expect enhanced
performance. The current operational setting, which
involves long-term underinvestment in a relatively
high number of facilities with low utilization rates,
generates very little public benefit and limited return
on investment. It is cheap but with little return for the
money.
A few key conclusions can be reached:
There are limited resources (financial and human), •
therefore, the numbers of facilities should be
limited.
Facilities receiving investment must perform; •
in order to perform well, facilities must serve a
relatively large population in a relatively small area.
4 Somalia is a very low population density country, meaning that it is hard to aggregate demand geospatially. People are spread out over vast areas with low infrastructure development and difficult access.
Costs are higher for highly utilized facilities, but •
many absolute costs remain the same (e.g. for
staff and non-consumable equipment). Hence, the
“return on investment” is better for high utilization
facilities than for low utilization facilities. The focus
should be on developing well-functioning and
accessible health facilities in populous areas, that
can be relatively easily staffed, supervised and
supplied. As the system develops, facilities can be
established and supported in lower-priority areas,
but performance is key!
Facilities should operate as parts of functional •
regional systems. The planning and prioritization
of which locations to invest in will be important,
both to limit the numbers of facilities (and focus on
quality/performance) and to ensure that all facilities
are fully supported and interlinked (e.g. facilities
can refer upwards, thereby ensuring that public
resources are targeted to those with higher needs
and enhancing the public utility, efficiency and
equity of each facility).
When assessing overall health system costs, •
higher salary scales are surprisingly not a major
additional cost because the system relies on large
numbers of lower-cadre workers who must be
trained, organized and paid. It is worth paying
higher salaries to retain higher-skilled staff cadres
necessary to ensure that good quality services are
provided and that the ‘system’ functions well.
Discussion4

26
Once provided a realistic wage, all staff must be •
managed and supported in working full working
weeks and providing higher levels of care, as
members of functional teams.
Equipment and supply costs are high. Efficiency •
gains (lower costs or less waste or better stocking/
range of services) can be attained through careful
reform. Supplies need to be reformed in tandem
with improved staffing and management, but
are key to cost management and performance
enhancement.
The reader can use the projections and the costing tool
to develop any number of calculations according to the
needs of individual donors or SWAp-like donor groups.
For example, if it is assumed that Phase 1 of the EPHS
will run from three to five years, under Scenario 3 the
resulting costs can be estimated as below.
Table 16: Costs for a five-year timeframe for EPHS in Phase 1
Cost Year 1 Year 2 Year 3 Year 4 Year 5Capital 21,200,000
Recurrent 23,500,000 23,500,000 23,500,000 23,500,000 23,500,000Total over 5 yrs 138,700,000
Note: amounts for inflation may be applied at one’s discretion
This document has not considered additional costs
involved in Phase 2 of the EPHS. As mentioned above,
Phase 2 will require the deployment of additional staff
from specific cadres,in order to fully and adequately
staff each facility. The EPHS spreadsheet tool is
designed to incorporate Phase 2 projections; the user’s
guide provides instructions on how to develop cost
projections for both Phase 1 and Phase 2 staffing levels.
It is likely that a useful approach to introducing the
EPHS will be to implement the model on a pilot basis
initially, perhaps in just a handful of regions across the
three zones. Fortunately, the spreadsheet tool will
enable planners to develop cost projections for any
number of facilities, in any number of regions. If cost
data are collected during pilot phases, the costing tool
can be significantly improved.
Regarding the development of human resources,
projections of required staff clearly indicate the need
to start training larger numbers of a broader range of
cadres to staff the public health system. In addition,
some professional cadres are needed in such small
numbers that it may not be worth training them in
Somalia; Somalis could have a bilateral relationship
with institutes in neighbouring countries with higher or
regionally aggregated demand. However, an enormous
increase in training capacity is required as well as a
complete revolution or reshaping of the current health
workforce. Because of the long time needed to train
health professionals, this massive exercise will take
considerable foresight and planning.

27
II UseRs’ gUIDe FoR THe ePHs CosT PRojeCTIons TooL

28
This guide provides instructions for using the EPHS Cost Projections Tool – v.1 workbook, a set of Excel
spreadsheets that permit you to develop estimated cost
projections for implementing the EPHS under various
scenarios and at various scales. The tool can be used
to develop cost projections at the macro level of the
overall health system, or the micro level of the individual
health facility.
It is envisaged that the EPHS will be implemented
in two phases. During Phase 1, each EPHS-enabled
health facility will have a minimum complement of
appropriately-trained health workers. In Phase 2, each
health facility will be allocated additional staff, resulting
in an adequate number of health workers of each
cadre. In other words, from a cost perspective the only
difference between Phase 1 and Phase 2 is the cost
of staff5. Phase 1 and 2 staffing recommendations in
the EPHS have been made only for Primary Health
Units (PHUs), Health Centres (HCs) and Referral Health
Centres (RHCs). The EPHS model does not include
staffing recommendations for district or “generic”
hospitals, although district hospitals are included in the
EPHS cost projections tool. The EPHS-enabled Regional
Health Offices (RHOs) are assumed to be fully staffed
no matter when they are established. Finally, note that
Regional and/or National referral hospitals, TB centres
5 The phased introduction of EPHS is designed to account for the time it will take to train and deploy sufficient numbers of health workers, particularly for the higher-skilled cadres.
and mental hospitals are not included in the EPHS cost
projections.
The spreadsheet tool is based on the standard concept
of a cost profile for a health facility, consisting of a set
of capital and recurrent budget line items. However,
the tool projects costs only for the specific design
elements of the EPHS and does not include all of the cost elements that normally would be included in
a full cost analysis of a health system or an individual
health facility. The specific budget line items that are
incorporated into the cost projections tool are shown in
Table 1 below and are assumed to be those elements
that will be funded primarily by donors, at least in a
short- to medium-term implementation timeframe.
IntroductionA

29
As such, the spreadsheet tool is limited in capability
and is meant only for developing cost projections for
discussion, advocacy and initial planning purposes.
It is not appropriate for other basic health services
packages, at least not without revision, and it cannot
not be used for retrospective cost analyses.
It is expected that users will refine the information in
the spreadsheet tool as more accurate information
about the cost of inputs becomes available. It is
assumed that users have basic skills in using Excel
spreadsheets, in order to allow you to modify all
variables and formulas in the workbook.
Over time the workbook can be made more user
friendly through, for e.g., the use of VBA techniques
available in the Excel spreadsheet package.
Table 1: Budget line items included in the EPHS spreadsheet tool
Capital line items Recurrent line items
Vehicles Staffing
Construction (for HCs and RHOs) Drug supply
Non-consumable supplies & equipment Consumable supplies & equipment
Transportation
Maintenance of non-consumable equipment
Maintenance of physical plant & utilities

30
Worksheet tabs in the workbook are colour-coded to
represent different components of the cost projections.
In the sections below, each colour-coded group of
worksheets is reviewed.
B.1 The basicsBefore beginning a cost projection scenario, you should
first save a new copy of the workbook file, using an
appropriate naming convention. Depending on the
complexity of the scenario(s) under analysis, you may
need to save several new copies. For example, if you
want to run scenarios based on two different salary
scales, you should save one new copy as a “low salary”
version and one as a “high salary” version.
The summary worksheets at the beginning of the
workbook (labelled “Phase 1 Costs” and “Phase 2
Costs”) are where the final cost projections will appear
after you have filled out the appropriate worksheets
elsewhere in the workbook. As all of the other
worksheets must be reviewed or filled out prior to
calculating the cost projections, these two worksheets
will be described at the end of this section, after the
other worksheet groups have been reviewed.
B.2 Yellow tabs: salary scalesThe salary scales that will be offered to each cadre
of health worker are listed in the yellow-tabbed
worksheets. Two alternate salary scales are used in the
cost projections tool: a) US dollar amounts based on a
standard salary scale that has been proposed locally,
and b) US dollar amounts based on a UNICEF-proposed
salary scale which incorporates a system of graduated
factors for increasing both the absolute amount of
pay for many cadres, as well as the differences in pay
between the broad pay grades.
Both the standard proposal and the UNICEF-proposed
salary scales increase the base levels of pay over the
current official pay scales, but the UNICEF-proposed
salaries are considerably higher, particularly for grades A
and B. Table 2 below provides several examples.
Using the spreadsheet tool for “macro” analysesB
Table 2: Examples of “standard” vs. “UNICEF-proposed” salary scales
grade Cadre standard salary UsD
UnICeF-proposed
factor
UnICeF-proposed
salary UsD
Grade A8 General doctor 132 3 396Grade B10 Registered nurse 108 2 217Grade C9 Community health worker 108 1.5 163Grade D13 Health aide 59 1 59

31
B.2.1 salary scales nWZOn this worksheet, columns A and B list the different
grades and categories of health workers in each grade.
The list of staff grades and job titles is in draft form; it
is expected that users will make changes to the list as
staff grades are finalized in the zones.
There are three columns related to salary scales:
column D contains salary recommendations for NWZ
developed by the NCSC, in Somaliland shillings (SLSH).
Column E calculates USD values for the SLSH amounts,
and column F calculates the UNICEF-proposed salary
scales based on the UNICEF-proposed multiplier factors
listed in cells F4, F13, F19 and F25.
One may change any values in this worksheet, keeping
in mind that the cells in columns E and F contain
formulae, so it’s easiest to change salary values in
terms of SLSH in column D.
B.2.2 salary scales neZAt time of writing, no locally-recommended salary
scales are available for NEZ. For this reason, salary
scales for NWZ have been cut and pasted into the
worksheet for NEZ. Note that two temporary columns –
columns F and G – incorporate the NWZ salary data.
When one has identified relevant data for NEZ in either
Somalia shillings (SOSH) or USD, one may delete the
temporary columns and use the worksheet in the
same way as “Salary Scales NWZ”. Please note: the
formulae for calculating staff costs (see section 2.3
below) for NEZ are currently based on the temporary
columns F and G. When ready to include NEZ-specific
data in the “Salary Scales NEZ” worksheet, one will
need to change the associated cell numbers in the
formulas in the staff cost worksheets for NEZ.
B.2.3 salary scales neZAt time of writing, no locally-recommended salary
scales are available for CSZ. For this reason, salary
scales for NWZ have been pasted into the worksheet
for CSZ. Note that two temporary columns – columns F
and G – incorporate the NWZ salary data.
When one has identified relevant data for CSZ in either
Somalia shillings (SOSH) or USD, one may delete the
temporary columns and use the worksheet in the
same way as “Salary Scales NWZ”. Please note: the
formulae for calculating staff costs (see section 2.3
below) for CSZ are currently based on the temporary
columns F and G. When ready to include CSZ-specific
data in the “Salary Scales CSZ” worksheet, one will
need to change the associated cell numbers in the
formulas in the staff cost worksheets for CSZ.
B.3 Pink tabs: EPHS budget line itemsThe pink-tabbed worksheets provide information and
changeable variables related to the different recurrent
and capital line items included in the EPHS. Remember: as noted above, not every line item/cost element that
would be included in a standard cost analysis is included
in the EPHS cost projections. (Examples of line items
that are not included will be discussed in sections
below.)
B.3.1 staff CostsStaff costs for the EPHS are based on the salary scales
in the yellow-tabbed worksheets described above in
section 2.2. Separate worksheets are provided for
standard and UNICEF-proposed salary scales, for
each of the three zones. Thus, there are six separate
worksheets for staff costs:
Staff Costs NWZ• Staff Costs NEZ• Staff Costs CSZ•
Staff Costs NWZ - UNICEF• Staff Costs NEZ - UNICEF• Staff Costs CSZ - UNICEF•
32
Any changes made to the yellow-tabbed salary scales
worksheets will be reflected in the pink-tabbed salary
cost worksheets. Staff costs are calculated for PHUs,
HCs, RHCs, district or “generic” hospitals, and RHOs,
all based on the number of facilities of each type
selected for each zone (further described in section 2.4
below).
As mentioned in sections 2.2.2 and 2.2.3 above, the
salary cost spreadsheets for NEZ and CSZ are currently
linked to NWZ-specific salary data. For example, select
cell D4 on the “Salary Costs – NEZ” worksheet. You
will see that the formula links to “Salary Scales NEZ”
worksheet cell F23, which contains the cut and pasted
values from the NWZ salary scales worksheet.
When one has replaced the NWZ data with zone-
appropriate data in both yellow-tabbed NEZ and CSZ
salary scales worksheets, one needs to ensure that
the formulae in columns D and K (labelled “monthly
salary”) in each of the four pink-tabbed NEZ and CSZ
salary cost worksheets, link to the appropriate cells in
the salary scales worksheets. If one needs to change
cell numbers in formulae in columns D and K, use the
“Ctrl” key to select all relevant cells in each salary
cost worksheet, then use the “Replace” command to
change the formulae so that they link to the proper cells
in the yellow-tabbed salary scales worksheets.
B.3.2 Drug suppliesThe drug supplies worksheet contains a long list
of all the drugs that should be available for proper
implementation of the EPHS (for PHUs, HCs, RHCs
and hospitals – note that no drug supplies are listed
for the RHO, as it is not a drug dispensing facility). The
worksheet includes the following columns for each level
of the EPHS:
Unit price•
Units•
Stocked?•
Consumption (Low, Medium and High)•
The columns under “Consumption” represent a crude
method of estimating the costs of drug consumption. In
the absence of actual drug consumption data on which
to base cost estimates, the spreadsheet tool estimates
low, medium and high drug consumption based on
timeframes for re-ordering drugs after stock-outs, as
below:
Low consumption = drug supply re-ordered •
every six months
Medium consumption = drug supply re-ordered •
every three months
High consumption = drug supply re-ordered •
every month
The current unit prices in the worksheet have come
from a variety of sources (note the comment in cell B3).
An attempt to check and verify unit prices should be
made before calculating cost projections. In addition,
users should check and verify the values in the “Units”
column to ensure that the unit cost properly reflects
the unit under consideration. For example, the drug
“Amoxicillin tablet, 250 mg” is listed at a unit price
of $28.35. Users will need to ensure that they know
whether that unit price is per tablet or per bottle/packet
of tablets.
Similarly, the number entered into the “Units” column
should be a “composite” number: it should reflect both
the unit in which the drug is sold (e.g. bottle, packet,
single tablet, etc.) and the number of units that would
normally be stocked at a given facility. For example,
it will be seen that for “Amoxicillin tablet, 250 mg”,
the number of units is three. This means that each
time there is a stock-out of the drug, three units will
be re-ordered. A low-consumption cost projection for
this drug would thus be: 28.35 unit price x 3 units x 2
(because re-ordering takes place every six months) =
$170.10.
Finally, the “Stocked?” column indicates whether or not
the particular item should be in stock at each particular

33
health facility. Cost projections for the three levels of
drug consumption are calculated only if one types in
“X” in the appropriate cell.
B.3.3 Consumable supplies and equipmentThis worksheet lists and calculates cost projections for
consumable medical, laboratory, nutrition programme
and administration supplies for all levels of the EPHS,
including the Regional Health Offices (RHOs).
Consumption levels are calculated in the same way as
in the drug supply worksheet. As with the drug supply
worksheet, you should check, verify and update all unit
cost and unit data for each item in the list.
B.3.4 non-consumable supplies and equipmentThis worksheet permits cost projections for non-
consumable supplies and equipment, i.e. supplies and
equipment that can be expected to last longer than one
year. (It will be noted that there are no “consumption”
columns because these items are non-perishable and
are not consumed during the course of a year.)
The list of items includes furniture, non-perishable
medical, lab and diagnostic equipment, electrical
and lighting fixtures, communications gear, and
administrative equipment such as computers and other
office appliances. A list of equipment for a Regional
Medical Stores (RMS) is also provided (note that a RMS
would be based at the Regional Health Office).
As with other items in the sub-sections above, prices
and quantities required should be verified for each item
before calculating cost projections.
B.3.5 TransportationThe “EPHS Transport” worksheet includes both capital
and recurrent costs for transportation, mostly for EPHS-
enabled facilities. note: for the central level, the only
line item included is the capital cost of a single 4x4
vehicle for the central level MoH in each zone; there
is no consideration of the recurrent costs associated
with the vehicles, because it is assumed that central
level MoH offices would cover recurrent costs for their
EPHS-related vehicles.
Transportation capital costs (funded by donors) under
the EPHS consists of bicycles, motorbikes for outreach
and supervision, and 4x4s for use as admin vehicles and
ambulances. Bicycles are provided for PHUs and HCs;
an ambulance and a motorbike for each RHC, three
ambulances, two admin 4x4s and a motorbike at each
generic hospital; and an admin 4x4 and two motorbikes
at each RHO (in addition to the single admin 4x4 for
each central level MoH office).
Difficulties arise in projecting transportation costs, as
limited information on current transport usage exists
and is hard to find. Cost estimates are thus based on
crude flat rates or lump sums, as depicted in Table 3
below. One can of course change any variable in the
worksheet, as more accurate data become available.
Table 3: Assumptions concerning recurrent costs for transportation operations
Recurrent cost element Means of estimationFuel• Litres per week x cost per litre x weeks of operation•Spare parts, lubricants• 20% of original capital cost of vehicle•Maintenance and repairs• 115% of annual fuel costs•Insurance, taxes, licenses• Lump sum estimate•

34
If one chooses to change a variable, e.g. a different flat
rate estimate for maintenance and repairs, it will be
necessary to change the relevant variable at all levels
on the “EPHS Transport” worksheet (i.e. at PHU, HC,
RHC, hospital, RHO and central levels). Alternatively,
one may decide to use different variables at different
levels; for example, assuming that since motorbikes at
the RHO level will be used extensively for supervision,
they may have higher-than-usual maintenance and
repair costs.
B.3.6 Renovation & constructionThis worksheet demonstrates another instance in
which only selected line items are included in the EPHS
cost projections. Figures for construction costs are
included only for Health Centres (for a new maternity
ward) and for Regional Health Offices (for the possible
construction of a Regional Medical Stores facility). In
each case, the variables that can be changed are:
length• width• construction cost per square metre•
It is also possible to include the costs of renting rather
than constructing a RMS facility in the EPHS cost
projections.
B.3.7 Foreign exchange ratesThis simple spreadsheet includes cells for calculating
USD amounts for both Somali shillings (SOSH) and
Somaliland shillings (SLSH). Current rates should be
included here, as some calculations (e.g. salary scales
in USD) use these figures.
B.4 Green tabs: selecting the number of facilities in each zoneThere is a separate green-tabbed worksheet for each
zone for selecting the number of each type of facility
that one wants to include in cost projections. The
worksheet layout is the same for each zone.
In each of the green-tabbed worksheets, column A
lists the regions for the respective zone. Note that
space is left for the possibility that one or more zones
may “split” regions so the total number of regions will
increase.
Columns C-E allow one to choose to establish a
Regional Health Office in each region during Phase 1,
and whether to build and equip a RMS at each Phase
1 RHO. For example, users may choose to equip a
RMS, but not to build one if sufficient space is already
available. Columns F-H are for establishing RHOs and
RMSs during Phase 2.
Columns J and K enable decisions to be made on how
many PHUs to establish during Phases 1 and 2. It is
generally assumed that many existing Health Posts will
be upgraded to PHUs, although within the context of
the EPHS workbook there is no explicit need to link the
number of existing HPs to the number of PHUs to be
established in each region.
Columns M-P provide space for selection of how many
Health Centres are to be established in each region,
and for the number of HCs where maternity wards
would be constructed. A key recommendation of the
EPHS is that each HC should have a maternity ward.
Presently, few MCH-OPDs have sufficient wards for
deliveries and post-natal care.
Columns R, S, T, V and W relate to Regional Health
Centres (RHCs). In some regions, existing district
hospitals will remain designated as “hospitals” – this
can be entered in column R. In other regions, some
district hospitals may be designated as RHCs – this can
be entered in columns S and T (for Phases 1 and 2).
Finally, it may be that one or more regional hospitals
will be downgraded to RHCs; although this may be
unlikely, the possibility is provided for in columns V and
W (also for Phases 1 and 2).

35
B.5 Purple tabs: summary pages for capital and recurrent costsOnce all the information has been checked and verified
in the yellow- and pink-tabbed worksheets, and the
number of health facilities in each category entered
in the green-tabbed worksheets, the results of the
cost projections will be available in the purple-tabbed
summary worksheets.
(note: If one wishes for cost projections to include the
capital cost of a single EPHS vehicle for each zone’s
central level MoH, one will need to manually type
the number 1 in cells B6, D6 and F6 on the “Phase 1
Costs” worksheet. Note that there is no capital cost
element for the central level on the “Phase 2 Costs”
worksheet.)
36
C.1 The basicsUsing the red-tabbed worksheets, it is possible to
create projections for the cost of operating an individual
EPHS-enabled health facility for one year.
Note that the red-tabbed worksheets include annualised
capital costs, i.e. allocations for capital expenditures
spread across the estimated lifespan of the capital item
(using a straight line approach – new physical plant is
estimated to last 10 years; new vehicles and equipment
have an estimated lifespan of five years). This is a
little different from the approach used in the “macro”
analyses, which calculate capital costs as up-front costs
incurred in the first year of operation.
Recurrent costs include those listed in Table 1 in section
1 above. In addition, allocations are made for sea freight
and overland shipping (15 percent and 20 percent
respectively) for drugs and consumable supplies and
equipment. Maintenance and repair of non-consumable
equipment is estimated at 15 percent of annualised
capital costs, while maintenance of physical plant
plus utilities is estimated at 110 percent of the annual
equipment maintenance amount.
Because the red-tabbed worksheets include annualised
capital costs, freight and shipping allocations, and
maintenance and repair of equipment and physical
plant, the resulting cost projections are likely to be
closer to the full costs of operating a health facility for a
year. This means that cost projections for an individual
health facility using the red-tabbed worksheets will be
slightly larger than the amount one would get if one
took, say, the total recurrent costs of all Health Centres
in a macro analysis (from the purple-tabbed worksheets)
and divided that amount by the number of Health
Centres in one’s green-tabbed worksheets.
C.2 Red tabs: cost projections for individual facilitiesRed-tabbed worksheets are provided for the following
facilities: Primary Health Units, Health Centres and
Referral Health Centres (for Phases 1 and 2) and
Regional Health Offices (including Regional Medical
Stores). Note that no distinction is made between
Phases 1 and 2 for the RHOs, as it is assumed that
RHOs will be fully staffed no matter when they are
established. Also note that at present there are no red-
tabbed worksheets for hospitals.
The red-tabbed worksheets are mostly of the same
design, with a few minor variations depending on the
type of facility under consideration. To get an idea of
how the individual facility worksheets operate, select
the worksheet titled “Primary Health Unit – P1” (“P1”
refers to Phase 1).
Using the spreadsheet tool for “micro” analysesC

37
It will be seen that the capital costs section includes
non-perishable equipment and vehicles. The figures
for each line item are drawn from the pink-tabbed
worksheets. The “annualised capital costs” listed under
column I are calculated using a straightline depreciation
method.
Recurrent cost line items include staffing, drug
supply, consumable medical supplies and equipment,
transportation operation & maintenance, maintenance
and repair of health equipment, and maintenance and
repair of the physical plant. Maintenance and repair
figures are crude flat rates; users may change these
rates in the formulas should they choose to do so.
Now click on cell H11 and choose either: “nwz”,
“unwz”, “nez”, “unez”, “csz” or “uncsz”. These
acronyms refer to the relevant salary scales that users
want to use. A “un” indicates the UNICEF-proposed
salary scales. Note that at present, each zone uses
the same scales for MoH salaries and the same scales
for UNICEF-proposed salaries. As mentioned above
in section 2, once the yellow-tabbed salary scale
worksheets have been changed to incorporate zone-
specific figures, the red-tabbed worksheets will change
as well.
Next, click on cell H13 to select low, medium or
high levels of “drug consumption”. Similarly, click
on cell H19 to select low, medium or high levels of
consumption of consumable medical supplies and
equipment.
Once values for the yellow-coloured cells has been
chosen, one will get an amount that represents an
estimate of the annualised cost for a Primary Health
Unit during Phase 1. Simply delete the entries in the
yellow-coloured cells in order to “reset” the worksheet.
For Health Centres, one must choose whether or not
to build a maternity ward. Select “build” if it is wanted
to include the annualised cost of maternity ward
construction in a cost projection for a Health Centre.
For Regional Health Offices, users can select “build”
and “equip” if it is wished to both construct and equip
a Regional Medical Stores facility. Leave the “build”
cell blank if it one only wants to equip a RMS, if (for
example) one already has sufficient space at the RHO to
establish a medical stores facility. Please note that there
is no selection for “drug consumption” at the RHO,
since the regional office is not a dispensing facility.

38
This guide provides instructions for using the “HR
Calculator” workbook, a set of Excel spreadsheets
that permit the development of estimated “staff
projections” for implementing the EPHS under various
scenarios and at various scales. The tool can be used
to develop staff needs projections at the “macro” level
of the overall health system or at sub-levels such as
regional health systems.
It is envisaged that the EPHS will be implemented
in two phases: during Phase 1, each EPHS-enabled
health facility will have a minimum complement of
appropriately-trained health workers. In Phase 2, each
health facility will be allocated additional staff, resulting
in an adequate number of health workers of each
cadre. In other words, from a cost perspective the only
difference between Phase 1 and Phase 2 is the cost
of staff6. Phase 1 and 2 staffing recommendations
have cost implications but also implications for the development, recruitment, deployment and retention of human resources.
Phase 1 and 2 staffing recommendations in the EPHS
have been made only for Primary Health Units (PHUs),
Health Centres (HCs) and Referral Health Centres
(RHCs). The EPHS model does not include staffing
recommendations for district or “generic” hospitals,
6 The phased introduction of EPHS is designed to account for the time it will take to train and deploy sufficient numbers of health workers, particu-larly for higher-skilled cadres.
although district hospitals are included in the EPHS cost
projections tool. EPHS-enabled Regional Health Offices
(RHOs) are assumed to be fully staffed no matter when
they are established. Finally, note that Regional and/
or National referral hospitals, TB centres and mental
hospitals are not included in the EPHS cost projections.
The spreadsheet tool is based on the standard concept
of a staff profile for a health facility.
(1) The first page sets out the numbers of staff for
each level of health facility and per phase (no staff). This template can be changed if staffing
patterns are to be shifted in the EPHS.
(2) The second page is where users fill in the total
number of facilities for each tier to be supported,
as well as Regional Health Offices (total centres – columns B and C).
(3) The third page gives a total listing of the staff
required.
The Human Resources CalculatorD

39
IAnnex
Systematic representation of the Regional Health Systems

40
IIAnnex
Category examples (not exhaustive)
"Standard" suggested rates USD
UNICEF proposal = standard x
factor
Grade A Factor = 3A1 MoH Senior Director 257 772A2 Departmental Director, Central MoH 234 702A3 Regional Medical Officer, Regional Health System CEO 213 638A4 Regional/ National Hospital Chief Medical Officer 192 575A5 District Hospital CMO, District Hospital CEO 176 527A6 Referral Health Centre CMO/CEO 160 479A7 Senior Specialist Doctor (Department Head) 145 436A8 General Doctor, Specialist Doctor 132 396A9 HMIS/Transport/RMS Manager (Region/RHC) - university qualified 120 360
Grade B Factor = 2B6 Health/Clinical Officer, RHC/ DH Administrator, Hospital Chief Nurse 160 319B7 145 290B8 Management-level Nurse, Management-level Pharmacist 132 264B9 HMIS/Transport/RMS Manager (Region/RHC) - secondary education 120 240
B10 Registered Nurse/Midwife/Pharmacist, Lab Technician 108 217Grade C Factor = 1.5
C7 145 218C8 132 198C9 Community Midwife, Auxiliary Nurse. Pharm/Lab/X-ray Assistant 120 180
C10 Community Health Worker (CHW), HMIS Officer (HC) 108 163C11 Senior Maintenance Tech, Senior Driver (RHC, Hospital) 95 143
Grade D Factor = 1D12 Maintenance Tech, Driver, Senior Health Aide 65 65D13 Health Aide 59 59D14 Senior Cleaner, Senior Security 54 54D15 Cleaner, Security 49 49
Staff cadres for the EPHS and two alternate salary ranges III

41
II IIIAnnex
Projected staff needs in each scenario
Human Resource Management Scenario 1 Scenario 2 Scenario 3
Minimum Staffing Phase I Phase II Phase I Phase II Phase I Phase II
CHW 615 1230 600 1200 283 566
Auxiliary nurse 421 842 235 470 167 334
Community midwife 421 842 235 470 167 334
MW 617 1088 316 578 250 436
Nurse 1238 1905 659 1002 493 762
Health/clinical officer 50 146 27 54 19 64
Doctor 100 246 54 108 38 102
Professional qualified for caesareans 146 196 54 81
64 83
Anaesthetic assistant 96 96 27 27 45 45
Lab assistant 146 617 54 316 64 250
Lab technician 146 242 54 81 64 109
X-ray technician 0 50 0 27 0 19
Pharmacist technician 50 146 27 54 19 64
Pharmacist 0 50 0 27 0 19
Dental technician 50 146 27 54 19 64
Dentist 0 50 0 27 0 19
Ophthalmic technician 50 96 27 27 19 45
Physiotherapist 0 50 0 27 0 19
Hospital administrator (MBA) 0 50 0 27 0 19
Regional Medical Officer 19 19 19 19 19 19
PHC Coordinator 19 19 19 19 19 19
EPI Coordinator 19 19 19 19 19 19
Cold Chain Manager 19 19 19 19 19 19
Nutrition Coordinator 0 19 0 19 0 19
Regional Finance Officer 0 19 0 19 0 19
HMIS Officer/Health Information
Manager
19 19 19 19
19 19
Transportation Officer/ Manager 0 19 0 19 0 19
Regional Medical Stores Manager /
Pharmacy Assistant
19 19 19 19
19 19TOTAL 4260 8259 2510 4828 1825 3524


44