b&a%20consumer%20confidence%20tracker%20may%202014
DESCRIPTION
http://www.banda.ie/assets/files/pdf/B&A%20Consumer%20Confidence%20Tracker%20May%202014.pdfTRANSCRIPT

Consumer Confidence Tracker
May 2014
PREPARED BY:Luke Reaper and Ciara McCarthy
Behaviour & AttitudesJ.5270

2 2
Introduction

3
Introduction
This report presents the findings of the latest phase of the Behaviour &
Attitudes’ Consumer Confidence Tracker.
Survey results for this phase are based on a sample of 1,006 adults aged
16+, quota controlled in terms of age, gender, socio-economic class and
region to reflect the profile of the adult population of the Republic of
Ireland.
All interviewing on the survey is conducted on our fortnightly face-to-face
Barometer by trained members of the B&A field force working under
ESOMAR guidelines.
Fieldwork on the latest wave was carried out between 10th – 20th of April
2014.

4
About Behaviour & Attitudes
Behaviour and Attitudes is Ireland’s largest and most experienced
independently owned research company.
We pride ourselves on having the most experienced director team
in Ireland. All projects have a director involved.
Established over 25 years ago, Behaviour and Attitudes provides a full
range of market research services, ranging from CAPI, CATI, online and of
course qualitative.
Specialist sectors include: Retail & Shopper, Technology & Telecoms, Media,
Financial, Political & Social, Polling, Automotive, Healthcare and Public
Sector & Utilities.
For more information please visit our website at: www.banda.ie or contact
us on +353 1 2057500.

5
Summary
Looking forward, consumers are the most confident they’ve ever been since the start of this study. Almost 1 in 3 adults now believe that improvements to the economy will be made in one years time. We have finally entered positive territory.
While consumers agree that things have improved, they remain sceptical about how they spend/save their own personal finances. Disposable income is still low, this the macro optimism has yet to filter down to the consumer level. Those outside Dublin display most scepticism (albeit improvements are being registered) – those outside Dublin lag Dubliner optimism.
Encouragingly, unemployment levels are the lowest they’ve been since the start of the global recession, and employment is expected to increase by 2% this year alone.

7 7
The Macro Context

8
At a Macro Level, Improvements to Irelands Domestic Economy are evident…
Source: CSO Estimates as of 14th May 2014/EY Economic Eye Summer Report (2013)/ESRI Quarterly Commentary (2013)
-1.5 -1.5
-0.6
-3.6
-1.1
-1.5 -1.3
-1.0
0.9
-0.4
0.7
-1.2
1.7 1.5
-0.4
0.6
-0.3
0.7
-1.7
0.2
-1.1
1.0
1.5
-2.3
2.2
0.9
-1.3
-2.7 -2.8
-2.4
-2.8
-1.9
-0.9
0.3
1.8
2.2
0.8
-3.3
-0.0
0.1
-1.3
0.6
-2.3
0.4
2.0
-0.1
1.6
0.2
2.7
-4.0
-3.5
-3.0
-2.5
-2.0
-1.5
-1.0
-0.5
0.0
0.5
1.0
1.5
2.0
2.5
3.0
3.5
4.0GDP GNP
0
2008 2009 2010 2011 2012 2013 2014(FORECASTED
TOTAL)
Ireland’s GDP experienced positive growth during Q2 and Q3 2013, GNP also improved in Q3 2013. In 2014, GDP is forecasted to increase by a further 2.2%.

9
Exports – Improvements are evident, driven by Higher Food and Chemical Exports
-1.1
-3.8
6.2
5.0
2.9
2.2
4.24.5
2008 2009 2010 2011 2012 2013 2014 (f) 2015 (f)
% Annual Growth
Source: EY Economic Eye Summer Report (2013)/Bord Bia Export Performance & Prospects Report (2014)/CSO Goods Exports and Imports (March 2014).
Irelands exports rose by 4% to
€7.031 billion in January 2014 vs. January 2013.
Food +9.8% €2,136million
Chemicals +22.2% €203million
Main Contributors(Jan-March 2014 vs. 2013)

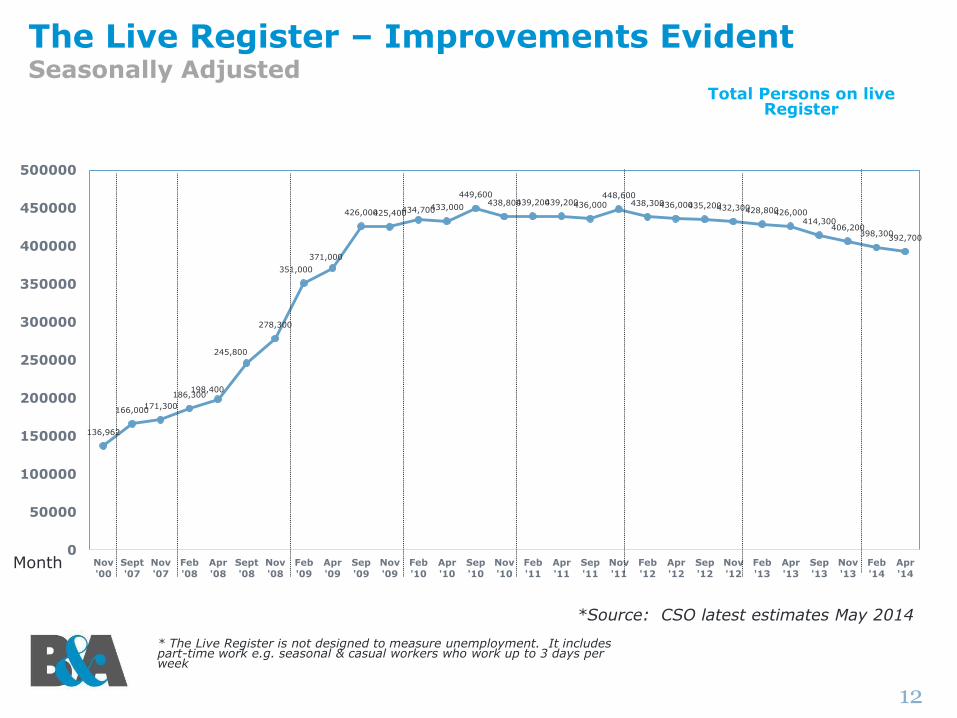
The number of people on the Live Register is the
lowest levelrecorded since April 2009.
Source: CSO latest Estimates (April 2014)

11Source: CSO Estimates as of 15th May 2014
-7.8%Overall Change vs. April 2013.
-2.3%vs. April 2013
-9.6%vs. April 2013
11.7%Current Rate of unemployment.
149,018 239,541
The Live Register
1213.8 14.6 14.7
13.611.7
0
5
10
15
20
2009 2010 2011 2012 2013 Apr '14
% Rate of Unemployment
The Live Register and Unemployment Figures
Unemployment in Ireland
-22.5% vs. peak in 2012 of 15.1%
12
The Live Register – Improvements EvidentSeasonally Adjusted
* The Live Register is not designed to measure unemployment. It includes part-time work e.g. seasonal & casual workers who work up to 3 days per week
*Source: CSO latest estimates May 2014
136,962
166,000171,300
186,300198,400
245,800
278,300
351,000
371,000
426,000425,400434,700433,000
449,600438,800439,200439,200436,000
448,600438,300436,000435,200432,300428,800426,000
414,300406,200
398,300392,700
0
50000
100000
150000
200000
250000
300000
350000
400000
450000
500000
Nov
'00
Sept
'07
Nov
'07
Feb
'08
Apr
'08
Sept
'08
Nov
'08
Feb
'09
Apr
'09
Sep
'09
Nov
'09
Feb
'10
Apr
'10
Sep
'10
Nov
'10
Feb
'11
Apr
'11
Sep
'11
Nov
'11
Feb
'12
Apr
'12
Sep
'12
Nov
'12
Feb
'13
Apr
'13
Sep
'13
Nov
'13
Feb
'14
Apr
'14
Total Persons on live Register
Month

13
A Somewhat Brighter Picture…
Source: Central Bank Quarterly Bulletin (April 2014)/ ESRI Quarterly Report (April 2014)/2013/EY Economic Eye Summer Report (2013)/B&A Consumer Confidence Index (April 2014).
Inflation edged up 0.3% in April 2014.
Employment is expected to increase by 2% in 2014.
GDP expected to grow by 2.2% and 2.6% in 2014 and 2015
respectively.
Disposable income is slowly increasing (+2% this Qtr. vs. last).
Unemployment rate set to decrease to 10.9% this year, and 10.4% in
2015.
Almost 1 in 3 adults agree that the country is better of now than it was
a year ago.

1414
Consumer ConfidenceFindings

15
-88-93 -91
-86-81
-50
-82
-86
-72 -59
-69-64
-56 -57-62
-51 -53
-46
-27-31
-7
0
-74 -76
-65
-58-54
-20
-74-70
-58
-45
-64
-52
-44-50
-60
-39-44
-36
-18
-25
-4
6
-100
-90
-80
-70
-60
-50
-40
-30
-20
-10
0
10
Mar May Sept Nov Mar July Nov Jan Apr July Nov Mar May Sept Nov Feb Apr July Sept Dec Feb Apr
Looking Back
Looking Forward
The Future Looks Bright: Ireland Returns to Positive Territory for the First Time Since 2009
Balance +/-
2009 2010 2011 2012
Source: B&A Consumer Confidence Report
2013
Q.1 Thinking about the economy as a whole, do you think that the country is better off, worse off, or about the same as last year?
Q.2 And what about the coming year, do you think that the country will be better off, worse off or about the same as this year?
Dublin +16Outside +3
2014

19
The Economy:Looking Forward

20
The Economy: Looking Forward – We have finally entered positive territory, at least at a Macro LevelBase: All Adults 18+
Q.2 And what about the coming year, do you think that the country will be better off, worse off or about the same as this year?
26%
42%
32%
Dublin: +16
OutsideDublin: +3
2006 2007 2008 2009 2010 2011 2012 2013 Feb ‘14 Apr ’14
Gap = -15 -59 -68 -49 -58 -52 -32 -5 +6
Better of
The same
Worse of
April 2014
For the first time ever, consumers
feel that the economy will be better of next year vs. this year. This
opinion applies to those living in both Dublin and outside Dublin (albeit outside lags Dublin).

21
The Economy: Looking Forward – We have finally entered positive territory, at least at a Macro LevelBase: All Adults 18+
Q.2 And what about the coming year, do you think that the country will be better off, worse off or about the same as this year?
0
-15
-59
-68
-49
-58
-52
-32
-5
6
2006 2007 2008 2009 2010 2011 2012 2013 Feb '14 Apr '14
Consumers are more positive about the future of the Irish Economy now than they have been in the history of this study.

24
Economy – Looking Forward Trended x Region Base: All adults 18+
-44
-61
-42
-32-30
-4
-20
7
16
-52
-60
-38
-48
-39
-23
-36
-9
3
-70
-65
-60
-55
-50
-45
-40
-35
-30
-25
-20
-15
-10
-5
0
5
10
15
20
Sep 12 Nov 12 Feb-13 Apr-13 Jul-13 Sep-13 Nov-13 Feb-14 Apr-14
Dublin
Outside Dublin
Q.1 Thinking about the economy as a whole, do you think that the country is better off, worse off, or about the same as last year?
Balance +/-
2012 2013
The gap between Dublin and outside still
exists, however both registered a dramatic increase in confidence this
wave. Outside Dublin has finally
left negative territory.
2014

25
Balance Of Opinion - Economy
Balance +/-
YEARLY AVERAGES 2012
Long Term Short Term
2013
When viewed longitudinally a pattern of consistent improvement has been noted over the past three years.
2014
-40
-59
-13
38
-6
-64
-89
-71 -71
-59
-42
-64
-56 -57-62
-51-55
-46
-27-31
-70
-36
-50
-17
-2 0
-15
-59
-68
-49
-58-52
-32
-52
-44-50
-60
-39-44
-36
-18-25
-4
6
-100
-90
-80
-70
-60
-50
-40
-30
-20
-10
0
10
2002 2003 2004 2005 2006 2007 2008 2009 2010 2011 2012 2013 Mar May Sept Nov Feb Apr July Sept Dec Feb Apr
Looking Back
Looking Forward

26
Personal Finances
31
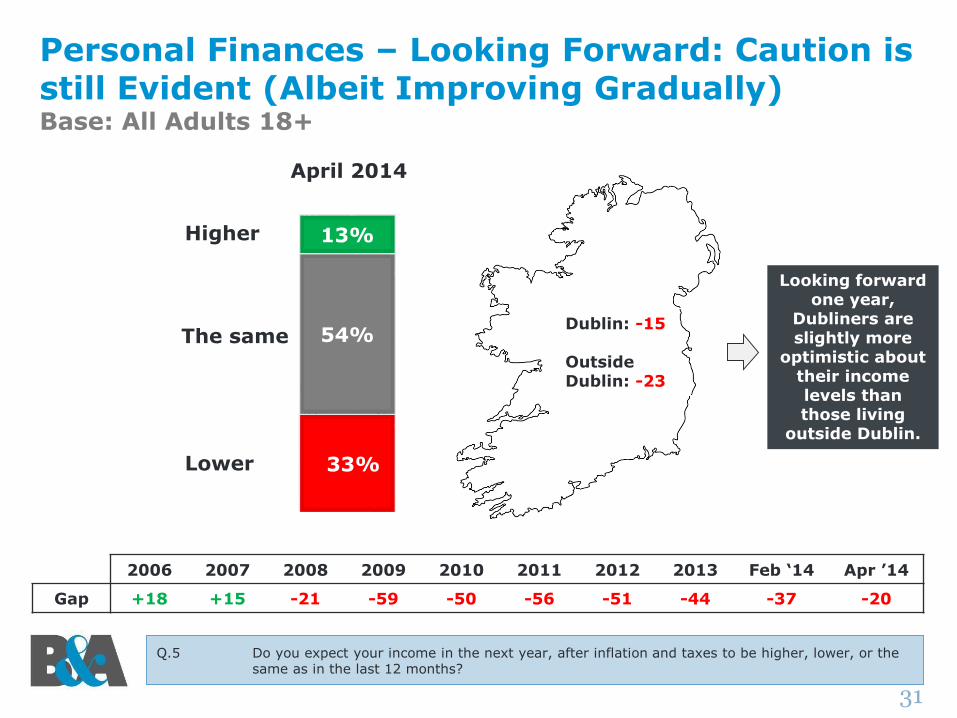
Personal Finances – Looking Forward: Caution is still Evident (Albeit Improving Gradually)Base: All Adults 18+
Q.5 Do you expect your income in the next year, after inflation and taxes to be higher, lower, or the same as in the last 12 months?
33%
54%
13%
Dublin: -15
OutsideDublin: -23
2006 2007 2008 2009 2010 2011 2012 2013 Feb ‘14 Apr ’14
Gap +18 +15 -21 -59 -50 -56 -51 -44 -37 -20
Higher
The same
Lower
April 2014
Looking forward one year,
Dubliners are slightly more
optimistic about their income levels than those living
outside Dublin.

32
Price Increases Across Some Sectors Perhaps Contributing to Increased Caution
Source: Consumer Price Index (April 2014)
+4.5%
+3.7%+3.2%
+2.0%
-3.7%
-2.1%
Education Alcohol and
Tobacco
Misc. goods and
services
Restaurants and
hotels
Clothing and
footwear
Food and non-
alcoholic
beverages
Grew primarily due to higher health and motor insurance premiums and the increased costs associated with the local property tax
Increased due to higher prices for alcohol sold in off licences and supermarkets and higher tobacco prices.
Fell due to clothing and footwear sales.
Decreased due to lower prices across a range of products such as vegetables, bread and cereals, and meat.
Increased largely due to higher prices for alcoholic drinks and food consumed in licensed premises, restaurants, cafes, and canteens.
April 2014 vs. April 2013

33
24% 27%
17%13% 12% 13%
34%
64%57%
63%59%
51%58% 56% 59% 59%
55%60%
53%
44% 44% 45%
33%
54% 54%
58%58%
58% 59%
52%
30%
35%31%
34%
41%35% 37% 34% 34%
38%34%
41%
46% 47% 46%
54%
22% 22%25% 25%
30% 28%
13%5% 7% 7% 7% 8% 8% 7% 7% 7% 7% 6% 6%
10% 9% 9%13%
Q.5 Do you expect your income in the next year, after inflation and taxes,
to be higher, lower or the same as in the last twelve months?
Personal Finances – Looking Forward
Higher
The same
Lower
Expect it to be …
Gap -2 -8 +8 +16 +18 +15 -21 -59 -50 -56 -51 -44 -50 -49 -52 -52 -48 -54 -47 -34 -35 -37 -20
The gap is decreasing each year and has returned to match that of 2008 (hence, improvements are being made).
LONG TERM 2012 2013
2002 2003 2004 2005 2006 2007 2008 2009 2010 2011 2012 2013 Mar May Sept Nov Feb April July Sept Dec Feb Apr
2014

35
Personal Finances - Looking Forward x Region Base: All adults 18+
-43
-54 -54
-48
-53
-39
-27
-40
-15
-55-55
-45
-56
-44
-33
-39
-35
-23
-70
-65
-60
-55
-50
-45
-40
-35
-30
-25
-20
-15
-10
-5
0
5
10
Sep 12 Nov 12 Feb-13 Apr-13 Jul-13 Sep-13 Dec-13 Feb-14 Apr-14
Dublin
Outside Dublin
Q.5 Do you expect your income in the next year, after inflation and taxes,
to be higher, lower or the same as in the last twelve months?
Balance +/-
Those living outside Dublin feel marginally more positive
about their personal
finances for the year ahead.
2012 2013 2014

36
Balance Of Opinion - Personal Finances
Balance +/-
-23
-34
-11
14 4
-35
-63-58
-61-57
-47
-61-56
-52
-59
-52-55
-47
-38-44
-36
-21
-2-8
8
16 1815
-21
-59
-50-56
-51
-44-50 -49
-52 -52-48
-54
-47
-34-35
-37
-21
-75
-65
-55
-45
-35
-25
-15
-5
5
15
2002 2003 2004 2005 2006 2007 2008 2009 2010 2011 2012 2013 Mar May Sept Nov Feb Apr July Sept Dec Feb Apr
Looking Back
Looking Forward
Long Term Short Term
Gains being made over time. However we are still in negative territory.
YEARLY AVERAGES 2012 2013 2014

37
Savings

38
Saving Levels– Looking ForwardBase: All Adults 18+
Q.8 Do you expect to save more, less or the same amount in the year ahead compared with the last twelve months?
33%
57%
10%
Dublin: -10
OutsideDublin: -27
2006 2007 2008 2009 2010 2011 2012 2013 Feb ‘14 Apr ’14
Gap -1 -5 -34 -56 -48 -50 -48 -40 -33 -23
Higher
The same
Lower
April 2014
Dubliners are slightly more
likely to save in the year ahead vs.
those living outside Dublin. Both, however,
remain in negative territory.
41
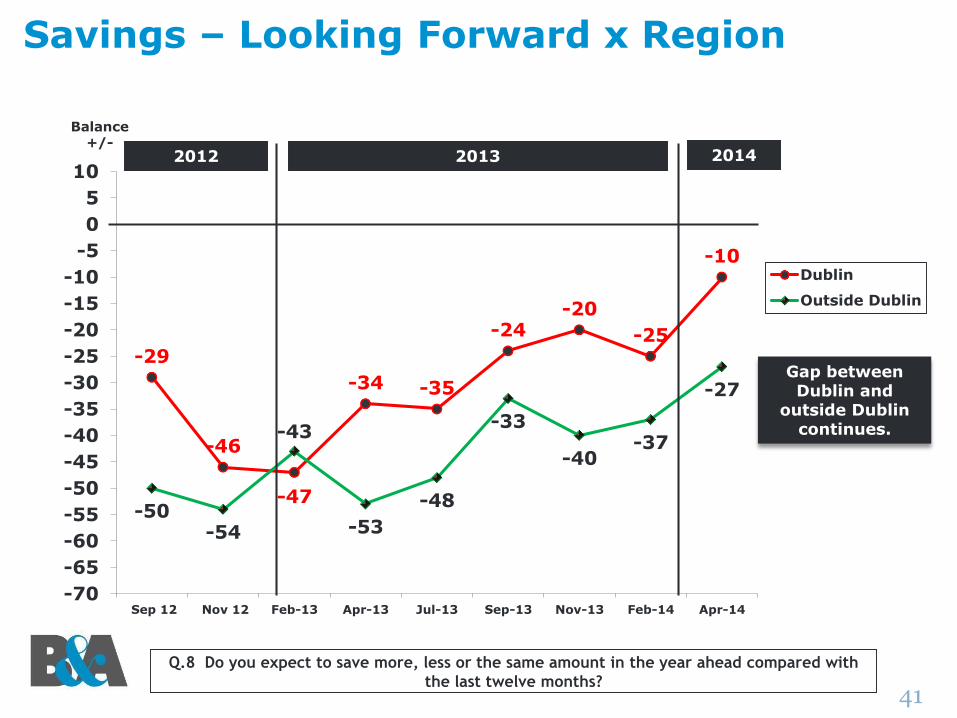
Q.8 Do you expect to save more, less or the same amount in the year ahead compared with
the last twelve months?
Savings – Looking Forward x Region
-29
-46
-47
-34 -35
-24-20
-25
-10
-50-54
-43
-53
-48
-33
-40-37
-27
-70
-65
-60
-55
-50
-45
-40
-35
-30
-25
-20
-15
-10
-5
0
5
10
Sep 12 Nov 12 Feb-13 Apr-13 Jul-13 Sep-13 Nov-13 Feb-14 Apr-14
Dublin
Outside Dublin
Balance +/-
Gap between Dublin and
outside Dublin continues.
2012 2013 2014

42
Personal Assets

43
Personal Assets: Looking ForwardBase: All Adults 18+
Q.6 Do you expect your assets (your house, shares, pension entitlements, savings) in the next year to be higher, lower or the same as in the past year?
16%
69%
15%
Dublin: +6
OutsideDublin: -3
2006 2007 2008 2009 2010 2011 2012 2013 Feb ‘14 Apr ’14
Gap +33 +20 -25 -53 -43 -41 -31 -18 -8 -1
Higher
The same
Lower
April 2014
Those living in Dublin feel
slightly more optimistic about their
personal assets looking
ahead vs. those outside
Dublin.

46
Q.6 Do you expect your assets (your house, shares, pension entitlements, savings)
In the next year to be higher, lower or the same as in the past year?
Personal Assets– Looking Forward x RegionExpect them to be …
-25 -29
-18-21
-12-9
+20 +6
-34 -33
-22
-32
-23
-11 -13-11
-4
-70
-65
-60
-55
-50
-45
-40
-35
-30
-25
-20
-15
-10
-5
0
5
10
Sep 12 Nov 12 Feb-13 Apr-13 Jul-13 Sep-13 Dec-13 Feb-14 Apr-14
Dublin
Outside Dublin
Balance +/-
Dublin has returned to
positive territory this wave, whilst
outside Dublin remains in
negative territory (albeit improving).
2012 2013 2014

47
Purchasing Goods and Services

48
Purchasing Goods and Services – Looking Forward: Improvements are EvidentBase: All Adults 18+
Q.7 In the year ahead, do you expect to purchase more, less or the same amount of goods and services as in the past year?
26%
64%
10%
Dublin: -9
OutsideDublin: -19
2006 2007 2008 2009 2010 2011 2012 2013 Feb ‘14 Apr ’14
Gap +7 +5 -29 -63 -47 -52 -45 -37 -30 -16
More
The same
Less
April 2014
Dubliners feel slightly more
confident about spending in the coming year vs.
those living outside Dublin
(albeit they remain in negative
territory).

51
Q.7 In the year ahead, do you expect to purchase more, less or the same amount of goods and services as in the past year?
Purchasing Goods And Services – Looking Forward x RegionExpect to purchase …
-41
-46
-48
-31-34
-21 -24
-33
-9
-45
-50
-42
-47
-42
-32 -31
-28
-19
-70
-65
-60
-55
-50
-45
-40
-35
-30
-25
-20
-15
-10
-5
0
5
10
Sep 12 Nov 12 Feb-13 Apr-13 Jul-13 Sep-13 Dec-13 Feb-14 Apr-14
Dublin
Outside Dublin
Balance +/-
2012 2013 2014

52
69
21
31 33
20
-25
-53
-43-41
-31
-18
-39
-28-31 -33
-21
-29
-20
-10 -9 -8
-1
-10 -12 -12
47 5
-29
-63
-47-52
-45
-37
-46
-40-44
-48-43 -43
-40
-29 -29 -30
-16
-23-28
-8-5
-1-5
-34
-56
-48 -50 -48
-40
-51
-42-45
-52
-44-48
-44
-31-34 -33
-23
-70
-60
-50
-40
-30
-20
-10
0
10
20
30
40
2002 2003 2004 2005 2006 2007 2008 2009 2010 2011 2012 2013 Mar May Sept Nov Feb Apr July Sept Dec Feb Apr
Assets Value
Purchase
Savings
Balance Of Opinion in Summary – The Year AheadExpectations in regard to assets value, purchases, and savings
Balance +/-
Long Term Short Term
Improvements are noted and momentum is slowly improving. However, any further imposition that directly affects real incomes of consumers will impact this area negatively.
Growth in personal financial situations continues to be finely balanced.
YEARLY AVERAGES 2012 2013 2014

Disposable Income

54
€50.94
€61.29
€83.97
€62.32
€46.86€43.57
€47.08 €47.23€51.06
€43.66 €42.97 €43.85
2001 2004 2008 2010 2012 Feb
'13
Apr
'13
Jul '13 Sept
'13
Dec
'13
Feb
'14
Apr
'14
Discretionary Income Has Halved in 5 Years but decline appears to have abatedBase: All adults 18+
Q. About how much would you say you spend each week on things you buy for yourself including money spent on clothes, eating out, going for a drink, going to the cinema, gambling, sporting activities and so on?
LONG TERM SHORT TERM
Dublin €50.23Outside Dublin €41.33 ABC1 €51.78C2DE €38.47
