b2-semouliers-t2+ht2 reduction and occurence in durum wheat
TRANSCRIPT

CNR, Institute of Sciences of Food Production (ISPA) - Bari, Italy
Occurrence of T-2/HT-2 toxins in durum wheat and pasta
Fate of T-2/HT-2 toxins during durum wheat processing
SECTION B: Presence of T-2 and HT-2 toxin in cereals and cereal products
Seventh Fusarium Forum 2010 ● 1st-2nd February 2010

The European semolina industry in a few figuresThe European semolina industry in a few figuresThe European semolina industry implies:
231 production units:162 production units in Italy;16 production units in Greece;8 production units in Spain;7 production units in France;5 production units in Germany.
7,300,000 tons of durum wheat transformed:5,100,000 t in Italy;675,000 t in France;550,000 t in Spain.
4,850,000 tons of durum wheat semolina produced.
Union of Associations of Semolina Producersof the EU Countries
The Union of Associations of Semolina Producers of the EU countries has the purpose of ensuring the representation and promotion of the interests of the semolina industry of the European Union at European and International levels.

With an annual production, calculated on the basis of the last ten years, of approximately 35 Mt, durum wheat represents, at world level, only a «secondary» cereal, as regards quantity.
In the EU, and limited to the years subsequent to the Reform of the CAP Agenda 2000, this production has amounted to between 7.1 and 11.1 Mt, for an average annual production of 8.4 Mt.
- An extremely localised world productionAn extremely localised world productionThe Mediterranean basin and the North American continent alone represent almost 80% of the world production of durum wheat;
-- A quantitatively fluctuating world productionA quantitatively fluctuating world productionThe agronomic situation and the particular climatic conditions of the areas producing durum wheat lead to an extreme variability in production which may take the form, year by year, of quantitative fluctuations in the order of 35%.
Durum Wheat: a rare and precious cerealDurum Wheat: a rare and precious cereal

Production (Mt) Imports (Mt) import/production (%)
2000 8.8 0.9 10.2%2001 7.3 1.5 20.6%2002 9.2 0.6 6.5%2003 7.9 2.0 25.3%2004 11.1 1.6 14.4%2005 7.1 1.6 22.5%2006 7.8 1.6 20.5%2007 7.1 1.9 26.7%2008 9.9 1.4 14.1%2009 (estimates) 7.9 1.7 21.5.%
Quantity of durum wheat transformed 7,300,000 tProduction of semolina 4,850,000 t
The production of Durum Wheat in the EUThe production of Durum Wheat in the EUThe EU production of durum wheat is not able to cover the quantitative requirements, but neither the qualitative requirements, of the semolina industry of the EU.

Intake estimates indicate that the presence of T-2 and HT-2 toxin can be of concern for public health. Therefore, the development of a reliable and sensitive method, collection of more occurrence data and more investigations/research in the factors involved in the presence of T-2 and HT-2 toxin in cereals and cereal products, in particular in oats and oat products, is necessary and of high priority.
COMMISSION REGULATION (EC) No 1881/2006COMMISSION REGULATION (EC) No 1881/2006setting maximum levels for certain contaminants in foodstuffssetting maximum levels for certain contaminants in foodstuffs
TT--2 and HT2 and HT--2 toxins2 toxinsProvisional Maximum Tolerable Daily IntakeProvisional Maximum Tolerable Daily Intake
PMTDI = 60 PMTDI = 60 ngng / kg body weight / day/ kg body weight / dayLOEL (lowestLOEL (lowest--observed effect level) = 29 observed effect level) = 29 µµg/kg of body weight per day (pigs) g/kg of body weight per day (pigs) -- Safety factor = 500Safety factor = 500

Fate of T2/HT2 toxins during Fate of T2/HT2 toxins during durum wheat processingdurum wheat processing
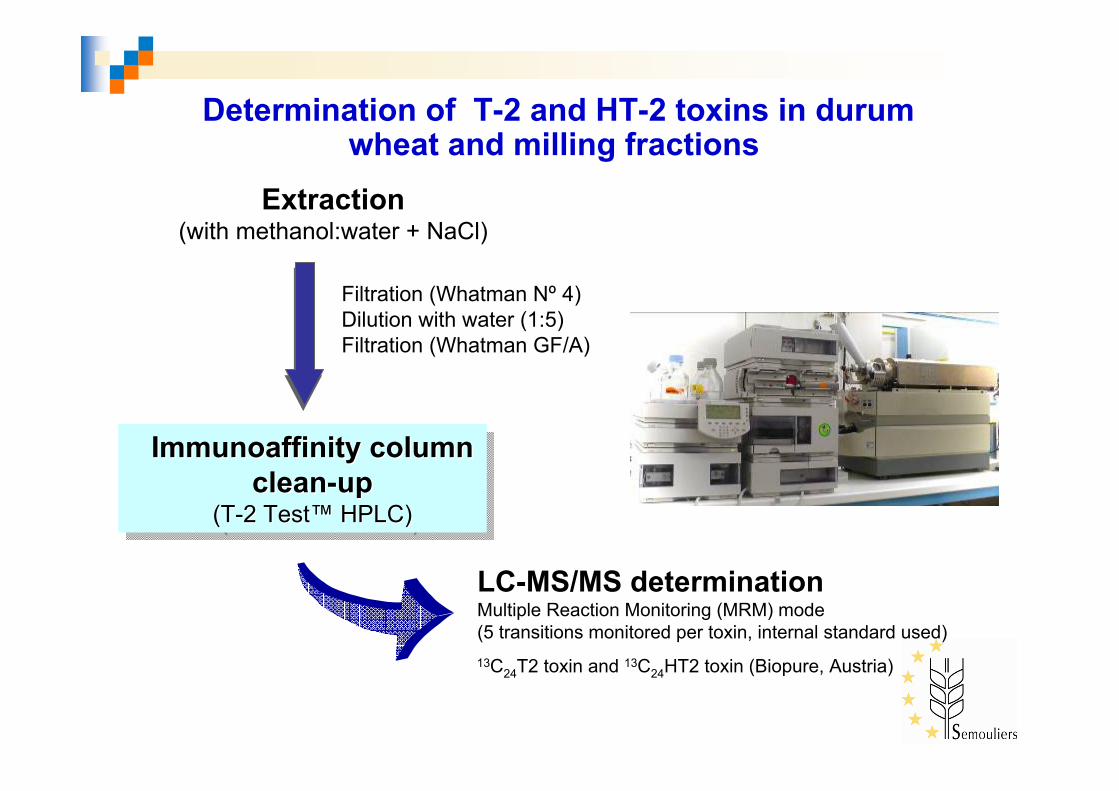
Determination of T-2 and HT-2 toxins in durumwheat and milling fractions
LC-MS/MS determinationMultiple Reaction Monitoring (MRM) mode (5 transitions monitored per toxin, internal standard used)
Immunoaffinity columnclean-up
(T-2 Test™ HPLC)
ImmunoaffinityImmunoaffinity columncolumncleanclean--upup
(T(T--2 2 TestTest™™ HPLC)HPLC)
Extraction(with methanol:water + NaCl)
Filtration (Whatman Nº 4)Dilution with water (1:5)Filtration (Whatman GF/A)
13C24T2 toxin and 13C24HT2 toxin (Biopure, Austria)

RecoveriesRecoveries andand LimitLimit of of detectionsdetections (LOD)(LOD)
0.70.5101 (5)102 (3)semolina
0.20.1102 (2)101 (10)pasta
0.70.5107 (2)104 (3) wheat kernels
1.40.991 (7)103 (14)red dog
0.90.692 (9)90 (5)bran
1.71.585 (6)98 (3)screenings
1.50.985 (5)92 (5)fine middlings
HT-2T-2HT-2T-2
Millingfraction
LOD(ng/g)
Recovery (CV)*(%)
*spiking levels: 100 ng/g T-2 and 100 ng/g HT-2 (n= 3)

Field trials:Field trials: 2007-2008 and 2008-2009 growing seasons (Northern and Southern Italy).
Fungal Fungal inoculuminoculum:: Fusarium sporotrichioides (ITEM 707)(ITEM 707) from the collection of the CNR-ISPA (www.ispa.cnr.it/Collection).
Wheat variety:Wheat variety: Levante (Triticum durum Desf.).
Experimental design:Experimental design: rrandomised blocks with 4 replicate plots per trial (plot area 20 m2). Treatments with three different fungicides (prochloraz, tebuconazole, prothioconazole), one Fusarium inoculated control and one non-inoculated control.
Fungicide treatments:Fungicide treatments: wwithin 24 hours before fungal inoculation(beginning of anthesis, BBCH 61).
Durum wheat samples originDurum wheat samples originInoculated test plotsInoculated test plots

100 100 -- 235 235 -- 450 450 -- 590590
Harvest 2008 Harvest 2008 –– 4 level of contamination: 4 level of contamination:
Harvest 2009Harvest 2009 –– 7 level of contamination: 7 level of contamination:
TT--2+HT2+HT--2 2 ((ng/gng/g))
TT--2+HT2+HT--2 2 ((ng/gng/g)) 221 221 -- 507 507 -- 640 640 -- 720 720 -- 1160 1160 1440 1440 -- 59545954
ProcessedProcessed samplessamplesUncleanedUncleaned durumdurum wheatwheat
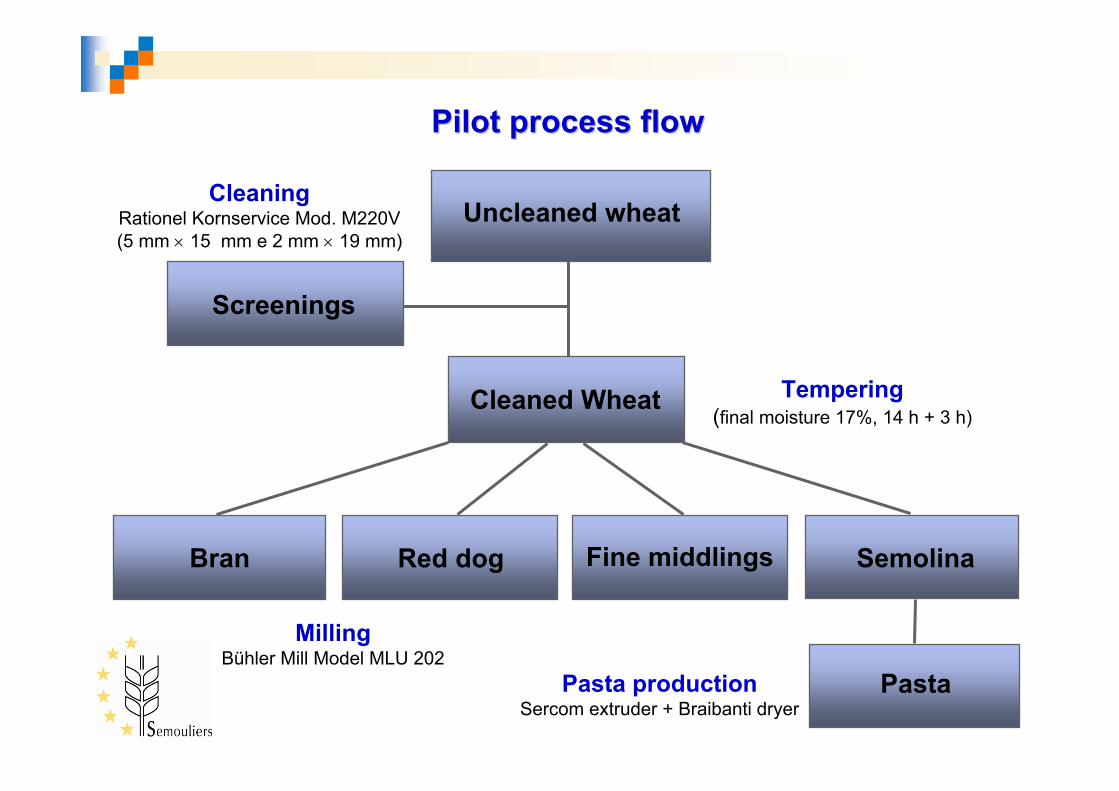
Pilot Pilot processprocess flowflow
Uncleaned wheat
Screenings
Cleaned Wheat
Bran Semolina
Pasta
MillingBühler Mill Model MLU 202
Tempering(final moisture 17%, 14 h + 3 h)
CleaningRationel Kornservice Mod. M220V(5 mm × 15 mm e 2 mm × 19 mm)
Red dog Fine middlings
Pasta productionSercom extruder + Braibanti dryer

LevelsLevels of Tof T--2 + HT2 + HT--2 in 2 in durumdurum wheatwheat millingmilling fractions*fractions*
* mean ± SD (n = 4)
0
50
100
150
200
250
300
350
400
Uncleanedwheat
Cleanedwheat
Bran Red dog Finemiddlings
Semolina Pasta
T-2
+ H
T-2
(n
g/
g)
HT-2
T-2
TT--2 + HT2 + HT--2 = 221 2 = 221 ±± 10 ng/g10 ng/g
221
23
46
245
68
317
Screenings834 ± 80 ng/gScreenings
834 ± 80 ng/g
2

LevelsLevels of Tof T--2 + HT2 + HT--2 in 2 in durumdurum wheatwheat millingmilling fractions*fractions*
0
200
400
600
800
1000
1200
Uncleanedwheat
Cleanedwheat
Bran Red dog Finemiddlings
Semolina Pasta
T-2
+ H
T-2
(n
g/
g)
HT-2
T-2
TT--2 + HT2 + HT--2 = 507 2 = 507 ±± 29 ng/g29 ng/g
Screenings921 ± 67 ng/gScreenings
921 ± 67 ng/g
from inoculated test plots* mean ± SD (n = 4)
507
58124
703
153
909
5

100
1
295
48
134
2212
0
50
100
150
200
250
300
350
400
450
Uncleanedwheat
Cleanedwheat
Bran Red dog Finemiddlings
Semolina Pasta
T-2
+ H
T-2
(%
) Screenings = 597% Screenings = 597%
DistributionDistribution of Tof T--2 + HT2 + HT--2 (%) in 2 (%) in millingmilling fractions*fractions*
* mean ± SD (n = 11) from processing of durum wheat contaminated with T-2 + HT2 in the range 97-5954 ng/g (four replicated experiments)

DistributionDistribution of Tof T--2 (%) in 2 (%) in millingmilling fractions*fractions*
100
1
41
160
138
24
12
0
50
100
150
200
250
Uncleanedwheat
Cleanedwheat
Bran Red dog Finemiddlings
Semolina Pasta
T-2
(%
)Screenings = 868% Screenings = 868%
* mean ± SD (n = 11) from processing of durum wheat contaminated with T-2 in therange 35-785 ng/g (four replicated experiments)

100
1
345
49
126
2212
0
100
200
300
400
500
600
Uncleanedwheat
Cleanedwheat
Bran Red dog Finemiddlings
Semolina Pasta
HT
-2 (
%)
Screenings = 560% Screenings = 560%
DistributionDistribution of HTof HT--2 (%) in 2 (%) in millingmilling fractions*fractions*
* mean ± SD (n = 11) from processing of durum wheat contaminated with HT-2 in therange 62-5169 ng/g (four replicated experiments)

An important level of T-2 + HT-2 reductionreduction occurs during the different steps of durum wheat processing relative to the uncleaned wheat:
52% in cleaned wheat88% in semolina99% in pasta
T-2 and HT-2 increaseincrease significantly in the screening and bran fractions relatively to uncleaned wheat:
~ 600% in screenings~ 300% in bran
CONCLUSIONSCONCLUSIONS

OccurrenceOccurrence of Tof T--2/HT2/HT--2 2 toxinstoxins in in durumdurum wheatwheat and pastaand pasta

DeterminationDetermination ofof TT--2 2 andand HTHT--2 2 toxinstoxins in in wheatwheat andand pastapasta
Pre-column derivatization with 1-ANHPLC/FD HPLC/FD determinationdetermination
Immunoaffinity columnclean-up
(T-2 Test™ HPLC)
Immunoaffinity columnclean-up
(T-2 Test™ HPLC)
Extraction(with methanol:water + NaCl)
Filtration (Whatman Nº 4)Dilution with water (1:5)Filtration (Whatman GF/A)
Visconti et al. (2005), J. Chromatography A, 1075, 151-158
λex. = 381 nmλem. = 470 nm

Performances of the analytical method for the determination of T-2 and HT-2 toxins in cereals
Detection limit (signal/noise = 3:1)
Range of applicability
Recovery (spiking range 25-500 ng/g)
Relative Standard Deviation
Antibody cross-reactivity
Applicability
5 ng/g (T-2)3 ng/g (HT-2)
0.01-1.4 µg/g
>80%
< 8%
100% (T-2 and HT-2)
wheat (pasta), corn, barley
Visconti et al., 2005

53Min (ng/g)
54 (59%)81 (60%)Number of positive samples
108122Max (ng/g)
24,827,3Media (ng/g)
of which:
92136Number of analyzed samples
38 (41%)55 (40%)Number of samples < LOD (<3 ng/g)
20092008T-2 + HT-2*
2008 = North (51), Center (46), South (39)2009 = North (34); Center (39), South (19)
* HPLC/FD determination
OccurrenceOccurrence of Tof T--2 + HT2 + HT--2 2 toxinstoxins in in durumdurum wheatwheat in Italyin ItalySamples collected at storage facilities through official sampling procedure (Reg. EC. 401/2006)

27,343%
118%
6649%
5540%1362008
2009
Crop
24,811%
33%
5055%
3841%92
Mean of positives
(ng/g)> 100ng/g
51-100ng/g
3-50ng/g
< 3*ng/g
Samples distribution (n)Analyzedsamples
(n)
* LOD: T-2 = 5 ng/g; HT-2 = 3 ng/g
OccurrenceOccurrence of Tof T--2 + HT2 + HT--2 2 toxinstoxins in in durumdurum wheatwheat in Italyin Italy

** LOD (LC/FD): T-2 3 ng/g; HT-2 5 ng/g* LOD (LC/MS-MS): T-2 0.5 ng/g; HT-2 0.7 ng/g
32
16
8
13
30
50
56
15 EP
5S
GR 412
45 EP
GR 415
13 EP
16 EP
22
12 EP
Sample
24341012
961062048
< LOD1< LOD< LOD
< LOD5< LOD2
50581317
801241641
77108610
58561516
5344< LOD4
4331< LOD4
< LOD6< LOD1
2515< LOD1
104871821
97801419
951361636
483498
HPLC/FD**LC/MS-MS*HPLC/FD**LC/MS-MS*
HT-2 (ng/g)T-2 (ng/g)
Confirmation by LC-MS/MS(20% analyzed durum wheat samples)

2008 2009Analyzed samples : 26- 26 “semolina” pasta
OccurrenceOccurrence of Tof T--2+HT2+HT--2 2 toxinstoxins in pastain pasta
- 5 “mix cereals” pasta- 13 “whole wheat” pasta- 88 “semolina” pasta
Analyzed samples: 106
All samples <LOD(<3 ng/g T-2; <5 ng/g HT-2)

CONCLUSIONSCONCLUSIONS
• T-2 + HT-2 presence was found in Italian durum wheat production;
• T-2 + HT-2 content in durum wheat is quite low: more than 90% of positive samples are not detectable or lower than 50 ng/gr (mean about 25 ng/gr)
• No presence of T-2 + HT-2 has been found in commercial pasta: T-2 + HT-2 <LOD for all the 132 samples analyzed.

RecommendationsRecommendations
• Due to the low presence of T-2 + HT-2 mycotoxins in commercial durum wheat and very high reduction rate occurring during cleaning and milling process, maximum limits for these mycotoxins on durum wheat does not appear necessary;
• Moreover the further reduction recorded during pasta process and the absence of T-2+ HT-2 in commercial pasta samples suggest that this product do not contribute to consumer exposure and therefore no limits are need on this product.

AcknowledgmentsAcknowledgments
RanieriRanieri R. R. SilvestriSilvestri M.M.Arlotti G.Arlotti G.Atallah M.Atallah M.
Della Ghezza I. Della Ghezza I.
Pascale M. Pascale M. Haidukowski M. Haidukowski M.
LattanzioLattanzio VVSchenaSchena R. R.
PanzariniPanzarini G.G.LippolisLippolis V.V.Visconti A. Visconti A.
CNR, Institute of Sciences of Food Production (ISPA)
Bari, ItalyBarilla G.&R. F.lli S.p.A.
Parma Italy
SECTION B: Presence of T-2 and HT-2 toxin in cereals and cereal products
Seventh Fusarium Forum 2010 ● 1st-2nd February 2010