b-4: reducing peak demand through distributed grid...
TRANSCRIPT

B-4: Reducing Peak Demand throughDistributed Grid Edge Control
Shane SmithUDWI
Bloomfield, [email protected]
Damien TholomierVarentec
Santa Clara, [email protected]

Introduction
Utilities District of Western IndianaREMC (UDWI) A Touchstone Energy
Cooperative, which is a memberof the Hoosier Energy PowerNetwork and the 4th-largestelectric co-op in southernIndiana, serving over 19,000meters in Clay, Daviess, Greene,Knox, Lawrence, Martin, Monroe,Owen, Putnam, Sullivan, andVigo counties for 80 years.
UDWI REMC is part-owner of HoosierEnergy, a Generation andTransmission (G&T) cooperativeproviding wholesale electric powerand services to 18 memberdistribution cooperatives in centraland southern Indiana andsoutheastern Illinois.
Based in Bloomington, Indiana,Hoosier Energy operates coal, naturalgas and renewable energy powerplants and delivers power through a1,500-mile transmission network.
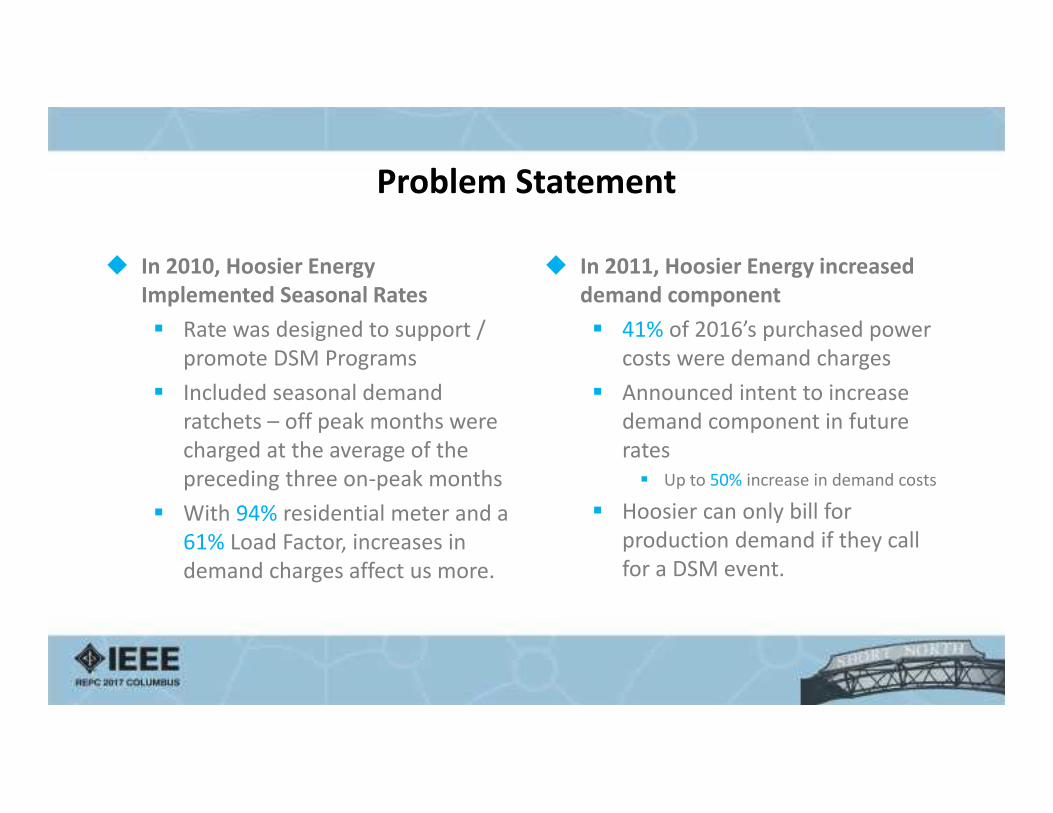
In 2011, Hoosier Energy increaseddemand component 41% of 2016’s purchased power
costs were demand charges Announced intent to increase
demand component in futurerates Up to 50% increase in demand costs
Hoosier can only bill forproduction demand if they callfor a DSM event.
Problem Statement
In 2010, Hoosier EnergyImplemented Seasonal Rates Rate was designed to support /
promote DSM Programs Included seasonal demand
ratchets – off peak months werecharged at the average of thepreceding three on-peak months
With 94% residential meter and a61% Load Factor, increases indemand charges affect us more.

AMI Data confirms Sampling of AMI data showed
frequent ANSI-A Violations Older AMI meters with some
limitations (± 5% voltage accuracy)
DSM programs significantlyunderperforming Net Loss
Existing System could not support 51% of system still copperweld
28% 6A 21% 8A
15% 4ACSR Only 27% “Standard” conductors
(336.4MCM, 1/0ACSR, 2ACSR) Construction Work Plans only a
priority for last 10 years “Line Loss is our CVR”
Traditional CVR Never Considered
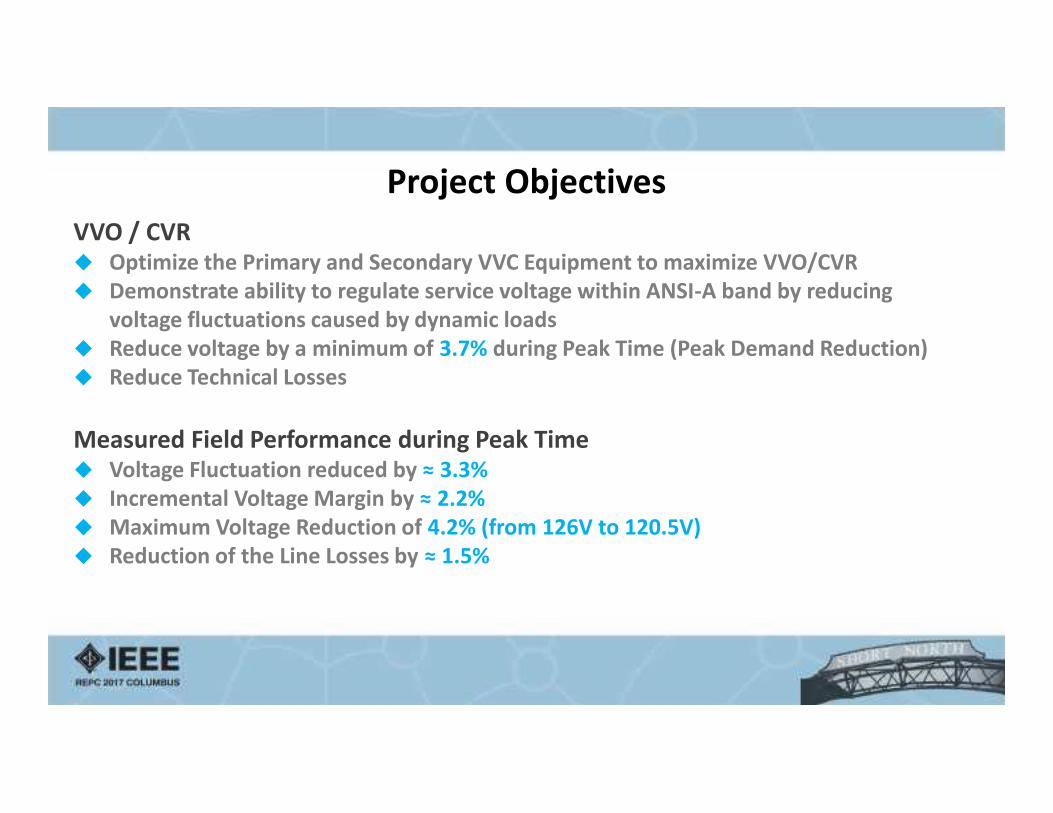
Project ObjectivesVVO / CVR Optimize the Primary and Secondary VVC Equipment to maximize VVO/CVR Demonstrate ability to regulate service voltage within ANSI-A band by reducing
voltage fluctuations caused by dynamic loads Reduce voltage by a minimum of 3.7% during Peak Time (Peak Demand Reduction) Reduce Technical Losses
Measured Field Performance during Peak Time Voltage Fluctuation reduced by ≈ 3.3% Incremental Voltage Margin by ≈ 2.2% Maximum Voltage Reduction of 4.2% (from 126V to 120.5V) Reduction of the Line Losses by ≈ 1.5%

Project Scope• 5.23 MW Peak Load, PF = 0.97• Three Voltage Control Zones (VCZ)
with residential load• One LTC (SP=126 ±1 V) with two
Feeders:– 10101 (1.28 MW)– 10103 (3.95 MW)
• Two LVRs:– Three-phase LVR (SP=126 ± 1 V)– Single-Phase LVR (SP=126 ± 1 V)
• Six Capacitor Banks– Two Fixed, 600 kVars: in service
(CAP868, CAP872)– Two Switched, 600 kVars: out of
service• Feeder length ≈ 11 miles• 558 distribution transformers,• 692 customers
12.47kV Switz City s/s ENGO unit deploymentInitial Deployment - 43 ENGO units• Zone 1 (LTC, 60% load) with 34 units (28 on A, 1 on B
and 3 on C)
• Zone 2 (LVR1, 34% load) with 5 units (3 on B and 2on C)
• Zone 3 (LVR2, 6% load) with 4 units (4 on A)
After Relocation of LVR2 (Toms) - 43 ENGO units• Zone 1 (LTC, 57% load) with 16 units (11 on A, 3 on B
and 2 on C)
• Zone 2 (LVR1, 35% load) with 8 units (4 on B and 4on C)
• Zone 3 (LVR2, 8% load) with 19 units (19 on A)
After the Optimization of Primary and SecondaryVVC equipment - 23 ENGO units• Zone 1 (LTC, 57% load) with 12 units (10 on A and 2
on C)
• Zone 2 (LVR1, 35% load) with 8 units (4 on B and 4on C)
• Zone 3 (LVR2, 8% load) with 3 units (3 on A)
Voltage Control Zone

Conventional VVO/CVR Conventional methods of
achieving peak demandreduction for ruralcooperatives in the range of1%-2.5% control during heavyloaded condition withoutviolating customer-side ANSI-A voltage limits
Measured minimum weightedVoltage Margin at Switz Citys/s during Peak Time ≈ 1.08%
• No margin in Zone 1 (57%load)
• Min 2.96% in Zone 2 (35%load)
• Min 5.08% in Zone 3 (8%Load)
Voltage Margin as pct of MW
5.3MW Peak Load by end ofsummer time and comprisesresidential and irrigation loadsas well as petroleum pumpingstation and storage, a coalloading facility, an asphalt plant,turkey farms, grain drying, and alarge grain processing facility
Switz City PQ Data

Voltage Fluctuation Limits Conventional VVO/CVR

Grid Edge VVC Solution

Secondary Voltage Profile w/o and with ENGOs

Voltage Margin as function of Load (per zone)

Feeder Voltage Flattening (15 min Data)
Min 113.7V
Max 126.8V
ENGO ON ENGO OFF
Min 116.6V
Max 126.3V
Max 121.7 kVAR
Min 120.4V
Max 129.9V
Min 122.2V
Max 126.2V
Max 74.2 kVAR
Min 121.4V
Max 125.6V
Min 122.8V
Max 126.2V
Max 178.3 kVAR
Zone1
Zone1
Zone2
Zone2
Zone3
Zone3
Zone 1 ≈ 57% of Load• Voltage Margin increased from -0.3% to 2.2%
• Voltage fluctuation reduced from 10.9% to8.1%
Zone 2 ≈ 35% of Load• Voltage Margin increased from 5.3% to 6.3%
• Voltage fluctuation reduced from 7.9% to 3.3%
Zone 3 ≈ 8% of Load• Voltage Margin increased from 6.2% to 7.4%
• Voltage fluctuation reduced from 3.5% to 2.8%
All zones• Weighted Voltage Margin increased from 2.0%
to 4.2%
• Voltage fluctuation reduced from 9.3% to 6.0%
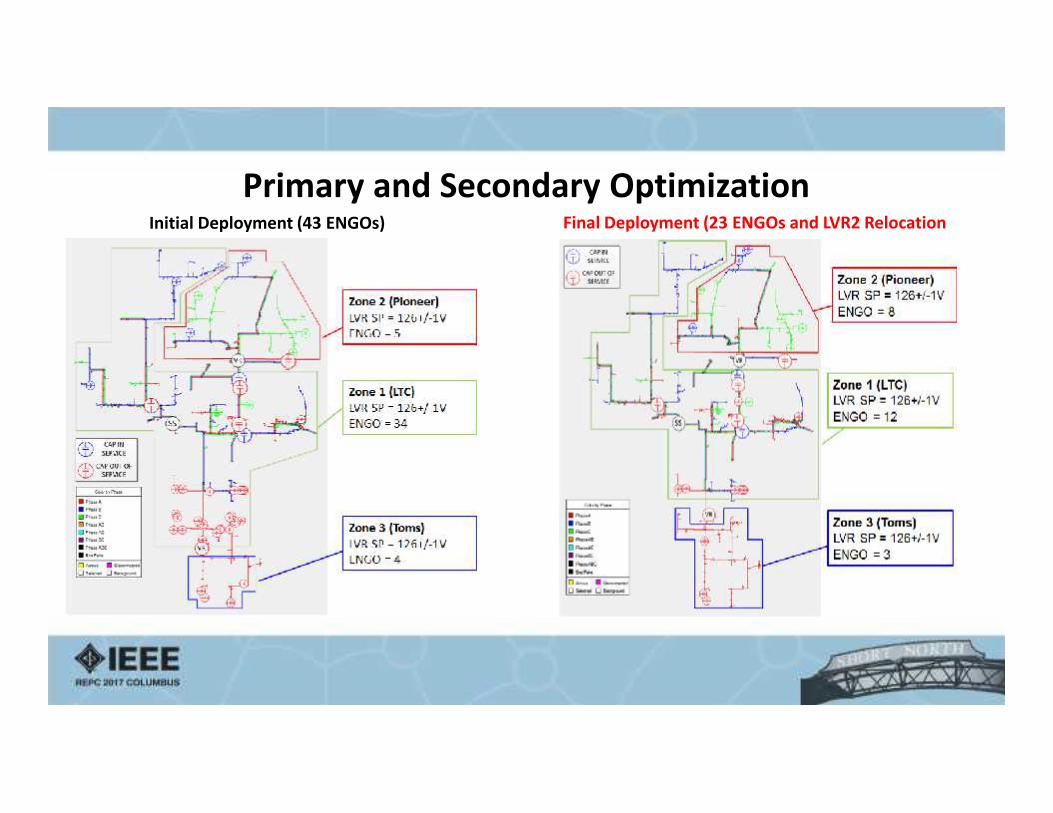
Primary and Secondary OptimizationInitial Deployment (43 ENGOs) Final Deployment (23 ENGOs and LVR2 Relocation

: %∆%∆
The theory of Conservation Voltage Reduction (CVR) resides in the formula for electric power, = The goal for CVR is to reduce demand or energy consumption by reducing voltage, however, the fundamental question to be
answered is, “How much power or Energy will be reduced if % voltage is reduced in a given system?”. Therefore, a metric called-factor is defined. = %∆%∆ = %∆%∆
CVR Factor Theory

CVR Factor ZIP configuration (constant impedance, Z; constant current, I; and constant power, P
elements). CVR factor decreases when the voltage dependence of the load changes from aconstant CVR to a constant power type.
CVR factor will depend on the time of the day/month of the year/mix of load that voltageregulation is enabled.
Example of CVR factor for Power HVAC:
o Cooling mode: CVR varies from 0.57 at 82̊⁰(F), 0.41 at 95⁰(F) and 0.22 at 115⁰(F)
o Heating mode: i.e. CVR = 0.67 at 47⁰(F)
Incandescent bulb: CVR = 1.505
CFL bulbs: CVR = 0.783
LED bulbs: CVR = -0.061
Commercial lights with magnetic ballasts: CVR=1.204
Cooking range Top: CVR = 1.646Source:1) EPRI

CVR Tests performed by Various Utilities
Typical Value:
1.1-1.2
Typical Value:
0.7-0.8

6 CVR Weekly EventsPeak Demand Reduction:
• CVR Event # 1, 2, 3 and 4:
122V (LTC, LVRs) = 3.33%
CVR
• CVR Event # 5: 121 V (LTC,
LVRs) = 4.17% CVR
• CVR Event # 6: 120.5V (LTC.,
LVR2), 125 (LVR1) = 3.29%
CVR
• Optimized Set-Point: 120.5V
(LTC, LVR2) and 121V (LVR1)
= 4.44% CVR

Example of CVR Event (Coop in Indiana) 4% to 6% overall Peak Demand
(MW) Reduction (combinedPrimary and Secondary voltagecontrol) achieved by operating thevoltage in the 114V to 120V rangeat the customer’s meter.
GEMS+ENGO solution delivers aBenefit-Cost Ratio (BCR) > 3.0
4 to 5 year payback period
Fully Deployed and Functioningon an entire substation in amatter of weeks
Peak Shaving: 229kWCVR factor = 1.2
SubstationVoltage
MWMeasured
MW with noCVR

Volt-VAR Control (VVC) is at the heart of grid operations
Conventional VVC with LVRs, and VARs from generators and MV cap banks have beensufficient in the past in creating a minimum floor for primary voltage
Cannot meet dynamic and precise grid-edge control needed with multi-objective VVO/CVR,dynamic voltage mitigation and renewable integration that utilities are moving towards
With more granular AMI information, gaps are becoming visible – Utilities have few tools tomanage
Deployment in Progress at 3 new substations at UDWI
SCADA upgrade,
Automation of LTC/LVR controls,
Optimization between Primary and Secondary VVC equipment
Deployment of Secondary VAR controllers (ENGO devices) at strategic locations
19
Conclusion