xcel energy project updates - umn ccaps • microgrid/islanding of panasonic building • peak...
TRANSCRIPT

XCEL ENERGY PROJECT UPDATESMiche l l e L im
2
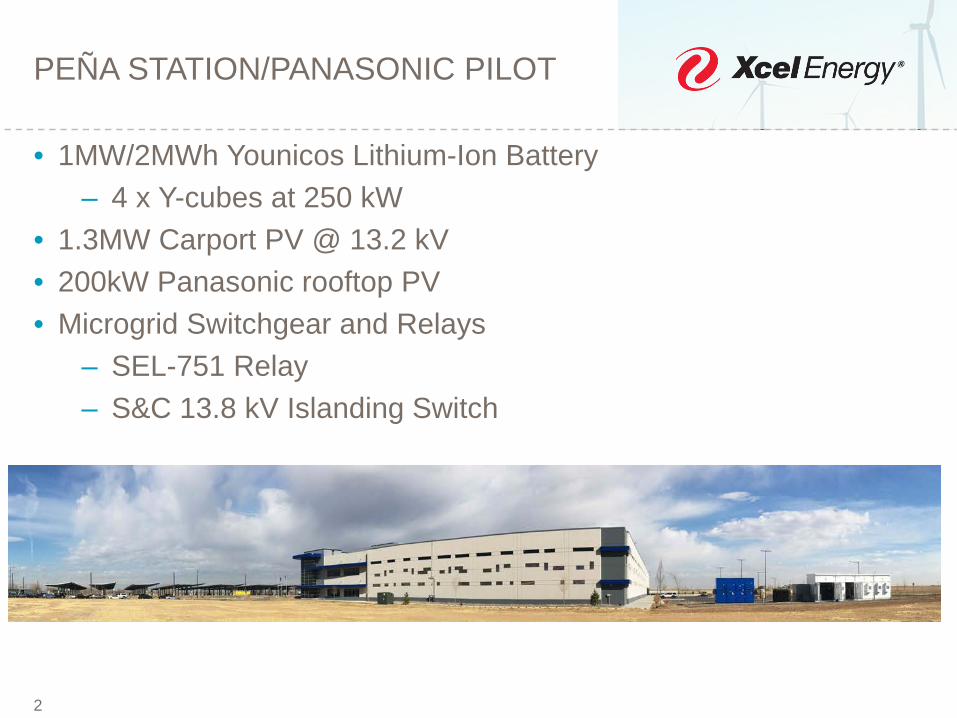
PEÑA STATION/PANASONIC PILOT
• 1MW/2MWh Younicos Lithium-Ion Battery– 4 x Y-cubes at 250 kW
• 1.3MW Carport PV @ 13.2 kV• 200kW Panasonic rooftop PV• Microgrid Switchgear and Relays
– SEL-751 Relay– S&C 13.8 kV Islanding Switch
2

3
USE CASES
3
• Microgrid/Islanding of Panasonic building• Peak Demand Reduction
– System Peak Demand Reduction (AutoGrid)– Feeder Peak Demand Reduction
• Voltage Regulation• PV smoothing/Ramp Rate Limiting• Energy Arbitrage• Frequency Response

4
RAMP RATE ON 8/21/17 ECLIPSE
4
-600
-400
-200
0
200
400
600
800
1000
1200
1400
10:30:00 11:42:00 12:54:00 14:06:00 15:18:00 16:30:00
Pow
er (k
W)
Time of Day
Eclipse 08/21/2017 Panasonic Project
PV Output
Battery Output
PV Max Ramp Rate ~ 48 kW/s
PV Max Ramp Rate ~4kW/s

5
PV “SMOOTHED” OUTPUT 8/21/17
5
0
200
400
600
800
1000
1200
1400
13:04:48 13:12:00 13:19:12 13:26:24 13:33:36 13:40:48 13:48:00
Pow
er (k
W)
Time of Day
08/21/2017 "Smoothed" Ramp Rate
PV Output
PV+BESS Output

6
STAPLETON NEIGHBOURHOOD
6
• Stapleton feeder has ~18.5% PV penetration• Utility-Sited Systems:
– System Provider: Northern Reliability– Six Li-Ion battery energy storage systems– Sited along the feeder at two different phases
• Behind-the-Meter Systems:– System Provider: Sunverge– Six Li-Ion battery energy storage systems– Sited in a customer’s home

7
STAPLETON UTILITY SITED OVERVIEW
7
• Northern Reliability Modular Units:– 2 x 18 kW/69 kWh– 2 x 36 kW/138 kWh– 2 x 54 kW/207 kWh
• Use Cases:– Peak Demand Reduction– Voltage Regulation– Solar Time Shifting– Energy Arbitrage

8
STAPLETON BEHIND-THE-METER OVERVIEW
8
• Sunverge SIS units– 6 x 6 kW/15.5 kWh
• Use Cases:– Providing Residential
Backup Power– Peak Demand Reduction– Solar Time Shifting– Volt-Watt Operation
9
CHARGE/DISCHARGE CYCLE FOR TESTING VARIOUS METRICS
9
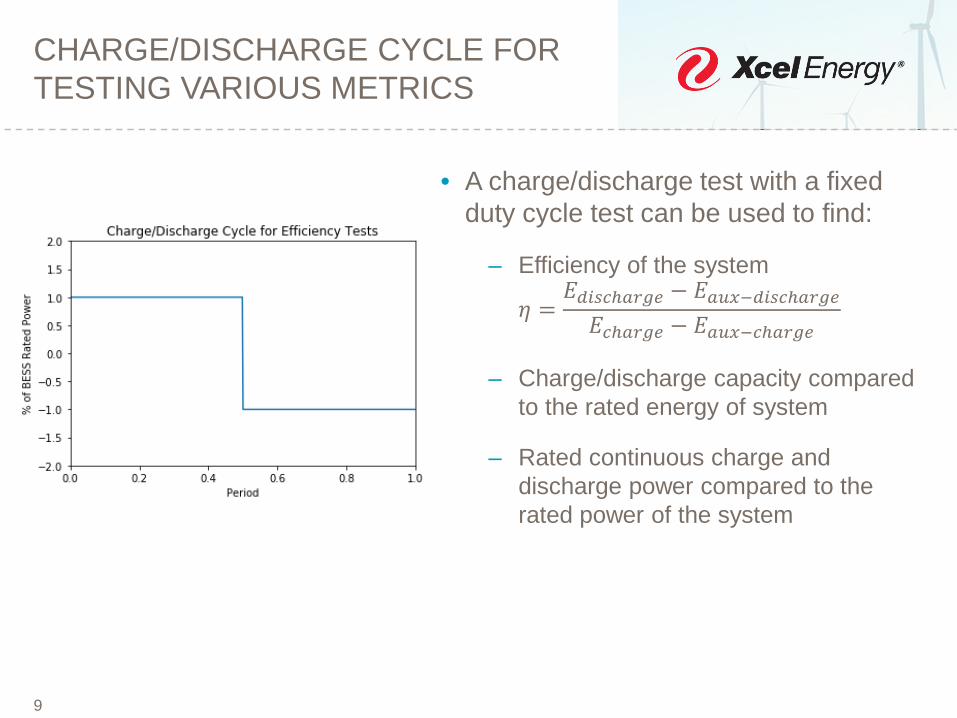
• A charge/discharge test with a fixed duty cycle test can be used to find:
– Efficiency of the system
𝜂𝜂 =𝐸𝐸𝑑𝑑𝑑𝑑𝑑𝑑𝑑𝑑𝑑𝑑𝑑𝑑𝑑𝑑𝑑𝑑𝑑 − 𝐸𝐸𝑑𝑑𝑎𝑎𝑎𝑎−𝑑𝑑𝑑𝑑𝑑𝑑𝑑𝑑𝑑𝑑𝑑𝑑𝑑𝑑𝑑𝑑𝑑𝐸𝐸𝑑𝑑𝑑𝑑𝑑𝑑𝑑𝑑𝑑𝑑𝑑 − 𝐸𝐸𝑑𝑑𝑎𝑎𝑎𝑎−𝑑𝑑𝑑𝑑𝑑𝑑𝑑𝑑𝑑𝑑𝑑
– Charge/discharge capacity compared to the rated energy of system
– Rated continuous charge and discharge power compared to the rated power of the system
10
TENTATIVE RESULTSEFFICIENCY (SEPT – OCT TESTING)
10
0
10
20
30
40
50
60
70
80
90
100
STS & SPDR Net Zero VRO & SPDR Bill Management
Effic
ienc
y (%
)
Operations
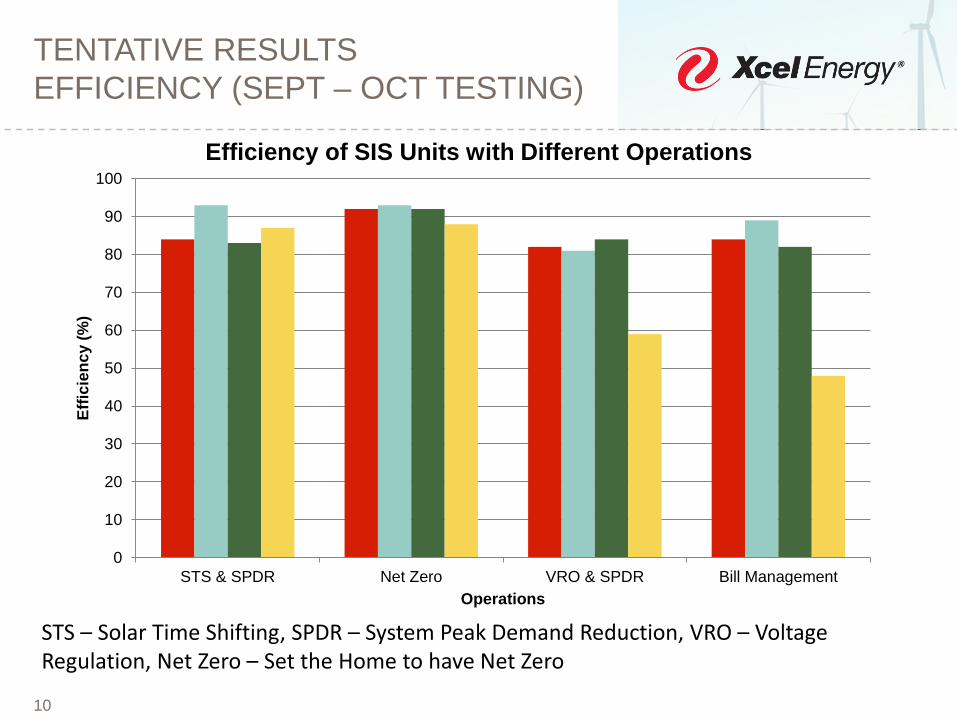
Efficiency of SIS Units with Different Operations
STS – Solar Time Shifting, SPDR – System Peak Demand Reduction, VRO – Voltage Regulation, Net Zero – Set the Home to have Net Zero
11
BESS POWER OUTPUT WITH DIFFERING EFFICIENCY
11
-6000
-5000
-4000
-3000
-2000
-1000
0
1000
2000
0:00 3:00 6:00 9:00 12:00 15:00 18:00 21:00 0:00
Pow
er (W
)
Time of Day
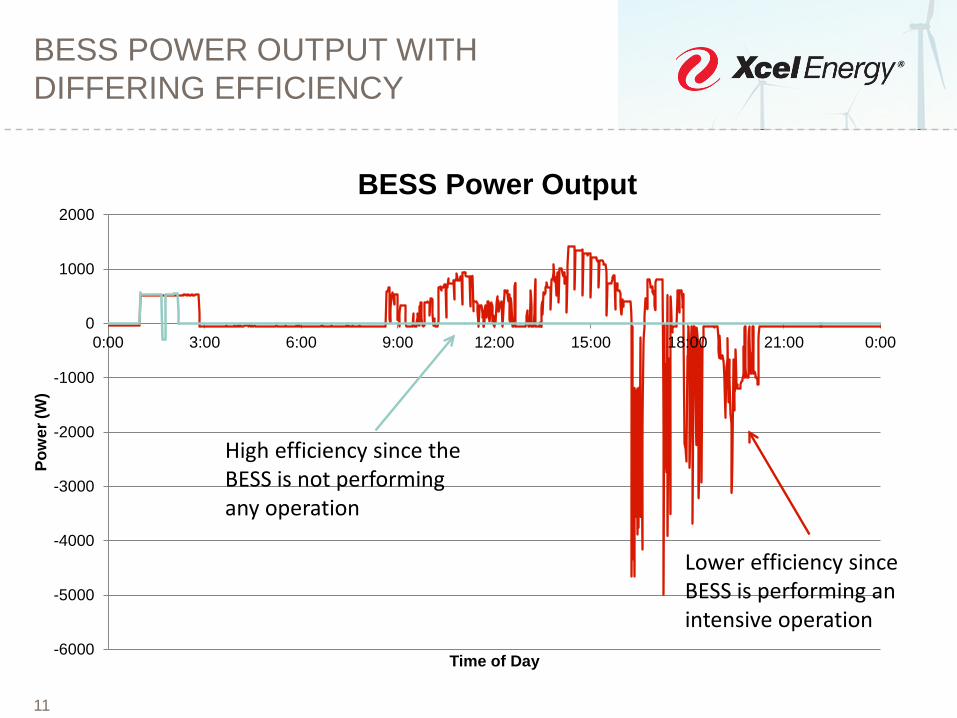
BESS Power Output
Lower efficiency since BESS is performing an intensive operation
High efficiency since the BESS is not performing any operation

SAMPLE TESTSOLAR TIME SHIFTING
-1,000
0
1,000
2,000
3,000
4,000
5,000
6,000
7,000
0:00 3:00 6:00 9:00 12:00 15:00 18:00 21:00 0:00
Pow
er (W
)
Time of Day
Solar PV Production(Battery-PV) Charge battery Discharge
battery

PRELIMINARY TEST RESULTTIME-OF-USE BILL MANAGAMENT
-8,000
-6,000
-4,000
-2,000
0
2,000
4,000
6,000
0:00 3:00 6:00 9:00 12:00 15:00 18:00 21:00 0:00
Pow
er (W
)
Time of Day
Peak period
Site meter demand with battery (load convention)Site meter demand without battery (load convention)
Charge battery
Begin discharging battery

PEAK DEMAND REDUCTION TEST SAMPLE
-1,500
-1,000
-500
0
500
1,000
1,500
2,000
2,500
6:57 7:26 7:55 8:24 8:52 9:21 9:50
Pow
er (W
)
Time of Day
Site meter (demand)Battery output
Battery discharges to maintain load at net zero demand

TEST SAMPLE RESULTS
15
-2000
-1500
-1000
-500
0
500
1000
1500
2000
2500
3000
0:00 3:00 6:00 9:00 12:00 15:00 18:00 21:00 0:00
Pow
er (W
)
Time of Day
Test Results for BTM Unit
Site PV
Set Site Meter to
0 WCharge from
Grid
Set Site Meter to 500 W PV Charging
16
Questions
16

17
YOUNICOS ENERGY STORAGE PARAMETERS
17
Description ValueRated Apparent Power 1,000 kVA
Rated Real Power 1,000 kWRated Energy 2,100 kWh
Available Energy 1,690 kWhRound-Trip Efficiency 85.5 %
Voltage Range 432-528 VRated Continuous AC
Current1,200 A
Operating Temp. Range -10°C - 45°CPhysical Dimension 42’ x 10’

18
NRI ENERGY STORAGE PARAMETERS
18
Description 18 kW System 36 kW System 54 kW SystemRated Apparent
Power 18 kVA 36 kVA 54 kVA
Rated Real Power 18 kW 36 kW 54 kWRated Energy 69 kWh 138 kWh 207 kWhRound-TripEfficiency N/A
Voltage Range 172 – 264 VRated Continuous
AC Current 94 A 187 A 281 A
Operating Temp. Range -30°C -50°C
PhysicalDimension
56” x 52.75” x 53”
112” x 52.75” x 53”
159” x 52.75” 53”

19
SUNVERGE SIS UNIT

20
SUNVERGE ENERGY STORAGE PARAMETERS
20
Description ValueRated Apparent Power 6 kVA
Rated Real Power 6 kWRated Energy 15.5 kWh
Available Energy 11.64 kWhRound-Trip Efficiency 92.5 %
Voltage Range 233 – 247 VRated Continuous AC Current 25 A
Operating Temp. Range -20°C - 50°CPhysical Dimension 76” x 34” x 14 “

21