azad jammu & kashmir 2012 - welcome to aser · pdf fileazad jammu & kashmir (rural)...
TRANSCRIPT

Sample Composition
· The ASER 2012 survey was conducted in all 10 districts of AJK. This covered 5,885 households in 297 villages in the province.
· Detailed information was collected on 15,261 children (55% male, 45% female) aged 3-16 years. Out of these, children aged 5-16 were also tested for language and arithmetic competencies.
· School information on both public and private schools was collected. A total of 551 schools were surveyed, 1out of which 295 were government (44% primary, 25% elementary, 30% high, 1% others ) and 256 were
private schools (45% primary, 36% elementary, 18% high, 1% others).
· Forty-four percent of the government schools were boys only, 23% were girls only, and 33% were co-education schools. Three percent of the private schools were boys only, 1% was girls only, and 96% were co-education schools.
A small proportion of children are out of school seven percent of all school-aged children in AJK are out of school.
· Of all children aged 6-16 years, 93% were reported being enrolled in schools.
· Seven percent of the school-aged children have either dropped out of school (3%) or have never been enrolled in a school (4%). ASER 2012 showed a slightly lesser percentage of children to be out-of-school than 2011 in AJK.
· E ual percentage of girls and boys were found to be out-of-school.
· For every thirteen children in Class 1, there are si children in Class 10.
Azad Jammu & Kashmir (Rural) 2012
1Other type of schools include classes 6-8, 1-12, 3-8, 6-10, 4-12, 5-10.
In 2011, 4 districts of Azad Jammu & Kashmir were surveyed.
15
5
136
0
10
20
30
40
1 2 3 4 5 6 7 8 9 10
% C
hild
ren
Class
Class-wise enrollment
2011 2012
5 46 4
0
10
20
30
40
50
2011 2012
% C
hild
ren
Out-of-school children by gender6 to 16 years
Boys Girls
Children in different types of schools ut-of-school
TotalAge
groupGovt.
Non-state providers Neverenrolled
Drop- outPvt. Madrasah thers
6-10
56.3
38.2
0.4
0.2
4.2
0.7
100
11-13
63.1
30.1
0.8
0.2
2.6
3.2
100
14-16
61.3
23.5
0.6
0.4
5.1
9.1
100
6-16
59.3
32.4
0.6
0.2
4.1
3.4
100
Total
92.5
7.5
100
By type
64.1
35.0
0.6
0.3
ASER 2012 - Azad Jammu & Kashmir96

Azad Jammu & Kashmir (Rural) 2012
Private schools absorb a large share of school-aged children thirty-six percent of all school-going children are enrolled in non-state schools in AJK.
· Forty-two percent of the children enrolled in private schools are girls and 58% are boys.
· ess than 1% of the total school-attending population attends madrasah schools and other non-formal institutes.
More than half of the pre-primary age children are not attending any form of schooling.
· A total of 3,153 children aged from three to five were reached during the ASER 2012 survey in AJK.
· Consistent with last year s results, 53% of children aged 3-5 did not attend any form of pre-primary education.
· Of the children who do attend pre-primary education, 51% are enrolled in public institutions and 49% in private institutions.
55 58
45 42
0
20
40
60
80
100
Government schools Private schools
% C
hild
ren
Enrollment by gender and type of school 6 to 16 yearsBoys Girls
86
52
20
89
54
170
20
40
60
80
100
Age 3 Age 4 Age 5
% C
hild
ren
Children not attending any pre-school3 to 5 years
2011 2012
Children ho attend different types of pre-schools
Age group Govt. Non-state providers
ut-of-school Total Pvt. Madrasah thers
3 4.6 6.1 0.2 0.0 89.1 100
4 20.5 24.6 0.4 0.1 54.4 100
5 44.8 37.5 0.2 0.2 17.4 100
3-5 23.8 23.0 0.3 0.1 52.8 100
Total 47.2 52.8 100
By type 50.5 48.8 0.5 0.2
ASER 2012 - Azad Jammu & Kashmir 97

Azad Jammu & Kashmir (Rural) 2012
2Learning levels of children are assessed through specific language and arithmetic tools . The same approach is used for all children between the ages of 5 to 16. The literacy assessments are designed to cover up to Class 2 level according to the national curriculum. The arithmetic tool covers up to Class 3 level.
Learning levels remain consistently poor: thirty-five percent children from Class 5 cannot read Class 2 Urdu story.
· Analysis of reading ability shows that 52% of Class 3 students were able to read sentence and nearly 48% could not.
3· In ASER 2011 , 58% of Class 5 students were reported as being able to read a story compared to 65% of Class 5 students who could in 2012.
2 ITA has developed detailed documents on the tools development process. The tools are developed after analyzing
national textbooks and in consultation with expert groups at the provincial and national level. They are then piloted intensively before use to ensure comparability, consistency and reliability across provinces and over time.3 Four rural districts of AJK were surveyed in 2011.
Deterioration can be seen in English competencies over the past year.
· In ASER 2012, 58% of Class 5 students were reported as being able to read Class 2 English sentences compared to 60% of Class 5 students who could do so in 2011.
· Sixty-nine percent of Class 6 children and 82% of Class 7 children were able to accomplish Class 2 English sentence tasks.
26
44
58
74
26
45
65
74
0
20
40
60
80
100
Class 3 Class 4 Class 5 Class 6
% C
hild
ren
Children who can read story Urdu
2011* 2012
Class-wise % children who can read
Class Nothing Letters Words Sentences Story Total
1 13.5 39.3 37.3 6.1 3.9 100
2 5.5 23.6 45.3 16.1 9.4 100
3 2.9 10.8 34.1 26.5 25.6 100
4 1.4 4.8 21.6 26.8 45.4 100
5 1.3 1.4 10.7 21.7 64.9 100
6 0.9 0.8 5.4 19.2 73.7 100
7 0.7 0.7 3.4 10.7 84.6 100
8 0.0 0.0 0.5 7.0 92.5 100
9 0.0 0.0 0.6 3.8 95.6 100
10 0.0 0.0 0.0 1.7 98.3 100
How to read: 10% (6.1+3.9)children of Class 1 can read sentence
26
43
60
73
22
40
58
69
0
20
40
60
80
100
Class 3 Class 4 Class 5 Class 6
% C
hild
ren
Children who can read English sentences
2011* 2012
Class-wise % children who can read
Class Nothing Letters Words Sentences Total
1 16.4 28.2 36.8 15.4 3.2 100
2 6.5 14.9 41.7 28.3 8.6 100
3 4.2 6.7 27.2 40.3 21.7 100
4 1.9
3.3
15.0
39.6
40.1
100
5 1.6
1.2
8.3
30.5
58.4
100
6 1.5
0.6
3.7
24.9
69.2
100
7 0.8
0.5
2.2
14.5
82.0
100
8 0.0
0.0
0.2
6.7
93.1
100
9 0.0
0.0
0.6
3.6
95.8
100
10
0.0
0.0
0.0
2.5
97.5
100
How to read: 18.6% (15.4+3.2) children of Class
1 can read words
ASER 2012 - Azad Jammu & Kashmir98
Azad Jammu & Kashmir (Rural) 2012
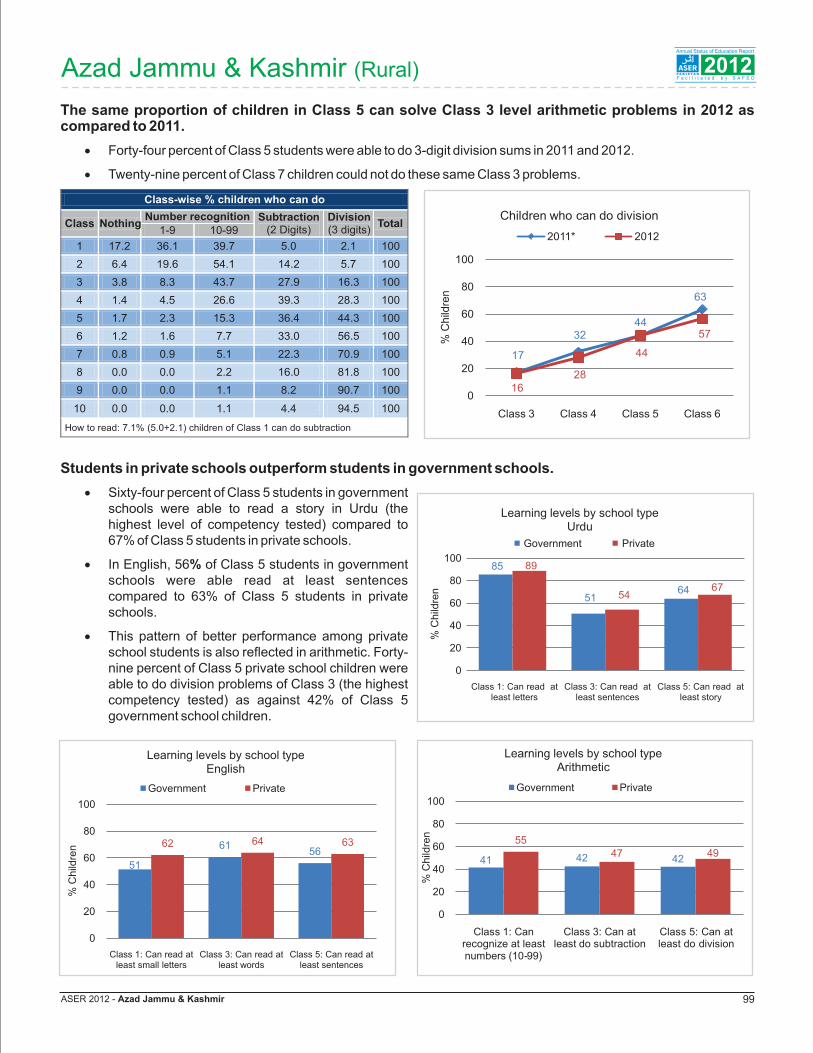
The same proportion of children in Class 5 can solve Class 3 level arithmetic problems in 2012 as compared to 2011.
· Forty-four percent of Class 5 students were able to do 3-digit division sums in 2011 and 2012.
· Twenty-nine percent of Class 7 children could not do these same Class 3 problems.
Students in private schools outperform students in government schools.
· Sixty-four percent of Class 5 students in government schools were able to read a story in Urdu (the highest level of competency tested) compared to 67% of Class 5 students in private schools.
· In English, 56% of Class 5 students in government schools were able read at least sentences compared to 63% of Class 5 students in private schools.
· This pattern of better performance among private school students is also reflected in arithmetic. Forty-nine percent of Class 5 private school children were able to do division problems of Class 3 (the highest competency tested) as against 42% of Class 5 government school children.
17
32 44
63
16 28
44
57
0
20
40
60
80
100
Class 3 Class 4 Class 5 Class 6
% C
hild
ren
Children who can do division
2011* 2012
Class-wise % children who can do
Class Number recognition Subtraction
(2 Digits) Division
(3 digits) Total 1-9 10-99
1 17.2 36.1 39.7 5.0 2.1 100
2 6.4 19.6 54.1 14.2 5.7 100
3 3.8 8.3 43.7 27.9 16.3 100
4 1.4 4.5 26.6 39.3 28.3 100
5 1.7 2.3 15.3 36.4 44.3 100
6 1.2 1.6 7.7 33.0 56.5 100
7 0.8 0.9 5.1 22.3 70.9 100
8 0.0 0.0 2.2 16.0 81.8 100
9 0.0 0.0 1.1 8.2 90.7 100
10 0.0 0.0 1.1 4.4 94.5 100
How to read: 7.1% (5.0+2.1) children of Class 1 can do subtraction
85
5164
89
5467
0
20
40
60
80
100
Class 1: Can read at least letters
Class 3: Can read at least sentences
Class 5: Can read at least story
% C
hild
ren
Learning levels by school type Urdu
Government Private
51
6156
62 64 63
0
20
40
60
80
100
Class 1: Can read at least small letters
Class 3: Can read at least words
Class 5: Can read at least sentences
% C
hild
ren
Learning levels by school typeEnglish
Government Private
41 42 42
55
47 49
0
20
40
60
80
100
Class 1: Can recognize at least numbers (10-99)
Class 3: Can at least do subtraction
Class 5: Can at least do division
% C
hild
ren
Learning levels by school typeArithmetic
Government Private
Nothing
ASER 2012 - Azad Jammu & Kashmir 99

Azad Jammu & Kashmir (Rural) 2012
Gender gaps in learning outcomes: minor differences between boys and girls in English reading and numeracy skills.
· Sixty-two percent of boys and 60% of girls were able to read at least Urdu sentences. This difference was found to be statistically insignificant at 95% confidence level.
· Sixty-seven percent of boys and 65% of girls were able to correctly read English language words and sentences.
· Similarly, 59% of boys and 57% of girls were able to do subtraction or division problems.
A modest proportion of 'out-of-school' children are at more than 'beginner' competency levels.
· Data on reading ability of out-of-school children shows that 9% of out-of-school children could read a story in Urdu while 69% of these children were at the beginner level.
· English reading and comprehension competencies were also found in out-of-school children. While 69% of children were at beginners' level, 16% were able to read words and sentences.
· In arithmetic almost 8% out-of-school children shows were able to do division sums while 67% were at the beginner level.
Forty-eight percent of the mothers in the sampled households had completed atleast primary schooling.
· Out of the total mothers in the sampled households, 52% mothers had not completed primary schooling.
· The data shows that 64% fathers in the sampled households had completed at least primary schooling.
60 62
0
20
40
60
80
100
Girls Boys
% C
hild
ren
Who can read at least sentences
Learning levels by genderUrdu
65 67
0
20
40
60
80
100
Girls Boys
% C
hild
ren
Who can read at least words
Learning levels by genderEnglish
57 59
0
20
40
60
80
100
Girls Boys
% C
hild
rern
Who can at least do subtraction
Learning levels by genderArithmetic
69
10 7 6 9
0
20
40
60
80
100
Beginner Letters Words Sentences Story
%C
hild
ren
Learning levels: out-of-school children Urdu
69
9 6 6 10
0
20
40
60
80
100
Beginner Capital letters
Small letters
Words Sentences
% C
hild
ren
Learning levels: out-of-school children English
67
12
6 7 8
0
20
40
60
80
100
Beginner Number recognition
1-9
Number recognition
10-99
Subtraction Division
% C
hild
ren
Learning levels: out-of-school children Arithmetic
48
64
0
20
40
60
80
100
Mothers Fathers
% P
are
nts
Parents having at least primary schooling
ASER 2012 - Azad Jammu & Kashmir100

Fifteen different languages are used in the households in AJK.
· ASER 2012 survey findings revealed that 15 different languages were used in the surveyed households in AJK.
· Four languages used commonly were Hindko (34%), Pahari (21%), Urdu (15%) and Punjabi (15%)
4· Fifteen percent of the remaining households used other languages .
The most preferred language for medium of instruction as rdu.
· Each household surveyed was also asked their preferred medium of instruction for their children in schools.
· Seventy percent of the households surveyed preferred Urdu as the medium of instruction in schools.
· Home language was preferred by 17% out of all households and 13% preferred English.
Azad Jammu & Kashmir (Rural) 2012
Private tuition incidence and uptake is more prevalent among private than government school students.
· Around 20% of all private school-going children take paid tuition while 9% of all government school children do so.
· Children across all private school classes undertake private tuition. In Class 1, 23% of private school children take paid tuition and in Class 10 of private schools this percentage has risen to 29%.
· In government schools, the incidence of tuition-taking remains somewhat consistent with class-level. Eight percent of children in Class 10 take paid tuition as compared to 9% in Class 1.
4Gujrati, Potwari, Kashmiri, Persion , Pashto, Brahvi, English, Marwari, Bolari and Chitrali
7914 20
0
20
40
60
80
100
2011 2012
% C
hild
ren
Children attending paid tuition
Government schools Private schools
Class- ise children attending paid tuition
Type I II III I I II III I
Govt. 9.4 10.0 8.2 9.6 12.0 10.5 9.1 8.7 7.9 8.4
Pvt. 22.7 18.5 17.1 17.8 21.7 22.7 20.8 23.2 23.9 28.9
English13%
Urdu70%
Home language
17%
ASER 2012 - Azad Jammu & Kashmir 101

The official medium of instruction of the schools attended by surveyed children was English or Urdu.
· Each child was also asked the medium of instruction in their respective schools.
· Sixty-eight percent of the children in private schools reported English as their medium of instruction, and 32% had Urdu.
· Three percent of the children in public schools reported having English as their medium of instruction, while 97% schools had Urdu.
· The medium of instruction for each school visited was also asked during the survey.
· Four percent of the government schools surveyed in AJK were English medium and 96% were Urdu medium.
· Eighty-three percent of the private surveyed schools in AJK were English medium, 12% were Urdu medium, less than 1% was Hafiz-e-Quran schools, and about 4% were other mediums.
Azad Jammu & Kashmir (Rural) 2012
Twelve percent children in government schools were absent.
Student attendance is recorded by taking a head count of all students present in schools on the day of visit.
· Overall student attendance in government schools stood at 88%.
· The overall attendance in private schools is 88% as per the headcount.
Twelve percent teachers in government schools and 13% teachers in private schools were absent.
Teacher attendance is recorded by referring to the appointed positions in each school and the total number of teachers actually present on the day of survey.
· Overall teacher attendance in government schools was 88% and 87% in private schools.
Forty percent of government schools surveyed had Class 2 students sitting together with other classes.
· The surveyors were asked to observe if Class 2 and Class 8 were sitting together with any other classes. This is referred to as multi-grade teaching, where one teacher has to teach more than one grade within the allotted time.
· It was found that 40% of the surveyed government schools and 28% of the surveyed private schools had Class 2 sitting with other classes.
· Similarly 15% of surveyed government schools and 19% of surveyed private schools had Class 8 sitting with other classes.
3
97
68
32
0
20
40
60
80
100
English Urdu
% C
hild
ren
re
po
rtin
g m
ed
ium
of
instr
uctio
n in
sch
oo
l
Medium of instruction in schools
Government Private
Attendance (%) on the day of visit
Government schools Private schools
Primary Elementary High Others Overall Primary Elementary High Others Overall
Children attendance 86.6 89.0 87.5 98.9 87.7 88.2 86.2 89.4 79.9 87.7
Teacher attendance 86.9 84.9 89.0 92.2 87.6 84.0 89.8 85.3 88.2 86.7
40
15
2819
0
20
40
60
80
100
Class 2 Class 8
% S
chools
Multi grade teaching
Government Private
ASER 2012 - Azad Jammu & Kashmir102

Sixty-four percent of the surveyed government primary schools were without toilets and 43% were without drinking water.
· Of the total government primary schools surveyed, 57% had useable water facility and only 36% had a functional toilet.
· In ASER 2011, it was found that 50% of the government primary schools surveyed had useable water while 42% had a functional toilet.
· The percentage of private primary schools found with useable water facility was 81%, also 57% were found with a functional toilet in 2012.
More qualified teachers in government schools.
· Twenty-four percent of the teachers in government schools had post-graduate degrees, while private schools had 17% teachers who did.
· Eleven percent of the teachers had Masters in Education in government schools, while 7% of the teachers in private schools had the same degree.
Azad Jammu & Kashmir (Rural) 2012
Larger proportions of surveyed private schools had library books in their premises as compared to government schools.
· Twenty-four percent of the surveyed government high schools had library books available for students to use in the school premises, while 54% of the private schools had the same facility.
· Forty-two percent of government high schools had computer labs as opposed to 40% private high schools.
School facilities (% schools)
Government schools Private schools
Primary Elementary High Others Primary Elementary High Others
Library 3.2 7.9 23.7 100.0 14.9 32.6 54.3 100.0
Computer lab 0.0 4.0 41.7 100.0 6.5 26.4 40.4 100.0
Teacher qualification - general (% of teachers) Teacher qualification - professional (% of teachers)
Government schools Private schools Government schools Private schools
Matriculation 12.8 9.3 PTC 20.4 21.9
FA 21.3 31.2 CT 20.0 30.6
BA 40.8 41.5 B-Ed 45.9 38.5
MA or above 24.3 17.4 M-Ed or above 10.7 6.9
Others 0.9 0.6 Others 3.1 2.1
42
50
74 82
36
57 57
81
0
20
40
60
80
100
Toilet Water Toilet Water
Government Private
% P
rim
ary
schools
Water and toilet facility in primary schools
2011 2012
School facilities (% schools)
Government schools Private schools
Primary Elementary High Others Primary Elementary High Others
Useable water 56.6 68.8 80.9 100.0 80.5 78.9 86.9 100.0
Useable toilet 36.2 59.2 68.6 100.0 56.6 63.7 82.9 100.0
ASER 2012 - Azad Jammu & Kashmir 103

Larger proportion of private primary schools had playgrounds and boundary walls as compared to government primary schools.
· Among the government primary schools surveyed 19% had a playground within the school premises compared to 36% of private primary schools that had a playground.
· Boundary walls were found in 34% of the surveyed government schools and 38% of the surveyed private primary schools.
· In ASER 2011, 39% of the surveyed government primary schools and 53% of the surveyed private schools were found with a boundary wall.
Azad Jammu & Kashmir (Rural) 2012
Seven rooms on average were being used for classroom activities in surveyed government high schools.
· Government primary schools had 2 rooms on average that were used for classes, while private primary schools had 3.
· 5 rooms on average were being used in government and private elementary schools.
· In case of high schools, government schools had 7 rooms on average while private schools had 8.
Less than one percent of the government primary schools had received grants in the previous year.
· In 2011, among the government schools surveyed, 1 (0.8%) primary schools, 2 (3%) elementary and 4 (5%) high schools had received grants.
· The proportion of schools receiving grants in 2012 (1%) was the less than 2011 (3%).
5 Grants received till October 31, 2012
28 39 38
53
19
34 36 38
0
20
40
60
80
100
Playground Boundary wall
Playground Boundary wall
Government Private
%P
rim
ary
sch
ools
Playground and boundary wall facility in primary schools
2011 2012
School facilities (% schools)
Government schools Private schools
Primary Elementary High Others Primary Elementary High Others
Playground 19.0 28.5 42.5 100.0 36.4 47.8 56.5 100.0
Boundary wall 33.6 42.1 36.7 100.0 37.8 48.3 42.2 100.0
School facilities – Average number of rooms used for classes
Government schools Private schools
Primary Elementary High Others Primary Elementary High Others
Rooms used for classes (avg.) 2.1 4.7 6.5 6.5 3.4 5.4 8.1 18.5
School Grants
Government schools Private schools
Primary Elementary High Others Primary Elementary High Others
20
12
5
# of schools reported receiving grants
1 - 1 - 3 2 - -
% of schools reported receiving grants
0.8 0.0 1.2 0.0 2.6 2.1 0.0 0.0
Average amount of grant (Rs.) 100 - 10,000 - 15333 20000 - -
20
11
# of schools reported receiving grants
1 2 4 - 3 2 2 -
% of schools reported receiving grants
0.8 2.6 4.7 0.0 2.6 2.1 4.3 0.0
Average amount of grant (Rs.) 3000 52258 20840500 - 18667 17500 55000 -
ASER 2012 - Azad Jammu & Kashmir104