awea pre-show, orlando, fl may 18, 2015 wind farm … farm best practice series technical training...
TRANSCRIPT

© ABB
| Slide 1
Wind Farm Best Practice SeriesTechnical Training
AWEA Pre-Show, Orlando, FL May 18, 2015
May 18, 2015

© ABB
| Slide 2
Wind Farm Best Practices
Speakers
Dennis McKinley
Director, Wind Power
Solutions NAM
Vythahavya Vadlamani
Senior Consulting
Engineer
Aniruddha Narawane
Transformer Engineering
Manager
Nick Powers
Global Product
Marketing Manger, HVIT
Pat Hayes
Business Development
Manager, Energy Storage
Sameer Kapoor
Sr. BDM,
Power Generation NAM
Clinton Davis
VP, Renewable Solutions
May 18, 2015

© ABB
| Slide 3
Wind Farm Best Practices
Optimize output, improve forecasting capabilities
May 18, 2015
© ABB
| Slide 4
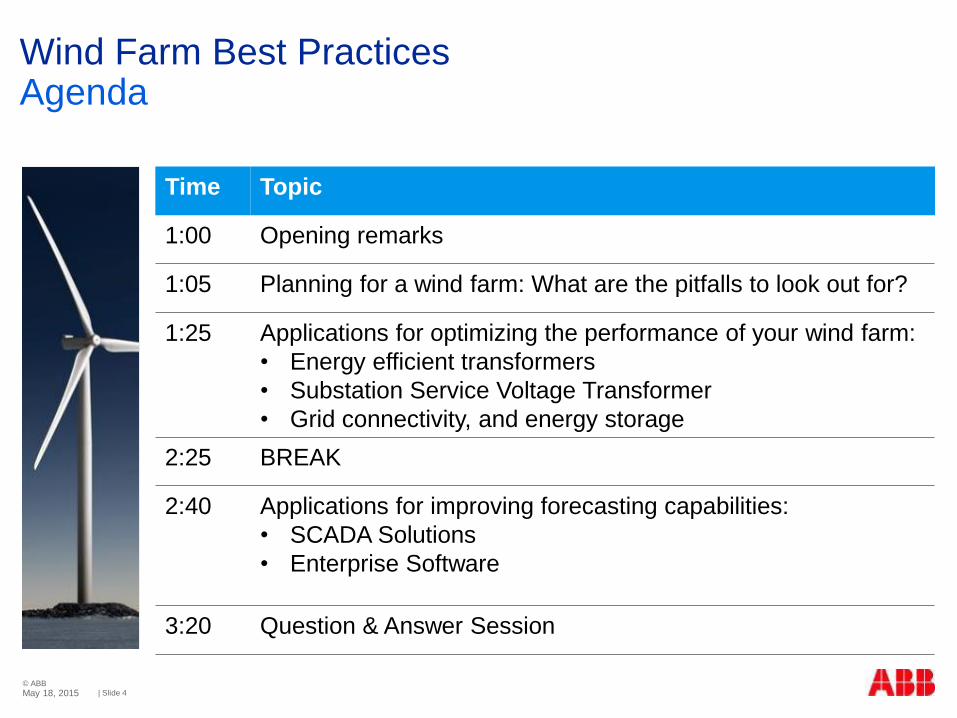
Wind Farm Best PracticesAgenda
Time Topic
1:00 Opening remarks
1:05 Planning for a wind farm: What are the pitfalls to look out for?
1:25 Applications for optimizing the performance of your wind farm:
• Energy efficient transformers
• Substation Service Voltage Transformer
• Grid connectivity, and energy storage
2:25 BREAK
2:40 Applications for improving forecasting capabilities:
• SCADA Solutions
• Enterprise Software
3:20 Question & Answer Session
May 18, 2015

© ABB
| Slide 5
Preparing for wind farm integrationHow to avoid common pitfalls
Vythahavya Vadlamani, Senior Consulting Engineer
May 18, 2015

© ABB
| Slide 6
Equipment Failures due to electrical resonances
Interconnection Requirements
Agenda
May 18, 2015
© ABB
| Slide 7
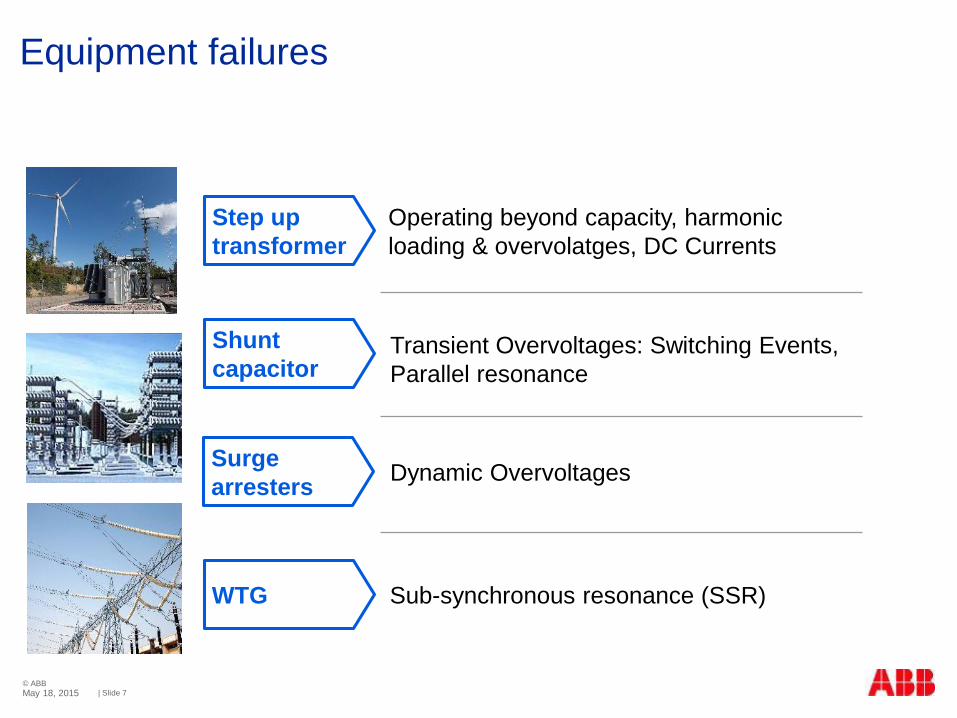
Equipment failures
Operating beyond capacity, harmonic
loading & overvolatges, DC Currents
Transient Overvoltages: Switching Events,
Parallel resonance
Dynamic Overvoltages
Sub-synchronous resonance (SSR)
Step up
transformer
Surge
arresters
Shunt
capacitor
WTG
May 18, 2015
© ABB
| Slide 8
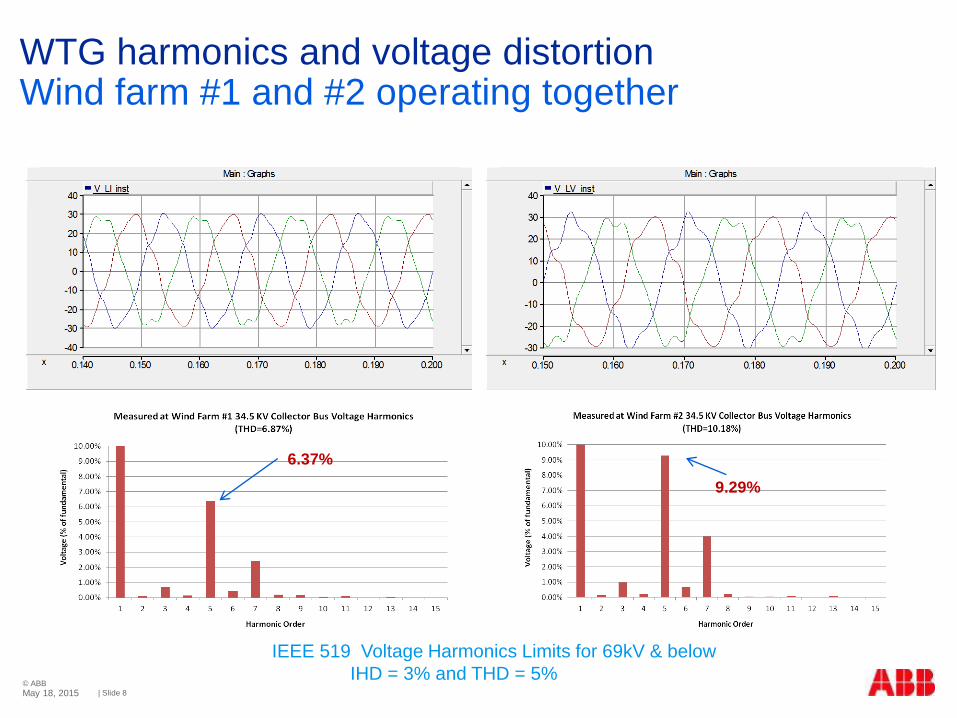
WTG harmonics and voltage distortionWind farm #1 and #2 operating together
6.37%
9.29%
IEEE 519 Voltage Harmonics Limits for 69kV & below
IHD = 3% and THD = 5%May 18, 2015

© ABB
| Slide 9
WTG harmonics and voltage distortionWind farm #1 and #2 operating together
2.46% 2.57%
IEEE 519 Voltage Harmonics Limits for 69kV & below
IHD = 3% and THD = 5%May 18, 2015

© ABB
| Slide 10
Switching a capacitor bank on high voltage side
Transient overvoltages example
C1
L1
C2
L2
May 18, 2015

© ABB
| Slide 11
Transient overvoltages exampleShunt capacitor switching
Plot of 115-kV 40 MVAR capacitor
switching
voltage on 115-kV bus
(maximum peak voltage 1.44 pu)
Plot of 115-kV 40 MVAR capacitor
switching
voltage on 34.5-kV bus
(maximum peak voltage 1.8 pu)
Synchronized closing of circuit breakers and additional arresters on the
collector system can address this issue
May 18, 2015

© ABB
| Slide 12
Transient overvoltages exampleFeeder switching with shielded cables
Feeder energized on 34.5-kV collector
system
1.85 pu
Surge arresters can limit the transient voltages to an acceptable level
May 18, 2015

© ABB
| Slide 13
Load rejection or
interruption
Open-ended lines and
cables
Transmission line and cable
tripping
Dynamic overvoltages
May 18, 2015

© ABB
| Slide 14
Dynamic overvoltages exampleFeeder de-energizing
Asynchronous generator – Normal
feeder de-energizing
Feeder-side voltage at 34.5 kV Bus with
Grounding Transformer
Asynchronous generator – Normal
feeder de-energizing
Feeder-side voltage at 34.5 kV bus
without Grounding Transformer
Fast grounding switch to close and ground each phase immediately
after opening the feeder can help mitigate the overvoltage
May 18, 2015

© ABB
| Slide 15
Dynamic overvoltages example contd..Feeder trip with & without grounding transformer
Asynchronous generator – SLG fault at
the station
Feeder-side voltage at 34.5 kV bus with
grounding transformer
Asynchronous generator – SLG fault at the
station
Feeder-side Voltage at 34.5 kV bus without
grounding transformer
May 18, 2015

© ABB
| Slide 16
Series Compensated Lines Series Resonance
34.5kV:345 kV
345kV line series
capacitor
bypass
breaker
network
equivalent
WTG
Xline XC
InfiniteBusXGSU
Xd”
𝑓𝑟 = 𝑓𝑏𝑋𝐶𝑋𝐿
𝑋𝐿 = 𝑋𝑑" + 𝑋𝐺𝑆𝑈 + 𝑋𝑙𝑖𝑛𝑒
XC is always less than Xline and XL so fr is less than fb . In other words, the
resonance is sub-synchronous.
Series compensation of a transmission line results in a series resonance.
𝑓𝑏 = 𝑆𝑦𝑠𝑡𝑒𝑚 𝑏𝑎𝑠𝑒 𝑓𝑟𝑒𝑞𝑢𝑒𝑛𝑐𝑦
𝑓𝑟 = 𝑅𝑒𝑠𝑜𝑛𝑎𝑛𝑐𝑒 𝑓𝑟𝑒𝑞𝑢𝑒𝑛𝑐𝑦
May 18, 2015
© ABB
| Slide 17
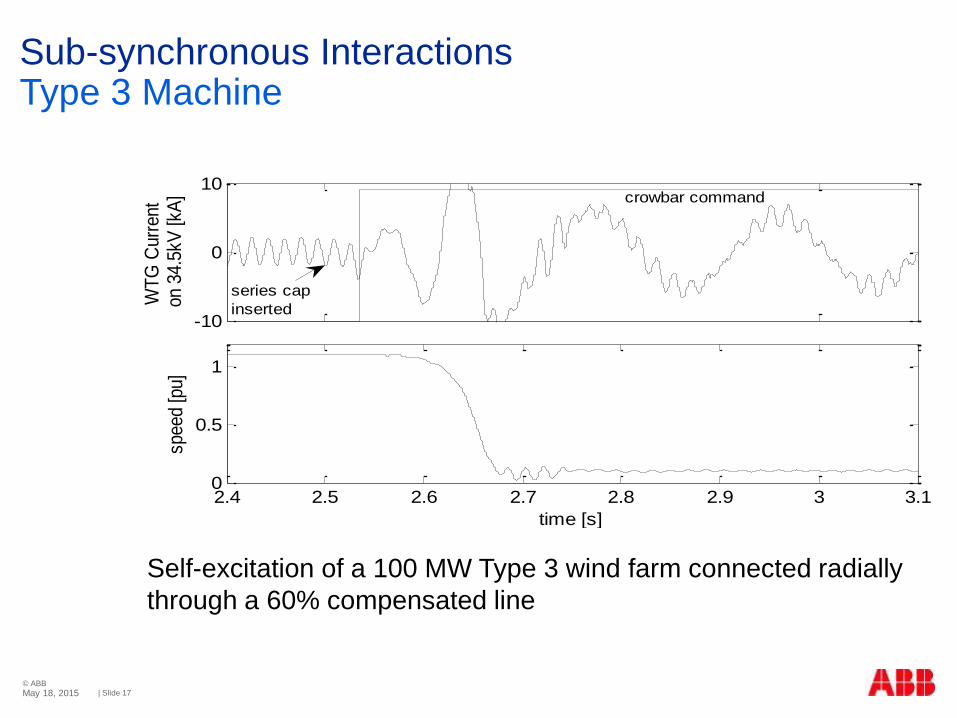
Self-excitation of a 100 MW Type 3 wind farm connected radially
through a 60% compensated line
Sub-synchronous InteractionsType 3 Machine
-10
0
10
WT
G C
urre
nton
34.
5kV
[kA
] crowbar command
2.4 2.5 2.6 2.7 2.8 2.9 3 3.10
0.5
1
time [s]
spee
d [p
u]
series cap
inserted
May 18, 2015

© ABB
| Slide 18
1 1.5 2 2.5-8
-6
-4
-2
0
2
4
6
8
time [s]
Lin
e C
urr
ent
[kA
]
1 1.5 2 2.5-0.2
0
0.2
0.4
0.6
0.8
1
1.2
1.4
Speed [
pu]
Sub-synchronous PhenomenaSelf-excitation
Example induction generator, running before series capacitor is
inserted.
Capacitor
switched inProtection trip is likely
60 Hz
31 Hz (w1)
7 Hz
(w2)
60 Hz
synchronous
speed
7 Hz
synchronous
speed
May 18, 2015

© ABB
| Slide 19
Frequency Response
and Regulation
Energy Storage
Requirements
Interconnection Requirements
Powerfactor & Reactive
Power Requirements
Power Ramp Rate
Requirements
Voltage & Frequency Rid-
through Requirements
Shunt Capacitor
Banks
STATCOM’s etc.
Fault performance
May 18, 2015

© ABB
| Slide 20
Equipment Failures
Parallel Resonance
Voltage Magnification
Step-up Transformer, Surge Arrester, Capacitor
Series Resonance
Current Magnification
WTG
Interconnection Requirements
Conclusions
May 18, 2015

© ABB
| Slide 21
Optimizing performanceEnergy efficient transformers
Aniruddha Narawane, Transformer Engineering Manager
May 18, 2015

© ABB
| Slide 22
Step up transformers with higher
efficiency requirements
Occasional extreme load changes
Step up and step down operation
Higher chances of anomalies than a
conventional distribution transformer
Transformers for wind farmsDistribution transformers or….???
May 18, 2015

© ABB
| Slide 23
BIL
Impedance
Loss limits with other specifications
Type of winding material
DOE regulation
Factors to consider while specifying efficiency
May 18, 2015

© ABB
| Slide 24
Transformer design can be altered to provide a
solution with reduced no-load, load losses or both.
Improvement in performance (efficiency): Cost
and size
Trade off is required between high efficiency (high
initial cost) and life cycle cost savings (loss
evaluation)
No load loss and load loss reduction
Optimal transformer design
May 18, 2015

© ABB
| Slide 25
Harmonics
DC current Injection
Resonance
Frequency variation
Back-feeding the transformer
(Inrush)
Conditions which affect the design and efficiency
May 18, 2015

© ABB
| Slide 26
Optimizing Wind PerformanceStation Service Voltage Transformers
Nick Powers, SSVT Global Product Marketing Manager
May 18, 2015

© ABB
| Slide 27
Getting Power to Remote Sites
Hard to reach places with less
population, general sparse
distribution but transmission access
Direct connection to transmission is
available to connect the substation
Need high reliability and constant
availability from power source
Strive for cost-effective low-loss
power
Need reliable available substation powerPowering wind power substations with SSVTs
SSVT substation
power
May 18, 2015

© ABB
| Slide 28
Compact Power Source
Single step HV to LV for substation
power
46kV to 500kV HV Rating
120/240V, 240V, ….600V LV Output
Power rating from 25kVA to 333kVA
Fully rated insulation (oil or SF6 gas)
for system reliability
Small footprint, easily installed
Station Service Voltage Transformer (SSVT)Hybrid from IVTs & Power Transformer
May 18, 2015

© ABB
| Slide 29
SSVT right-sized power for wind Substation practice – 2 sources of power
Substation Source Options – Pros and Cons
Main power transformer tertiary – Concern over impact of
tertiary cost, higher losses, thru-fault, 3rd Harmonic control
Distribution infrastructure – Remote sites make distribution
less economical, concern on reliability and eco-impact
Small power transformer – Oversized kVA, high losses,
and too expensive for application
Generator or Solar panel – Maintenance intensive and
concern about availability
Station Service VT – High availability, reliable format with
higher cost than inductive VTs due to the Power level
Substation Power Must-Haves
Availability of source and Reliability to keep the lights on
Efficiency of power supply
May 18, 2015
© ABB
| Slide 30
SSVT designed for efficiencyEfficient solution for wind
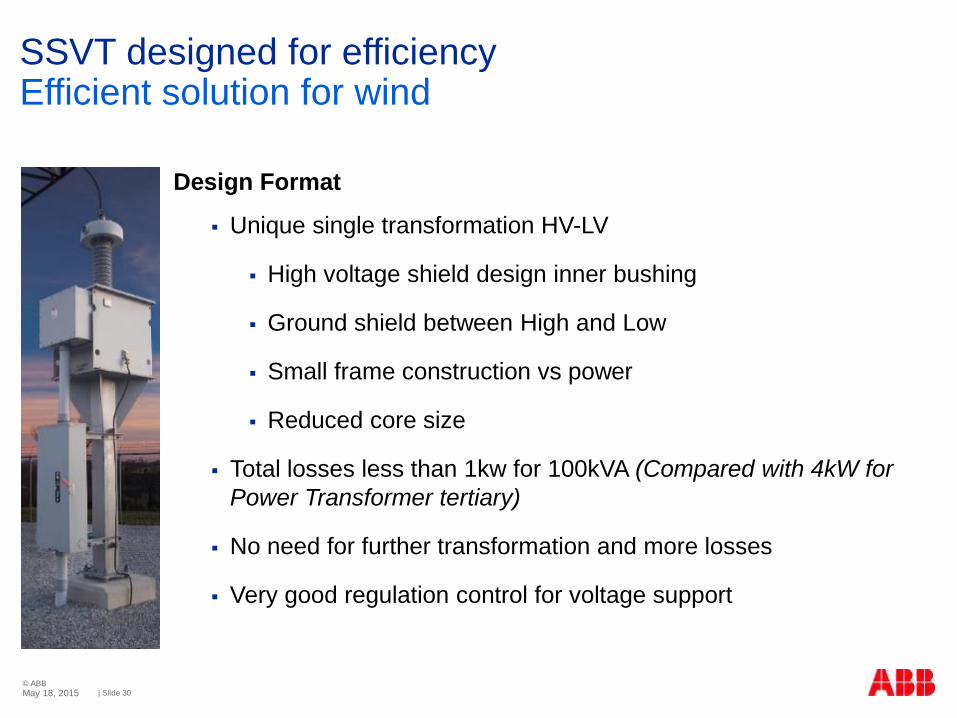
Design Format
Unique single transformation HV-LV
High voltage shield design inner bushing
Ground shield between High and Low
Small frame construction vs power
Reduced core size
Total losses less than 1kw for 100kVA (Compared with 4kW for
Power Transformer tertiary)
No need for further transformation and more losses
Very good regulation control for voltage support
May 18, 2015

© ABB
| Slide 31
SSVT designed for efficiencyRight solution for wind
Compact Power Source
Single step HV to LV for substation power
46kV to 500kV HV fully rated for system reliability
120/240V, 240V, ….600V LV Output
Power rating from 25kVA to 333kVA
Small footprint, easily installed
Reasonable investment
May 18, 2015

© ABB
| Slide 32
Create dedicated distribution feeder
Higher power output
Reduce voltage drop for longer runs
Up to 1MVA power rating
Up to 138kV in Oil and up to 500kV in SF6
SSVT designed for efficiencyMedium Voltage Output
May 18, 2015

© ABB
| Slide 33
SSVT designed for efficiencyPossible future solutions for wind?
Value-Added Application-
Construction Use
Dual use – first for construction,
next for station service
Installed to provide power for Farm
build-out
Should have protection preinstalled
for grid protection
Up to 1MVA power rating
(maximum at 230kV)
May 18, 2015
© ABB
| Slide 34
SSVT designed for efficiencyPossible future solutions for wind?
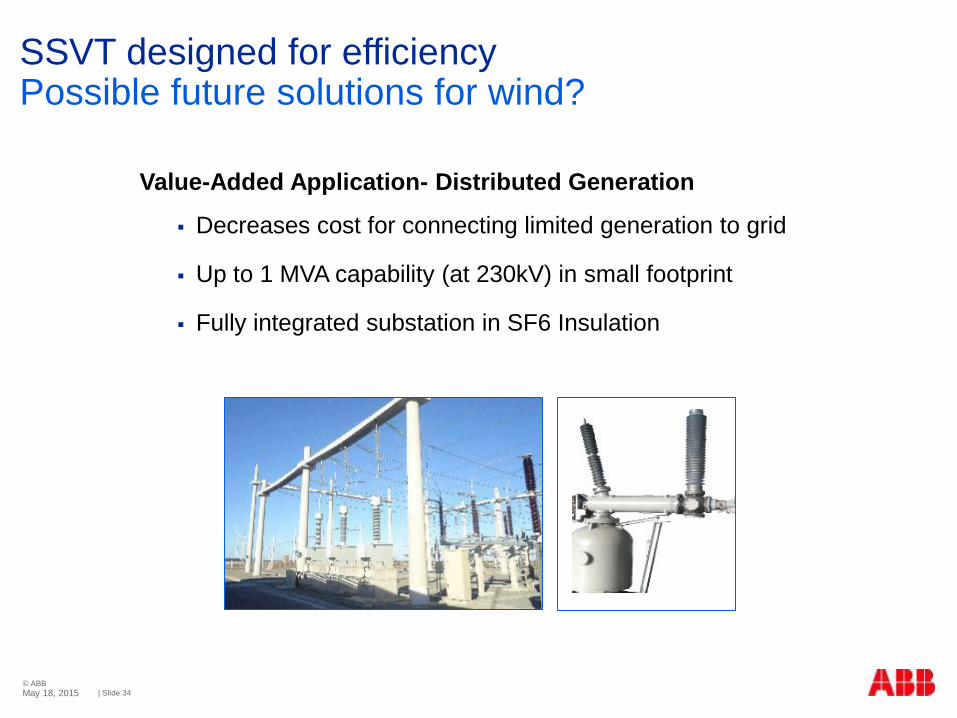
Value-Added Application- Distributed Generation
Decreases cost for connecting limited generation to grid
Up to 1 MVA capability (at 230kV) in small footprint
Fully integrated substation in SF6 Insulation
May 18, 2015

© ABB
| Slide 35
Convenient Efficient Power
Eliminates bringing the tertiary out on main power
transformer
Protects Power Transformer
Controls 3rd Harmonics
Saves Expense
Highly reliable and available control power
Connected to HV Line
Not limited by Power Transformer
Economical and Easily sited
Mounts like VT
Direct connected to HV bus
Small footprint
SSVT designed for efficiencyRight solution for wind
Oil-insulated
SF6-insulated
May 18, 2015

© ABB
| Slide 36
Optimizing performanceGrid connection and energy storage
Pat Hayes, Power Conversion Account Manager
May 18, 2015
© ABB
| Slide 37
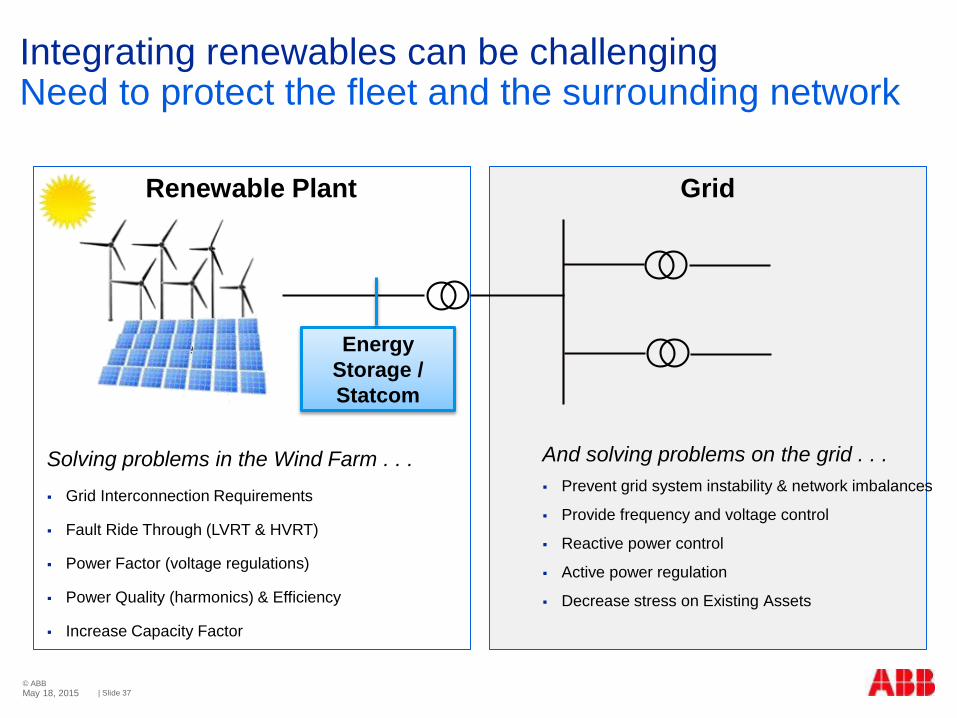
Integrating renewables can be challengingNeed to protect the fleet and the surrounding network
Renewable Plant Grid
Solving problems in the Wind Farm . . .
Grid Interconnection Requirements
Fault Ride Through (LVRT & HVRT)
Power Factor (voltage regulations)
Power Quality (harmonics) & Efficiency
Increase Capacity Factor
And solving problems on the grid . . .
Prevent grid system instability & network imbalances
Provide frequency and voltage control
Reactive power control
Active power regulation
Decrease stress on Existing Assets
Energy
Storage /
Statcom
May 18, 2015

© ABB
| Slide 38
ABB’s Energy Storage EssPro™ SolutionsApplications & Benefits
Peak Shaving UPS
Load Levelling
Frequency Regulation Voltage Support
Capacity firming
Power Station
Wind power
Solar power
Residential loads
Industrial loads
May 18, 2015
© ABB
| Slide 39
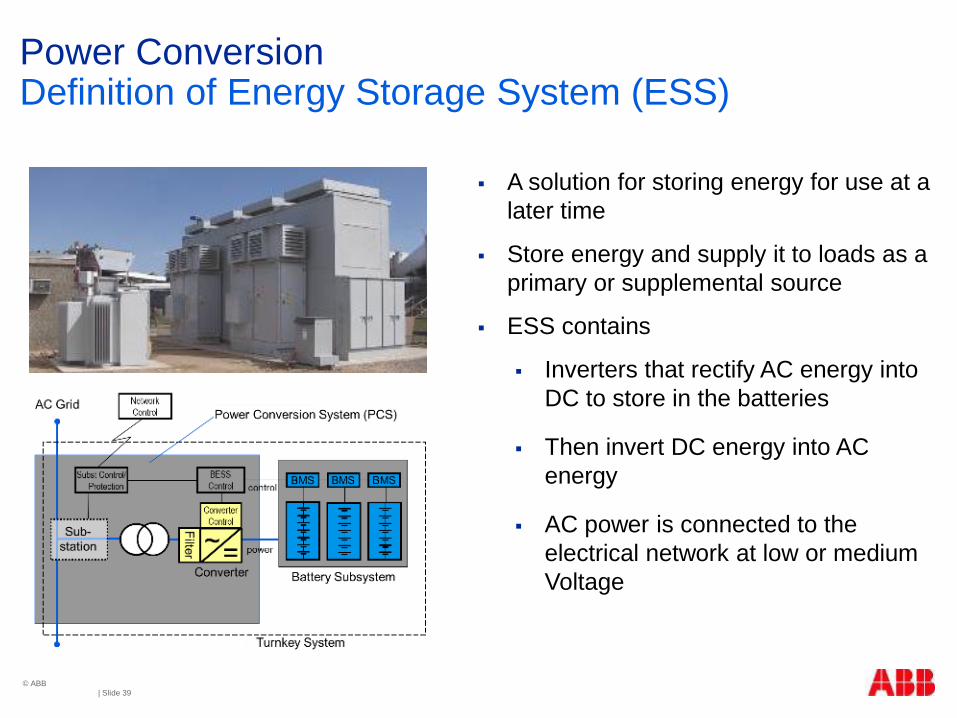
Power ConversionDefinition of Energy Storage System (ESS)
A solution for storing energy for use at a
later time
Store energy and supply it to loads as a
primary or supplemental source
ESS contains
Inverters that rectify AC energy into
DC to store in the batteries
Then invert DC energy into AC
energy
AC power is connected to the
electrical network at low or medium
Voltage

© ABB
| Slide 40
ABB Energy Storage ExperienceSaft / Cowessess Nation / SRC
(Inside)
Customer needs
400 kW / 744 kWh BESS
Wind Integration.
Customer wanted BESS to smooth out wind
turbine output.
Demand Response
Demonstrate Anti-Islanding functionality
Project Details
Li-ion batteries
Installed in 2012
ABB Scope
400 kW PCS including (2) x 200 kW Indoor units
Includes inverters, dc contactors, ac circuit
breakers, control and external isolation/step-
up transformer to 23kV grid
Saft’s IM 20E Container
(1) X 200 kW / 372 kWHr
May 18, 2015

© ABB
| Slide 41
ABB Energy Storage ExperienceSaft / Cowessess Nation / SRC BESS
25kV PCC
ABB
EssPro PCS
ABB Vantage
Controller
Customer Communication
& SCADA / PCC INFORMATION
ABB
EssPro PCS
LOAD GRID
May 18, 2015
© ABB
| Slide 42
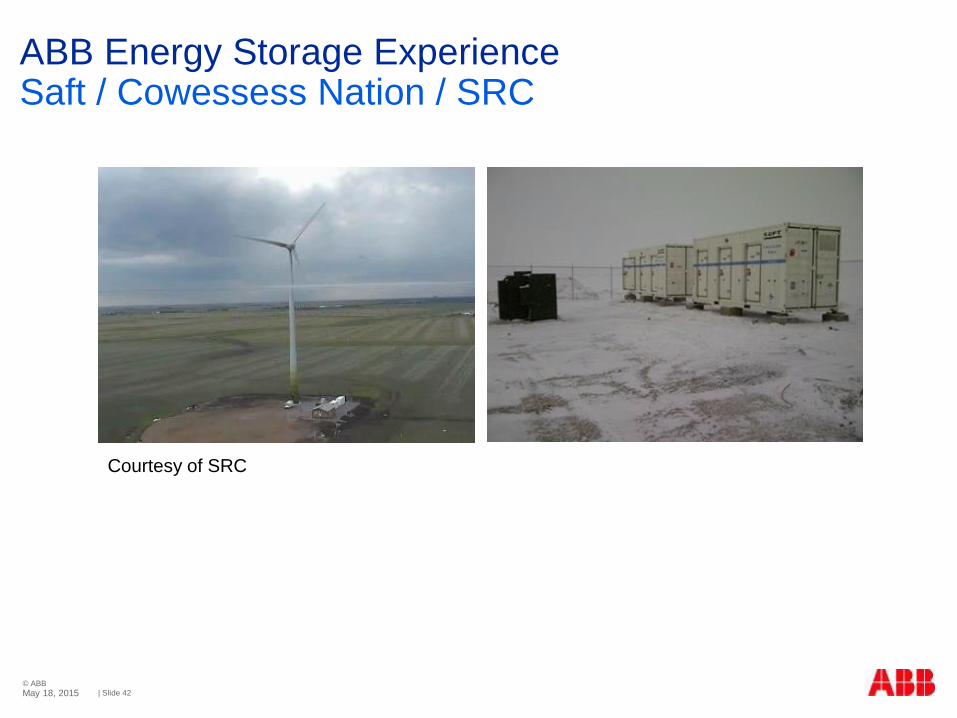
ABB Energy Storage ExperienceSaft / Cowessess Nation / SRC
Courtesy of SRC
May 18, 2015
© ABB
| Slide 43
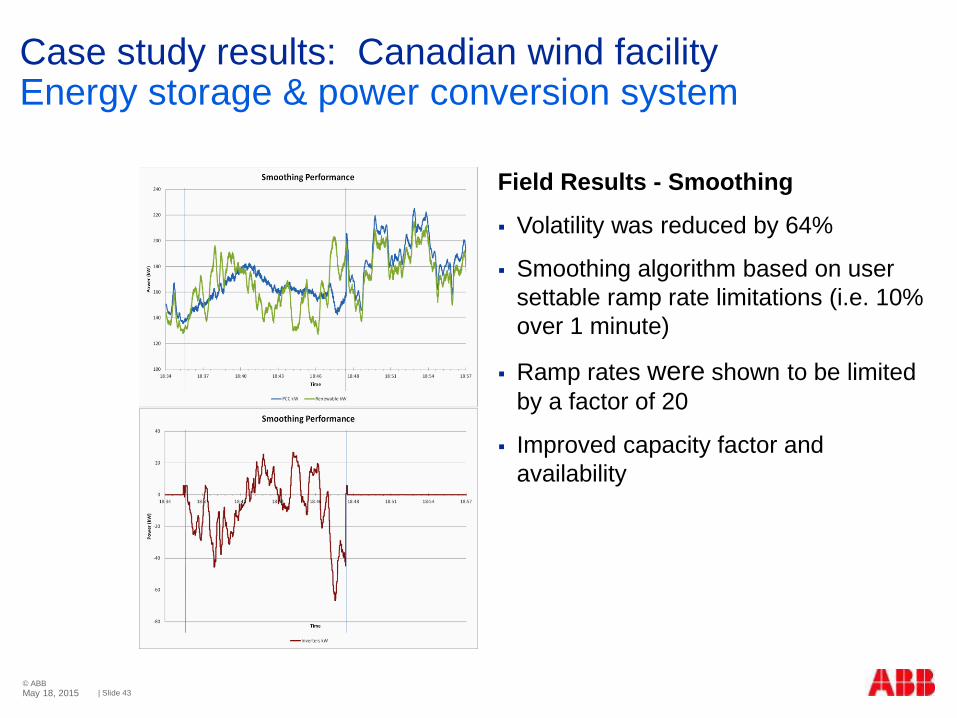
Case study results: Canadian wind facilityEnergy storage & power conversion system
Field Results - Smoothing
Volatility was reduced by 64%
Smoothing algorithm based on user
settable ramp rate limitations (i.e. 10%
over 1 minute)
Ramp rates were shown to be limited
by a factor of 20
Improved capacity factor and
availability
May 18, 2015

© ABB
| Slide 44
STATCOM unique features & capabilitiesEnhancing power quality and network performance
Dynamic VARs: Delivers continuously variable reactive
current
Speed of Response: Rapidly delivers reactive current
on a sub-cycle basis.
Performance at Low Voltages: Is a current injection
device. Reactive power decreases linearly with voltage
(impedance based system’s reactive power decreases
with voltage squared)
Programmable and Versatile: A STATCOM operates
as a self-sufficient voltage or power factor regulator,
and contains highly programmable control systems with
optional features such as capacitor and reactor bank
control, droops, deadbands, etc.
IGrid
XT
~
=
May 18, 2015

© ABB
| Slide 45
ABB’s STATCOM solution appliedPREPA Performance Requirements
LVRT Reactive Power Frequency Stability
Support
All generation to remain
online and be able to
ride-through:
0 p.u. voltage at PCC for 600ms
1.4 p.u. voltage at PCC for
125ms
Must support the grid
with reactive current
injection
The total power factor
range shall be from 0.85
lagging to 0.85 leading.
Renewable facilities are
required to provide
frequency response
support similar to
conventional generators
Additionally, renewable
facilities must not
contribute to frequency
instabilities
Limiting ramp rate to
10% of nameplate
output per minute.
May 18, 2015

© ABB
| Slide 46
ABB’s STATCOM solution appliedNaguabo, Puerto Rico
A Puerto Rican wind farm required
dynamic reactive compensation support
power factor and voltage control
System comprised of
13 x 1.8 MW wind turbines connected to
a 34.5 kV collector grid for a total
capacity of 23.4 MW
Dynamic simulations showed the ABB
STATCOM voltage control system able
to meet PREPA’s Minimum Technical
Requirements
May 18, 2015

© ABB
| Slide 47
ABB’s STATCOM Solution AppliedNaguabo, Puerto Rico
±12 MVAR ABB STATCOM
1 x 5 MVAR Switched
Capacitor Bank
1 x 4 MVAR Reactor
STATCOM system provided
reactive power and voltage
control
Automatically used its rapid
speed of response and
overload to assist in LVRT and
HVRT
May 18, 2015

© ABB
| Slide 48
PREPA minimal technical requirementFrequency response & ramp rate control
59.2
59.4
59.6
59.8
60
60.2
60.4
60.6
60.8
-1.5 -1 -0.5 0 0.5 1 1.5
Po
int
of
Co
ntr
ol F
req
ue
ncy
(H
z.)
BESS Active Power Output (MW)
Frequency Regulation - BESS Output (MW) versus Frequency (Hz) Frequency Response
Frequency regulation on 5%
droop
Major frequency events +/-0.3
Hz
Farm must inject or absorb
real power up to 10% of
nameplate
Speed of response 1 second
Ramp Rate Control
Limit to 10% of farm
nameplate per minute
May 18, 2015

© ABB
| Slide 49
Frequency Response Solution (ESS PCS)Example PCS BESS analysis for wind farm
59.60
59.70
59.80
59.90
60.00
60.10
60.20
60.30
60.40
0 100 200 300 400 500 600 700 800 900
Fre
qu
en
cy (
Hz)
Time Step
10 MW PVF - PCC Frequency
MaxFreq MinFreq
May 18, 2015

© ABB
| Slide 50
Frequency Response Solution (ESS PCS) PCS BESS analysis for wind farm- areas of operation
59.60
59.70
59.80
59.90
60.00
60.10
60.20
60.30
60.40
0 100 200 300 400 500 600 700 800 900
Fre
qu
en
cy (
Hz)
Time Step
10 MW PVF - PCC Frequency
MaxFreq MinFreq
May 18, 2015

© ABB
| Slide 51
ABB’s STATCOM Solution AppliedVoltage support for a Micro-grid in Alaska
An Alaskan village on a wind/diesel micro-
grid 30 miles above the arctic circle
required dynamic voltage regulation
Terrain consisting of tundra and
permafrost with little infrastructure in place
The diesel generator was used to provide
reactive power regardless of active power
output
ABB supplied a 1 MVAr STATCOM unit
with transformer for reactive power control
This alleviated the diesel generator,
reducing stress to the micro-grid and
saving fuel costs
ABB’s STATCOM Solution AppliedVoltage support for a Micro-grid in Alaska
May 18, 2015

© ABB
| Slide 52
BreakPlease return at 2:40
May 18, 2015

© ABB
| Slide 53
Improving forecasting capabilities SCADA Solutions
Sameer Kapoor, Senior Business Development Manager, Power Generation NAM, Greenfield
May 18, 2015

© ABB
| Slide 54
Challenges
May 18, 2015
Dispersed and dynamic generation resource impacting planning and forecasting
Scale performance of an environment comprising turbines from multiple manufacturers and various control technologies
Optimize production by improving Turbine performance

© ABB
| Slide 55
Efficient Operations- Turbine
Month DD, Year
|
Sli
© ABB
Group
Ergonomic HMI to visualize all
relevant process data from the plant,
grid connection and weather stations
Improved reaction time through
structuring and visualization of critical
data in a high level displays

© ABB
| Slide 56
Real Time Monitoring- Wind Farm
Month DD, Year
|
Sli
© ABB
Group
IEC based information model for each
turbines
Integration of generation and electrical
systems into a single information model
Efficient engineering and additions of
new farms and new turbines into the
system

© ABB
| Slide 57
Unified Information Flow -Wind Fleet
Month DD, Year
|
Sli
© ABB
Group
Real time monitoring of assets, with HMI
refresh rate of a second
Flexible configuration of data retention
policies
Leverages Big Data for superior insights
into fleet level performance leading to
better decisions

© ABB
| Slide 58
Centralized management
Real Time MonitoringUnified information
modelEfficient operations
Real time monitoring of
assets, with HMI refresh
rate of a second
Integration of generation
and electrical systems into
a single information model
Ergonomic HMI to visualize
all relevant process data
from the farm, grid
connection and weather
stations
May 18, 2015
© ABB
| Slide 59
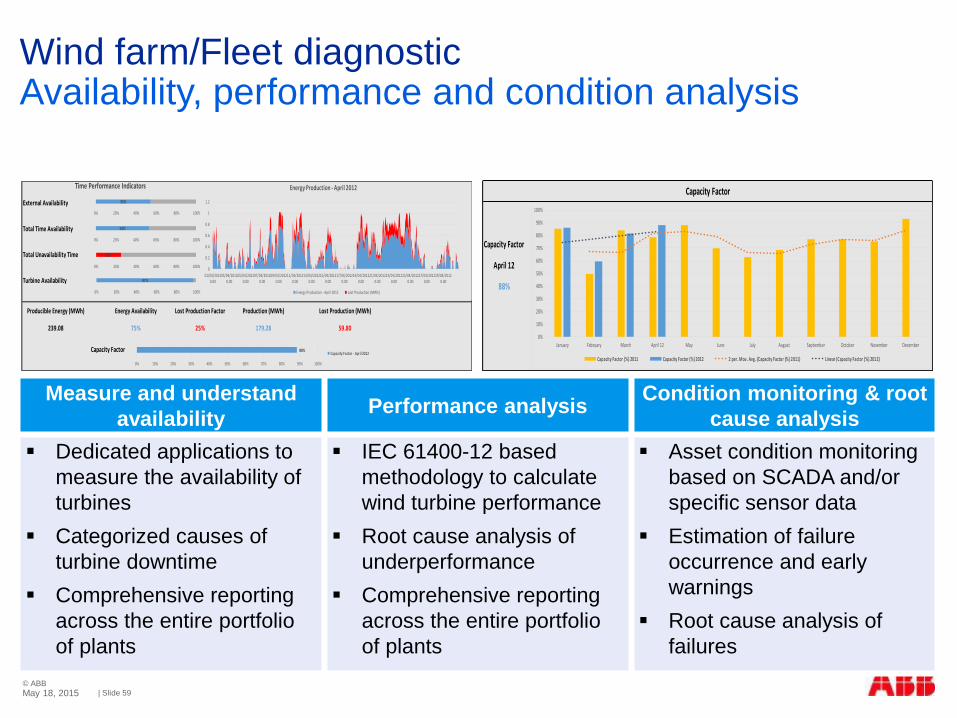
Wind farm/Fleet diagnosticAvailability, performance and condition analysis
Measure and understand
availabilityPerformance analysis
Condition monitoring & root
cause analysis
Dedicated applications to
measure the availability of
turbines
Categorized causes of
turbine downtime
Comprehensive reporting
across the entire portfolio
of plants
IEC 61400-12 based
methodology to calculate
wind turbine performance
Root cause analysis of
underperformance
Comprehensive reporting
across the entire portfolio
of plants
Asset condition monitoring
based on SCADA and/or
specific sensor data
Estimation of failure
occurrence and early
warnings
Root cause analysis of
failures
External Availability
Total Time Availability
Total Unavailability Time
Turbine Availability
Time Performance Indicators
Production (MWh)
179.28
Lost Production (MWh)
59.80239.08
Energy Availability
75%
Lost Production Factor
25%
Producible Energy (MWh)
Capacity Factor
53%
0% 20% 40% 60% 80% 100%
25%
0% 20% 40% 60% 80% 100%
97%
0% 20% 40% 60% 80% 100%
55%
0% 20% 40% 60% 80% 100%
0
0.2
0.4
0.6
0.8
1
1.2
01/04/20120.00
03/04/20120.00
05/04/20120.00
07/04/20120.00
09/04/20120.00
11/04/20120.00
13/04/20120.00
15/04/20120.00
17/04/20120.00
19/04/20120.00
21/04/20120.00
23/04/20120.00
25/04/20120.00
27/04/20120.00
29/04/20120.00
Energy Production - April 2012
Energy Production - April 2012 Lost Production (MWh)
88%
0% 10% 20% 30% 40% 50% 60% 70% 80% 90% 100%
Capacity Factor - April 2012
Capacity Factor
April 12
Capacity Factor
88%
0%
10%
20%
30%
40%
50%
60%
70%
80%
90%
100%
January February March April 12 May June July August September October November December
Capacity Factor (%) 2011 Capacity Factor (%) 2012 2 per. Mov. Avg. (Capacity Factor (%) 2011) Linear (Capacity Factor (%) 2012)
May 18, 2015

© ABB
| Slide 60
Enterprise SCADA For wind fleet management
Wind Farm Control STATCOM Grid StabilizationSubstationAsset Controllers Energy Storage
ENTERPRISE SCADA SOLUTION
Service & Maintenance Grid operator
Power and price
forecastingPower
management
Real time monitoring
Market operator
Wind Farm Diagnostics
Condition
Monitoring
Modbus IEC104Modbus IEC104 & OPC IEC 61850Modbus
Modbus IEC104Modbus IEC104
May 18, 2015

© ABB
| Slide 61
Spinner anemometer iSpin from ROMO Wind
More precise wind speed and direction
measurements as compared to the traditional
nacelle anemometry
Patented concept and data can be wirelessly
transferred to control center
Three Sonic sensors dispersed across
spinners
Precisely measures wind speed & direction.
Future development include turbulence, wind
shear and flow inclination
Independent measuring device & alternate to
nacelle anemometry
Calculated power curve scales potential of
power production from each turbine
Technology
Capabilities
Value
May 18, 2015

© ABB
| Slide 62
Yaw misalignment = Lower production
0%
2%
4%
6%
8%
10%
12%
0 5 10 15 20
Lo
st P
rod
uctio
n [%
]
Yaw Misalignment [degrees]
Functions of lower production by yaw
misalignments Yaw misalignments Lower production
4° 0.5%
6° 1.1%
8° 1.9%
10° 3.0%
12° 4.3%
16° 5.9%
14° 7.6%
18° 9.5%
May 18, 2015

© ABB
| Slide 63
Good yaw control Average yaw control Bad yaw control
Correcting Yaw misalignment
May 18, 2015
© ABB
| Slide 64
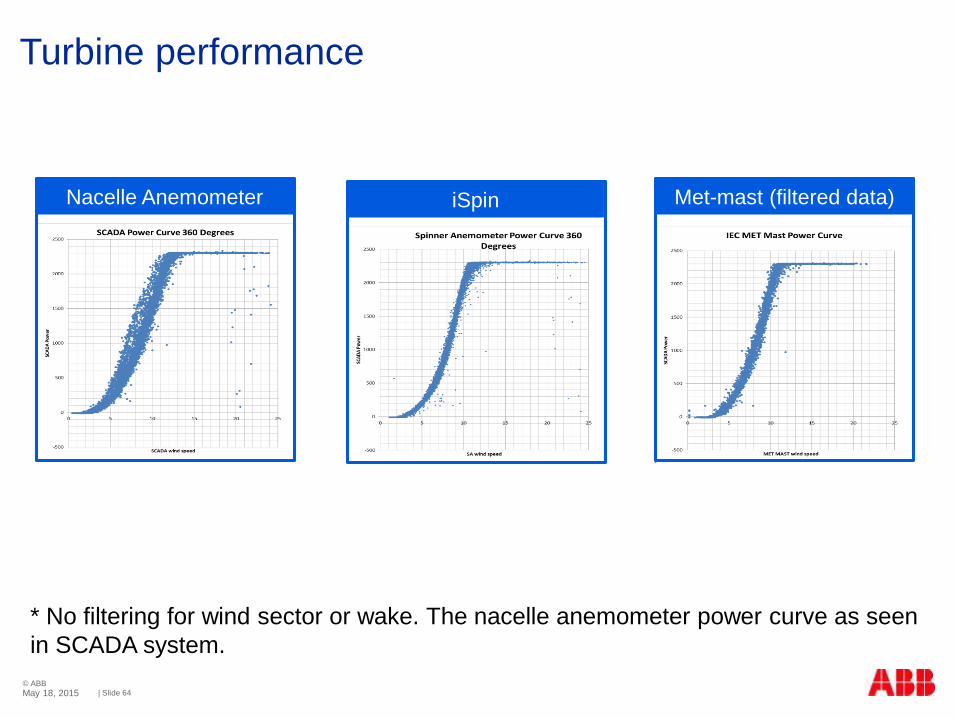
* No filtering for wind sector or wake. The nacelle anemometer power curve as seen
in SCADA system.
Met-mast (filtered data)iSpinNacelle Anemometer
Turbine performance
May 18, 2015

© ABB
| Slide 65
Remote management of renewables
93 renewable energy plants of multiple
types: Wind, Solar, Hydro, Biomass and
Geothermal
North America
Total 1673 MW Total plants 93
May 18, 2015

© ABB
| Slide 66
Remote management of renewables
Monitoring and Control Center for
Wind, Solar & Hydro plants
Disaster Recovery Control Center
Italy
Total 3068 MW Total plants 403
May 18, 2015

© ABB
| Slide 67
Symphony Plus for Wind
Customer benefits
Symphony Plus for Wind
Integrates all assets into a
single management
system
Provides monitoring, control and forecasting
Enables fleet management and energy trading of
renewables
Improves Operations &
Maintenance of entire fleet
Improves performance of
assets
Global and local support
from a leading technology
provider
May 18, 2015
© ABB
| Slide 68
Improving forecasting capabilitiesEnterprise Software
Clinton Davis, VP, Renewable Solutions
May 18, 2015
© ABB
| Slide 69
2.2 Billion Unique Forecasts
50 Terabytes of Weather Data
May 18, 2015

© ABB
| Slide 70
Evolution of forecasting and operation
Visibility
Visibility & Optimal Control
Predict
Network
Issues
Proactively
Address
Network
Issues
May 18, 2015
© ABB
| Slide 71
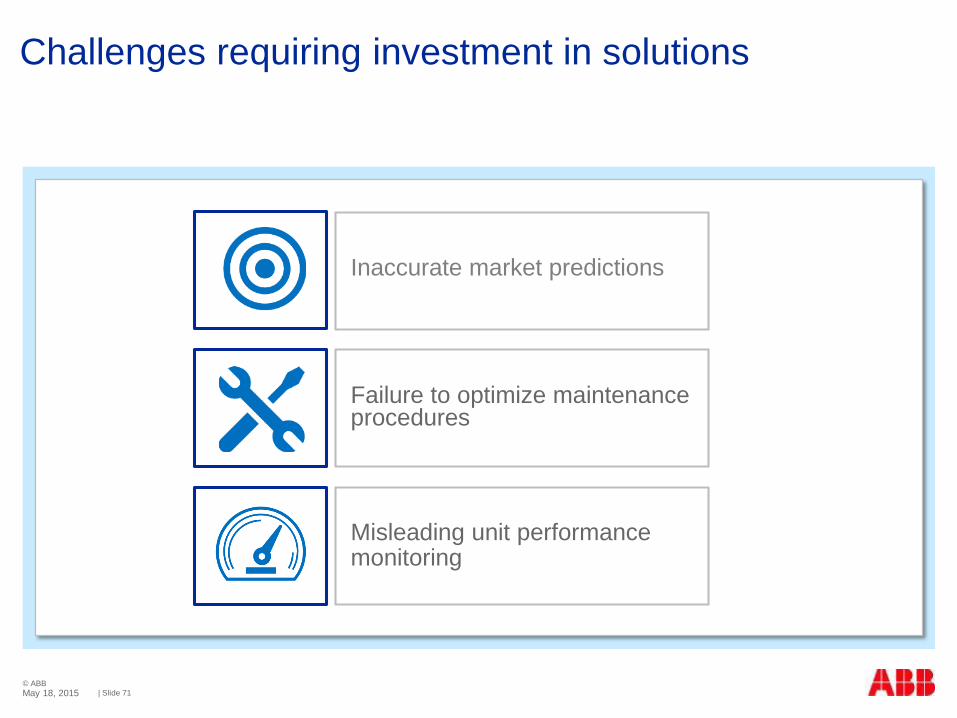
Challenges requiring investment in solutions
Inaccurate market predictions
Failure to optimize maintenance procedures
Misleading unit performance monitoring
May 18, 2015

© ABB
| Slide 72
Market losses
Work crew safety
Asset health
Cost of inefficient business execution
May 18, 2015
© ABB
| Slide 73
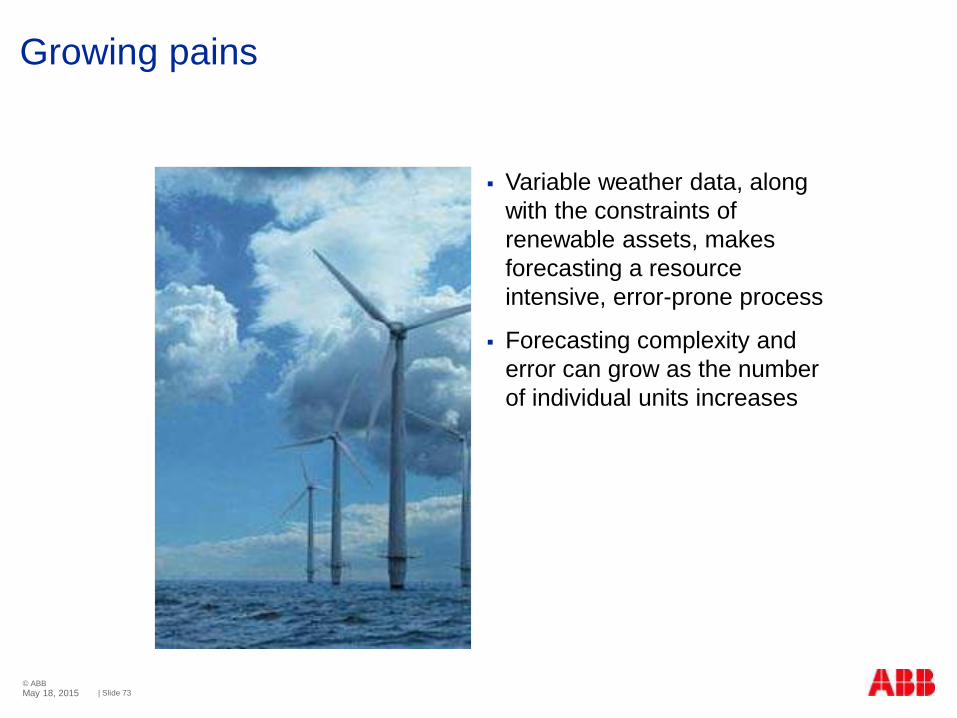
Variable weather data, along
with the constraints of
renewable assets, makes
forecasting a resource
intensive, error-prone process
Forecasting complexity and
error can grow as the number
of individual units increases
Growing pains
May 18, 2015

© ABB
| Slide 74
What can be improved?Wind forecasting lifecycle
PlanningPreparation
& Scheduling
OperatePost
Analysis
May 18, 2015

© ABB
| Slide 75
Geographical diversity
Resource aggregation
Joint asset ownership
Unbundling of physical energy and renewable energy
credits
Visibility
May 18, 2015

© ABB
| Slide 76
Model from asset
registration to operations
and reporting
Model unique constraints
of renewable energy
Capture unique assets
and their connectivity
Model accuracy drives forecasts
May 18, 2015

© ABB
| Slide 77
Complex renewable transactions and intermittent
output make energy accounting difficult and time
consuming
Enterprise software can enable accurate accounting
and support auditing
Accounting improvements
May 18, 2015

© ABB
| Slide 78
Day-ahead, intra-day and
mid-term forecasts
Monitoring of actual vs.
nameplate (power curve)
vs. forecasted power
production
Wind Power Automatic
Generation Control (AGC)
Energy portfolio
optimization applications
Generation applications
May 18, 2015
© ABB
| Slide 79
Improved planning
Efficient operation & maintenance of fleet
Prediction of future issues allows mitigation plans
Forecasting benefits
May 18, 2015

© ABB
| Slide 80
Forecasting in action
May 18, 2015

© ABB
| Slide 81
Renewable integration
Demand response
Gotland projectVattenfall, Visby
May 18, 2015

© ABB
| Slide 82
30% of Gotland’s electricity comes from locally
produced wind power
Additional 1000 MW Planned
Software used to forecasts wind, load, and
demand response
Grid integration
“Wind- and solar
power is produced far
out in the distribution
grid, presenting great
challenges to power
quality and control of
the grid”
May 18, 2015

© ABB
| Slide 83
Value of Enterprise Software Solutions
Know the cost of getting work
completed
Confidence that your fleet is operating at
peak performance
Work done right ensures quality and
safety
Knowledge
Performance
Quality
May 18, 2015

© ABB
| Slide 84
Wind farm value chain
Plan Wind PowerOperate &
maintain
CollectConnect to
the grid
Control &
manage
May 18, 2015

© ABB
| Slide 85
An overview of ABB in windProducts and solutions from turbines to towns
Wind Turbine
HV Breakers
& Switches
Wind Farm
Collection & BOP
LV Protection &
Control Products,
Turbine Controllers
HVDC
Cables
HVAC
Cables
Offshore
HVDC Station
MV Submarine
Cables
Offshore
Substation
FACTS, SVC,
STATCOM
Grid Connection
& Transmission
Power
Transformers
Power
Transformers
Generators
& Mechanical
MV Dry
Transfomers
DC Converter
Station
Energy
Storage:
- Central
- Substation
- Community
LV & MV
Converters
Control & Aux
Motors & VSDs
Robotic
Paint
Systems
Distribution
Equipment
& Systems Turnkey
& Compact
Substations
HV & MV
Switchgear,
Transformers,
Capacitors,
Sensors,
Controls
Utility
Distribution
Power Systems Consulting, Wind Farm Optimization & Automation, Grid Integration, Communication Networks,
Substation & Distribution Automation, Energy Management
Wind Farm
Controls &
Asset Health
May 18, 2015

© ABB
| Slide 86
Questions?
May 18, 2015

© ABB
| Slide 87
Wind Farm Best Practices
Speakers
Dennis McKinley
Director, Wind Power
Solutions NAM
Vythahavya Vadlamani
Senior Consulting
Engineer
Aniruddha Narawane
Transformer Engineering
Manager
Nick Powers
Global Product
Marketing Manger, HVIT
Pat Hayes
Business Development
Manager, Energy Storage
Sameer Kapoor
Sr. BDM,
Power Generation NAM
Clinton Davis
VP, Renewable Solutions
May 18, 2015