aviva 2017 interim results analyst presentation
TRANSCRIPT

Interim Results 2017
2
Disclaimer Cautionary statements: This should be read in conjunction with the documents distributed by Aviva plc (the “Company” or “Aviva”) through The Regulatory News Service (RNS). This presentation contains, and we may make other verbal or written “forward-looking statements” with respect to certain of Aviva’s plans and current goals and expectations relating to future financial condition, performance, results, strategic initiatives and objectives. Statements containing the words “believes”, “intends”, “expects”, “projects”, “plans”, “will,” “seeks”, “aims”, “may”, “could”, “outlook”, “likely”, “target”, “goal”, “guidance”, “trends”, “future”, “estimates”, “potential” and “anticipates”, and words of similar meaning, are forward-looking. By their nature, all forward-looking statements involve risk and uncertainty. Accordingly, there are or will be important factors that could cause actual results to differ materially from those indicated in these statements. Aviva believes factors that could cause actual results to differ materially from those indicated in forward-looking statements in the presentation include, but are not limited to: the impact of ongoing difficult conditions in the global financial markets and the economy generally; the impact of simplifying our operating structure and activities; the impact of various local and international political, regulatory and economic conditions; market developments and government actions (including those arising from the referendum on UK membership of the European Union); the effect of credit spread volatility on the net unrealised value of the investment portfolio; the effect of losses due to defaults by counterparties, including potential sovereign debt defaults or restructurings, on the value of our investments; changes in interest rates that may cause policyholders to surrender their contracts, reduce the value of our portfolio and impact our asset and liability matching; the impact of changes in short or long term inflation; the impact of changes in equity or property prices on our investment portfolio; fluctuations in currency exchange rates; the effect of market fluctuations on the value of options and guarantees embedded in some of our life insurance products and the value of the assets backing their reserves; the amount of allowances and impairments taken on our investments; the effect of adverse capital and credit market conditions on our ability to meet liquidity needs and our access to capital; changes in, or restrictions on, our ability to initiate capital management initiatives; changes in or inaccuracy of assumptions in pricing and reserving for insurance business (particularly with regard to mortality and morbidity trends, lapse rates and policy renewal rates), longevity and endowments; a cyclical downturn of the insurance industry; the impact of natural and man-made catastrophic events on our business activities and results of operations; our reliance on information and technology and third-party service providers for our operations and systems; the inability of reinsurers to meet obligations or unavailability of reinsurance coverage; increased competition in the UK and in other countries where we have significant operations; regulatory approval of extension of use of the Group’s internal model for calculation of regulatory capital under the European Union’s Solvency II rules; the impact of actual experience differing from estimates used in valuing and amortising deferred acquisition costs (“DAC”) and acquired value of in-force business (“AVIF”); the impact of recognising an impairment of our goodwill or intangibles with indefinite lives; changes in valuation methodologies, estimates and assumptions used in the valuation of investment securities; the effect of legal proceedings and regulatory investigations; the impact of operational risks, including inadequate or failed internal and external processes, systems and human error or from external events (including cyber attack); risks associated with arrangements with third parties, including joint ventures; our reliance on third-party distribution channels to deliver our products; funding risks associated with our participation in defined benefit staff pension schemes; the failure to attract or retain the necessary key personnel; the effect of systems errors or regulatory changes on the calculation of unit prices or deduction of charges for our unit-linked products that may require retrospective compensation to our customers; the effect of fluctuations in share price as a result of general market conditions or otherwise; the effect of simplifying our operating structure and activities; the effect of a decline in any of our ratings by rating agencies on our standing among customers, broker-dealers, agents, wholesalers and other distributors of our products and services; changes to our brand and reputation; changes in government regulations or tax laws in jurisdictions where we conduct business, including decreased demand for annuities in the UK due to proposed changes in UK law; the inability to protect our intellectual property; the effect of undisclosed liabilities, integration issues and other risks associated with our acquisitions; and the timing/regulatory approval impact, integration risk, and other uncertainties, such as non-realisation of expected benefits or diversion of management attention and other resources, relating to announced acquisitions and pending disposals and relating to future acquisitions, combinations or disposals within relevant industries; the policies, decisions and actions of government or regulatory authorities in the UK, the EU, the US or elsewhere, including the implementation of key legislation and regulation. For a more detailed description of these risks, uncertainties and other factors, please see ‘Other information – Shareholder Information – Risks relating to our business’ in Aviva’s most recent Annual Report. Aviva undertakes no obligation to update the forward looking statements in this presentation or any other forward-looking statements we may make. Forward-looking statements in this presentation are current only as of the date on which such statements are made.
Mark Wilson Group Chief Executive

4
Operating profit Cash
Performance highlights
£1,465m +11%
Operating EPS 25.8p, +15%
£1,170m cash remittances
+56%
8.40p per share
+13%
Interim dividend
Capital
Solvency II ratio 193%1
Capital Generation £1.1bn
All footnotes on page 27
5
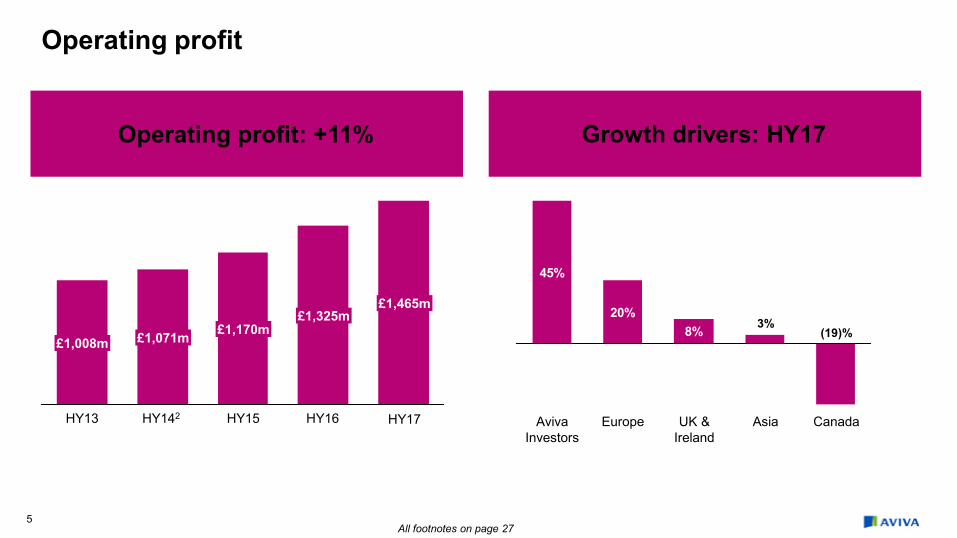
Operating profit: +11%
Operating profit
£1,325m
£1,008m
£1,465m
£1,071m £1,170m
Growth drivers: HY17
HY13 HY15 HY16 HY17 HY142
20%
45%
8%
Aviva Investors
Europe Canada Asia UK & Ireland
3% (19)%
All footnotes on page 27

6
Capital & cash
180%174%
189% 193%
FY15 HY16 FY16 HY17
Solvency II cover ratio1
SII Capital Generation
£1.1bn
Cash remittances
£1,170m
180%
150%
All footnotes on page 27

7
Interim dividend
Interim dividend up 13%
5.60p 5.85p6.75p
7.42p8.40p
HY17 HY16 HY15 HY14 HY13
Interim dividend
8.40p
2017 share buyback
£300m
All footnotes on page 27

25%
7% 6% 5%
8
Growth
29% 27%20%
13% 11%
France savings4
UK annuities &
equity release
Europe savings
& pensions (excl.
France)4
UK protection
Europe Protection4
Asia4 UK pension
(4)%
Life insurance General insurance
(28)%
New business volumes3 Net written premiums
Canada4 UK personal lines
UK commercial property & specialty
Europe4 UK commercial
motor
75%
All footnotes on page 27

Growing
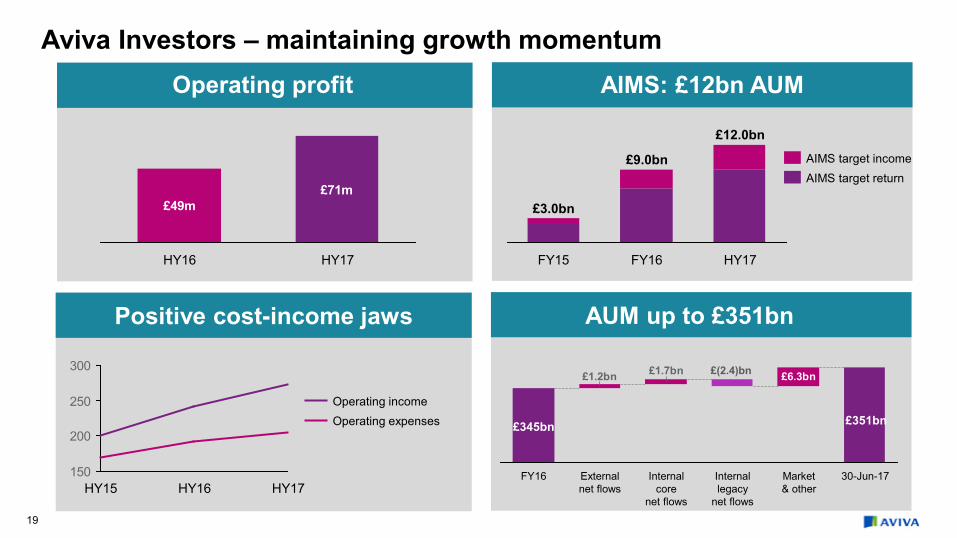
Operating profit £71m (+45%) Operating margin 26% (+6pp)
Winning mandates
Diversifying products
External appeal increasing
Progress on multiple fronts
Aviva Investors
£246bn£290bn
£345bn £351bn
HY17 FY16 FY15 FY14
Assets under management
9
£45bn £44bn£57bn
£72bn
FY16 FY15 FY14 HY17
External AUM

10
Digital
Trading Strategic Disruption
• 6m registrations5 (+28%)
• GI premiums £525m6 (+13%), c25% of total UKGI sales
• MyAviva: higher propensity to buy 2nd product
• 45% new business sales to existing customers
• Foundations in place
• Unlocking back-books
• Strategic partnerships
• Product innovation
• Leading IP
• Using robotics and AI
• Data & risk analytics
• Ask it Never
• Rewarding loyalty
All footnotes on page 27
11
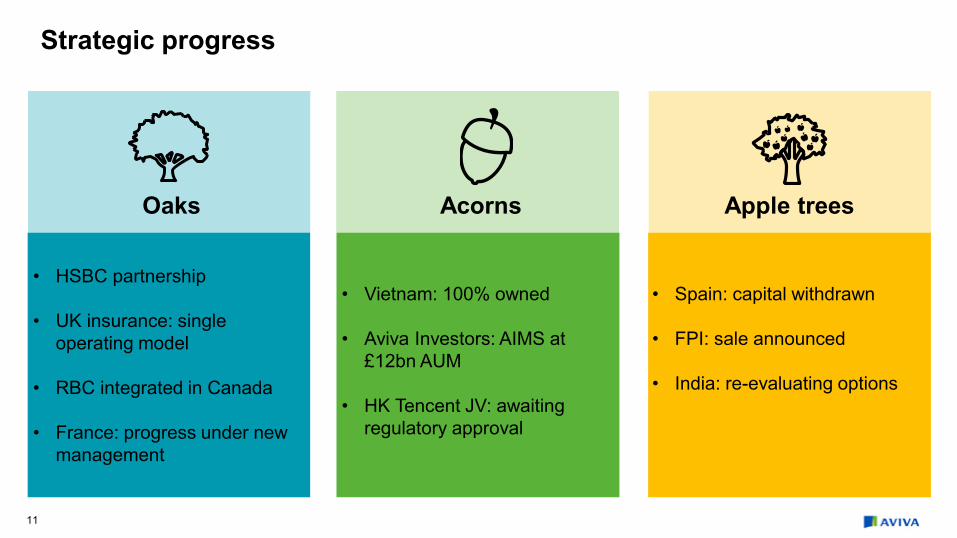
Strategic progress
Oaks Acorns Apple trees
• HSBC partnership
• UK insurance: single operating model
• RBC integrated in Canada
• France: progress under new management
• Vietnam: 100% owned
• Aviva Investors: AIMS at £12bn AUM
• HK Tencent JV: awaiting regulatory approval
• Spain: capital withdrawn
• FPI: sale announced
• India: re-evaluating options

12
Capital management
Additional inflows
• Special remittances
• Disposals
Discretionary deployment
• Bolt-on M&A
• Debt repayment
• Share buyback
Underlying inflows
• Capital generation
• Remittances
Core usage
• Dividend
• Organic growth
Cash
and
capital

13
Checklist
Grow dividend
Grow operating profit
Reallocate capital
11% growth
13% growth, on track for 50% pay-out ratio
Announced disposals, improved focus
Digital Further progress, focused on leading IP
Strong capital 193%1, £300m buyback in 2017
All footnotes on page 27
Tom Stoddard Chief Financial Officer

15
Operating profit (£m) HY16 HY17 Change
UK & Ireland life 711 756 6%
UK & Ireland general insurance & health7 222 259 17%
Aviva Investors 49 71 45%
Canada 88 71 (19)%
Europe 430 518 20%
Asia 112 115 3%
Corporate costs, non insurance & other (132) (166) (26)%
Group debt & other interest costs7 (155) (159) (3)%
Operating profit 1,325 1,465 11%
Operating profit
Operating profit £1,465m
Up 11%
Operating EPS
25.8p
Up 15%
All footnotes on page 27
16
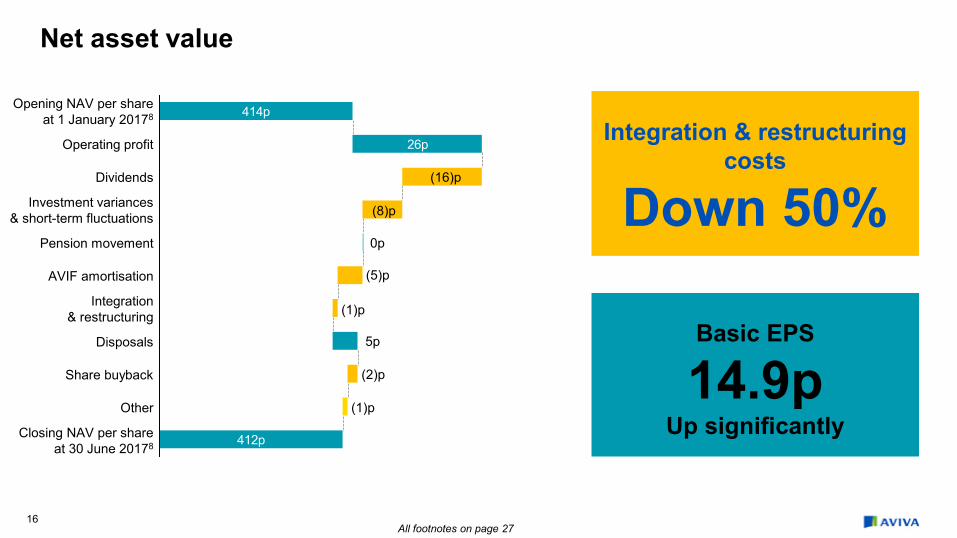
Net asset value
Integration & restructuring
costs
Down 50%
Basic EPS
14.9p Up significantly
412p
26p
414p
Closing NAV per share at 30 June 20178
Other
Share buyback
Disposals
Integration & restructuring
AVIF amortisation
Pension movement
Investment variances & short-term fluctuations
Dividends
Operating profit
Opening NAV per share at 1 January 20178
(1)p
(2)p
(1)p
(5)p
(8)p
(16)p
5p
0p
All footnotes on page 27
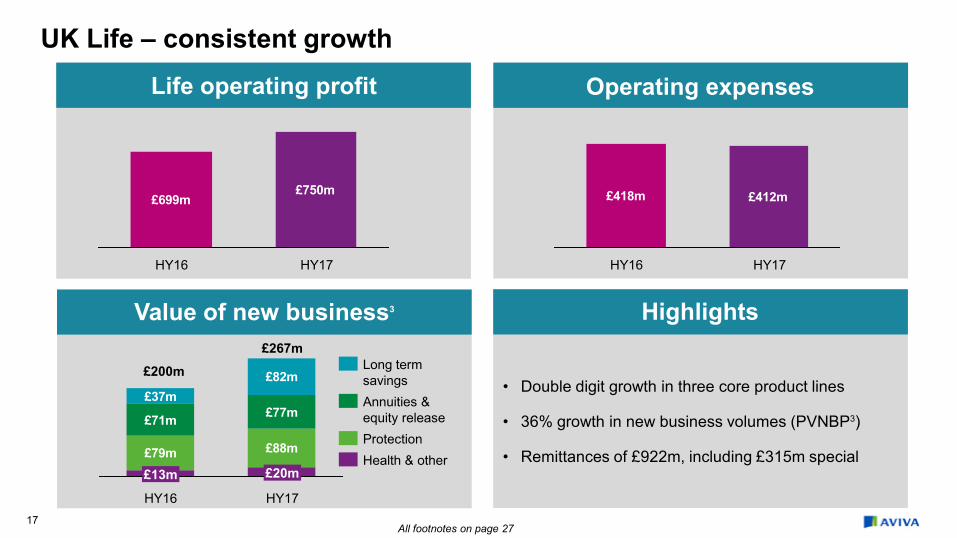
• Double digit growth in three core product lines
• 36% growth in new business volumes (PVNBP3)
• Remittances of £922m, including £315m special
17
Operating expenses
Life operating profit
£699m£750m
HY16 HY17
UK Life – consistent growth
Highlights
Value of new business3
£200m
£418m £412m
HY16 HY17
£79m £88m
£71m £77m£37m
£82m
HY16 HY17
£267m
£20m £13m
Long term savings Annuities & equity release Protection Health & other
All footnotes on page 27
18
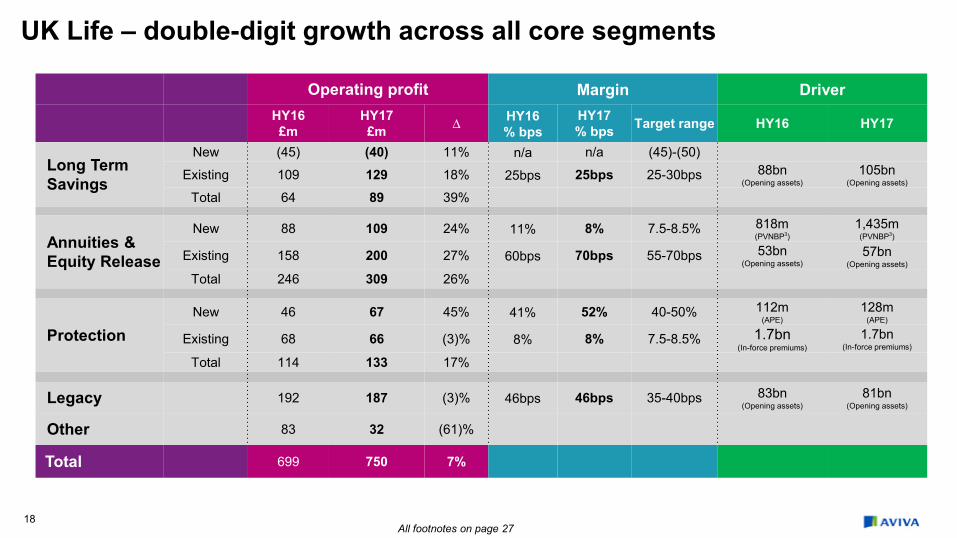
Operating profit Margin Driver HY16
£m HY17 £m ∆ HY16
% bps HY17 % bps Target range HY16 HY17
Long Term Savings
New (45) (40) 11% n/a n/a (45)-(50)
Existing 109 129 18% 25bps 25bps 25-30bps 88bn (Opening assets)
105bn (Opening assets)
Total 64 89 39%
Annuities & Equity Release
New 88 109 24% 11% 8% 7.5-8.5% 818m (PVNBP3)
1,435m (PVNBP3)
Existing 158 200 27% 60bps 70bps 55-70bps 53bn (Opening assets)
57bn (Opening assets)
Total 246 309 26%
Protection New 46 67 45% 41% 52% 40-50% 112m
(APE) 128m
(APE)
Existing 68 66 (3)% 8% 8% 7.5-8.5% 1.7bn (In-force premiums)
1.7bn (In-force premiums)
Total 114 133 17%
Legacy 192 187 (3)% 46bps 46bps 35-40bps 83bn (Opening assets)
81bn (Opening assets)
Other 83 32 (61)%
Total 699 750 7%
UK Life – double-digit growth across all core segments
All footnotes on page 27
19
Aviva Investors – maintaining growth momentum
Operating profit
Positive cost-income jaws
AIMS: £12bn AUM
150
200
250
300
HY17 HY16 HY15
Operating expenses Operating income
HY17
£12.0bn
FY16
£9.0bn
FY15
£3.0bn
AIMS target return AIMS target income
£49m£71m
HY17 HY16
AUM up to £351bn
£1.7bn£1.2bn £6.3bn
30-Jun-17 Market & other
Internal legacy
net flows
Internal core
net flows
External net flows
FY16
£(2.4)bn
£345bn £351bn

20
Combined operating ratio9
Net written premiums
UK & Ireland GI – organic growth, improved margins Operating profit
• Broad-based growth and continued mix optimisation
• Ireland NWP up 12% in constant currency
• HSBC win to support future growth
Highlights
£2,180m
HY16 HY17
Reported earned COR 93.8% 92.5%
Of which prior year development +1.5% +0.9%
Weather +2.4% +2.9%
Normalised AY COR 97.7% 96.3%
£2,326m
HY17 HY16
Non Direct/Digital UK Direct/Digital
£83m£85m
HY17
£251m
£166m
HY16
£210m7
£127m Underwriting LTIR & other
All footnotes on page 27
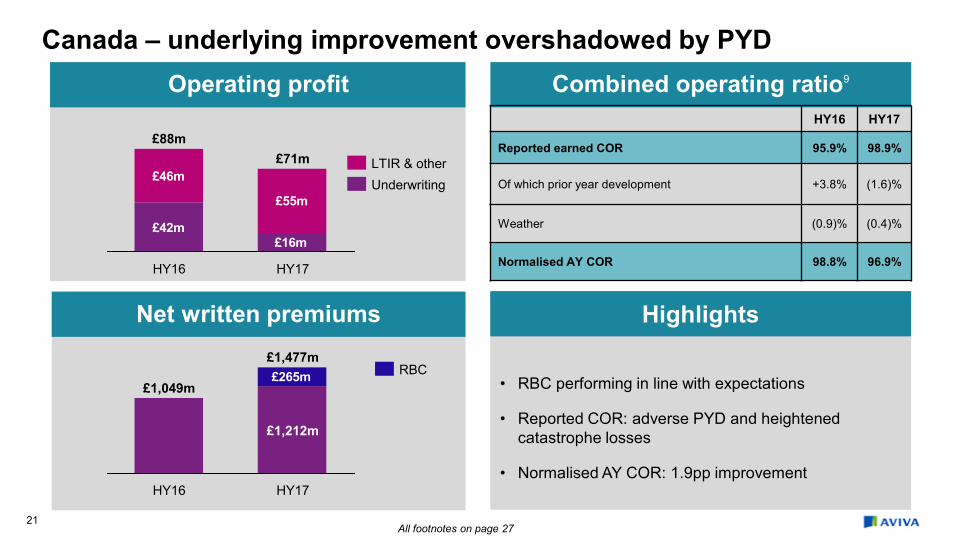
• RBC performing in line with expectations
• Reported COR: adverse PYD and heightened catastrophe losses
• Normalised AY COR: 1.9pp improvement
21
Operating profit
Combined operating ratio9
Canada – underlying improvement overshadowed by PYD
Net written premiums Highlights
£42m
£46m
£55m
£16m
HY16
£88m
HY17
£71m
Underwriting LTIR & other
£265m
£1,212m
HY16 HY17
£1,049m
£1,477m RBC
HY16 HY17
Reported earned COR 95.9% 98.9%
Of which prior year development +3.8% (1.6)%
Weather (0.9)% (0.4)%
Normalised AY COR 98.8% 96.9%
All footnotes on page 27

22
Europe – improved growth
Operating profit
• Operating profit: +9% in constant currency
• Expense discipline: stable in constant currency
• Announced partial disposal of Spanish business for €475 million
Highlights
Value of new business3
HY16 HY17
Net written premiums £757m £879m
Reported COR 98.9% 92.7%
Of which prior year development +0.7% +2.7%
Weather (2.7)% (2.1)%
Normalised AY COR 96.9% 93.3%
101 120
4260
28
22
2510
12
France
Spain
Italy
Poland
Turkey
HY17 HY16
11 £188m
£243m
228 271
90103638847
51 5
France
Turkey
Spain
Italy
Poland
2
HY16 HY17
£518m £430m
Combined operating ratio9 & growth
All footnotes on page 27
Value of new business1
23
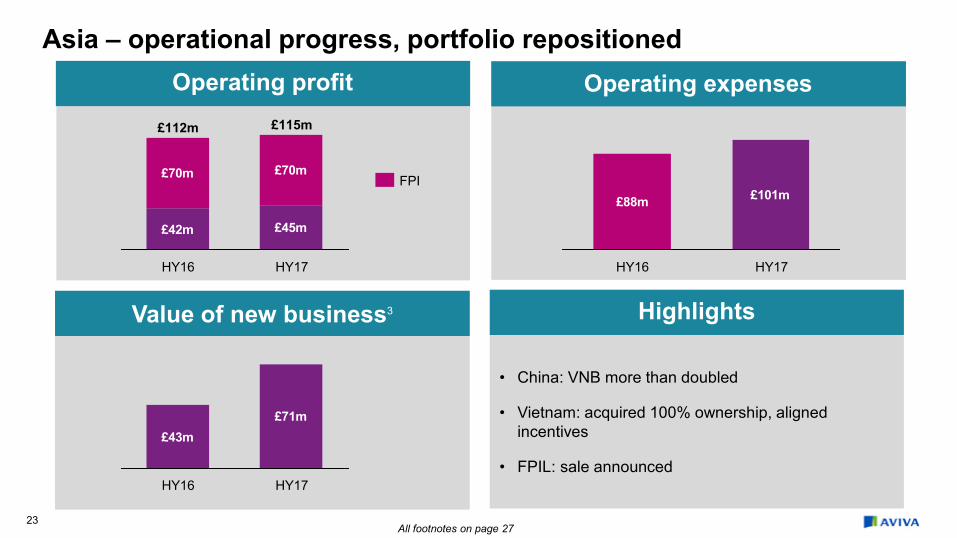
Asia – operational progress, portfolio repositioned
Operating profit
• China: VNB more than doubled
• Vietnam: acquired 100% ownership, aligned incentives
• FPIL: sale announced
Highlights
Operating expenses
Value of new business3
£88m £101m
HY17 HY16
£42m £45m
£70m £70m
HY16
£112m
HY17
£115m
FPI
£43m£71m
HY17 HY16
All footnotes on page 27
24
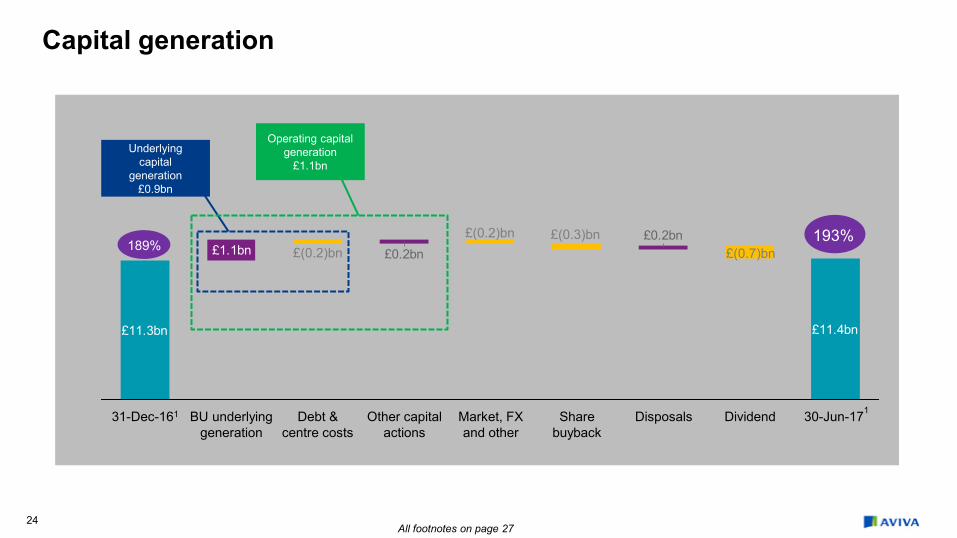
Capital generation
£11.3bn
£1.1bn
£11.4bn
£0.2bn£0.2bn
31-Dec-161 Share buyback
Dividend Market, FX and other
BU underlying generation
Other capital actions
Debt & centre costs
30-Jun-171 Disposals
Underlying capital
generation £0.9bn
Operating capital generation
£1.1bn
189% 193%
£(0.7)bn £(0.3)bn £(0.2)bn
£(0.2)bn
All footnotes on page 27

25
50% pay-out ratio 2017
£7bn cash remittances 2016 - 2018
Operating EPS Cash Dividend
Reiterating financial targets
Mid-single digit growth in medium term
26
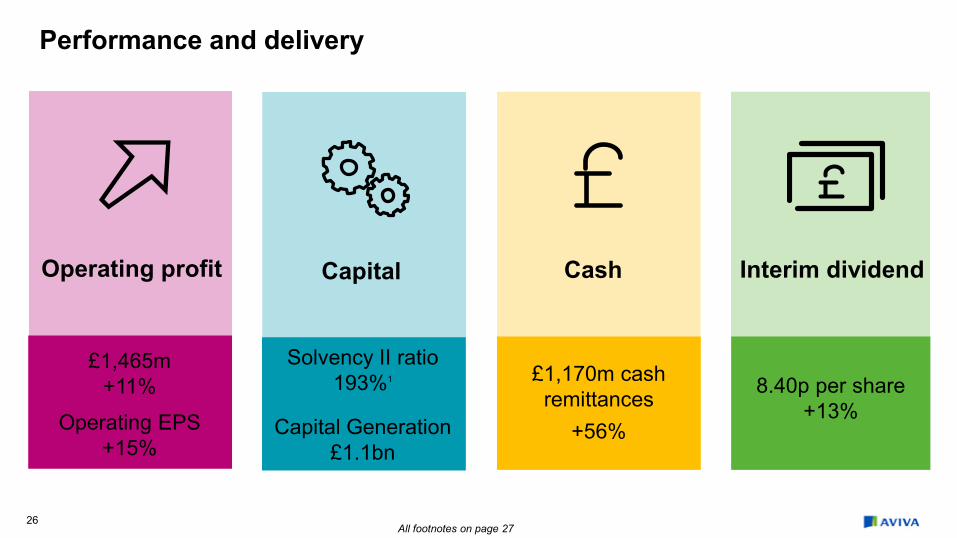
Operating profit Cash
Performance and delivery
£1,465m +11%
Operating EPS +15%
£1,170m cash remittances
+56%
8.40p per share
+13%
Interim dividend
Capital
Solvency II ratio 193%1
Capital Generation £1.1bn
All footnotes on page 27
27
Footnotes 1. Represents the shareholder view. This excludes the contribution to Group Solvency Capital Requirement (SCR) and Group Own Funds of fully ring fenced with-profits funds £3.2 billion
(FY16: £2.9 billion) and staff pension schemes in surplus £1.2 billion (FY16: £1.1 billion). Includes an estimated adverse impact of a notional reset of the transitional measure on technical provisions (‘TMTP’) to reflect interest rates at 30 June 2017 £0.5 billion decrease to surplus (FY16: £0.4 billion). Also included are the pro forma impacts of the disposal of the Spanish joint ventures and retail life insurance business (£0.1 billion increase to surplus), the disposal of Friends Provident International Limited (£0.1 billion increase to surplus), and the buy-back of the remaining £0.2 billion share capital out of the £0.3 billion total commitment announced 25 May 2017. The 31 December 2016 Solvency II position includes the pro forma impacts of the disposal of Aviva’s 50% shareholding in Antarius (£0.2 billion increase to surplus) and an anticipated future change to UK tax rules restricting tax relief (£0.4 billion decrease to surplus).
2. Operating profit has been restated to exclude amortisation and impairment of acquired value of in-force business, which is now shown as a non-operating item.
3. PVNBP and VNB are presented on an adjusted Solvency II basis.
4. On a constant currency basis.
5. Total number of UK digital registrations.
6. Gross written premiums.
7. HY16 general insurance and health operating profit has been rebased for the reduction in the AGH loan.
8. NAV is presented net of tax & MI.
9. The combined operating ratio is now reported on an earned basis. Comparators have been realigned to reflect this change.
10. PVNBP and VNB for HY17 and HY16 are presented on an adjusted Solvency II basis. HY15 and HY14 are presented on a MCEV basis.
11. Excluding Eurovita & CxG.
12. A 50 bps increase in corporate bond spread and 10% increase in lapse rates result in a proportionate decrease in Group Own Funds and Group SCR with no overall impact on the rounded Group cover ratio.
Appendix

Life
30
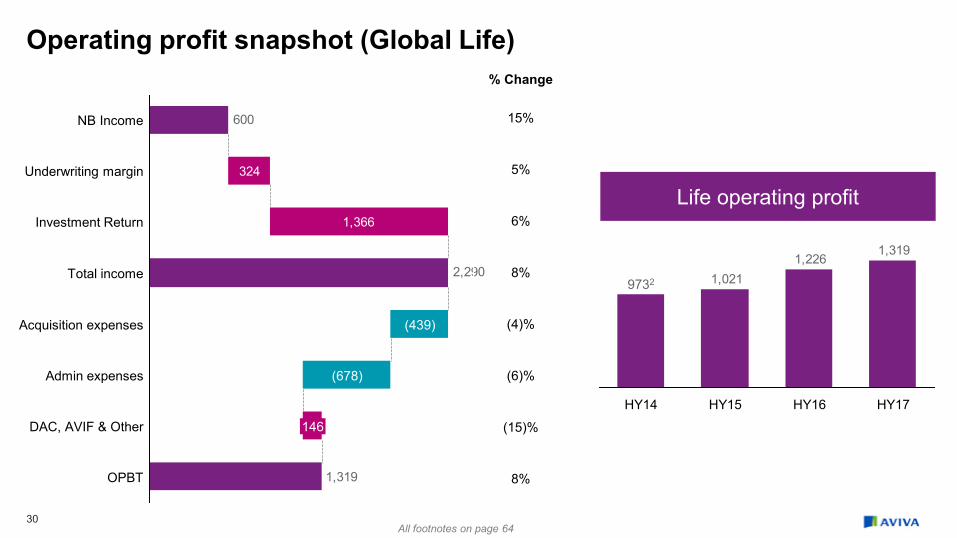
Operating profit snapshot (Global Life)
1,366
2,290
1,319
600
324
OPBT
DAC, AVIF & Other 146
Admin expenses (678)
Acquisition expenses (439)
Total income
Investment Return
Underwriting margin
NB Income
Life operating profit
% Change
15%
5%
6%
8%
(4)%
(6)%
(15)%
8%
1,3191,226
1,021
HY16 HY17 HY14 HY15
9732
All footnotes on page 64
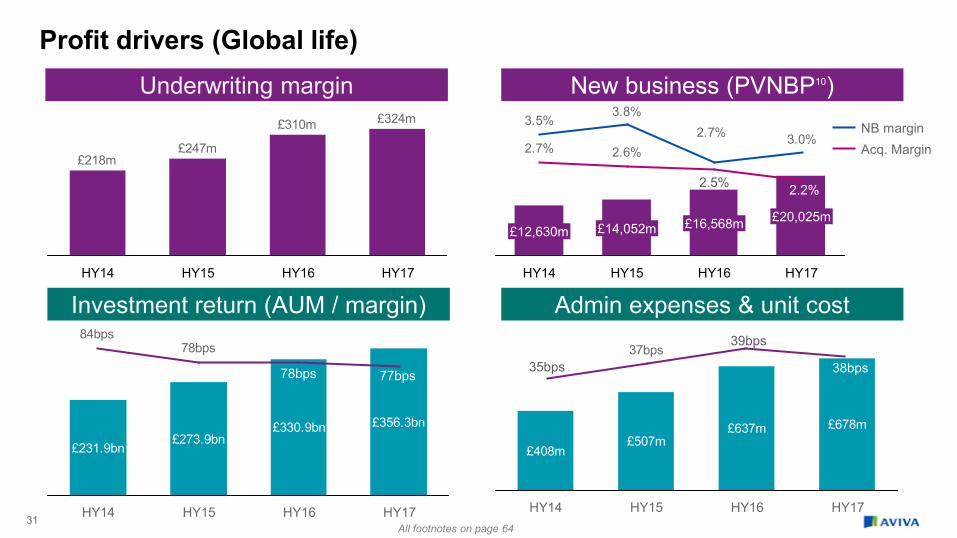
31
Profit drivers (Global life) Underwriting margin
Admin expenses & unit cost
New business (PVNBP10)
Investment return (AUM / margin)
£20,025m
HY16
£16,568m
HY15
£14,052m
HY14
£12,630m
HY17
3.0%2.7%3.8%
3.5%
2.6%2.7% Acq. Margin NB margin
2.2%
£324m£310m
£247m£218m
HY17 HY16 HY15 HY14
£231.9bn£273.9bn
£330.9bn £356.3bn
HY17 HY16 HY15 HY14
78bps84bps
78bps 77bps
£408m£507m
£637m £678m
HY17 HY16 HY15 HY14
37bps39bps
38bps 35bps
2.5%
All footnotes on page 64
32
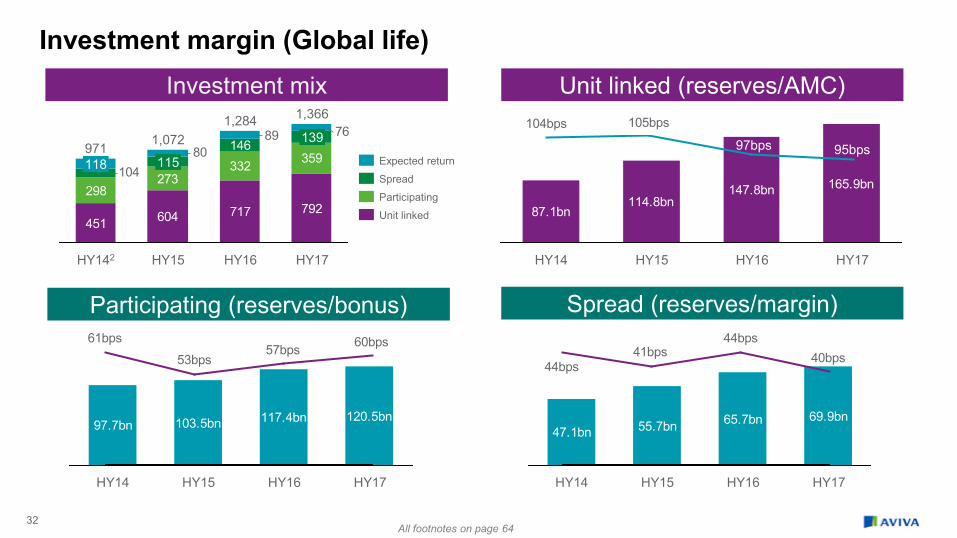
Investment margin (Global life)
451 604 717 792298
273332 359146
104
768980
115
HY142
971 118
HY15
1,072
HY16
1,366
139 1,284
HY17
Participating
Expected return
Unit linked
Spread
Investment mix
Spread (reserves/margin)
Unit linked (reserves/AMC)
Participating (reserves/bonus)
97.7bn 103.5bn 117.4bn 120.5bn
HY16 HY15 HY17 HY14
47.1bn 55.7bn 65.7bn 69.9bn
HY15 HY17 HY14 HY16
87.1bn114.8bn
147.8bn 165.9bn
HY14 HY15 HY16
HY17
105bps104bps
97bps 95bps
60bps57bps61bps
53bps 40bps44bps
41bps44bps
All footnotes on page 64
33
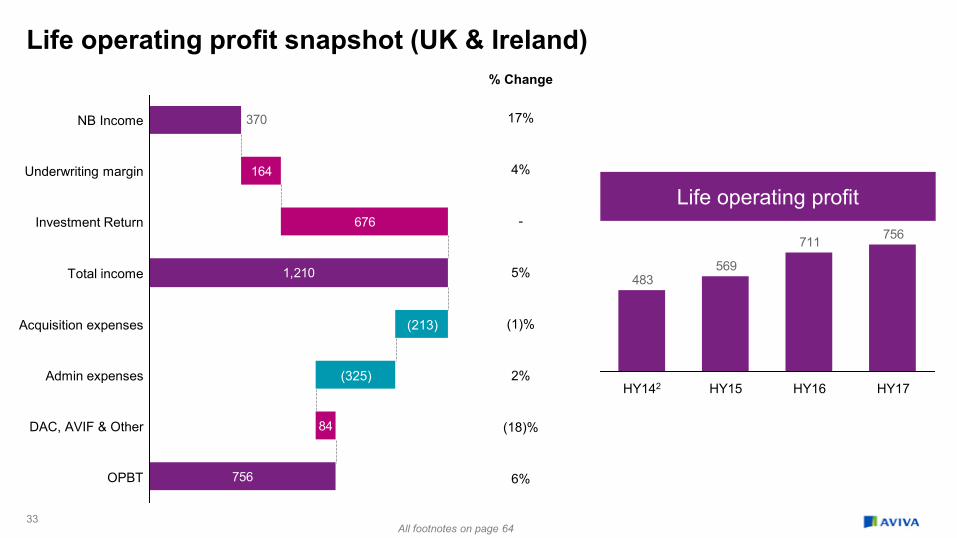
Life operating profit snapshot (UK & Ireland)
164
676
1,210
756
370
84
OPBT
DAC, AVIF & Other
Admin expenses (325)
Acquisition expenses (213)
Total income
Investment Return
Underwriting margin
NB Income
Life operating profit
% Change
17%
4%
-
5%
(1)%
2%
(18)%
6%
756711
569483
HY17 HY16 HY15 HY142
All footnotes on page 64

34
Life profit drivers (UK & Ireland ) Underwriting margin
Admin expenses & unit cost
New business (PVNBP10)
Investment return (AUM / margin) HY17
£11,686m
HY16
£8,571m
HY15
£7,341m
HY14
£6,248m
3.5%2.9%
2.3%2.6%
2.4%
Acq. Margin NB margin
2.5%
£124.6bn£175.2bn
£220.5bn £233.3bn
HY17 HY16 HY15 HY14
61bps62bps63bps
58bps
£162m£253m
£332m £325m
HY17 HY16 HY15 HY14
26bps
30bps29bps
28bps
£164m£158m
£103m
£62m
HY17 HY16 HY15 HY14
2.4% 1.8%
All footnotes on page 64
35
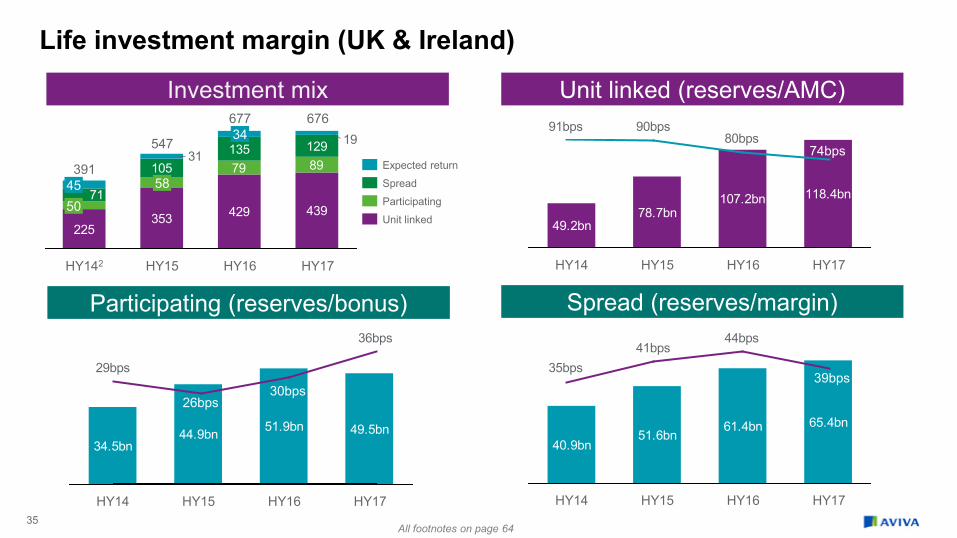
Life investment margin (UK & Ireland)
225353 429 439
79 89105135 129
71
1931
HY142
58
34 547
HY15
677
HY16
676
HY17
391
50 45 Spread
Expected return
Participating
Unit linked
Investment mix
Spread (reserves/margin)
Unit linked (reserves/AMC)
Participating (reserves/bonus)
49.2bn78.7bn
107.2bn 118.4bn
HY16 HY17 HY15 HY14
34.5bn44.9bn 51.9bn 49.5bn
HY14 HY15 HY16 HY17
40.9bn51.6bn
61.4bn 65.4bn
HY16 HY17 HY14 HY15
80bps90bps91bps
74bps
36bps
29bps
30bps 26bps
44bps41bps
35bps39bps
All footnotes on page 64

36
124
605
858
433
129
OPBT
DAC, AVIF & Other 10
Admin expenses (300)
Acquisition expenses (135)
Total income
Investment Return
Underwriting margin
NB income
% Change
(1)%
8%
11%
9%
6%
(16)%
43%
10%
Operating profit 433
395372
455
HY17 HY16 HY15 HY142
Life operating profit snapshot (Europe)
All footnotes on page 64
37
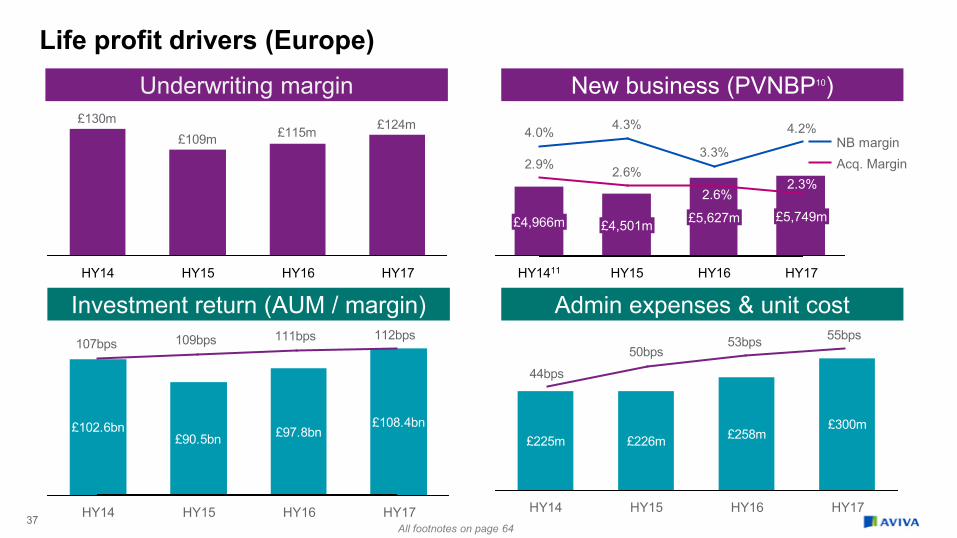
Life profit drivers (Europe) Underwriting margin
Admin expenses & unit cost
New business (PVNBP10)
Investment return (AUM / margin) HY17
£5,749m
HY16
£5,627m
HY15
£4,501m
HY1411
£4,966m
4.2%
3.3%
4.3%4.0%
2.6%2.9% Acq. Margin NB margin
2.3%
£102.6bn£90.5bn £97.8bn
£108.4bn
HY17 HY16 HY15 HY14
112bps111bps109bps107bps
£225m £226m £258m£300m
HY17 HY16 HY15 HY14
55bps53bps50bps
44bps 48bps
£124m£115m£109m£130m
HY17 HY16 HY15 HY14
2.6%
All footnotes on page 64
38
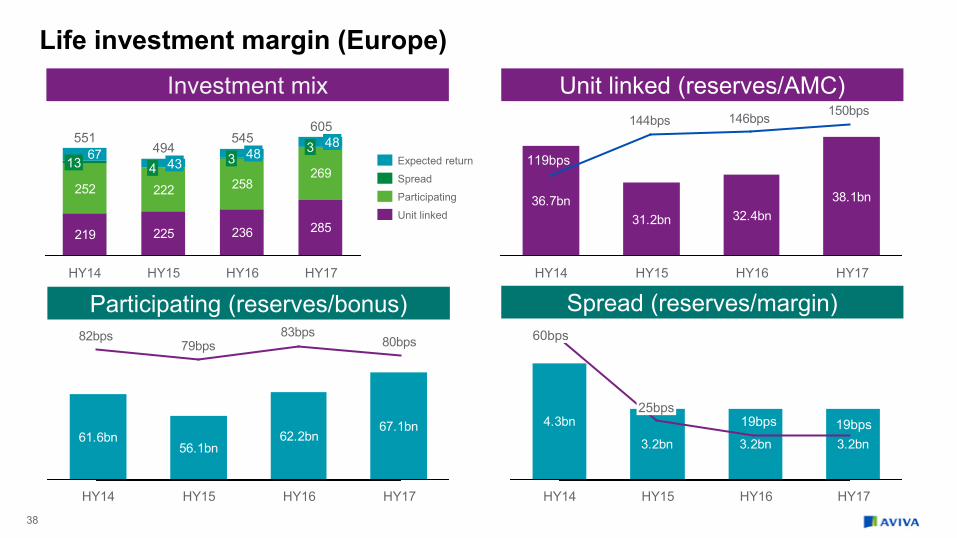
Life investment margin (Europe)
219 225 236 285
252269
258222
67 3
HY16
48 545 3
HY15
48 4 43
HY14
551
13
605
HY17
494
Spread
Expected return
Unit linked
Participating
Investment mix
Spread (reserves/margin)
Unit linked (reserves/AMC)
61.6bn56.1bn
62.2bn67.1bn
HY16 HY17 HY14 HY15
Participating (reserves/bonus)
36.7bn 38.1bn32.4bn31.2bn
HY15 HY16 HY17 HY14
4.3bn
3.2bn 3.2bn3.2bn
HY16 HY14 HY15 HY17
150bps146bps144bps
80bps79bps83bps82bps 60bps
25bps 19bps 19bps
119bps

39
101
36
85
222
120
42
OPBT
DAC, AVIF & Other
Admin expenses (53)
Acquisition expenses (91)
Total income
Investment Return
Underwriting margin
NB income
% Change
36%
(3)%
37%
28%
(34)%
(13)%
(30)%
2%
Operating profit 120118
79
34
HY15 HY14 HY16 HY17
Operating profit snapshot (Asia life)

General insurance & health

41
General insurance and health (Group) Net written premium
Investments GI Combined operating ratio9
64.5% 62.8% 63.5% 63.2%
31.3% 30.9% 32.2% 31.3%
93.7%
HY16
95.7%
HY17
94.5%
HY15 HY14
95.8%
C&E ratio Loss ratio
5,224
4,5454,2184,289
HY16 HY17 HY15 HY14
17,23115,649 14,075 14,662
HY17 HY16 HY15 HY14
2.3%2.6%
2.4%2.9%
Operating profit 417
334422403
HY17 HY16 HY15 HY14
Average assets LTIR %
All footnotes on page 64

42
General insurance and health (UK & Ireland) Net written premium
Investments GI Combined operating ratio9
61.5% 62.2% 60.6% 59.3%
32.8% 31.6% 33.2% 33.2%
HY17
92.5%
HY16
93.8%
HY15
93.8%
HY14
94.3%
Loss ratio C&E ratio
2,6192,515
2,3422,321
HY16 HY15 HY14 HY17
10,612 9,320 7,335 6,577
HY15 HY17 HY16 HY14
2.6%2.6%2.6%2.8%
Operating profit 259
231239263
HY17 HY16 HY15 HY14
Average assets LTIR %
All footnotes on page 64

43
General insurance and health (Canada) Net written premium
Investments GI Combined operating ratio9
1,477
1,0491,0131,026
HY17 HY16 HY15 HY14
3,592 3,586 3,8784,904
HY17 HY16 HY14 HY15
2.8%3.1%
2.3%
66.4% 60.9% 64.6% 69.5%
30.6% 31.0% 31.3% 29.4%
HY17
98.9%
HY16
95.9%
HY15
91.9%
HY14
97.0%
Loss ratio C&E ratio
Operating profit
7188
131
83
HY17 HY16 HY15 HY14
Average assets LTIR %
2.4%
All footnotes on page 64

44
General insurance and health (Europe)
Net written premium
Investments GI Combined operating ratio9
69.6% 67.4% 68.5% 63.4%
28.3% 28.4% 30.4% 29.3%
HY17
92.7%
HY16
98.9%
HY15
95.8%
HY14
97.9%
Loss ratio C&E ratio
1,044912
802885
HY17 HY16 HY15 HY14
2,745 2,498 2,620 2,962
HY17 HY16 HY14 HY15
1.9%2.1%2.4%
2.8%
Operating profit 85
35
5957
HY17 HY16 HY15 HY14
Average assets LTIR %
All footnotes on page 64

Earnings per share
46
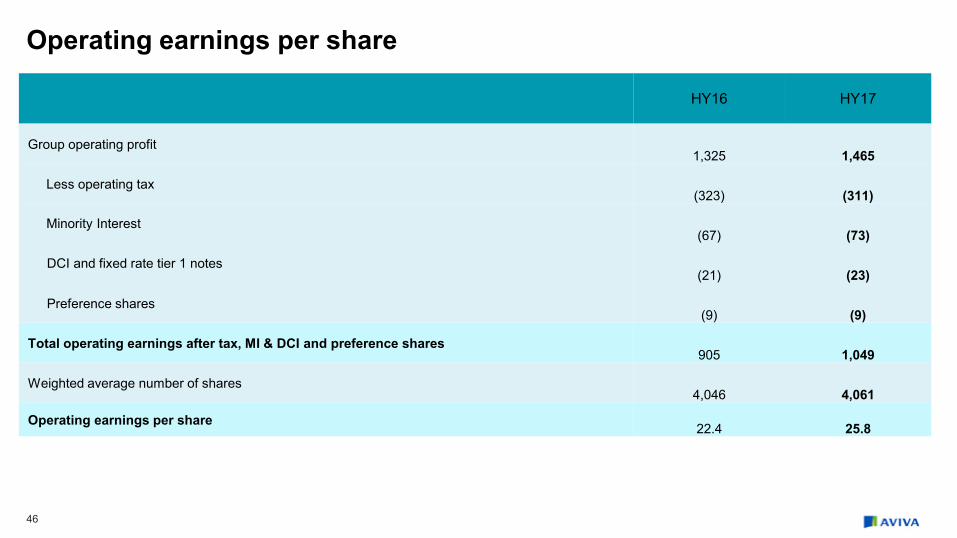
Operating earnings per share
HY16 HY17
Group operating profit 1,325 1,465
Less operating tax (323) (311)
Minority Interest (67) (73)
DCI and fixed rate tier 1 notes (21) (23)
Preference shares (9) (9)
Total operating earnings after tax, MI & DCI and preference shares 905 1,049
Weighted average number of shares 4,046 4,061
Operating earnings per share 22.4 25.8
47
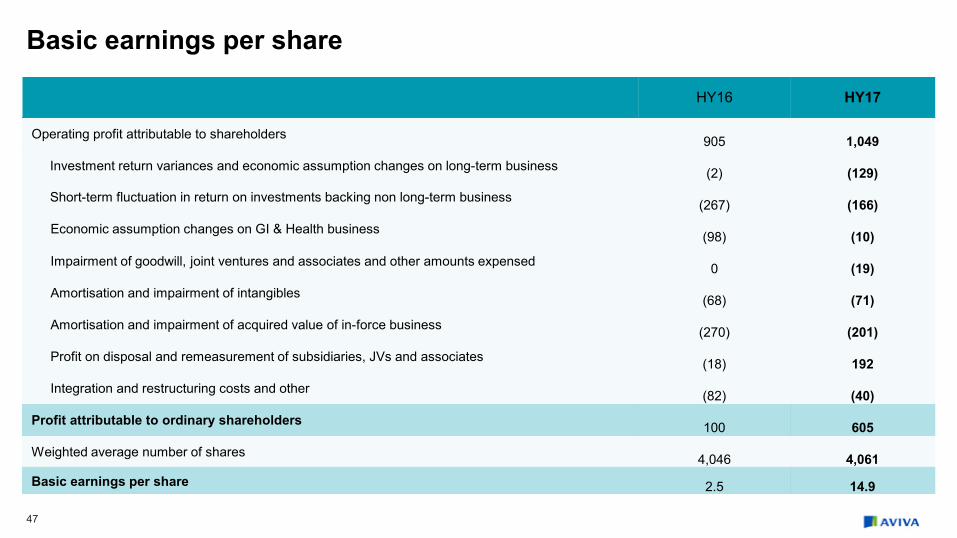
Basic earnings per share
HY16 HY17
Operating profit attributable to shareholders 905 1,049
Investment return variances and economic assumption changes on long-term business (2) (129)
Short-term fluctuation in return on investments backing non long-term business (267) (166)
Economic assumption changes on GI & Health business (98) (10)
Impairment of goodwill, joint ventures and associates and other amounts expensed 0 (19)
Amortisation and impairment of intangibles (68) (71)
Amortisation and impairment of acquired value of in-force business (270) (201)
Profit on disposal and remeasurement of subsidiaries, JVs and associates (18) 192
Integration and restructuring costs and other (82) (40)
Profit attributable to ordinary shareholders 100 605
Weighted average number of shares 4,046 4,061 Basic earnings per share 2.5 14.9

Returns
49
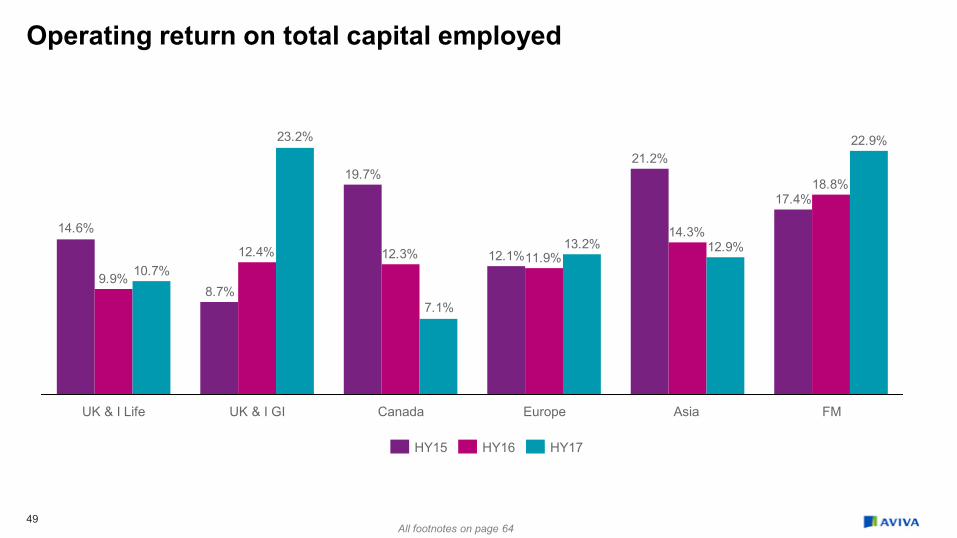
Operating return on total capital employed
1. Following a correction to accounting and modelling for annual management charge rebates in UK Life, prior year comparatives have been restated
17.4%
21.2%
12.1%
19.7%
8.7%
14.6%
18.8%
14.3%
11.9%12.3%12.4%
9.9%
22.9%
12.9%13.2%
7.1%
23.2%
10.7%
FM Asia Europe UK & I GI UK & I Life Canada
HY17 HY16 HY15
All footnotes on page 64

50
Operating return on total capital employed & return on equity
Group return on equity Group return on capital employed
12.4%11.0%
15.5%
HY17 HY16 HY15
9.3%8.8%
11.6%
HY17 HY16 HY15

51
Operating return
£m Before tax After tax Weighted average
shareholders’ funds including non-controling interests
Return on Equity %
UK & Ireland Life 756 606 11,323 10.7%
UK & Ireland GI and Health 259 211 1,817 23.2%
Canada 71 52 1,468 7.1%
Europe 518 367 5,574 13.2%
Asia 115 107 1,661 12.9%
Fund management 69 55 481 22.9%
Corporate and Other Business (130) (88) 5,725 n/a
Return on total capital employed 1,658 1,310 28,049 9.3%
Subordinated debt (191) (154) (7,223) 4.3%
Senior debt (2) (2) (1,384) 0.3%
Return on total equity 1,465 1,154 19,442 11.9%
Less: Non-controlling interests (73) (1,372) 10.6%
Direct capital instrument and tier 1 notes (23) (1,123) 6.1%
Preference capital (9) (200) 8.5%
Return on equity shareholders’ funds 1,049 16,747 12.4%
Analysis of operating return on equity

Capital & cash flows
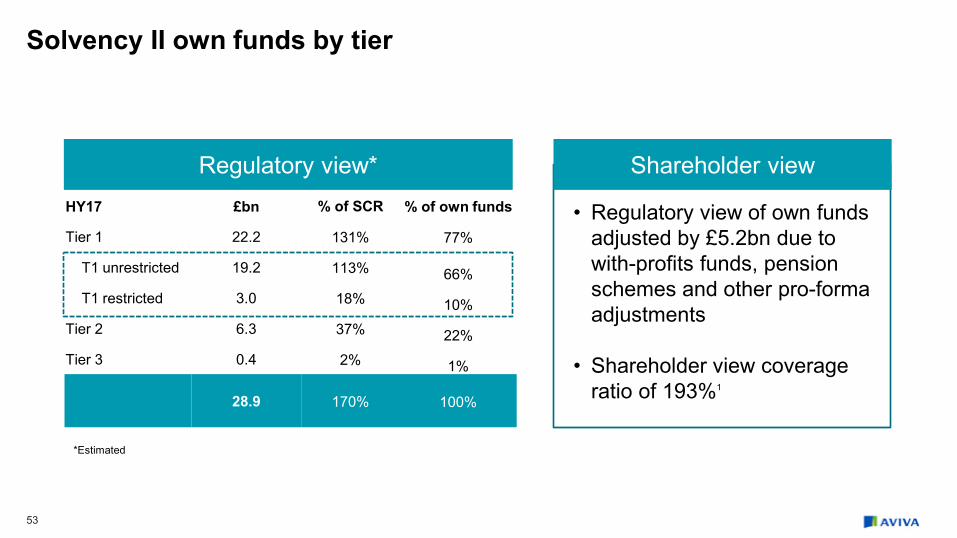
HY17 £bn % of SCR % of own funds
Tier 1 22.2 131% 77%
T1 unrestricted 19.2 113% 66% T1 restricted 3.0 18% 10% Tier 2 6.3 37% 22% Tier 3 0.4 2% 1%
28.9 170% 100%
53
Solvency II own funds by tier
• Regulatory view of own funds adjusted by £5.2bn due to with-profits funds, pension schemes and other pro-forma adjustments
• Shareholder view coverage ratio of 193%1
Shareholder view Regulatory view*
*Estimated

54
Solvency II – sensitivities Impact on Solvency cover ratio (SCR)
30/06/2017 SCR : 193%1
25bps increase in interest rate 4%
100bps increase in interest rate 16%
25bps decrease in interest rate (6)%
50bps decrease in interest rate (12)%
10% increase in market value of equity 2%
10% decrease in market value of equity (2)%
25% decrease in market value of equity (3)%
50bps increase in Corporate Bond spread12 0%
100bps increase Corporate Bond spread (1)%
50bps decrease in Corporate Bond spread (2)%
10% increase in maintenance and investment expenses (7)%
10% increase in lapse rates12 0%
Credit downgrade on the annuity portfolio (4)%
5% increase in mortality / morbidity rates – life assurance (2)%
5% decrease in mortality rates – annuity business (12)%
5% increase in gross loss ratios (3)% All footnotes on page 64

55
External debt – a balanced maturity profile Subordinated debt profile
8.250% 6.875%
7.875%
6.875% 5.902%
6.625%
12.000%
8.250%
6.125%
8.25%
7.875%
6.875% 6.875% 5.9021%
All debt instruments have been presented at optional first call dates at nominal values converted to GBP using 30 June 2017 rates.
£267m
£162m
£600m
£400m£400m
£700m
£790m
£615m£571m
£500m
£450m
£439m
£800m
£443m
£500m £500m
£210m
2030 2038 2029 2026 2025 2024 2023 2022
£1,300m
2021
£879m
2020 2019 2018
£882m
2017
Tier 3
Restricted Tier 1
Tier 2

Balance sheet

57
Total managed assets
Participating assets by type Assets by liabilities covered
HY17
350,238
80,758
142,493
126,987
HY16
334,694
77,794
122,322
134,578
Shareholder funds Policyholder funds Participating funds
134,578 126,987
HY17
56,780
70,207
HY16
60,937
73,641
UK With-profits style
Euro-style
Shareholder assets by type 80,758 77,794
HY17
13,478
67,280
HY16
12,623
65,171 GI, Health & other
Annuity & non-profit
£m

58
Shareholder assets
Shareholder assets by type
9,0657,674
HY17
80,758
18,975
2,592
27,065
23,061
HY16
77,794
18,074
2,934
28,149
20,963
Other Mortgage loans Other debt Corporate bonds Government debt
Corporate debt by rating
Government debt by rating
7% 12% 41% 29%10%
1%
20% 68% 6%6%
Non-rated Less than BBB
BBB A
AA AAA
Non-rated Less than BBB
BBB A
AA AAA
Total: £27,065m
Total: £23,061m
£m

59
Shareholder assets
Corporate bonds by industry Loans by type
7% 19%
19%
7%
6%
8%
2%
13%
19%
Financials - Banks Real estate Oil & gas
Communications
Other Industrial Consumer services
Financials - Insurance & other Utilities
6% 9%
10%
75%
Healthcare, Infrastructure & PFI other loans Loans & advances to banks
Mortgage loans Other
Total: £25,519m

60
Shareholder assets – Mortgage loans
Mortgage loans Commercial real estate portfolio
95% 83% 85% 61% 58% 58%
446 9 1,583 1,492
1.4x 1.4x 1.5x 2.1x 2.2x 2.4x
FY16 FY15 FY13 FY12 HY17 FY14
LTV
Loans in arrears
Loan interest cover
45%
18%
37%
Total: £18,975m
Healthcare, infrastructure & PFI Commercial Securitised mortgage loans & equity release
Commercial: £6,923m

Other

62
Disposals – pro-forma
£m FY16 HY17 FY16 HY17 FY16 HY17
Operating profit (before tax & MI) 78 21 82 39 140 70
Operating EPS* 0.6p 0.2p 0.8p 0.3p 3.5p 1.7p
Proceeds
IFRS NAV impact (net of proceeds)
SII surplus impact (net of proceeds) All impacts reflected in HY17 surplus position of £11.4 b illion
* based on weighted average number of shares of 4,051m at FY16 and 4,061m at HY17
c£(130)m lossc£120m gainIncluded
FPIL
Expected completion 2018
€500m €475m £340m
Antarius
Completed 1Q17
Spain (part)
Expected completion 2H17

63
Estimated amortisation of acquired value of in-force
£0m
£100m
£200m
£300m
£400m
£500m
£600m
2016 2017 2018 2019 2020 2021 2022 2023 2024 2025 2026 2027
FPI FL UK Other Aviva businesses
This is our latest estimated projection as provided at FY16 and is subject to a variety of factors including the effects of markets.
We announced the sale of FPI in July 2017. It is expected to complete in early 2018.

64
Footnotes 1. Represents the shareholder view. This excludes the contribution to Group Solvency Capital Requirement (SCR) and Group Own Funds of fully ring fenced with-profits funds £3.2 billion
(FY16: £2.9 billion) and staff pension schemes in surplus £1.2 billion (FY16: £1.1 billion). Includes an estimated adverse impact of a notional reset of the transitional measure on technical provisions (‘TMTP’) to reflect interest rates at 30 June 2017 £0.5 billion decrease to surplus (FY16: £0.4 billion). Also included are the pro forma impacts of the disposal of the Spanish joint ventures and retail life insurance business (£0.1 billion increase to surplus), the disposal of Friends Provident International Limited (£0.1 billion increase to surplus), and the buy-back of the remaining £0.2 billion share capital out of the £0.3 billion total commitment announced 25 May 2017. The 31 December 2016 Solvency II position includes the pro forma impacts of the disposal of Aviva’s 50% shareholding in Antarius (£0.2 billion increase to surplus) and an anticipated future change to UK tax rules restricting tax relief (£0.4 billion decrease to surplus).
2. Operating profit has been restated to exclude amortisation and impairment of acquired value of in-force business, which is now shown as a non-operating item.
3. PVNBP and VNB are presented on an adjusted Solvency II basis.
4. On a constant currency basis.
5. Total number of UK digital registrations.
6. Gross written premiums.
7. HY16 general insurance and health operating profit has been rebased for the reduction in the AGH loan.
8. NAV is presented net of tax & MI.
9. The combined operating ratio is now reported on an earned basis. Comparators have been realigned to reflect this change.
10. PVNBP and VNB for HY17 and HY16 are presented on an adjusted Solvency II basis. HY15 and HY14 are presented on a MCEV basis.
11. Excluding Eurovita & CxG.
12. A 50 bps increase in corporate bond spread and 10% increase in lapse rates result in a proportionate decrease in Group Own Funds and Group SCR with no overall impact on the rounded Group cover ratio.