aviation finance rating methodology
TRANSCRIPT
Contacts
Helene Spro
Director
+49-69-66-77389-90
Christian Vogel
Associate Director
+49 40 524724-101
Dr Stefano Mostarda
Director
+49-30-27891-259
Torsten Schellscheidt Executive Director +49-40-524724-100 [email protected]
Aviation Finance Rating Methodology Project Finance
Published on 15 November 2021
Aviation Finance Rating Methodology Project Finance
15 November 2021
2/26
Table of Contents
1 Areas of application ......................................................................................................................................................... 3 2 Rating definitions ............................................................................................................................................................. 3 3 Methodology highlights................................................................................................................................................... 3 4 Overview of analytical framework .................................................................................................................................. 4 5 Aircraft analysis ............................................................................................................................................................... 5 5.1 Day-one value analysis ........................................................................................................................................................................... 5 5.2 Day-one rating-conditional stress ............................................................................................................................................................ 6 5.3 Annual depreciation assumptions ........................................................................................................................................................... 6
5.3.1 Base annual depreciation .............................................................................................................................................................. 6
5.3.2 Four key drivers of aircraft value depreciation ............................................................................................................................... 7
5.3.3 Stressed annual depreciation ........................................................................................................................................................ 8
5.4 Aircraft repossession and remarketing: timing delays and additional costs ............................................................................................. 9 5.4.1 Repossession time ........................................................................................................................................................................ 9
5.4.2 Aircraft remarketing time ............................................................................................................................................................... 9
5.4.3 Repossession and remarketing costs .......................................................................................................................................... 11
5.5 Maintenance reserves .......................................................................................................................................................................... 11
6 Probability of default analysis ...................................................................................................................................... 12 6.1 Standalone credit assessment of risk presenters .................................................................................................................................. 12 6.2 Full recourse to lessor (adjustment for the joint default of risk presenters) ............................................................................................ 13 6.3 Fleet relevance ..................................................................................................................................................................................... 14
7 Severity and expected loss analysis ............................................................................................................................ 14 7.1 Calculation of total expected loss .......................................................................................................................................................... 14 7.2 Quantitative rating-indication ................................................................................................................................................................ 16
8 Rating sensitivity ........................................................................................................................................................... 16 9 Legal and structural analysis ........................................................................................................................................ 16 9.1 Information expected for the rating analysis .......................................................................................................................................... 16
9.1.1 Information quality ....................................................................................................................................................................... 17
9.2 Contract analysis .................................................................................................................................................................................. 17 9.3 Financial structure analysis ................................................................................................................................................................... 17 9.4 Legal and tax analysis .......................................................................................................................................................................... 18 9.5 Counterparty risk .................................................................................................................................................................................. 18
10 Rating determination ..................................................................................................................................................... 18 11 Monitoring ...................................................................................................................................................................... 18 12 Rating model .................................................................................................................................................................. 19
Technical note on timely payment ......................................................................................................................... 20 Step-by-step example of the application of this methodology ........................................................................... 21
Aviation Finance Rating Methodology Project Finance
15 November 2021
3/26
1 Areas of application
This document describes our methodology for the rating of vehicles and instruments securitised by commercial aircraft, referred to
generally throughout this document as aviation finance transactions. Aviation finance transactions are typically issued by a special-
purpose vehicle (SPV) or as a direct loan to an airline or lessor to finance the acquisition of one or several aircraft.
The focus of this methodology is debt issued with the intention of financing or refinancing of an aircraft. This methodology is not
applicable to aircraft operators, aviation lessors or airport financing transactions.
A similar analytical framework can be applied to transactions secured by aircraft engines, such as engine leasing transactions. This
framework would however require adjustments to account for the volatile quality of operators as they are replaced, and the more
volatile value of engines as a function of their maintenance status. Counterparty analysis is key for engine-secured transactions
because they require a higher degree of active management.
This methodology takes a world-wide approach and can be applied to aircraft financing transactions globally.
The aviation finance methodology will be applied in conjunction with our General Structured Finance Rating Methodology when
portfolios of credit exposures to aircraft finance are securitised in an SPV.
2 Rating definitions
Our aviation finance credit ratings constitute a forward-looking opinion on relative credit risk. As per our rating definitions available
on https://scoperatings.com/#!governance-and-policies/rating-scale, the ratings are expressed using a scale from AAA to C, with
additional ‘+’ and ‘-’ subcategories from AA to B, resulting in a total of 19 levels. A rating reflects the expected loss associated with
payments contractually promised under a credit exposure to commercial aircraft, by its legal maturity, accounting for the time value
of money at the rate promised to the investor
The expected loss in this methodology reflects, in turn: i) the likelihood of a contract default; and ii) the loss severity expected upon
a default. We assess the likelihood of default and will limit the rating if an instrument has a very low expected loss and very high
default likelihood. We apply the timely payment standards highlighted in Appendix I when assigning expected loss ratings under
this methodology. For more details, refer to the technical notes on the expected loss framework and timely payment under 7.1 and
Appendix I.
3 Methodology highlights
Expected loss. Our aviation finance ratings reflect the expected loss on a debt instrument secured by commercial aircraft. This
methodology focuses especially on the analysis of the severity to the investor by estimating recovery rates after an event of default.
Supported by real data. Aircraft are individually analysed based on their specific characteristics. We derive value-stress
assumptions from historical data, linking stress to aircraft characteristics. These historical trends are also applicable to future market
values of new aircraft sharing similar characteristics. This allows for the consideration of new aircraft models and transaction-
specific ratings with no overarching general rating caps.
Industry perspective. This methodology takes a view point similar to that used by the aviation industry. It incorporates and
accounts for the factors and transaction characteristics considered by the industry to impact credit risk, integrating aviation-specific
features. Our approach results in credit ratings that focus on the industry specific risk areas relevant to aviation finance investors.
Credit differentiation. Our analysis relies on input assumptions which are instrument-specific. This fundamental bottom-up
approach captures the risk of each aviation financing transaction without resorting to top-down generic assumptions. Our approach
allows for greater differentiation between both ratings and aircraft types, ensuring appropriate credit is given to the underlying
security.
Lessor involvement. We reflect the involvement of lessors and technical asset managers in a transaction, examining the alignment
of interests between the service provider and the investor. This is an important driver of a transaction’s expected performance.
No mechanistic link to sovereign credit quality. We do not mechanistically limit the maximum rating an aviation transaction can
achieve as a function of the credit quality of the country of the aircraft’s operator or owner. Instead, we assess the efficacy of
insolvency laws, convertibility risk, and the risk of institutional meltdown in the context of the tenor of each rated instrument. Further,
we also account for the macroeconomic environment.
Aviation Finance Rating Methodology Project Finance
15 November 2021
4/26
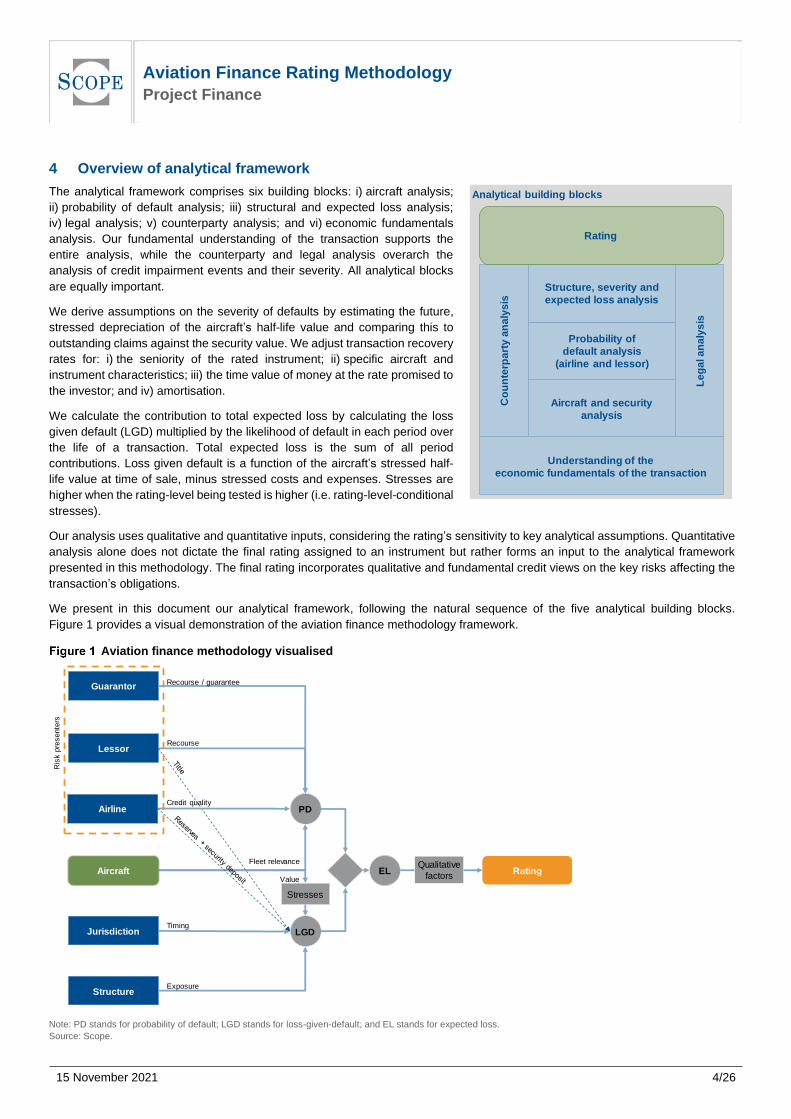
4 Overview of analytical framework
The analytical framework comprises six building blocks: i) aircraft analysis;
ii) probability of default analysis; iii) structural and expected loss analysis;
iv) legal analysis; v) counterparty analysis; and vi) economic fundamentals
analysis. Our fundamental understanding of the transaction supports the
entire analysis, while the counterparty and legal analysis overarch the
analysis of credit impairment events and their severity. All analytical blocks
are equally important.
We derive assumptions on the severity of defaults by estimating the future,
stressed depreciation of the aircraft’s half-life value and comparing this to
outstanding claims against the security value. We adjust transaction recovery
rates for: i) the seniority of the rated instrument; ii) specific aircraft and
instrument characteristics; iii) the time value of money at the rate promised to
the investor; and iv) amortisation.
We calculate the contribution to total expected loss by calculating the loss
given default (LGD) multiplied by the likelihood of default in each period over
the life of a transaction. Total expected loss is the sum of all period
contributions. Loss given default is a function of the aircraft’s stressed half-
life value at time of sale, minus stressed costs and expenses. Stresses are
higher when the rating-level being tested is higher (i.e. rating-level-conditional
stresses).
Our analysis uses qualitative and quantitative inputs, considering the rating’s sensitivity to key analytical assumptions. Quantitative
analysis alone does not dictate the final rating assigned to an instrument but rather forms an input to the analytical framework
presented in this methodology. The final rating incorporates qualitative and fundamental credit views on the key risks affecting the
transaction’s obligations.
We present in this document our analytical framework, following the natural sequence of the five analytical building blocks.
Figure 1 provides a visual demonstration of the aviation finance methodology framework.
Aviation finance methodology visualised
Note: PD stands for probability of default; LGD stands for loss-given-default; and EL stands for expected loss.
Source: Scope.
Structure
Jurisdiction
Aircraft
Airline
Lessor
PD
LGD
RatingEL
Recourse
Credit quality
Fleet relevance
Value
Timing
Exposure
Stresses
Qualitative
factors
Ris
k p
resente
rs
GuarantorRecourse / guarantee
Analytical building blocks
Aircraft and security
analysis
Understanding of the
economic fundamentals of the transaction
Probability of
default analysis
(airline and lessor)
Structure, severity and
expected loss analysis
Co
un
terp
art
y a
na
lys
is
Le
ga
l a
na
lys
is
Rating
Aviation Finance Rating Methodology Project Finance
15 November 2021
5/26
5 Aircraft analysis
Our aircraft analysis involves the application of the analytical steps listed below. Each step is explained in detail in the corresponding
section in the methodology and includes the following analytical steps:
• Day-one value analysis
• Application of Day-one rating-conditional stresses
• Determination of Annual depreciation assumptions
• Assessment of the impact of Aircraft repossession and remarketing: timing delays and additional costs
• Assessment of the adequacy of Maintenance reserves
The loss to the investor depends greatly on the recoverable value of the underlying aircraft, i.e. how much of the outstanding claims
against the security can be recovered from the fire sale of the aircraft in the case of an obligor (typically an airline) default.
Our methodology uses aircraft-value stresses which incorporate historical data on aircraft values, information from arrangers,
appraisals, and other market and macroeconomic data (e.g. on asset performance, GDP or unemployment). Most of the key inputs
in our Aviation Finance methodology come from observations of market data, especially those related to aircraft value depreciations.
Our depreciation and stress assumptions rely on statistical analysis performed on a dataset in 2017, which covers 26 years of
historical market value data. The dataset encompasses six crisis periods, including market value depreciation observed during the
Global Financial Crisis. We continue to monitor the potential need to recalibrate our modelling assumptions because the Covid-19
crisis has materially impacted the sector. The pandemic has affected airlines' credit quality, which have been under significant
stress, but also caused the market value of certain aircraft models to fall lower than in the six previous crises accounted for in the
data used to calibrate the current methodology. In our most recent methodology review, the day-one rating conditional stress and
the annual depreciation stresses presented in this methodology were found to be sufficiently conservative to account for a crisis
the size of the Covid-19 pandemic at the AA-rating conditional level. Our annual depreciation assumptions and stresses may be
updated as the Covid-19 crisis continues to develop. We incorporate an aircraft's market value in our calculation of the day-one
value to improve the rating's sensitivity to sharp market value drops, such as in a crisis scenario. The day-one value considers
drops in an aircraft's market value resulting from a market downturn or issues that are specific to the aircraft model.
Our analysis of aircraft value aims to produce: i) rating-conditional value stresses which compound over time (i.e. annual
depreciation assumptions); ii) an initial value stress to reflect the volatility of appraisals (i.e. the day-one value stress); and iii) other
rating-conditional value stresses (e.g. remarketing and repossession time).1
5.1 Day-one value analysis
The day-one value of the aircraft is usually the half-life base value as provided by appraisers. The base value is an appraiser’s
opinion of the underlying economic value of an aircraft in an open, unrestricted and stable environment. The half-life value assumes
the aircraft is halfway between major overhauls. We typically look at three aircraft appraisal reports, one of which we commission
ourselves. The half-life value used is the average between the three. If we are not provided with naked aircraft values, the day-one
value applied is the half-life base value from the appraisal which we commissioned. We will use the second-best appraisal value if
there is a wide divergence between the three. If the appraised base values diverge greatly from the market value, the day-one
value used will be a combination of the base value and market value.
If the market value is below the base value at the time of the rating analysis – whether initial analysis or monitoring – we may apply
a weighted average between the two values as the day-one value. In such cases, we calculate the day-one value as follows:
𝑴𝒂𝒓𝒌𝒆𝒕 𝒗𝒂𝒍𝒖𝒆 𝒘𝒆𝒊𝒈𝒉𝒕 = 𝟓𝟎% ∗ (𝟏 −𝑴𝑰𝑵(𝟏,𝑴𝑨𝑿(𝟎,𝒎𝒂𝒓𝒌𝒆𝒕 𝒗𝒂𝒍𝒖𝒆−𝒉𝒊𝒔𝒕𝒐𝒓𝒊𝒄𝒂𝒍 𝒍𝒐𝒘
𝒃𝒂𝒔𝒆 𝒗𝒂𝒍𝒖𝒆−𝒉𝒊𝒔𝒕𝒐𝒓𝒊𝒄𝒂𝒍 𝒍𝒐𝒘)))
If the market value equals the historical low seen for the aircraft model, the day-one value will be calculated applying a 50% weight
to the market value and a 50% weight to the base value. If the market value equals or is higher than the base value the weight will
be 0% market value and 100% base value. If the market value is between the historical low and the base value the weight given to
1 The methodology has been republished on 20 July 2021 due to an editorial error in which paragraphs 2-4 of section 5 were erroneously duplicated.
Aviation Finance Rating Methodology Project Finance
15 November 2021
6/26
the market value will be linearly decreased from 49% to 1%.Figure 3 summarises how we determine the day-one value considering
the base value, market value, and the historical low.
In very rare cases a 100% weight can be given to the market value. We will only do so if we identify specific issues with the aircraft
model in question that will have a severe impact on the future value development of the aircraft model.
Determination of the day-one value
Determining the day-one value
Market value vs historical low Market value weight
Base value <= market value Market value > historical low 0%
Base value > market value Market value > historical low 1% - 49%
Determined by where the market value lies in relation to the
base value and historical low
Base value > market value Market value <= historical low 50%
Base value > market value Market value <= historical low 100% weight can be given to market value in very rare cases
Source: Scope
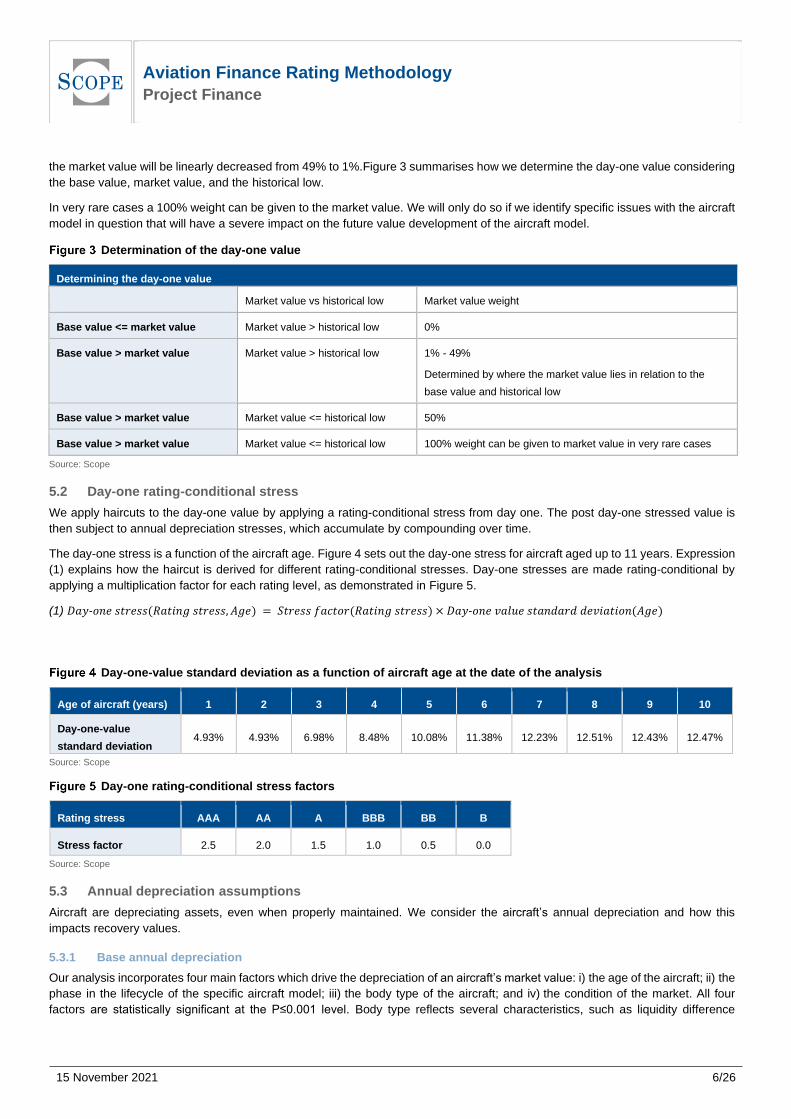
5.2 Day-one rating-conditional stress
We apply haircuts to the day-one value by applying a rating-conditional stress from day one. The post day-one stressed value is
then subject to annual depreciation stresses, which accumulate by compounding over time.
The day-one stress is a function of the aircraft age. Figure 4 sets out the day-one stress for aircraft aged up to 11 years. Expression
(1) explains how the haircut is derived for different rating-conditional stresses. Day-one stresses are made rating-conditional by
applying a multiplication factor for each rating level, as demonstrated in Figure 5.
(1) 𝐷𝑎𝑦-𝑜𝑛𝑒 𝑠𝑡𝑟𝑒𝑠𝑠(𝑅𝑎𝑡𝑖𝑛𝑔 𝑠𝑡𝑟𝑒𝑠𝑠, 𝐴𝑔𝑒) = 𝑆𝑡𝑟𝑒𝑠𝑠 𝑓𝑎𝑐𝑡𝑜𝑟(𝑅𝑎𝑡𝑖𝑛𝑔 𝑠𝑡𝑟𝑒𝑠𝑠) × 𝐷𝑎𝑦-𝑜𝑛𝑒 𝑣𝑎𝑙𝑢𝑒 𝑠𝑡𝑎𝑛𝑑𝑎𝑟𝑑 𝑑𝑒𝑣𝑖𝑎𝑡𝑖𝑜𝑛(𝐴𝑔𝑒)
Day-one-value standard deviation as a function of aircraft age at the date of the analysis
Age of aircraft (years) 1 2 3 4 5 6 7 8 9 10
Day-one-value
standard deviation 4.93% 4.93% 6.98% 8.48% 10.08% 11.38% 12.23% 12.51% 12.43% 12.47%
Source: Scope
Day-one rating-conditional stress factors
Rating stress AAA AA A BBB BB B
Stress factor 2.5 2.0 1.5 1.0 0.5 0.0
Source: Scope
5.3 Annual depreciation assumptions
Aircraft are depreciating assets, even when properly maintained. We consider the aircraft’s annual depreciation and how this
impacts recovery values.
5.3.1 Base annual depreciation
Our analysis incorporates four main factors which drive the depreciation of an aircraft’s market value: i) the age of the aircraft; ii) the
phase in the lifecycle of the specific aircraft model; iii) the body type of the aircraft; and iv) the condition of the market. All four
factors are statistically significant at the P≤0.001 level. Body type reflects several characteristics, such as liquidity difference
Aviation Finance Rating Methodology Project Finance
15 November 2021
7/26
between aircraft bodies. We developed our aircraft-value methodology using more than 26 years of historical aircraft values
provided by the Aircraft Value Analysis Company (AVAC).
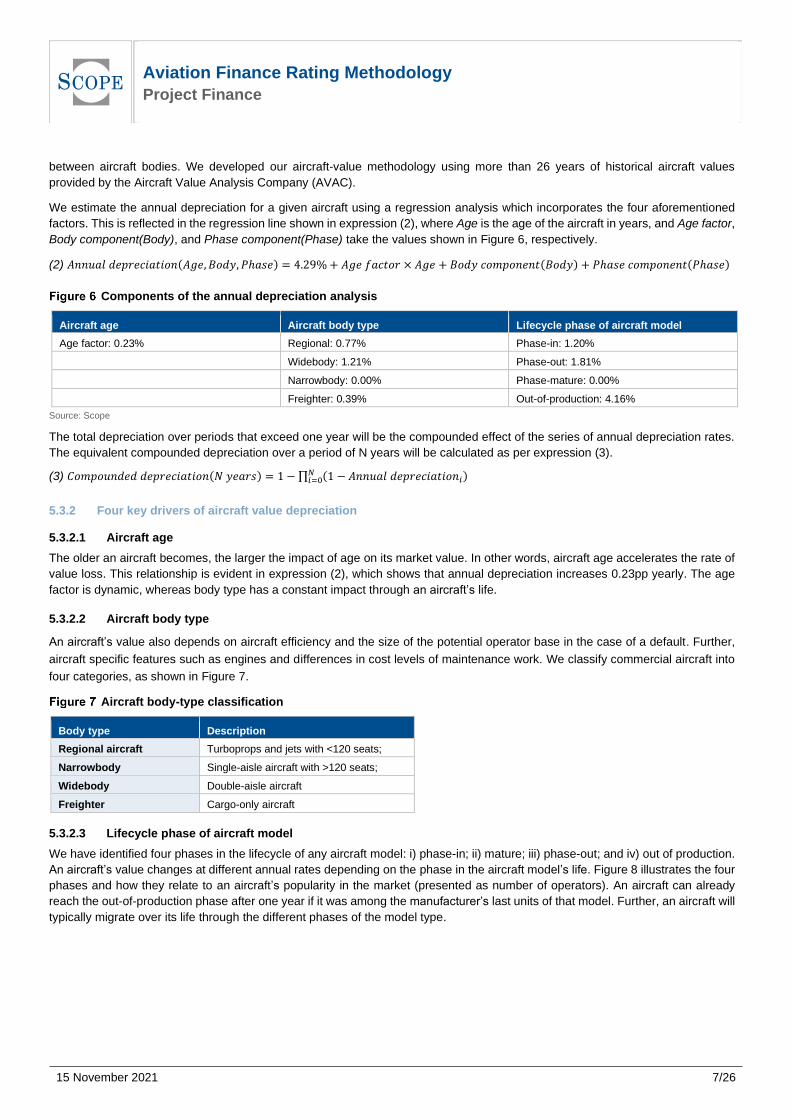
We estimate the annual depreciation for a given aircraft using a regression analysis which incorporates the four aforementioned
factors. This is reflected in the regression line shown in expression (2), where Age is the age of the aircraft in years, and Age factor,
Body component(Body), and Phase component(Phase) take the values shown in Figure 6, respectively.
(2) 𝐴𝑛𝑛𝑢𝑎𝑙 𝑑𝑒𝑝𝑟𝑒𝑐𝑖𝑎𝑡𝑖𝑜𝑛(𝐴𝑔𝑒, 𝐵𝑜𝑑𝑦, 𝑃ℎ𝑎𝑠𝑒) = 4.29%+ 𝐴𝑔𝑒 𝑓𝑎𝑐𝑡𝑜𝑟 × 𝐴𝑔𝑒 + 𝐵𝑜𝑑𝑦 𝑐𝑜𝑚𝑝𝑜𝑛𝑒𝑛𝑡(𝐵𝑜𝑑𝑦) + 𝑃ℎ𝑎𝑠𝑒 𝑐𝑜𝑚𝑝𝑜𝑛𝑒𝑛𝑡(𝑃ℎ𝑎𝑠𝑒)
Components of the annual depreciation analysis
Aircraft age Aircraft body type Lifecycle phase of aircraft model
Age factor: 0.23% Regional: 0.77% Phase-in: 1.20%
Widebody: 1.21% Phase-out: 1.81%
Narrowbody: 0.00% Phase-mature: 0.00%
Freighter: 0.39% Out-of-production: 4.16%
Source: Scope
The total depreciation over periods that exceed one year will be the compounded effect of the series of annual depreciation rates.
The equivalent compounded depreciation over a period of N years will be calculated as per expression (3).
(3) 𝐶𝑜𝑚𝑝𝑜𝑢𝑛𝑑𝑒𝑑 𝑑𝑒𝑝𝑟𝑒𝑐𝑖𝑎𝑡𝑖𝑜𝑛(𝑁 𝑦𝑒𝑎𝑟𝑠) = 1 − ∏ (1 − 𝐴𝑛𝑛𝑢𝑎𝑙 𝑑𝑒𝑝𝑟𝑒𝑐𝑖𝑎𝑡𝑖𝑜𝑛𝑖)𝑁𝑖=0
5.3.2 Four key drivers of aircraft value depreciation
5.3.2.1 Aircraft age
The older an aircraft becomes, the larger the impact of age on its market value. In other words, aircraft age accelerates the rate of
value loss. This relationship is evident in expression (2), which shows that annual depreciation increases 0.23pp yearly. The age
factor is dynamic, whereas body type has a constant impact through an aircraft’s life.
5.3.2.2 Aircraft body type
An aircraft’s value also depends on aircraft efficiency and the size of the potential operator base in the case of a default. Further,
aircraft specific features such as engines and differences in cost levels of maintenance work. We classify commercial aircraft into
four categories, as shown in Figure 7.
Aircraft body-type classification
Body type Description
Regional aircraft Turboprops and jets with <120 seats;
Narrowbody Single-aisle aircraft with >120 seats;
Widebody Double-aisle aircraft
Freighter Cargo-only aircraft
5.3.2.3 Lifecycle phase of aircraft model
We have identified four phases in the lifecycle of any aircraft model: i) phase-in; ii) mature; iii) phase-out; and iv) out of production.
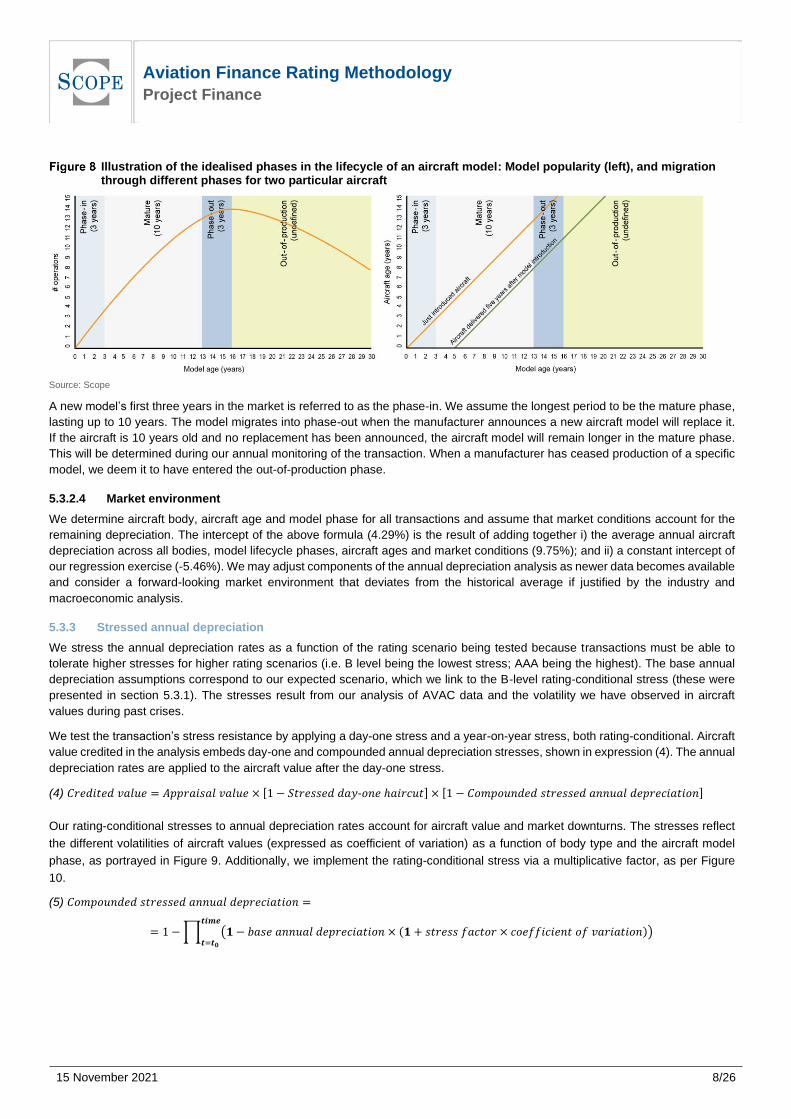
An aircraft’s value changes at different annual rates depending on the phase in the aircraft model’s life. Figure 8 illustrates the four
phases and how they relate to an aircraft’s popularity in the market (presented as number of operators). An aircraft can already
reach the out-of-production phase after one year if it was among the manufacturer’s last units of that model. Further, an aircraft will
typically migrate over its life through the different phases of the model type.
Aviation Finance Rating Methodology Project Finance
15 November 2021
8/26
Illustration of the idealised phases in the lifecycle of an aircraft model: Model popularity (left), and migration through different phases for two particular aircraft
Source: Scope
A new model’s first three years in the market is referred to as the phase-in. We assume the longest period to be the mature phase,
lasting up to 10 years. The model migrates into phase-out when the manufacturer announces a new aircraft model will replace it.
If the aircraft is 10 years old and no replacement has been announced, the aircraft model will remain longer in the mature phase.
This will be determined during our annual monitoring of the transaction. When a manufacturer has ceased production of a specific
model, we deem it to have entered the out-of-production phase.
5.3.2.4 Market environment
We determine aircraft body, aircraft age and model phase for all transactions and assume that market conditions account for the
remaining depreciation. The intercept of the above formula (4.29%) is the result of adding together i) the average annual aircraft
depreciation across all bodies, model lifecycle phases, aircraft ages and market conditions (9.75%); and ii) a constant intercept of
our regression exercise (-5.46%). We may adjust components of the annual depreciation analysis as newer data becomes available
and consider a forward-looking market environment that deviates from the historical average if justified by the industry and
macroeconomic analysis.
5.3.3 Stressed annual depreciation
We stress the annual depreciation rates as a function of the rating scenario being tested because transactions must be able to
tolerate higher stresses for higher rating scenarios (i.e. B level being the lowest stress; AAA being the highest). The base annual
depreciation assumptions correspond to our expected scenario, which we link to the B-level rating-conditional stress (these were
presented in section 5.3.1). The stresses result from our analysis of AVAC data and the volatility we have observed in aircraft
values during past crises.
We test the transaction’s stress resistance by applying a day-one stress and a year-on-year stress, both rating-conditional. Aircraft
value credited in the analysis embeds day-one and compounded annual depreciation stresses, shown in expression (4). The annual
depreciation rates are applied to the aircraft value after the day-one stress.
(4) 𝐶𝑟𝑒𝑑𝑖𝑡𝑒𝑑 𝑣𝑎𝑙𝑢𝑒 = 𝐴𝑝𝑝𝑟𝑎𝑖𝑠𝑎𝑙 𝑣𝑎𝑙𝑢𝑒 × [1 − 𝑆𝑡𝑟𝑒𝑠𝑠𝑒𝑑 𝑑𝑎𝑦-𝑜𝑛𝑒 ℎ𝑎𝑖𝑟𝑐𝑢𝑡] × [1 − 𝐶𝑜𝑚𝑝𝑜𝑢𝑛𝑑𝑒𝑑 𝑠𝑡𝑟𝑒𝑠𝑠𝑒𝑑 𝑎𝑛𝑛𝑢𝑎𝑙 𝑑𝑒𝑝𝑟𝑒𝑐𝑖𝑎𝑡𝑖𝑜𝑛]
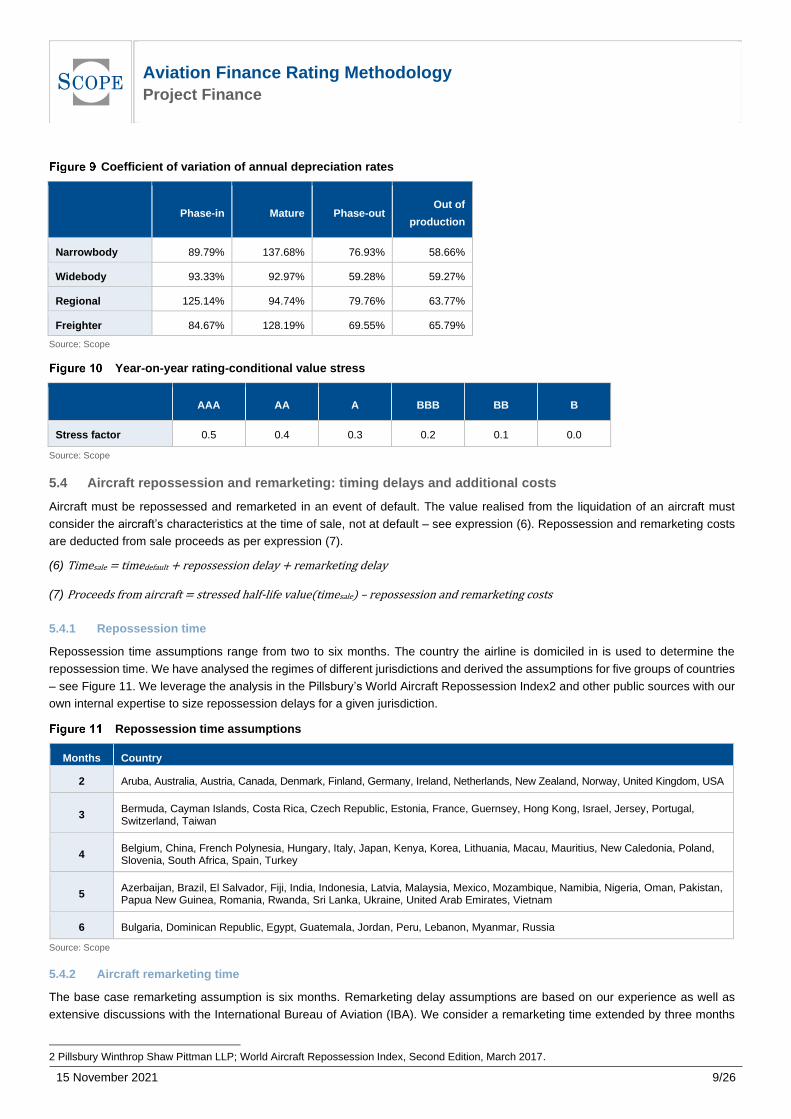
Our rating-conditional stresses to annual depreciation rates account for aircraft value and market downturns. The stresses reflect
the different volatilities of aircraft values (expressed as coefficient of variation) as a function of body type and the aircraft model
phase, as portrayed in Figure 9. Additionally, we implement the rating-conditional stress via a multiplicative factor, as per Figure
10.
(5) 𝐶𝑜𝑚𝑝𝑜𝑢𝑛𝑑𝑒𝑑 𝑠𝑡𝑟𝑒𝑠𝑠𝑒𝑑 𝑎𝑛𝑛𝑢𝑎𝑙 𝑑𝑒𝑝𝑟𝑒𝑐𝑖𝑎𝑡𝑖𝑜𝑛 =
= 1 −∏ (𝟏 − 𝑏𝑎𝑠𝑒 𝑎𝑛𝑛𝑢𝑎𝑙 𝑑𝑒𝑝𝑟𝑒𝑐𝑖𝑎𝑡𝑖𝑜𝑛 × (𝟏 + 𝑠𝑡𝑟𝑒𝑠𝑠 𝑓𝑎𝑐𝑡𝑜𝑟 × 𝑐𝑜𝑒𝑓𝑓𝑖𝑐𝑖𝑒𝑛𝑡 𝑜𝑓 𝑣𝑎𝑟𝑖𝑎𝑡𝑖𝑜𝑛))𝒕𝒊𝒎𝒆
𝒕=𝒕𝟎
Aviation Finance Rating Methodology Project Finance
15 November 2021
9/26
Coefficient of variation of annual depreciation rates
Phase-in Mature Phase-out
Out of
production
Narrowbody 89.79% 137.68% 76.93% 58.66%
Widebody 93.33% 92.97% 59.28% 59.27%
Regional 125.14% 94.74% 79.76% 63.77%
Freighter 84.67% 128.19% 69.55% 65.79%
Source: Scope
Year-on-year rating-conditional value stress
AAA AA A BBB BB B
Stress factor 0.5 0.4 0.3 0.2 0.1 0.0
Source: Scope
5.4 Aircraft repossession and remarketing: timing delays and additional costs
Aircraft must be repossessed and remarketed in an event of default. The value realised from the liquidation of an aircraft must
consider the aircraft’s characteristics at the time of sale, not at default – see expression (6). Repossession and remarketing costs
are deducted from sale proceeds as per expression (7).
(6) Timesale = timedefault + repossession delay + remarketing delay
(7) Proceeds from aircraft = stressed half-life value(timesale) – repossession and remarketing costs
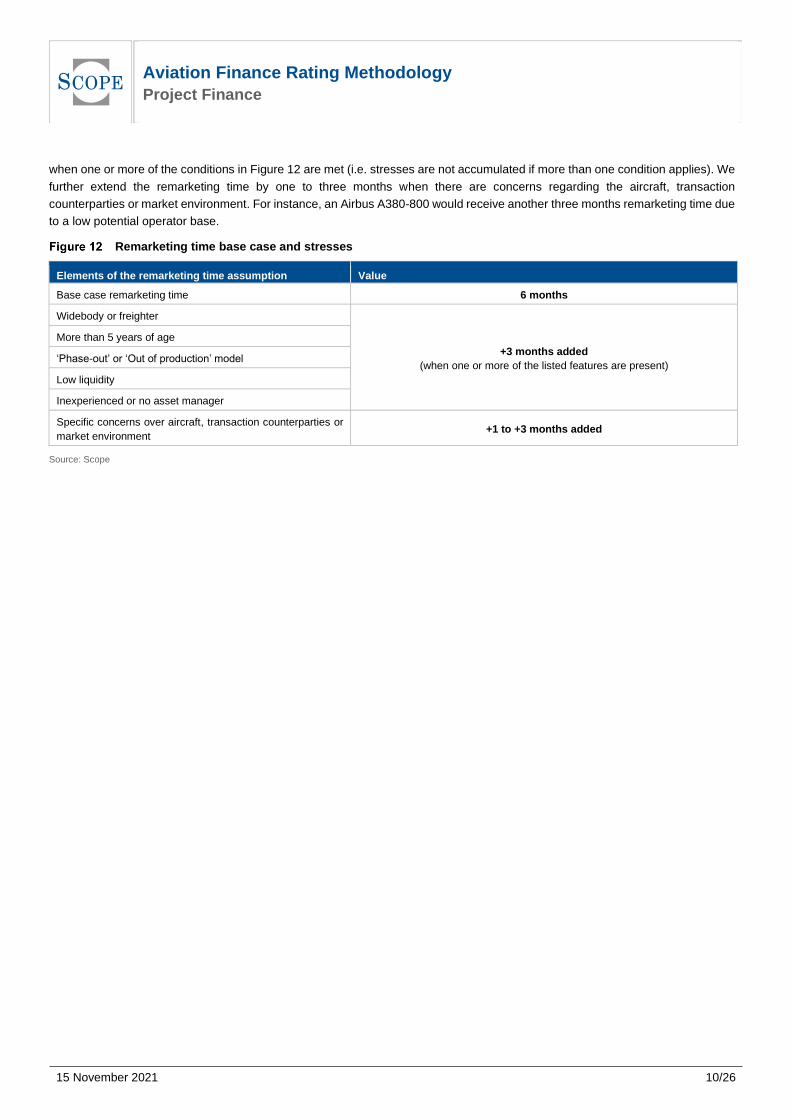
5.4.1 Repossession time
Repossession time assumptions range from two to six months. The country the airline is domiciled in is used to determine the
repossession time. We have analysed the regimes of different jurisdictions and derived the assumptions for five groups of countries
– see Figure 11. We leverage the analysis in the Pillsbury’s World Aircraft Repossession Index2 and other public sources with our
own internal expertise to size repossession delays for a given jurisdiction.
Repossession time assumptions
Months Country
2 Aruba, Australia, Austria, Canada, Denmark, Finland, Germany, Ireland, Netherlands, New Zealand, Norway, United Kingdom, USA
3 Bermuda, Cayman Islands, Costa Rica, Czech Republic, Estonia, France, Guernsey, Hong Kong, Israel, Jersey, Portugal, Switzerland, Taiwan
4 Belgium, China, French Polynesia, Hungary, Italy, Japan, Kenya, Korea, Lithuania, Macau, Mauritius, New Caledonia, Poland, Slovenia, South Africa, Spain, Turkey
5 Azerbaijan, Brazil, El Salvador, Fiji, India, Indonesia, Latvia, Malaysia, Mexico, Mozambique, Namibia, Nigeria, Oman, Pakistan, Papua New Guinea, Romania, Rwanda, Sri Lanka, Ukraine, United Arab Emirates, Vietnam
6 Bulgaria, Dominican Republic, Egypt, Guatemala, Jordan, Peru, Lebanon, Myanmar, Russia
Source: Scope
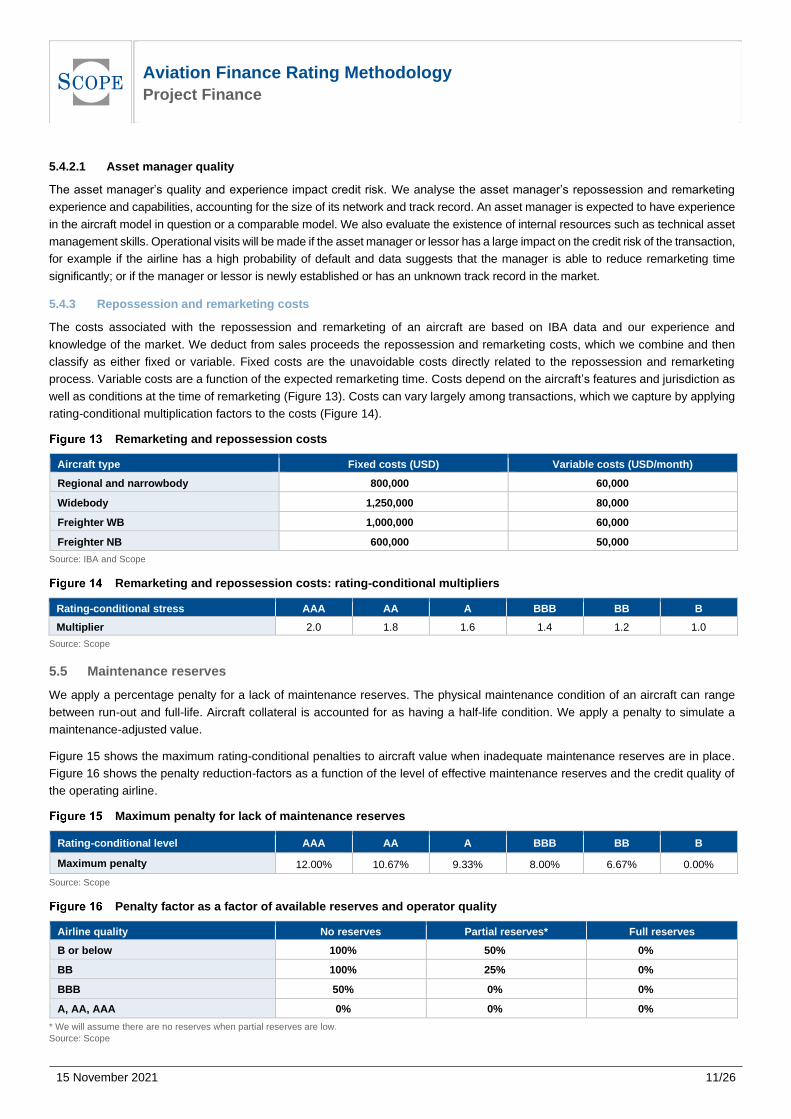
5.4.2 Aircraft remarketing time
The base case remarketing assumption is six months. Remarketing delay assumptions are based on our experience as well as
extensive discussions with the International Bureau of Aviation (IBA). We consider a remarketing time extended by three months
2 Pillsbury Winthrop Shaw Pittman LLP; World Aircraft Repossession Index, Second Edition, March 2017.
Aviation Finance Rating Methodology Project Finance
15 November 2021
10/26
when one or more of the conditions in Figure 12 are met (i.e. stresses are not accumulated if more than one condition applies). We
further extend the remarketing time by one to three months when there are concerns regarding the aircraft, transaction
counterparties or market environment. For instance, an Airbus A380-800 would receive another three months remarketing time due
to a low potential operator base.
Remarketing time base case and stresses
Elements of the remarketing time assumption Value
Base case remarketing time 6 months
Widebody or freighter
+3 months added
(when one or more of the listed features are present)
More than 5 years of age
‘Phase-out’ or ‘Out of production’ model
Low liquidity
Inexperienced or no asset manager
Specific concerns over aircraft, transaction counterparties or
market environment +1 to +3 months added
Source: Scope
Aviation Finance Rating Methodology Project Finance
15 November 2021
11/26
5.4.2.1 Asset manager quality
The asset manager’s quality and experience impact credit risk. We analyse the asset manager’s repossession and remarketing
experience and capabilities, accounting for the size of its network and track record. An asset manager is expected to have experience
in the aircraft model in question or a comparable model. We also evaluate the existence of internal resources such as technical asset
management skills. Operational visits will be made if the asset manager or lessor has a large impact on the credit risk of the transaction,
for example if the airline has a high probability of default and data suggests that the manager is able to reduce remarketing time
significantly; or if the manager or lessor is newly established or has an unknown track record in the market.
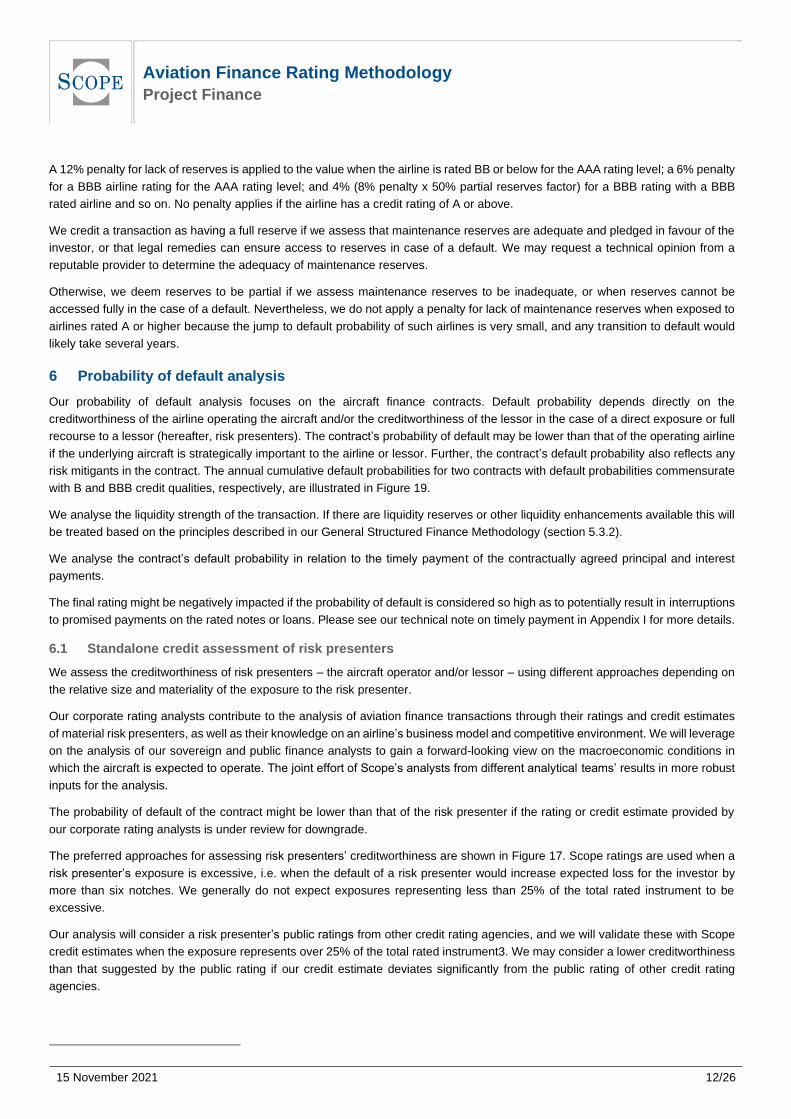
5.4.3 Repossession and remarketing costs
The costs associated with the repossession and remarketing of an aircraft are based on IBA data and our experience and
knowledge of the market. We deduct from sales proceeds the repossession and remarketing costs, which we combine and then
classify as either fixed or variable. Fixed costs are the unavoidable costs directly related to the repossession and remarketing
process. Variable costs are a function of the expected remarketing time. Costs depend on the aircraft’s features and jurisdiction as
well as conditions at the time of remarketing (Figure 13). Costs can vary largely among transactions, which we capture by applying
rating-conditional multiplication factors to the costs (Figure 14).
Remarketing and repossession costs
Aircraft type Fixed costs (USD) Variable costs (USD/month)
Regional and narrowbody 800,000 60,000
Widebody 1,250,000 80,000
Freighter WB 1,000,000 60,000
Freighter NB 600,000 50,000
Source: IBA and Scope
Remarketing and repossession costs: rating-conditional multipliers
Rating-conditional stress AAA AA A BBB BB B
Multiplier 2.0 1.8 1.6 1.4 1.2 1.0
Source: Scope
5.5 Maintenance reserves
We apply a percentage penalty for a lack of maintenance reserves. The physical maintenance condition of an aircraft can range
between run-out and full-life. Aircraft collateral is accounted for as having a half-life condition. We apply a penalty to simulate a
maintenance-adjusted value.
Figure 15 shows the maximum rating-conditional penalties to aircraft value when inadequate maintenance reserves are in place.
Figure 16 shows the penalty reduction-factors as a function of the level of effective maintenance reserves and the credit quality of
the operating airline.
Maximum penalty for lack of maintenance reserves
Rating-conditional level AAA AA A BBB BB B
Maximum penalty 12.00% 10.67% 9.33% 8.00% 6.67% 0.00%
Source: Scope
Penalty factor as a factor of available reserves and operator quality
Airline quality No reserves Partial reserves* Full reserves
B or below 100% 50% 0%
BB 100% 25% 0%
BBB 50% 0% 0%
A, AA, AAA 0% 0% 0%
* We will assume there are no reserves when partial reserves are low.
Source: Scope
Aviation Finance Rating Methodology Project Finance
15 November 2021
12/26
A 12% penalty for lack of reserves is applied to the value when the airline is rated BB or below for the AAA rating level; a 6% penalty
for a BBB airline rating for the AAA rating level; and 4% (8% penalty x 50% partial reserves factor) for a BBB rating with a BBB
rated airline and so on. No penalty applies if the airline has a credit rating of A or above.
We credit a transaction as having a full reserve if we assess that maintenance reserves are adequate and pledged in favour of the
investor, or that legal remedies can ensure access to reserves in case of a default. We may request a technical opinion from a
reputable provider to determine the adequacy of maintenance reserves.
Otherwise, we deem reserves to be partial if we assess maintenance reserves to be inadequate, or when reserves cannot be
accessed fully in the case of a default. Nevertheless, we do not apply a penalty for lack of maintenance reserves when exposed to
airlines rated A or higher because the jump to default probability of such airlines is very small, and any transition to default would
likely take several years.
6 Probability of default analysis
Our probability of default analysis focuses on the aircraft finance contracts. Default probability depends directly on the
creditworthiness of the airline operating the aircraft and/or the creditworthiness of the lessor in the case of a direct exposure or full
recourse to a lessor (hereafter, risk presenters). The contract’s probability of default may be lower than that of the operating airline
if the underlying aircraft is strategically important to the airline or lessor. Further, the contract’s default probability also reflects any
risk mitigants in the contract. The annual cumulative default probabilities for two contracts with default probabilities commensurate
with B and BBB credit qualities, respectively, are illustrated in Figure 19.
We analyse the liquidity strength of the transaction. If there are liquidity reserves or other liquidity enhancements available this will
be treated based on the principles described in our General Structured Finance Methodology (section 5.3.2).
We analyse the contract’s default probability in relation to the timely payment of the contractually agreed principal and interest
payments.
The final rating might be negatively impacted if the probability of default is considered so high as to potentially result in interruptions
to promised payments on the rated notes or loans. Please see our technical note on timely payment in Appendix I for more details.
6.1 Standalone credit assessment of risk presenters
We assess the creditworthiness of risk presenters – the aircraft operator and/or lessor – using different approaches depending on
the relative size and materiality of the exposure to the risk presenter.
Our corporate rating analysts contribute to the analysis of aviation finance transactions through their ratings and credit estimates
of material risk presenters, as well as their knowledge on an airline’s business model and competitive environment. We will leverage
on the analysis of our sovereign and public finance analysts to gain a forward-looking view on the macroeconomic conditions in
which the aircraft is expected to operate. The joint effort of Scope’s analysts from different analytical teams’ results in more robust
inputs for the analysis.
The probability of default of the contract might be lower than that of the risk presenter if the rating or credit estimate provided by
our corporate rating analysts is under review for downgrade.
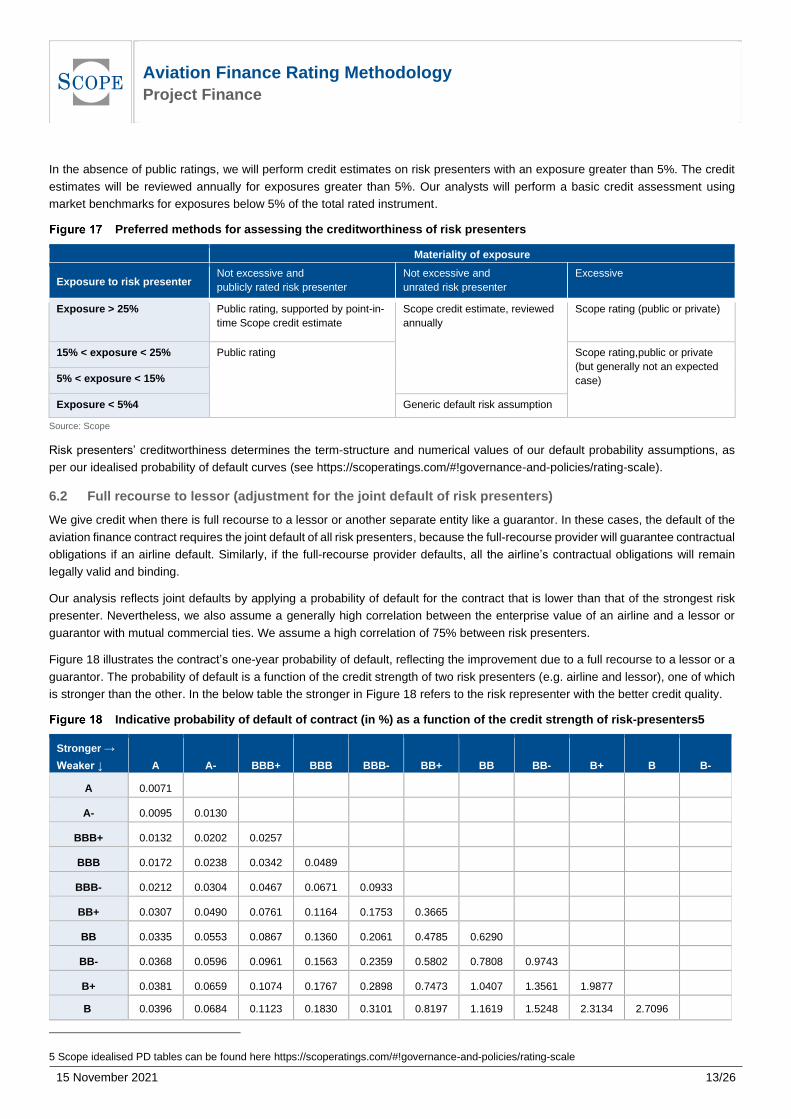
The preferred approaches for assessing risk presenters’ creditworthiness are shown in Figure 17. Scope ratings are used when a
risk presenter’s exposure is excessive, i.e. when the default of a risk presenter would increase expected loss for the investor by
more than six notches. We generally do not expect exposures representing less than 25% of the total rated instrument to be
excessive.
Our analysis will consider a risk presenter’s public ratings from other credit rating agencies, and we will validate these with Scope
credit estimates when the exposure represents over 25% of the total rated instrument3. We may consider a lower creditworthiness
than that suggested by the public rating if our credit estimate deviates significantly from the public rating of other credit rating
agencies.
Aviation Finance Rating Methodology Project Finance
15 November 2021
13/26
In the absence of public ratings, we will perform credit estimates on risk presenters with an exposure greater than 5%. The credit
estimates will be reviewed annually for exposures greater than 5%. Our analysts will perform a basic credit assessment using
market benchmarks for exposures below 5% of the total rated instrument.
Preferred methods for assessing the creditworthiness of risk presenters
Materiality of exposure
Exposure to risk presenter Not excessive and
publicly rated risk presenter
Not excessive and
unrated risk presenter
Excessive
Exposure > 25% Public rating, supported by point-in-
time Scope credit estimate
Scope credit estimate, reviewed
annually
Scope rating (public or private)
15% < exposure < 25% Public rating Scope rating,public or private
(but generally not an expected
case) 5% < exposure < 15%
Exposure < 5%4 Generic default risk assumption
Source: Scope
Risk presenters’ creditworthiness determines the term-structure and numerical values of our default probability assumptions, as
per our idealised probability of default curves (see https://scoperatings.com/#!governance-and-policies/rating-scale).
6.2 Full recourse to lessor (adjustment for the joint default of risk presenters)
We give credit when there is full recourse to a lessor or another separate entity like a guarantor. In these cases, the default of the
aviation finance contract requires the joint default of all risk presenters, because the full-recourse provider will guarantee contractual
obligations if an airline default. Similarly, if the full-recourse provider defaults, all the airline’s contractual obligations will remain
legally valid and binding.
Our analysis reflects joint defaults by applying a probability of default for the contract that is lower than that of the strongest risk
presenter. Nevertheless, we also assume a generally high correlation between the enterprise value of an airline and a lessor or
guarantor with mutual commercial ties. We assume a high correlation of 75% between risk presenters.
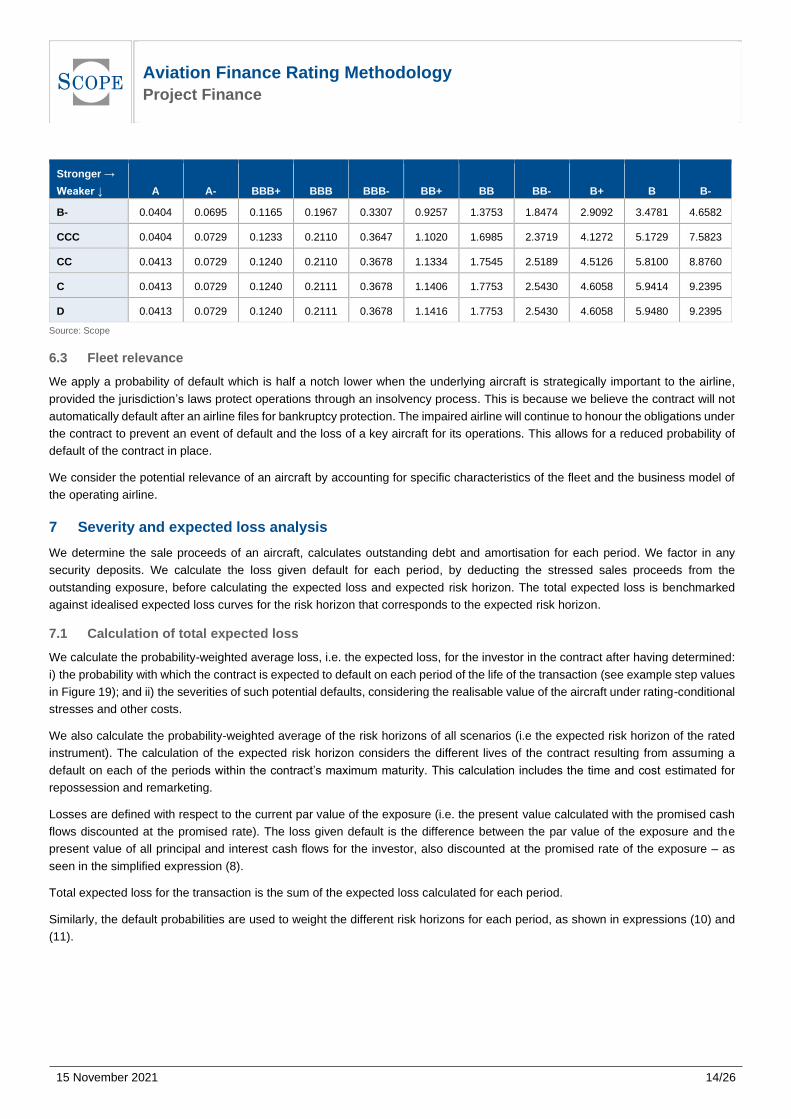
Figure 18 illustrates the contract’s one-year probability of default, reflecting the improvement due to a full recourse to a lessor or a
guarantor. The probability of default is a function of the credit strength of two risk presenters (e.g. airline and lessor), one of which
is stronger than the other. In the below table the stronger in Figure 18 refers to the risk representer with the better credit quality.
Indicative probability of default of contract (in %) as a function of the credit strength of risk-presenters5
Stronger →
Weaker ↓ A A- BBB+ BBB BBB- BB+ BB BB- B+ B B-
A 0.0071
A- 0.0095 0.0130
BBB+ 0.0132 0.0202 0.0257
BBB 0.0172 0.0238 0.0342 0.0489
BBB- 0.0212 0.0304 0.0467 0.0671 0.0933
BB+ 0.0307 0.0490 0.0761 0.1164 0.1753 0.3665
BB 0.0335 0.0553 0.0867 0.1360 0.2061 0.4785 0.6290
BB- 0.0368 0.0596 0.0961 0.1563 0.2359 0.5802 0.7808 0.9743
B+ 0.0381 0.0659 0.1074 0.1767 0.2898 0.7473 1.0407 1.3561 1.9877
B 0.0396 0.0684 0.1123 0.1830 0.3101 0.8197 1.1619 1.5248 2.3134 2.7096
5 Scope idealised PD tables can be found here https://scoperatings.com/#!governance-and-policies/rating-scale
Aviation Finance Rating Methodology Project Finance
15 November 2021
14/26
Stronger →
Weaker ↓ A A- BBB+ BBB BBB- BB+ BB BB- B+ B B-
B- 0.0404 0.0695 0.1165 0.1967 0.3307 0.9257 1.3753 1.8474 2.9092 3.4781 4.6582
CCC 0.0404 0.0729 0.1233 0.2110 0.3647 1.1020 1.6985 2.3719 4.1272 5.1729 7.5823
CC 0.0413 0.0729 0.1240 0.2110 0.3678 1.1334 1.7545 2.5189 4.5126 5.8100 8.8760
C 0.0413 0.0729 0.1240 0.2111 0.3678 1.1406 1.7753 2.5430 4.6058 5.9414 9.2395
D 0.0413 0.0729 0.1240 0.2111 0.3678 1.1416 1.7753 2.5430 4.6058 5.9480 9.2395
Source: Scope
6.3 Fleet relevance
We apply a probability of default which is half a notch lower when the underlying aircraft is strategically important to the airline,
provided the jurisdiction’s laws protect operations through an insolvency process. This is because we believe the contract will not
automatically default after an airline files for bankruptcy protection. The impaired airline will continue to honour the obligations under
the contract to prevent an event of default and the loss of a key aircraft for its operations. This allows for a reduced probability of
default of the contract in place.
We consider the potential relevance of an aircraft by accounting for specific characteristics of the fleet and the business model of
the operating airline.
7 Severity and expected loss analysis
We determine the sale proceeds of an aircraft, calculates outstanding debt and amortisation for each period. We factor in any
security deposits. We calculate the loss given default for each period, by deducting the stressed sales proceeds from the
outstanding exposure, before calculating the expected loss and expected risk horizon. The total expected loss is benchmarked
against idealised expected loss curves for the risk horizon that corresponds to the expected risk horizon.
7.1 Calculation of total expected loss
We calculate the probability-weighted average loss, i.e. the expected loss, for the investor in the contract after having determined:
i) the probability with which the contract is expected to default on each period of the life of the transaction (see example step values
in Figure 19); and ii) the severities of such potential defaults, considering the realisable value of the aircraft under rating-conditional
stresses and other costs.
We also calculate the probability-weighted average of the risk horizons of all scenarios (i.e the expected risk horizon of the rated
instrument). The calculation of the expected risk horizon considers the different lives of the contract resulting from assuming a
default on each of the periods within the contract’s maximum maturity. This calculation includes the time and cost estimated for
repossession and remarketing.
Losses are defined with respect to the current par value of the exposure (i.e. the present value calculated with the promised cash
flows discounted at the promised rate). The loss given default is the difference between the par value of the exposure and the
present value of all principal and interest cash flows for the investor, also discounted at the promised rate of the exposure – as
seen in the simplified expression (8).
Total expected loss for the transaction is the sum of the expected loss calculated for each period.
Similarly, the default probabilities are used to weight the different risk horizons for each period, as shown in expressions (10) and
(11).
Aviation Finance Rating Methodology Project Finance
15 November 2021
15/26
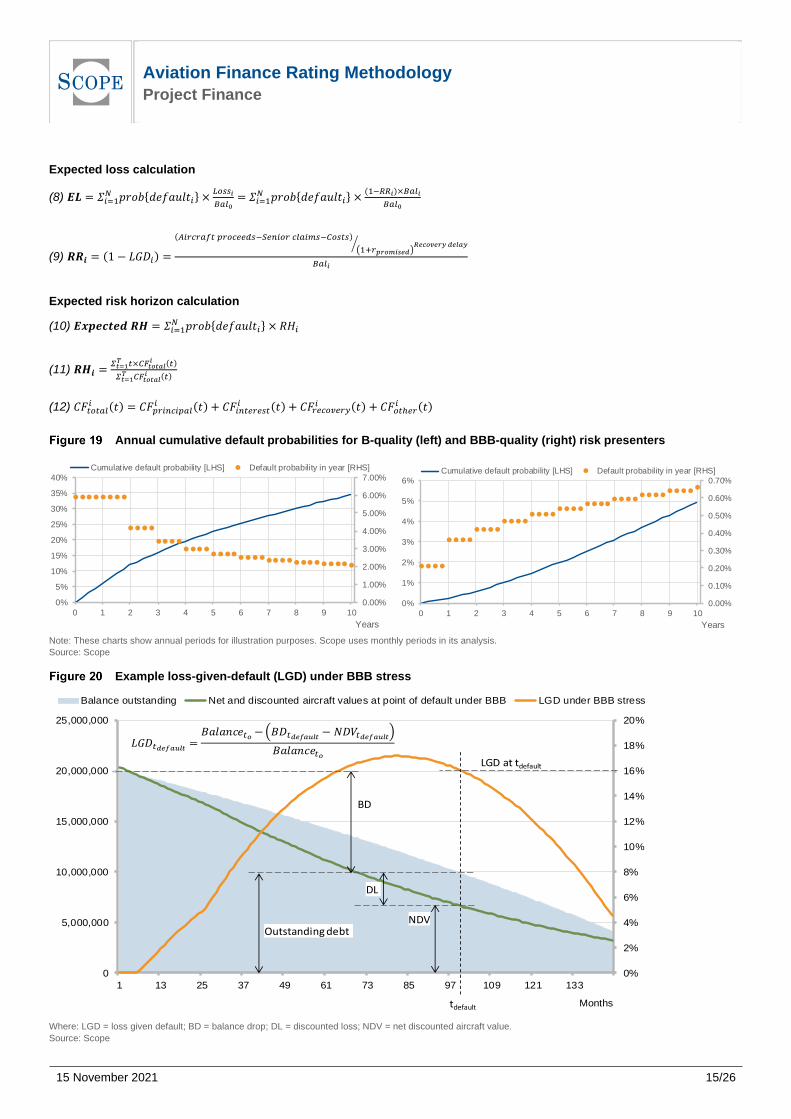
Expected loss calculation
(8) 𝑬𝑳 = 𝛴𝑖=1𝑁 𝑝𝑟𝑜𝑏{𝑑𝑒𝑓𝑎𝑢𝑙𝑡𝑖} ×
𝐿𝑜𝑠𝑠𝑖
𝐵𝑎𝑙0= 𝛴𝑖=1
𝑁 𝑝𝑟𝑜𝑏{𝑑𝑒𝑓𝑎𝑢𝑙𝑡𝑖} ×(1−𝑅𝑅𝑖)×𝐵𝑎𝑙𝑖
𝐵𝑎𝑙0
(9) 𝑹𝑹𝒊 = (1 − 𝐿𝐺𝐷𝑖) =
(𝐴𝑖𝑟𝑐𝑟𝑎𝑓𝑡 𝑝𝑟𝑜𝑐𝑒𝑒𝑑𝑠−𝑆𝑒𝑛𝑖𝑜𝑟 𝑐𝑙𝑎𝑖𝑚𝑠−𝐶𝑜𝑠𝑡𝑠)
(1+𝑟𝑝𝑟𝑜𝑚𝑖𝑠𝑒𝑑)𝑅𝑒𝑐𝑜𝑣𝑒𝑟𝑦 𝑑𝑒𝑙𝑎𝑦⁄
𝐵𝑎𝑙𝑖
Expected risk horizon calculation
(10) 𝑬𝒙𝒑𝒆𝒄𝒕𝒆𝒅 𝑹𝑯 = 𝛴𝑖=1𝑁 𝑝𝑟𝑜𝑏{𝑑𝑒𝑓𝑎𝑢𝑙𝑡𝑖} × 𝑅𝐻𝑖
(11) 𝑹𝑯𝒊 =𝛴𝑡=1𝑇 𝑡×𝐶𝐹𝑡𝑜𝑡𝑎𝑙
𝑖 (𝑡)
𝛴𝑡=1𝑇 𝐶𝐹𝑡𝑜𝑡𝑎𝑙
𝑖 (𝑡)
(12) 𝐶𝐹𝑡𝑜𝑡𝑎𝑙𝑖 (𝑡) = 𝐶𝐹𝑝𝑟𝑖𝑛𝑐𝑖𝑝𝑎𝑙
𝑖 (𝑡) + 𝐶𝐹𝑖𝑛𝑡𝑒𝑟𝑒𝑠𝑡𝑖 (𝑡) + 𝐶𝐹𝑟𝑒𝑐𝑜𝑣𝑒𝑟𝑦
𝑖 (𝑡) + 𝐶𝐹𝑜𝑡ℎ𝑒𝑟𝑖 (𝑡)
Annual cumulative default probabilities for B-quality (left) and BBB-quality (right) risk presenters
Note: These charts show annual periods for illustration purposes. Scope uses monthly periods in its analysis.
Source: Scope
Example loss-given-default (LGD) under BBB stress
Where: LGD = loss given default; BD = balance drop; DL = discounted loss; NDV = net discounted aircraft value.
Source: Scope
0.00%
1.00%
2.00%
3.00%
4.00%
5.00%
6.00%
7.00%
0%
5%
10%
15%
20%
25%
30%
35%
40%
0 1 2 3 4 5 6 7 8 9 10
Years
Cumulative default probability [LHS] Default probability in year [RHS]
0.00%
0.10%
0.20%
0.30%
0.40%
0.50%
0.60%
0.70%
0%
1%
2%
3%
4%
5%
6%
0 1 2 3 4 5 6 7 8 9 10
Years
Cumulative default probability [LHS] Default probability in year [RHS]
0%
2%
4%
6%
8%
10%
12%
14%
16%
18%
20%
0
5,000,000
10,000,000
15,000,000
20,000,000
25,000,000
1 13 25 37 49 61 73 85 97 109 121 133
Months
Balance outstanding Net and discounted aircraft values at point of default under BBB LGD under BBB stress
LGD at tdefault
DL
NDVOutstanding debt
BD
tdefault
𝐿𝐺𝐷𝑡𝑑𝑒 𝑎 𝑙𝑡 =𝐵𝑎𝑙𝑎𝑛𝑐𝑒𝑡𝑜− 𝐵𝐷𝑡𝑑𝑒 𝑎 𝑙𝑡 − 𝑁𝐷 𝑡𝑑𝑒 𝑎 𝑙𝑡
𝐵𝑎𝑙𝑎𝑛𝑐𝑒𝑡𝑜
Aviation Finance Rating Methodology Project Finance
15 November 2021
16/26
7.2 Quantitative rating-indication
We compare the expected loss and the expected risk horizon pairs to our idealised expected loss table (see
https://scoperatings.com/#!governance-and-policies/rating-scale) and derives a quantitative reference or rating-indication for the
rated credit exposure. The rating-indication is the highest rating level which shows maximum losses, for a risk horizon equal to the
expected risk horizon, which are higher than the expected loss for the investor.
8 Rating sensitivity
Our aviation finance rating reports provide the ratings’ stability with respect to the analytical assumptions that influence our
calculation of losses for investors. The sensitivity analysis illustrates how heavily the ratings depend on our analytical assumptions.
Sensitivity scenarios should not be interpreted as likely or expected scenarios.
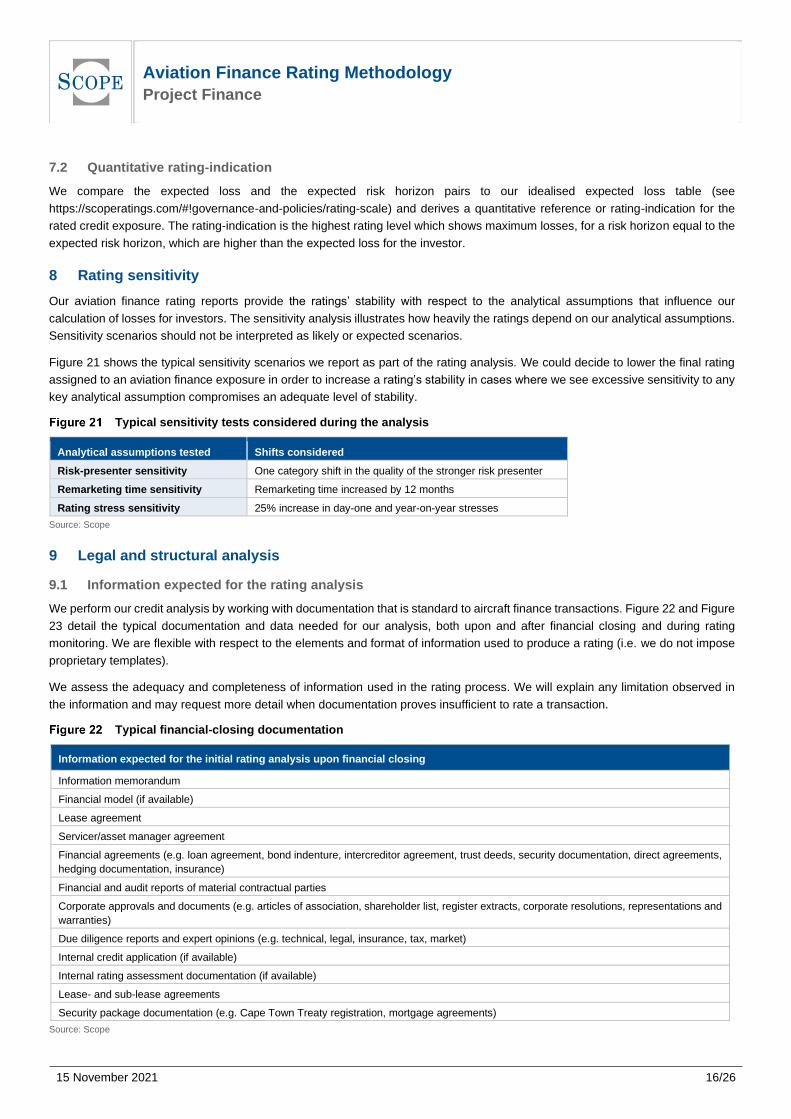
Figure 21 shows the typical sensitivity scenarios we report as part of the rating analysis. We could decide to lower the final rating
assigned to an aviation finance exposure in order to increase a rating’s stability in cases where we see excessive sensitivity to any
key analytical assumption compromises an adequate level of stability.
Typical sensitivity tests considered during the analysis
Analytical assumptions tested Shifts considered
Risk-presenter sensitivity One category shift in the quality of the stronger risk presenter
Remarketing time sensitivity Remarketing time increased by 12 months
Rating stress sensitivity 25% increase in day-one and year-on-year stresses
Source: Scope
9 Legal and structural analysis
9.1 Information expected for the rating analysis
We perform our credit analysis by working with documentation that is standard to aircraft finance transactions. Figure 22 and Figure
23 detail the typical documentation and data needed for our analysis, both upon and after financial closing and during rating
monitoring. We are flexible with respect to the elements and format of information used to produce a rating (i.e. we do not impose
proprietary templates).
We assess the adequacy and completeness of information used in the rating process. We will explain any limitation observed in
the information and may request more detail when documentation proves insufficient to rate a transaction.
Typical financial-closing documentation
Information expected for the initial rating analysis upon financial closing
Information memorandum
Financial model (if available)
Lease agreement
Servicer/asset manager agreement
Financial agreements (e.g. loan agreement, bond indenture, intercreditor agreement, trust deeds, security documentation, direct agreements,
hedging documentation, insurance)
Financial and audit reports of material contractual parties
Corporate approvals and documents (e.g. articles of association, shareholder list, register extracts, corporate resolutions, representations and
warranties)
Due diligence reports and expert opinions (e.g. technical, legal, insurance, tax, market)
Internal credit application (if available)
Internal rating assessment documentation (if available)
Lease- and sub-lease agreements
Security package documentation (e.g. Cape Town Treaty registration, mortgage agreements)
Source: Scope
Aviation Finance Rating Methodology Project Finance
15 November 2021
17/26
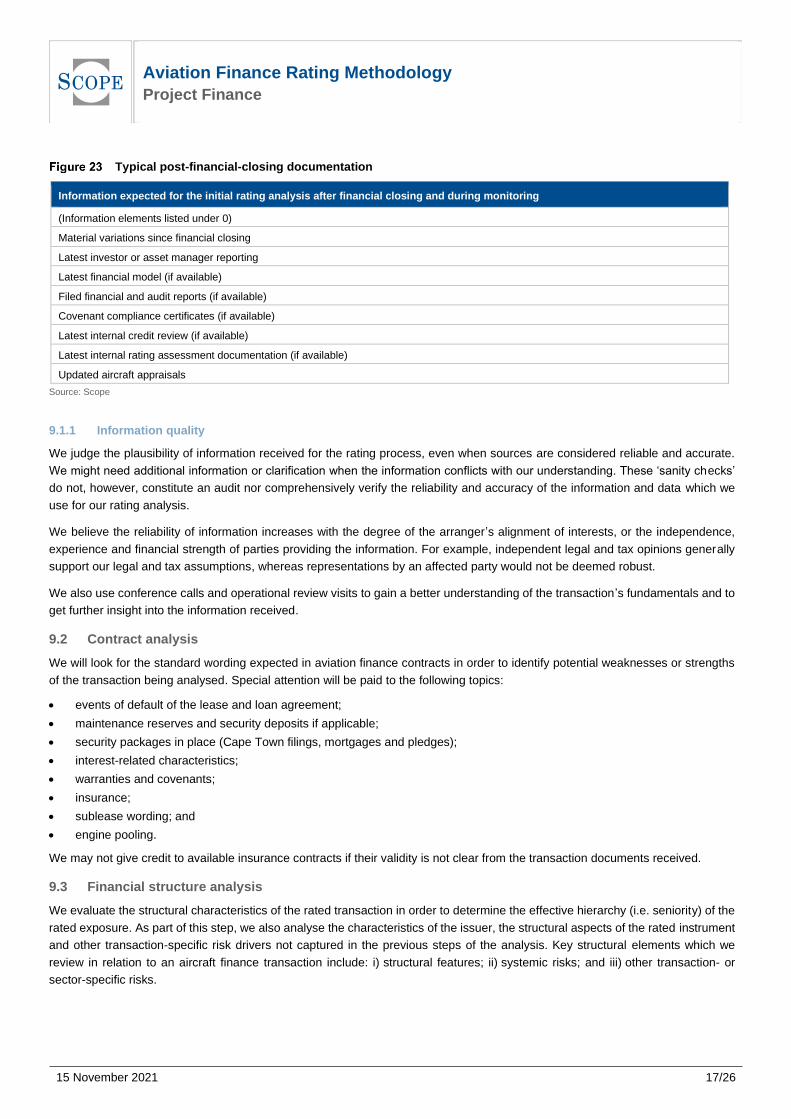
Typical post-financial-closing documentation
Information expected for the initial rating analysis after financial closing and during monitoring
(Information elements listed under 0)
Material variations since financial closing
Latest investor or asset manager reporting
Latest financial model (if available)
Filed financial and audit reports (if available)
Covenant compliance certificates (if available)
Latest internal credit review (if available)
Latest internal rating assessment documentation (if available)
Updated aircraft appraisals
Source: Scope
9.1.1 Information quality
We judge the plausibility of information received for the rating process, even when sources are considered reliable and accurate.
We might need additional information or clarification when the information conflicts with our understanding. These ‘sanity checks’
do not, however, constitute an audit nor comprehensively verify the reliability and accuracy of the information and data which we
use for our rating analysis.
We believe the reliability of information increases with the degree of the arranger’s alignment of interests, or the independence,
experience and financial strength of parties providing the information. For example, independent legal and tax opinions generally
support our legal and tax assumptions, whereas representations by an affected party would not be deemed robust.
We also use conference calls and operational review visits to gain a better understanding of the transaction’s fundamentals and to
get further insight into the information received.
9.2 Contract analysis
We will look for the standard wording expected in aviation finance contracts in order to identify potential weaknesses or strengths
of the transaction being analysed. Special attention will be paid to the following topics:
• events of default of the lease and loan agreement;
• maintenance reserves and security deposits if applicable;
• security packages in place (Cape Town filings, mortgages and pledges);
• interest-related characteristics;
• warranties and covenants;
• insurance;
• sublease wording; and
• engine pooling.
We may not give credit to available insurance contracts if their validity is not clear from the transaction documents received.
9.3 Financial structure analysis
We evaluate the structural characteristics of the rated transaction in order to determine the effective hierarchy (i.e. seniority) of the
rated exposure. As part of this step, we also analyse the characteristics of the issuer, the structural aspects of the rated instrument
and other transaction-specific risk drivers not captured in the previous steps of the analysis. Key structural elements which we
review in relation to an aircraft finance transaction include: i) structural features; ii) systemic risks; and iii) other transaction- or
sector-specific risks.
Aviation Finance Rating Methodology Project Finance
15 November 2021
18/26
Structural features can improve or weaken the transaction’s credit performance. Key structural features generally include: i) the
priorities of interest and principal payments, both pre- and post-enforcement; ii) payment frequencies; iii) enhancement features
such as excess spread, cash reserves or liquidity buffers; and iv) coverage of the issuer’s ordinary and extraordinary expenses.
We expect the transaction documents we review to set forth such structural elements in a legal, valid, binding and enforceable
manner. We typically derive most structural parameters relevant to lease rates and expense assumptions from contractual terms
governing the structure. We rely on expert qualitative assessments when certain parameters are not contractually specified or
include provisions for variable components.
9.4 Legal and tax analysis
We consider the legal framework to assess the legal integrity of the structure and identify any legal issues or weaknesses that could
affect the transaction’s performance. We consider tax aspects associated with the collateral that may affect cash flows within the
transaction. To do this, Scope reviews the tax and legal opinions provided by third-party experts.
It is important when assessing the structure’s integrity to evaluate the likelihood that the issuer could default for reasons unrelated
to collateral or counterparty risks. Such defaults could lead to a liquidation of the collateral and expose the rated instrument to
market value losses even when both the collateral and counterparty perform well.
Our review of the issuer’s bankruptcy remoteness is key to the analysis. It is impossible to remove the risk of issuer bankruptcy
entirely. However, the issuer is generally protected through standard securitisation features specific to the issuer’s nature, as well
as its activity and relationships with the transaction’s parties. We evaluate the strengths of protective elements in the rated
transaction. These elements include the issuer’s legal nature, restrictions on its activity, ownership structure and limited liabilities.
We also review the limited-recourse and non-petition provisions in the transaction contracts which prevent other contractual parties
from causing the issuer to default. This analysis allows us to form an opinion on the issuer’s insolvency risks.
In some transactions, the true sale of aircraft to the issuer by the seller – which is generally the airline or manufacturer – is a key
mechanism for isolating the risks of the securitised collateral. For a large majority of aviation finance transactions, we assess the
legal robustness of the true sale to evaluate the risk of collateral claw-back and consolidation on the seller’s balance sheet, should
the seller default shortly after the collateral is sold.
Tax opinions should be clear on whether any tax liability could affect a transaction’s cash flow, or on the issuer’s ability to pay
principal and interest on the rated instrument. We would need access to the tax analysis of the transaction to assign a rating.
We generally assess the risks related to unclear or broad definitions of the legal documentation, for example, pertaining to key
transaction mechanisms such as definitions of transaction default and termination events. For more about legal risks in aviation
finance transactions, please review our analytical considerations in Legal Risks in Structured Finance (January 2015).
9.5 Counterparty risk
We analyse counterparty risk alongside the transaction’s fundamental characteristics, reflecting the credit and other risk implications
of financial and operational exposures to the different counterparties. Financial counterparties include, among others, the liquidity
facility provider, the account bank, or the paying agent. Operational counterparties include the asset manager or servicer
(responsible for the ongoing operations and administration of the SPV, aircraft inspection, remarketing and repossession).
10 Rating determination
We assign the final rating in a committee process where the quantitative outcome (i.e. quantitative rating-indication) is evaluated in
the context of qualitative elements from the legal and structural analysis, as well as the results of sensitivity analysis.
11 Monitoring
We continuously monitor the credit risk and performance of both the collateral and key transaction counterparties.
We may adjust the rating if the instrument’s performance differs materially from initial expectations. We typically monitor aviation
finance transactions based on performance reports produced by the technical advisor, the asset manager, or the security trustee
Aviation Finance Rating Methodology Project Finance
15 November 2021
19/26
in the transaction, as well as on information from the originator or other transaction key agents. If the information provided by the
issuer or its agent is of insufficient quality, or inappropriately delayed, we may withdraw the rating.
The ratings are monitored continuously by means of high-level checks and reviewed in detail at least once a year, or earlier if
warranted by events. Since our ratings aim to provide a long-term view based on the rated instrument’s maturity, a temporary dip
in performance is not necessarily a reason to downgrade the rating. Similarly, we may only adjust the rating if underperformance
or outperformance occurs over a sufficiently long period. We aim to avoid rating pro-cyclically and, where possible, seeks to
anticipate the effect of cyclical trends in aviation finance. This translates into ratings that are forward-looking rather than reactive.
Therefore, any change in outlook for the risk presenters credit quality or an aircraft’s long-term value may be considered when re-
assessing its credit quality.
For instance, we continually reassess the transaction’s key rating assumptions, including our expectations regarding an aircraft’s
stressed long-term value development in the context of the prevalent market environment, the aircraft model’s future development
and the risk presenter’s credit quality. We may adjust our aircraft value assumption and apply the market value, or a combination
of base- and market values, if we believe that the base value does not sufficiently reflect current market conditions, such as during
crisis times. We may also decide to leave our stressed long-term value assumptions unchanged if deemed adequate in a stable
market environment.
12 Rating model
The analytical framework described in this methodology is implemented in our proprietary rating model named AF EL Model (which
stands for ‘aviation finance expected loss model’) version 1.2.
Aviation Finance Rating Methodology Project Finance
15 November 2021
20/26
Technical note on timely payment
We may assign a lower rating than the rating obtained from the expected loss analysis and expected risk horizon if the probability
of missing contractually promised coupon payments is high relative to the expected loss.
The likelihood of default on the rated instrument is given by the joint probability of default of all risk presenters present in a given
aviation finance transaction (i.e. airline, lessor, and/or guarantor) (see Probability of default analysis on page 12). The likelihood of
default in the context of the exposure’s risk horizon is used to determine the implicit credit quality of the instrument or portfolio,
based solely on default probability. We then determine the distance between the implicit quality based on default probability and
the rating obtained from the expected loss analysis.
We apply a degree of tolerance which enables the final rating to be higher than the implicit quality of the default probability. The
degree of tolerance is defined by considering the relationship between the long- and short-term rating scales published in our
methodologies for fundamental credit ratings (available at www.scoperatings.com).
We will limit the expected loss rating if the short-term credit rating commensurate with the default probability’s quality is at least one
step lower than the short-term rating commensurate with expected loss.
For example, we will typically assign a rating of A when the expected loss rating is A+ and the default probability’s quality is
commensurate with a BB+. This is because the corporate short-term rating corresponding to an A+ is S-1+/S-1, and the short-term
rating corresponding to a BB+ is S-3, which is more than one short-term category away from S-1. Consequently, the expected loss
rating is limited at the highest rating that corresponds to a short-term S-2 category: A.
Aviation Finance Rating Methodology Project Finance
15 November 2021
21/26
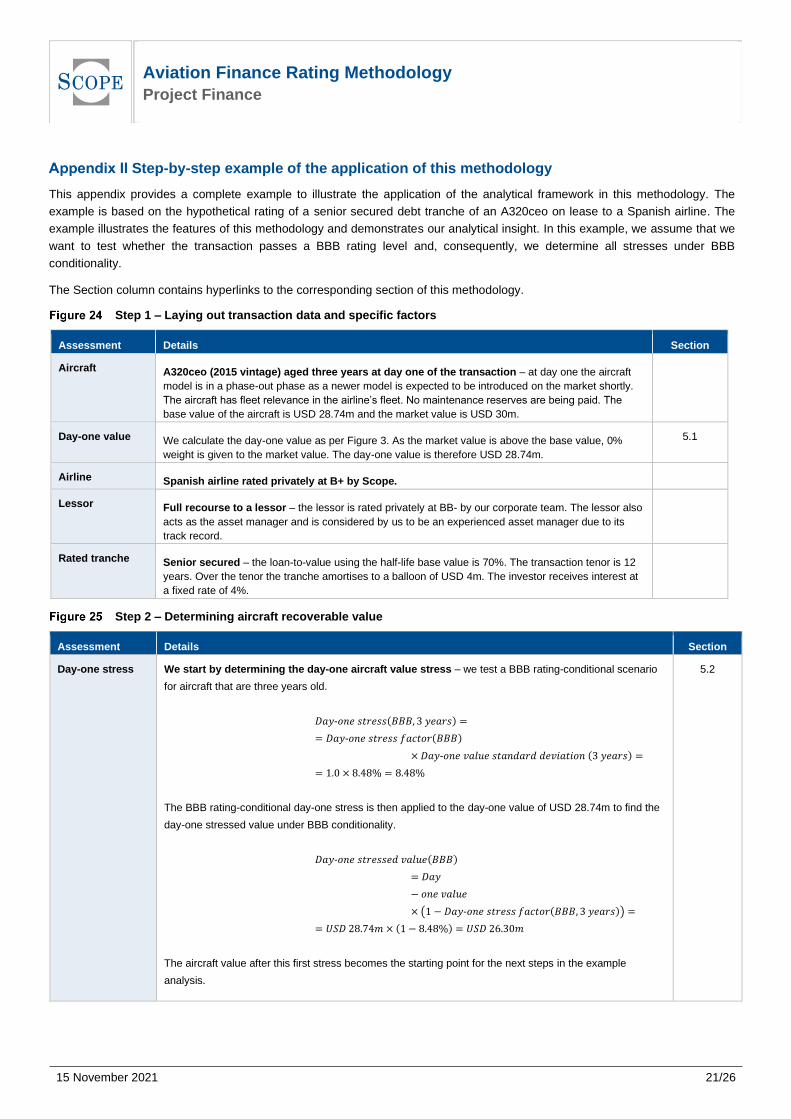
Step-by-step example of the application of this methodology
This appendix provides a complete example to illustrate the application of the analytical framework in this methodology. The
example is based on the hypothetical rating of a senior secured debt tranche of an A320ceo on lease to a Spanish airline. The
example illustrates the features of this methodology and demonstrates our analytical insight. In this example, we assume that we
want to test whether the transaction passes a BBB rating level and, consequently, we determine all stresses under BBB
conditionality.
The Section column contains hyperlinks to the corresponding section of this methodology.
Step 1 – Laying out transaction data and specific factors
Assessment Details Section
Aircraft A320ceo (2015 vintage) aged three years at day one of the transaction – at day one the aircraft
model is in a phase-out phase as a newer model is expected to be introduced on the market shortly.
The aircraft has fleet relevance in the airline’s fleet. No maintenance reserves are being paid. The
base value of the aircraft is USD 28.74m and the market value is USD 30m.
Day-one value We calculate the day-one value as per Figure 3. As the market value is above the base value, 0%
weight is given to the market value. The day-one value is therefore USD 28.74m.
5.1
Airline Spanish airline rated privately at B+ by Scope.
Lessor Full recourse to a lessor – the lessor is rated privately at BB- by our corporate team. The lessor also
acts as the asset manager and is considered by us to be an experienced asset manager due to its
track record.
Rated tranche Senior secured – the loan-to-value using the half-life base value is 70%. The transaction tenor is 12
years. Over the tenor the tranche amortises to a balloon of USD 4m. The investor receives interest at
a fixed rate of 4%.
Step 2 – Determining aircraft recoverable value
Assessment Details Section
Day-one stress We start by determining the day-one aircraft value stress – we test a BBB rating-conditional scenario
for aircraft that are three years old.
𝐷𝑎𝑦-𝑜𝑛𝑒 𝑠𝑡𝑟𝑒𝑠𝑠(𝐵𝐵𝐵, 3 𝑦𝑒𝑎𝑟𝑠) =
= 𝐷𝑎𝑦-𝑜𝑛𝑒 𝑠𝑡𝑟𝑒𝑠𝑠 𝑓𝑎𝑐𝑡𝑜𝑟(𝐵𝐵𝐵)
× 𝐷𝑎𝑦-𝑜𝑛𝑒 𝑣𝑎𝑙𝑢𝑒 𝑠𝑡𝑎𝑛𝑑𝑎𝑟𝑑 𝑑𝑒𝑣𝑖𝑎𝑡𝑖𝑜𝑛 (3 𝑦𝑒𝑎𝑟𝑠) =
= 1.0 × 8.48% = 8.48%
The BBB rating-conditional day-one stress is then applied to the day-one value of USD 28.74m to find the
day-one stressed value under BBB conditionality.
𝐷𝑎𝑦-𝑜𝑛𝑒 𝑠𝑡𝑟𝑒𝑠𝑠𝑒𝑑 𝑣𝑎𝑙𝑢𝑒(𝐵𝐵𝐵)
= 𝐷𝑎𝑦
− 𝑜𝑛𝑒 𝑣𝑎𝑙𝑢𝑒
× (1 − 𝐷𝑎𝑦-𝑜𝑛𝑒 𝑠𝑡𝑟𝑒𝑠𝑠 𝑓𝑎𝑐𝑡𝑜𝑟(𝐵𝐵𝐵, 3 𝑦𝑒𝑎𝑟𝑠)) =
= 𝑈𝑆𝐷 28.74𝑚 × (1 − 8.48%) = 𝑈𝑆𝐷 26.30𝑚
The aircraft value after this first stress becomes the starting point for the next steps in the example
analysis.
5.2
Aviation Finance Rating Methodology Project Finance
15 November 2021
22/26
Assessment Details Section
Base annual
d
e
p
r
e
c
i
a
t
i
o
n
r
a
t
e
s
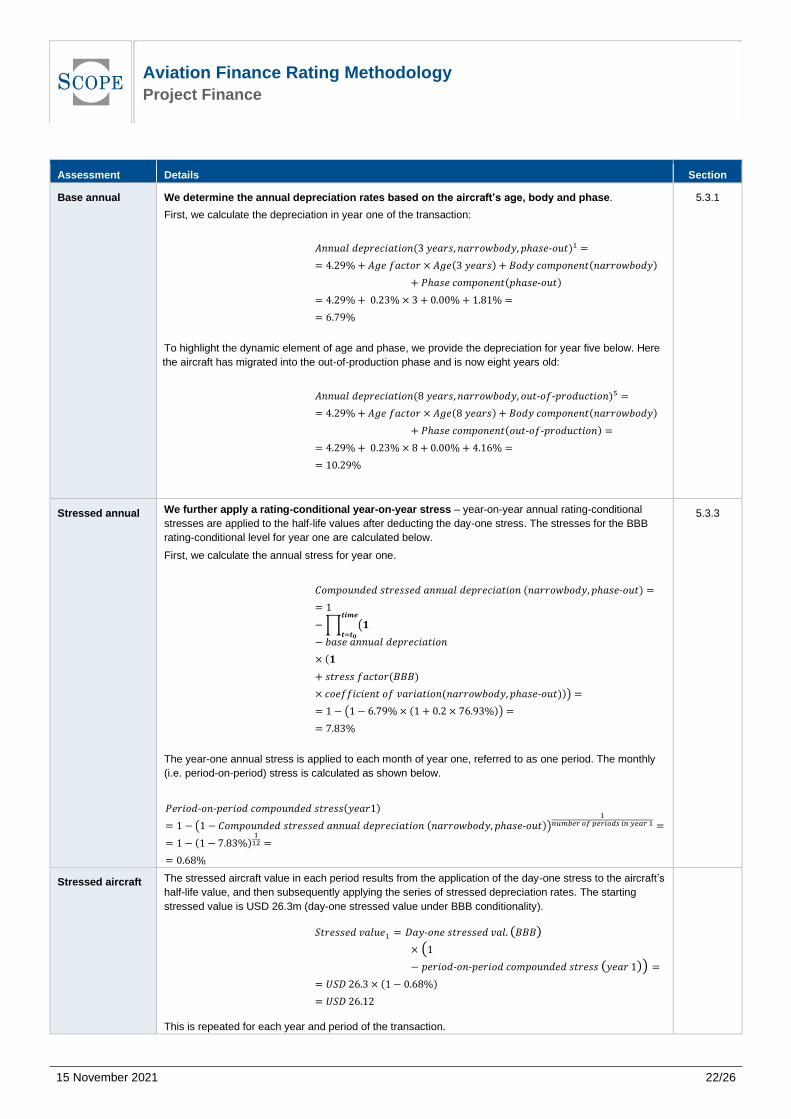
We determine the annual depreciation rates based on the aircraft’s age, body and phase.
First, we calculate the depreciation in year one of the transaction:
𝐴𝑛𝑛𝑢𝑎𝑙 𝑑𝑒𝑝𝑟𝑒𝑐𝑖𝑎𝑡𝑖𝑜𝑛(3 𝑦𝑒𝑎𝑟𝑠, 𝑛𝑎𝑟𝑟𝑜𝑤𝑏𝑜𝑑𝑦, 𝑝ℎ𝑎𝑠𝑒-𝑜𝑢𝑡)1 =
= 4.29%+ 𝐴𝑔𝑒 𝑓𝑎𝑐𝑡𝑜𝑟 × 𝐴𝑔𝑒(3 𝑦𝑒𝑎𝑟𝑠) + 𝐵𝑜𝑑𝑦 𝑐𝑜𝑚𝑝𝑜𝑛𝑒𝑛𝑡(𝑛𝑎𝑟𝑟𝑜𝑤𝑏𝑜𝑑𝑦)
+ 𝑃ℎ𝑎𝑠𝑒 𝑐𝑜𝑚𝑝𝑜𝑛𝑒𝑛𝑡(𝑝ℎ𝑎𝑠𝑒-𝑜𝑢𝑡)
= 4.29%+ 0.23% × 3 + 0.00%+ 1.81% =
= 6.79%
To highlight the dynamic element of age and phase, we provide the depreciation for year five below. Here
the aircraft has migrated into the out-of-production phase and is now eight years old:
𝐴𝑛𝑛𝑢𝑎𝑙 𝑑𝑒𝑝𝑟𝑒𝑐𝑖𝑎𝑡𝑖𝑜𝑛(8 𝑦𝑒𝑎𝑟𝑠, 𝑛𝑎𝑟𝑟𝑜𝑤𝑏𝑜𝑑𝑦, 𝑜𝑢𝑡-𝑜𝑓-𝑝𝑟𝑜𝑑𝑢𝑐𝑡𝑖𝑜𝑛)5 =
= 4.29%+ 𝐴𝑔𝑒 𝑓𝑎𝑐𝑡𝑜𝑟 × 𝐴𝑔𝑒(8 𝑦𝑒𝑎𝑟𝑠) + 𝐵𝑜𝑑𝑦 𝑐𝑜𝑚𝑝𝑜𝑛𝑒𝑛𝑡(𝑛𝑎𝑟𝑟𝑜𝑤𝑏𝑜𝑑𝑦)
+ 𝑃ℎ𝑎𝑠𝑒 𝑐𝑜𝑚𝑝𝑜𝑛𝑒𝑛𝑡(𝑜𝑢𝑡-𝑜𝑓-𝑝𝑟𝑜𝑑𝑢𝑐𝑡𝑖𝑜𝑛) =
= 4.29%+ 0.23% × 8 + 0.00%+ 4.16% =
= 10.29%
5.3.1
Stressed annual
d
e
p
r
e
c
i
a
t
i
o
n
r
a
t
e
s
We further apply a rating-conditional year-on-year stress – year-on-year annual rating-conditional
stresses are applied to the half-life values after deducting the day-one stress. The stresses for the BBB
rating-conditional level for year one are calculated below.
First, we calculate the annual stress for year one.
𝐶𝑜𝑚𝑝𝑜𝑢𝑛𝑑𝑒𝑑 𝑠𝑡𝑟𝑒𝑠𝑠𝑒𝑑 𝑎𝑛𝑛𝑢𝑎𝑙 𝑑𝑒𝑝𝑟𝑒𝑐𝑖𝑎𝑡𝑖𝑜𝑛 (𝑛𝑎𝑟𝑟𝑜𝑤𝑏𝑜𝑑𝑦, 𝑝ℎ𝑎𝑠𝑒-𝑜𝑢𝑡) =
= 1
−∏ (𝟏𝒕𝒊𝒎𝒆
𝒕=𝒕𝟎− 𝑏𝑎𝑠𝑒 𝑎𝑛𝑛𝑢𝑎𝑙 𝑑𝑒𝑝𝑟𝑒𝑐𝑖𝑎𝑡𝑖𝑜𝑛
× (𝟏
+ 𝑠𝑡𝑟𝑒𝑠𝑠 𝑓𝑎𝑐𝑡𝑜𝑟(𝐵𝐵𝐵)
× 𝑐𝑜𝑒𝑓𝑓𝑖𝑐𝑖𝑒𝑛𝑡 𝑜𝑓 𝑣𝑎𝑟𝑖𝑎𝑡𝑖𝑜𝑛(𝑛𝑎𝑟𝑟𝑜𝑤𝑏𝑜𝑑𝑦, 𝑝ℎ𝑎𝑠𝑒-𝑜𝑢𝑡))) =
= 1 − (1 − 6.79% × (1 + 0.2 × 76.93%)) =
= 7.83%
The year-one annual stress is applied to each month of year one, referred to as one period. The monthly
(i.e. period-on-period) stress is calculated as shown below.
𝑃𝑒𝑟𝑖𝑜𝑑-𝑜𝑛-𝑝𝑒𝑟𝑖𝑜𝑑 𝑐𝑜𝑚𝑝𝑜𝑢𝑛𝑑𝑒𝑑 𝑠𝑡𝑟𝑒𝑠𝑠(𝑦𝑒𝑎𝑟1)
= 1 − (1 − 𝐶𝑜𝑚𝑝𝑜𝑢𝑛𝑑𝑒𝑑 𝑠𝑡𝑟𝑒𝑠𝑠𝑒𝑑 𝑎𝑛𝑛𝑢𝑎𝑙 𝑑𝑒𝑝𝑟𝑒𝑐𝑖𝑎𝑡𝑖𝑜𝑛 (𝑛𝑎𝑟𝑟𝑜𝑤𝑏𝑜𝑑𝑦, 𝑝ℎ𝑎𝑠𝑒-𝑜𝑢𝑡))1
𝑛𝑢𝑚𝑏𝑒𝑟 𝑜𝑓 𝑝𝑒𝑟𝑖𝑜𝑑𝑠 𝑖𝑛 𝑦𝑒𝑎𝑟 1 =
= 1 − (1 − 7.83%)112 =
= 0.68%
5.3.3
Stressed aircraft
v
a
l
u
e
s
The stressed aircraft value in each period results from the application of the day-one stress to the aircraft’s
half-life value, and then subsequently applying the series of stressed depreciation rates. The starting
stressed value is USD 26.3m (day-one stressed value under BBB conditionality).
𝑆𝑡𝑟𝑒𝑠𝑠𝑒𝑑 𝑣𝑎𝑙𝑢𝑒1 = 𝐷𝑎𝑦-𝑜𝑛𝑒 𝑠𝑡𝑟𝑒𝑠𝑠𝑒𝑑 𝑣𝑎𝑙. (𝐵𝐵𝐵)
× (1
− 𝑝𝑒𝑟𝑖𝑜𝑑-𝑜𝑛-𝑝𝑒𝑟𝑖𝑜𝑑 𝑐𝑜𝑚𝑝𝑜𝑢𝑛𝑑𝑒𝑑 𝑠𝑡𝑟𝑒𝑠𝑠 (𝑦𝑒𝑎𝑟 1)) =
= 𝑈𝑆𝐷 26.3 × (1 − 0.68%)
= 𝑈𝑆𝐷 26.12
This is repeated for each year and period of the transaction.
Aviation Finance Rating Methodology Project Finance
15 November 2021
23/26
Assessment Details Section
Repossession
a
n
d
r
e
m
a
r
k
e
t
i
n
g
d
e
l
a
y
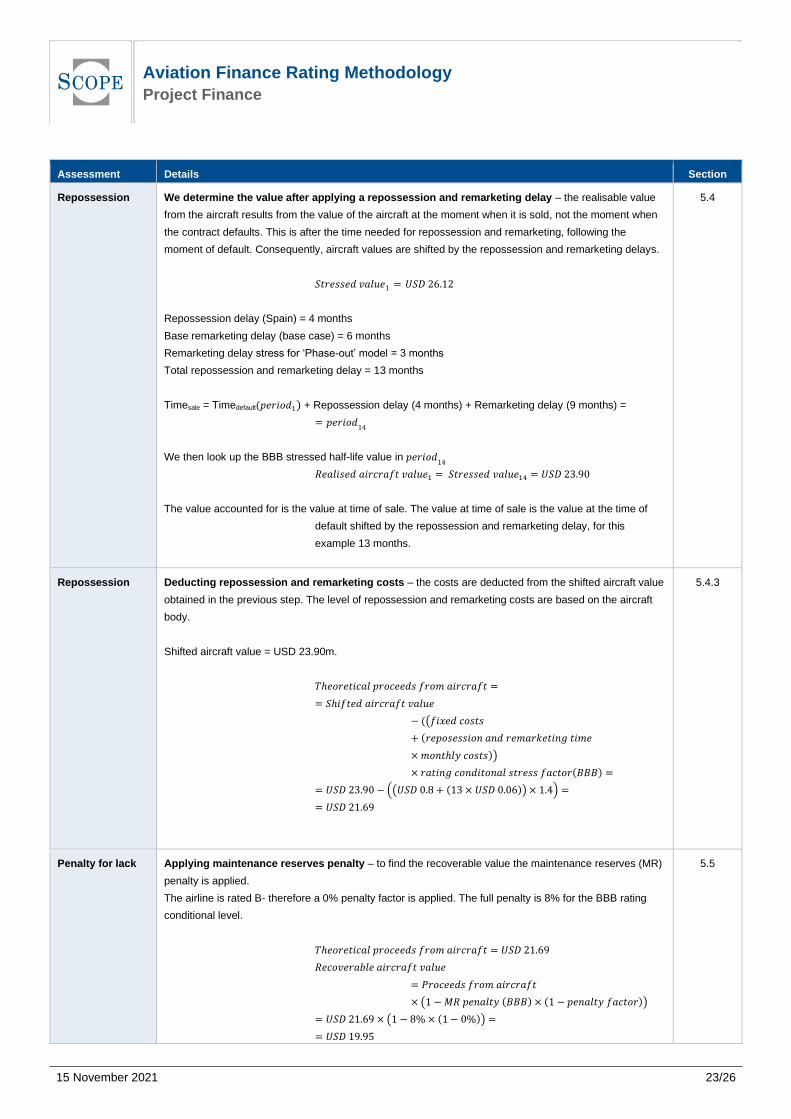
We determine the value after applying a repossession and remarketing delay – the realisable value
from the aircraft results from the value of the aircraft at the moment when it is sold, not the moment when
the contract defaults. This is after the time needed for repossession and remarketing, following the
moment of default. Consequently, aircraft values are shifted by the repossession and remarketing delays.
𝑆𝑡𝑟𝑒𝑠𝑠𝑒𝑑 𝑣𝑎𝑙𝑢𝑒1 = 𝑈𝑆𝐷 26.12
Repossession delay (Spain) = 4 months
Base remarketing delay (base case) = 6 months
Remarketing delay stress for ‘Phase-out’ model = 3 months
Total repossession and remarketing delay = 13 months
Timesale = Timedefault(𝑝𝑒𝑟𝑖𝑜𝑑1) + Repossession delay (4 months) + Remarketing delay (9 months) =
= 𝑝𝑒𝑟𝑖𝑜𝑑14
We then look up the BBB stressed half-life value in 𝑝𝑒𝑟𝑖𝑜𝑑14
𝑅𝑒𝑎𝑙𝑖𝑠𝑒𝑑 𝑎𝑖𝑟𝑐𝑟𝑎𝑓𝑡 𝑣𝑎𝑙𝑢𝑒1 = 𝑆𝑡𝑟𝑒𝑠𝑠𝑒𝑑 𝑣𝑎𝑙𝑢𝑒14 = 𝑈𝑆𝐷 23.90
The value accounted for is the value at time of sale. The value at time of sale is the value at the time of
default shifted by the repossession and remarketing delay, for this
example 13 months.
5.4
Repossession
a
n
d
r
e
m
a
r
k
e
t
i
n
g
c
Deducting repossession and remarketing costs – the costs are deducted from the shifted aircraft value
obtained in the previous step. The level of repossession and remarketing costs are based on the aircraft
body.
Shifted aircraft value = USD 23.90m.
𝑇ℎ𝑒𝑜𝑟𝑒𝑡𝑖𝑐𝑎𝑙 𝑝𝑟𝑜𝑐𝑒𝑒𝑑𝑠 𝑓𝑟𝑜𝑚 𝑎𝑖𝑟𝑐𝑟𝑎𝑓𝑡 =
= 𝑆ℎ𝑖𝑓𝑡𝑒𝑑 𝑎𝑖𝑟𝑐𝑟𝑎𝑓𝑡 𝑣𝑎𝑙𝑢𝑒
− ((𝑓𝑖𝑥𝑒𝑑 𝑐𝑜𝑠𝑡𝑠
+ (𝑟𝑒𝑝𝑜𝑠𝑒𝑠𝑠𝑖𝑜𝑛 𝑎𝑛𝑑 𝑟𝑒𝑚𝑎𝑟𝑘𝑒𝑡𝑖𝑛𝑔 𝑡𝑖𝑚𝑒
× 𝑚𝑜𝑛𝑡ℎ𝑙𝑦 𝑐𝑜𝑠𝑡𝑠))
× 𝑟𝑎𝑡𝑖𝑛𝑔 𝑐𝑜𝑛𝑑𝑖𝑡𝑜𝑛𝑎𝑙 𝑠𝑡𝑟𝑒𝑠𝑠 𝑓𝑎𝑐𝑡𝑜𝑟(𝐵𝐵𝐵) =
= 𝑈𝑆𝐷 23.90 − ((𝑈𝑆𝐷 0.8 + (13 × 𝑈𝑆𝐷 0.06)) × 1.4) =
= 𝑈𝑆𝐷 21.69
5.4.3
Penalty for lack
o
f
m
a
i
n
t
e
n
a
Applying maintenance reserves penalty – to find the recoverable value the maintenance reserves (MR)
penalty is applied.
The airline is rated B- therefore a 0% penalty factor is applied. The full penalty is 8% for the BBB rating
conditional level.
𝑇ℎ𝑒𝑜𝑟𝑒𝑡𝑖𝑐𝑎𝑙 𝑝𝑟𝑜𝑐𝑒𝑒𝑑𝑠 𝑓𝑟𝑜𝑚 𝑎𝑖𝑟𝑐𝑟𝑎𝑓𝑡 = 𝑈𝑆𝐷 21.69
𝑅𝑒𝑐𝑜𝑣𝑒𝑟𝑎𝑏𝑙𝑒 𝑎𝑖𝑟𝑐𝑟𝑎𝑓𝑡 𝑣𝑎𝑙𝑢𝑒
= 𝑃𝑟𝑜𝑐𝑒𝑒𝑑𝑠 𝑓𝑟𝑜𝑚 𝑎𝑖𝑟𝑐𝑟𝑎𝑓𝑡
× (1 −𝑀𝑅 𝑝𝑒𝑛𝑎𝑙𝑡𝑦 (𝐵𝐵𝐵) × (1 − 𝑝𝑒𝑛𝑎𝑙𝑡𝑦 𝑓𝑎𝑐𝑡𝑜𝑟))
= 𝑈𝑆𝐷 21.69 × (1 − 8%× (1 − 0%)) =
= 𝑈𝑆𝐷 19.95
5.5
Aviation Finance Rating Methodology Project Finance
15 November 2021
24/26
n
c
e
r
e
s
e
r
v
e
s
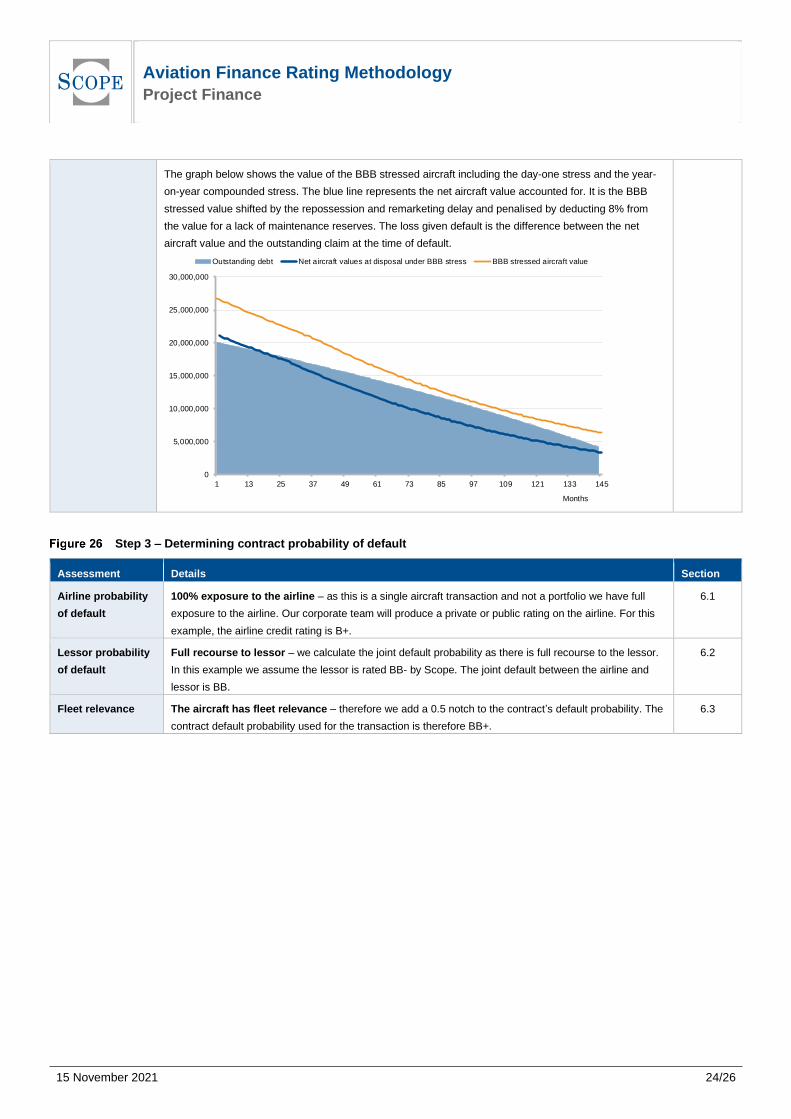
The graph below shows the value of the BBB stressed aircraft including the day-one stress and the year-
on-year compounded stress. The blue line represents the net aircraft value accounted for. It is the BBB
stressed value shifted by the repossession and remarketing delay and penalised by deducting 8% from
the value for a lack of maintenance reserves. The loss given default is the difference between the net
aircraft value and the outstanding claim at the time of default.
Step 3 – Determining contract probability of default
Assessment Details Section
Airline probability
of default
100% exposure to the airline – as this is a single aircraft transaction and not a portfolio we have full
exposure to the airline. Our corporate team will produce a private or public rating on the airline. For this
example, the airline credit rating is B+.
6.1
Lessor probability
of default
Full recourse to lessor – we calculate the joint default probability as there is full recourse to the lessor.
In this example we assume the lessor is rated BB- by Scope. The joint default between the airline and
lessor is BB.
6.2
Fleet relevance The aircraft has fleet relevance – therefore we add a 0.5 notch to the contract’s default probability. The
contract default probability used for the transaction is therefore BB+.
6.3
0
5,000,000
10,000,000
15,000,000
20,000,000
25,000,000
30,000,000
1 13 25 37 49 61 73 85 97 109 121 133 145
Months
Outstanding debt Net aircraft values at disposal under BBB stress BBB stressed aircraft value
Aviation Finance Rating Methodology Project Finance
15 November 2021
25/26
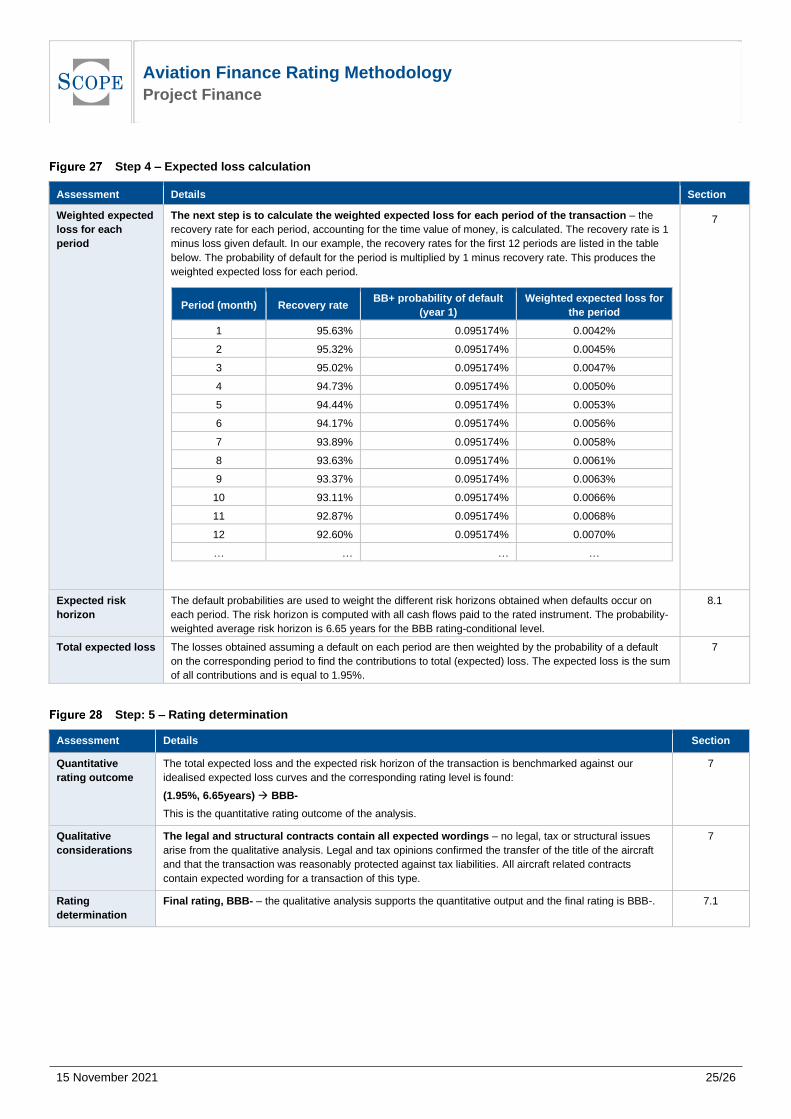
Step 4 – Expected loss calculation
Assessment Details Section
Weighted expected
loss for each
period
The next step is to calculate the weighted expected loss for each period of the transaction – the
recovery rate for each period, accounting for the time value of money, is calculated. The recovery rate is 1
minus loss given default. In our example, the recovery rates for the first 12 periods are listed in the table
below. The probability of default for the period is multiplied by 1 minus recovery rate. This produces the
weighted expected loss for each period.
Period (month) Recovery rate BB+ probability of default
(year 1)
Weighted expected loss for
the period
1 95.63% 0.095174% 0.0042%
2 95.32% 0.095174% 0.0045%
3 95.02% 0.095174% 0.0047%
4 94.73% 0.095174% 0.0050%
5 94.44% 0.095174% 0.0053%
6 94.17% 0.095174% 0.0056%
7 93.89% 0.095174% 0.0058%
8 93.63% 0.095174% 0.0061%
9 93.37% 0.095174% 0.0063%
10 93.11% 0.095174% 0.0066%
11 92.87% 0.095174% 0.0068%
12 92.60% 0.095174% 0.0070%
… … … …
7
Expected risk
horizon
The default probabilities are used to weight the different risk horizons obtained when defaults occur on
each period. The risk horizon is computed with all cash flows paid to the rated instrument. The probability-
weighted average risk horizon is 6.65 years for the BBB rating-conditional level.
8.1
Total expected loss The losses obtained assuming a default on each period are then weighted by the probability of a default
on the corresponding period to find the contributions to total (expected) loss. The expected loss is the sum
of all contributions and is equal to 1.95%.
7
Step: 5 – Rating determination
Assessment Details Section
Quantitative
rating outcome
The total expected loss and the expected risk horizon of the transaction is benchmarked against our
idealised expected loss curves and the corresponding rating level is found:
(1.95%, 6.65years) → BBB-
This is the quantitative rating outcome of the analysis.
7
Qualitative
considerations
The legal and structural contracts contain all expected wordings – no legal, tax or structural issues
arise from the qualitative analysis. Legal and tax opinions confirmed the transfer of the title of the aircraft
and that the transaction was reasonably protected against tax liabilities. All aircraft related contracts
contain expected wording for a transaction of this type.
7
Rating
determination
Final rating, BBB- – the qualitative analysis supports the quantitative output and the final rating is BBB-. 7.1
Aviation Finance Rating Methodology Project Finance
15 November 2021
26/26
Scope Ratings GmbH
Headquarters Berlin
Lennéstraße 5 D-10785 Berlin
Phone +49 30 27891-0
Frankfurt am Main
Neue Mainzer Straße 66-68 D-60311 Frankfurt am Main
Phone +49 69 66 77 389 0
Paris
23 Boulevard des Capucines F-75002 Paris
Phone +33 1 8288 5557
Oslo
Karenslyst allé 53 N-0279 Oslo
Phone +47 21 62 31 42
Madrid
Paseo de la Castellana 141
E-28046 Madrid
Phone +34 91 572 67 11
Milan
Via Nino Bixio, 31
20129 Milano MI
Phone +39 02 30315 814
Scope Ratings UK Limited
London
52 Grosvenor Gardens London SW1W 0AU
Phone +442078245180
www.scoperatings.com
Disclaimer
© 2021 Scope SE & Co. KGaA and all its subsidiaries including Scope Ratings GmbH, Scope Ratings UK Limited, Scope Analysis GmbH, Scope Investor Services GmbH, and Scope ESG Analysis GmbH (collectively, Scope). All rights reserved. The information and data supporting Scope’s ratings, rating reports, rating opinions and related research and credit opinions originate from sources Scope considers to be reliable and accurate. Scope does not, however, independently verify the reliability and accuracy of the information and data. Scope’s ratings, rating reports, rating opinions, or related research and credit opinions are provided ‘as is’ without any representation or warranty of any kind. In no circumstance shall Scope or its directors, officers, employees and other representatives be liable to any party for any direct, indirect, incidental or other damages, expenses of any kind, or losses arising from any use of Scope’s ratings, rating reports, rating opinions, related research or credit opinions. Ratings and other related credit opinions issued by Scope are, and have to be viewed by any party as, opinions on relative credit risk and not a statement of fact or recommendation to purchase, hold or sell securities. Past performance does not necessarily predict future results. Any report issued by Scope is not a prospectus or similar document related to a debt security or issuing entity. Scope issues credit ratings and related research and opinions with the understanding and expectation that parties using them will assess independently the suitability of each security for investment or transaction purposes. Scope’s credit ratings address relative credit risk, they do not address other risks such as market, liquidity, legal, or volatility. The information and data included herein is protected by copyright and other laws. To reproduce, transmit, transfer, disseminate, translate, resell, or store for subsequent use for any such purpose the information and data contained herein, contact Scope Ratings GmbH at Lennéstraße 5 D-10785 Berlin.