aveva group plc/media/aveva/english/... aveva group plc results for the year ended 31 march 2014
TRANSCRIPT

www.aveva.com
AVEVA Group plc
Results for the year ended 31 March 2014
Copyright © 2014 AVEVA Solutions Limited and its subsidiaries. All rights reserved.
This presentation may include predictions, estimates, intentions, beliefs and other statements that are or may be construed as being forward-looking. While these forward-looking statements represent our current judgment on what the future holds, they are subject to risks and uncertainties that could result in actual outcomes differing materially from those projected in these statements. No statement contained herein constitutes a commitment by AVEVA to perform any particular action or to deliver any particular product or product features. Readers are cautioned not to place undue reliance on these forward-looking statements, which reflect our opinions only as of the date of this presentation. The Company shall not be obliged to disclose any revision to these forward-looking statements to reflect events or circumstances occurring after the date on which they are made or to reflect the occurrence of future events.
Copyright © 2014 AVEVA Solutions Limited and its subsidiaries. All rights reserved.
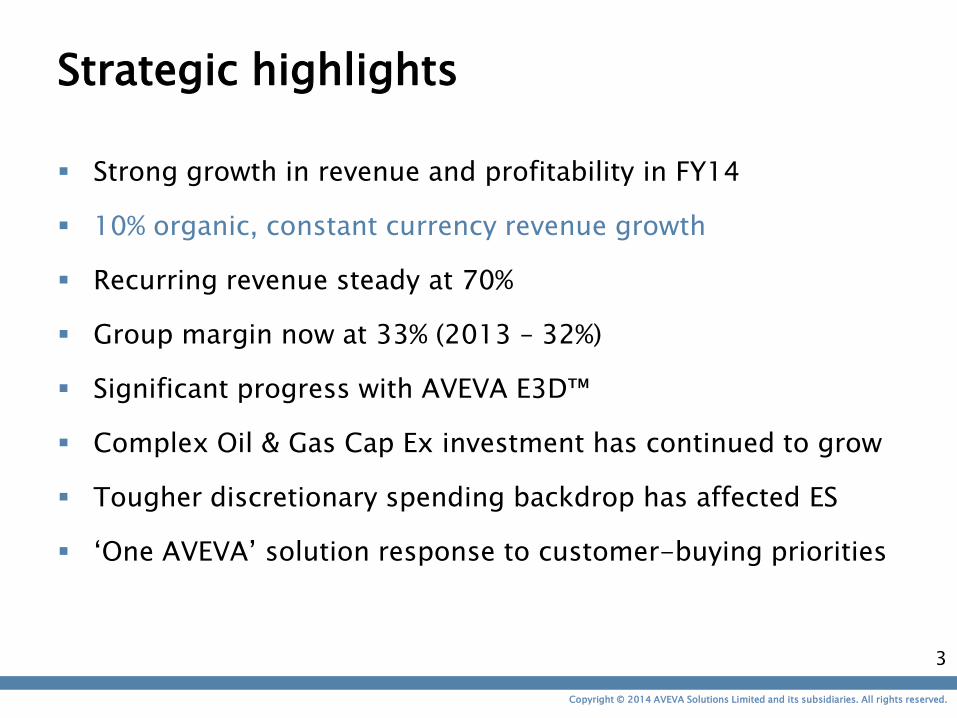
Strategic highlights
Strong growth in revenue and profitability in FY14
10% organic, constant currency revenue growth
Recurring revenue steady at 70%
Group margin now at 33% (2013 – 32%)
Significant progress with AVEVA E3D™
Complex Oil & Gas Cap Ex investment has continued to grow
Tougher discretionary spending backdrop has affected ES
„One AVEVA‟ solution response to customer-buying priorities
3

Copyright © 2014 AVEVA Solutions Limited and its subsidiaries. All rights reserved.
Financial highlights
FY 2014
FY 2013
Total revenue £237.3m £220.2m 8%
Constant currency revenue £242.1m £220.2m 10%
Adjusted* profit before tax £78.3m £70.6m 11%
Adjusted* basic EPS 89.1p 74.7p 19%**
Adjusted* profit before tax margin 33.0% 32.1%
Final dividend per share 22.0p 19.5p 13%
Special dividend paid of 147 pence £100.0m -
Net cash £117.5m £190.4m
Operating cash flow before tax £70.2m £60.3m 16%
* Adjusted profit before tax, adjusted profit margin and adjusted basic earnings per share are calculated before amortisation of intangible assets (excluding other software), share-based payments, gain/loss on the fair value of forward foreign exchange contracts and exceptional items. In addition, adjusted basic earnings per share also includes the tax effects of these adjustments. ** After adjusting for the effect of the share consolidation and the related reduction in interest income following the associated special dividend of £100 million, the underlying adjusted basic earnings per share rose by 16% to 86.59 pence.
4

Copyright © 2014 AVEVA Solutions Limited and its subsidiaries. All rights reserved.
Summary income statement (statutory)
FY 2014 £m
FY 2013 £m
Growth
Total revenue 237.3 220.2 8%
Cost of sales (17.4) (16.1)
Research and Development costs (38.3) (35.5) 8%
Selling and distribution expenses (93.0) (87.6) 6%
Administrative expenses (20.1) (18.6) 8%
Net interest receivable 0.5 1.1
Normalised items 9.3 7.1
Adjusted* profit before tax 78.3 70.6 11%
Reported profit before tax 69.0 63.5 9%
Income tax (18.0) (18.1)
Profit after tax 51.0 45.4 12%
Adjusted* profit margin 33.0% 32.1%
Adjusted* basic EPS (pence) 89.1 74.7 19% 5
Copyright © 2014 AVEVA Solutions Limited and its subsidiaries. All rights reserved.
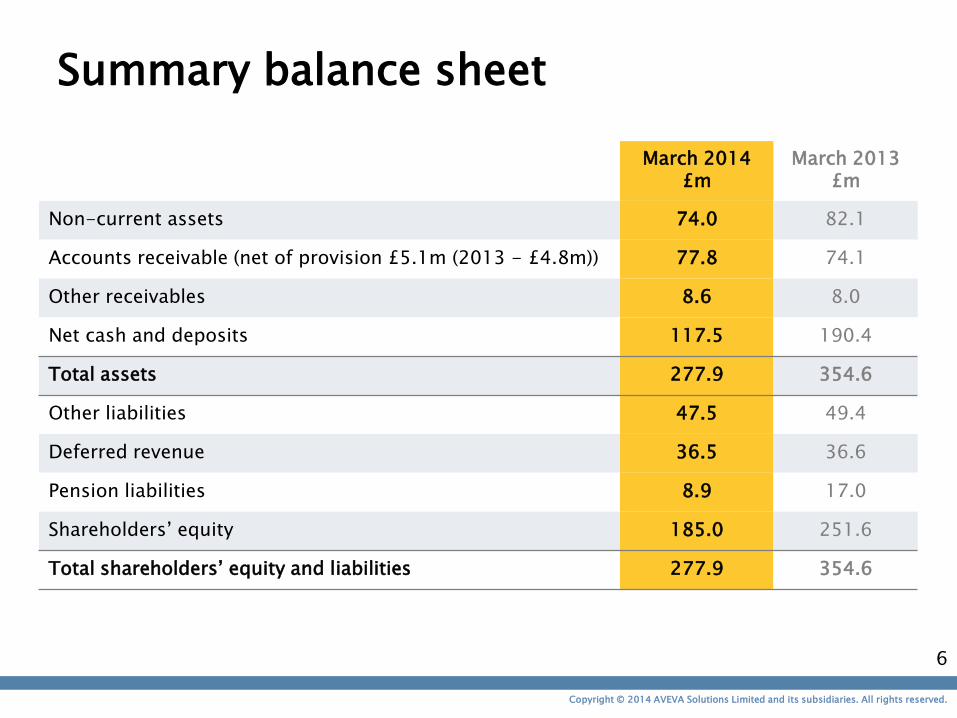
Summary balance sheet
March 2014 £m
March 2013 £m
Non-current assets 74.0 82.1
Accounts receivable (net of provision £5.1m (2013 - £4.8m)) 77.8 74.1
Other receivables 8.6 8.0
Net cash and deposits 117.5 190.4
Total assets 277.9 354.6
Other liabilities 47.5 49.4
Deferred revenue 36.5 36.6
Pension liabilities 8.9 17.0
Shareholders‟ equity 185.0 251.6
Total shareholders‟ equity and liabilities 277.9 354.6
6

Copyright © 2014 AVEVA Solutions Limited and its subsidiaries. All rights reserved.
Global performance
Robust growth in Central and Western
EMEA, soft demand in Russia and Middle
East
EMEA
£112.0m
(2013 - £107.6m)
Growth +4%
Asia Pacific
£86.9m
(2013 - £73.3m)
Growth +19%
Rental fees
Initial fees
Annual fees
Training & services
North America mid-teens growth,
Latin America broadly flat +
effect of currency
Strong performance in South Korea
Americas
£38.4m (2013 - £39.3m)
Growth -2%
7

Copyright © 2014 AVEVA Solutions Limited and its subsidiaries. All rights reserved.
Revenue by category
Recurring revenue at 70%
Rental fees +11%
ILF +14%
0
50
100
150
200
250
Annual fees Rental fees Initial licence fees
Services Total revenue
57.1
109.9
48.4
21.9 237.3
+5%
+11%
+14%
-11% +10%
FY 2
014
54.4
98.8
42.4
24.6 220.2
FY 2
013
8

Copyright © 2014 AVEVA Solutions Limited and its subsidiaries. All rights reserved.
Currency effect on revenue
Translation effect of overseas subsidiaries
FY14*
Material movement in average rates vs FY13
£4.8 million (2%) negative impact on revenue
H1 benefit £2.3 million; H2 headwind £7.1 million
*See appendix for further detail on exchange rates
FY15*
If spot rates remain at March „14 levels – 4-5% headwind to revenue in FY15
Impact principally in H1
9
Copyright © 2014 AVEVA Solutions Limited and its subsidiaries. All rights reserved.
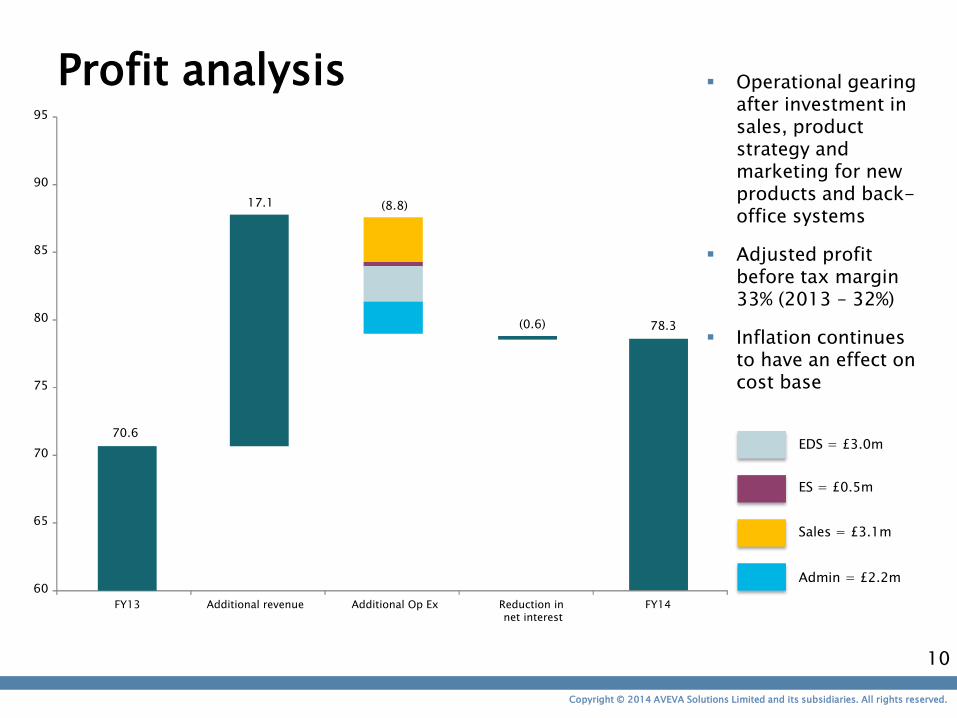
Profit analysis Operational gearing after investment in sales, product strategy and marketing for new products and back-office systems
Adjusted profit before tax margin 33% (2013 – 32%)
Inflation continues to have an effect on cost base
EDS = £3.0m
ES = £0.5m
Sales = £3.1m
Admin = £2.2m 60
65
70
75
80
85
90
95
FY13 Additional revenue Additional Op Ex Reduction in net interest
FY14
70.6
17.1 (8.8)
(0.6) 78.3
10
Copyright © 2014 AVEVA Solutions Limited and its subsidiaries. All rights reserved.
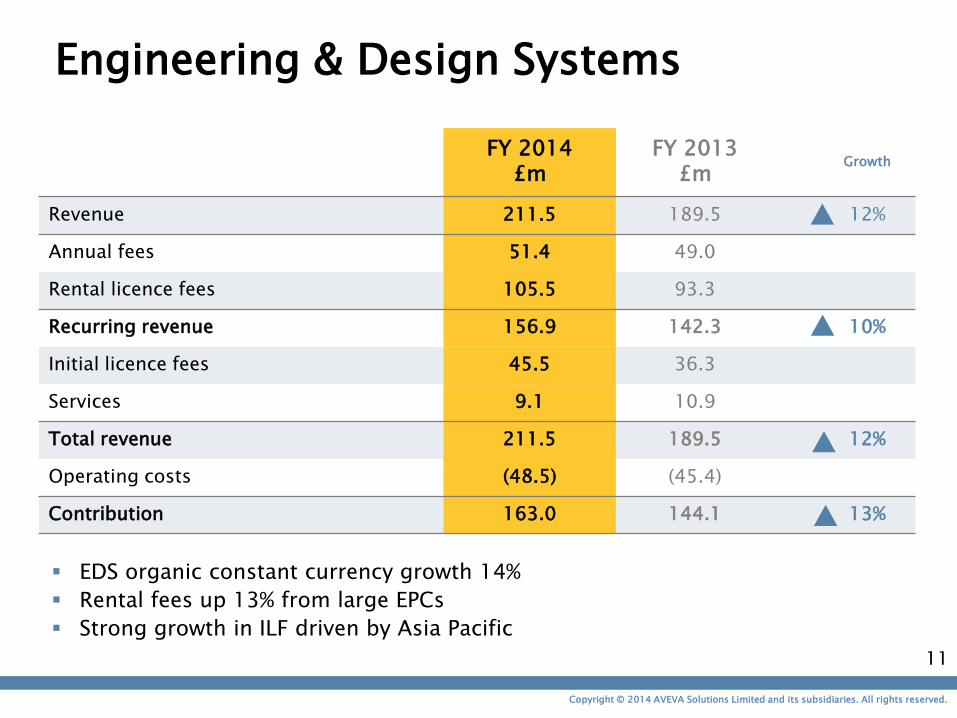
Engineering & Design Systems
FY 2014 £m
FY 2013 £m
Growth
Revenue 211.5 189.5 12%
Annual fees 51.4 49.0
Rental licence fees 105.5 93.3
Recurring revenue 156.9 142.3 10%
Initial licence fees 45.5 36.3
Services 9.1 10.9
Total revenue 211.5 189.5 12%
Operating costs (48.5) (45.4)
Contribution 163.0 144.1 13%
EDS organic constant currency growth 14%
Rental fees up 13% from large EPCs
Strong growth in ILF driven by Asia Pacific
11

Copyright © 2014 AVEVA Solutions Limited and its subsidiaries. All rights reserved.
Enterprise Solutions
FY 2014 £m
FY 2013 £m
Growth
Revenue 25.9 30.7 16%
Annual fees 5.7 5.3
Rental licence fees 4.5 5.5
Recurring revenue 10.2 10.8 6%
Initial licence fees 2.9 6.2
Services 12.8 13.7
Total revenue 25.9 30.7 16%
Operating costs (29.3) (28.7)
Contribution (3.4) 2.0 -
Backlog £10.7m (30/09/13 - £11.4m; 31/03/13 - £14.4m)
„One AVEVA‟ pull-through effect as customers focus on integrated offerings
Pressure on discretionary spend amongst customers
12

Copyright © 2014 AVEVA Solutions Limited and its subsidiaries. All rights reserved.
Movement in net cash position
Operating cash conversion at 102%
Cash flow from operations +16%, after £2.5 million pension payment
£100 million special dividend paid in August 2013
0
50
100
150
200
250
300
350
400
FY13 Cash from
operations
Tax Cap Ex Special dividend Dividend FX/Other FY14
190.4
70.2 (18.2)
(4.9) (100)
(16.5)
(3.5) 117.5
13
Copyright © 2014 AVEVA Solutions Limited and its subsidiaries. All rights reserved.
„One AVEVA‟
The „One AVEVA‟ approach – common products sold differently to each type of customer by one sales force
EPCs and OOs have different buying priorities
– EPCs need technology advantage, capital project-led
– OOs want solutions to improve operational profitability and reduce risk
AVEVA‟s increasingly broad product portfolio meets both of these customer requirements
Token licensing and product integration reinforces this trend
14

Copyright © 2014 AVEVA Solutions Limited and its subsidiaries. All rights reserved.
What this means for customers
Cost Time Risk
Quality Collaboration Decision-making
Project efficiency Asset optimisation
15

Copyright © 2014 AVEVA Solutions Limited and its subsidiaries. All rights reserved.
AVEVA E3D™ update
• Clearly differentiated product
• Pace of adoption and pricing are fully on track
• Good momentum of Global Accounts licensing AVEVA
E3D™
– These include KBR, Worley Parsons, Foster Wheeler, Jacobs
Engineering, Shell, Siemens Power
• Token licensing helping to drive adoption amongst
larger customers
• Underpinning long-term sustainable growth ambitions
16
Copyright © 2014 AVEVA Solutions Limited and its subsidiaries. All rights reserved.
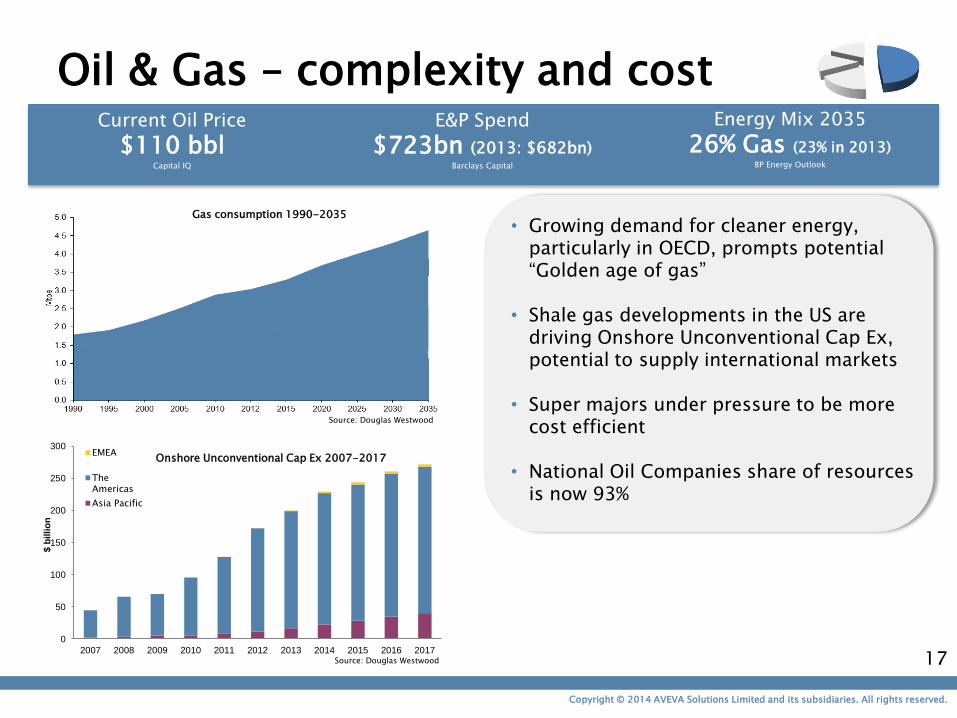
Oil & Gas – complexity and cost Current Oil Price
$110 bbl Capital IQ
E&P Spend
$723bn (2013: $682bn) Barclays Capital
Energy Mix 2035
26% Gas (23% in 2013) BP Energy Outlook
Gas consumption 1990-2035
Source: Douglas Westwood
0
50
100
150
200
250
300
2007 2008 2009 2010 2011 2012 2013 2014 2015 2016 2017
$ b
illio
n
EMEA
The
Americas
Asia Pacific
Onshore Unconventional Cap Ex 2007-2017
Source: Douglas Westwood
• Growing demand for cleaner energy, particularly in OECD, prompts potential “Golden age of gas”
• Shale gas developments in the US are
driving Onshore Unconventional Cap Ex, potential to supply international markets
• Super majors under pressure to be more
cost efficient
• National Oil Companies share of resources is now 93%
17

Copyright © 2014 AVEVA Solutions Limited and its subsidiaries. All rights reserved.
Managing complexity, risk and cost
Sou
rce:
AV
EVA
20
14
©
18

Copyright © 2014 AVEVA Solutions Limited and its subsidiaries. All rights reserved.
Energy Consumption
+56% 2010-40 EIA
Power – long term growth World Population
7.2bn Geohive
China & India Population
42% of Global Geohive
0
5
10
15
20
25
30
35
40
45
2005 2010 2015 2020 2025 2030 2035 2040
Tri
llio
n K
illo
watt
ho
urs
EMEA
The
Amercas
Global Electricity Generation Forecast 2005-2040
-100
0
100
200
300
400
500
China India Other AsiaPacific
Russia The Americas EMEA
Cap
acit
y A
dd
itio
ns (
GW
)
Coal
Gas
Nuclear
Increase in Total Capacity 2013-2040
Rising populations are driving the demand for more power
Developing Non-OECD countries are the source of future energy consumption growth
The largest capacity additions will be gas in developed countries and coal in developing nations
Nuclear is also seen as a key element to add capacity to the grid for China and India
19
Source: EIA
Source: Douglas Westwood
Copyright © 2014 AVEVA Solutions Limited and its subsidiaries. All rights reserved.
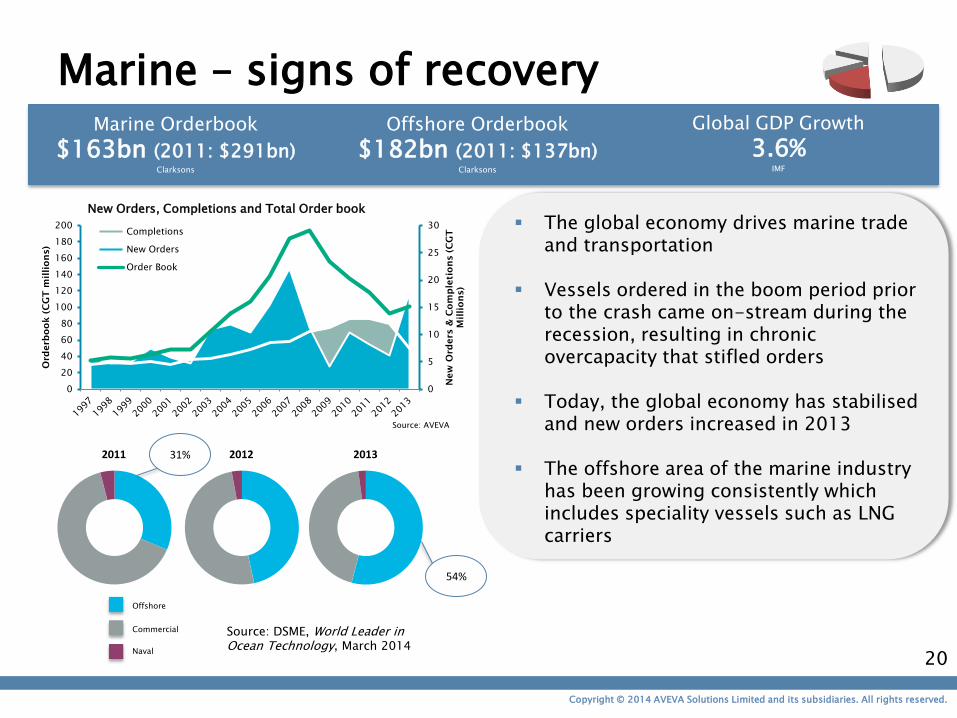
Marine – signs of recovery Marine Orderbook
$163bn (2011: $291bn) Clarksons
Offshore Orderbook
$182bn (2011: $137bn) Clarksons
Global GDP Growth
3.6% IMF
0
5
10
15
20
25
30
0
20
40
60
80
100
120
140
160
180
200
New
O
rd
ers &
C
om
pletio
ns (C
GT
Millio
ns)
Ord
erb
oo
k (C
GT
m
illio
ns)
Completions
New Orders
Order Book
The global economy drives marine trade and transportation
Vessels ordered in the boom period prior to the crash came on-stream during the recession, resulting in chronic overcapacity that stifled orders
Today, the global economy has stabilised and new orders increased in 2013
The offshore area of the marine industry has been growing consistently which includes speciality vessels such as LNG carriers
Source: AVEVA
New Orders, Completions and Total Order book
20
Source: DSME, World Leader in Ocean Technology, March 2014
2011 2012 2013
Offshore
Commercial
Naval
31%
54%
Copyright © 2014 AVEVA Solutions Limited and its subsidiaries. All rights reserved.
Outlook
Extending our technology leadership, particularly in Cloud and Mobile
„One AVEVA‟ – common product set sold to each type of customer by one sales force
Broad exposure to multiple growth markets
High recurring revenues
Good sustainable growth, whilst continuing to invest in the business
21
Copyright © 2014 AVEVA Solutions Limited and its subsidiaries. All rights reserved.

Appendix
Copyright © 2014 AVEVA Solutions Limited and its subsidiaries. All rights reserved.
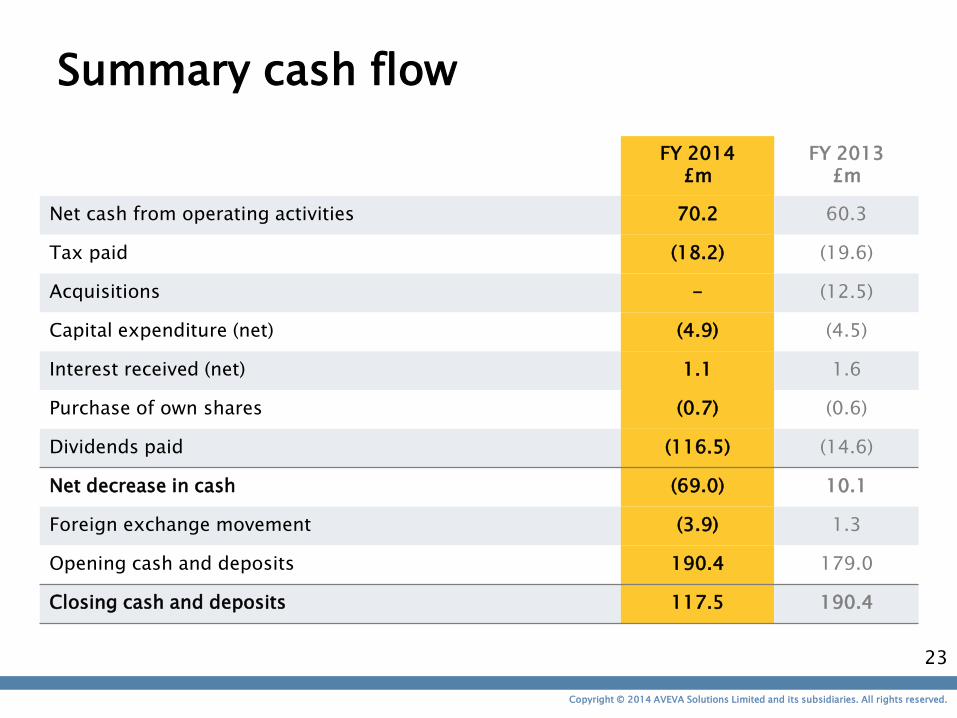
Summary cash flow
FY 2014 £m
FY 2013 £m
Net cash from operating activities 70.2 60.3
Tax paid (18.2) (19.6)
Acquisitions - (12.5)
Capital expenditure (net) (4.9) (4.5)
Interest received (net) 1.1 1.6
Purchase of own shares (0.7) (0.6)
Dividends paid (116.5) (14.6)
Net decrease in cash (69.0) 10.1
Foreign exchange movement (3.9) 1.3
Opening cash and deposits 190.4 179.0
Closing cash and deposits 117.5 190.4
23

Copyright © 2014 AVEVA Solutions Limited and its subsidiaries. All rights reserved.
Currency – FY14 effect Currency % of FY’14
revenue A: Average rate FY’14
B: Average rate FY’13
Delta (A / B)
FY’14 rev impact
EMEA 16% -
EUR 1.19 1.23 -3%
NOK 9.54 9.14 +4%
RUB 52.55 49.30 +7%
Asia Pacific 35% -4%
INR 96.16 86.23 +12%
JPY 159.42 131.12 +22%
KRW 1,738.60 1,769.63 -2%
AUD 1.71 1.46 +17%
Americas 49% -5%
USD 1.59 1.58 -
BRL 3.59 3.18 +13%
MXP 20.54 20.68 -
Total 100% -2% 24

Copyright © 2014 AVEVA Solutions Limited and its subsidiaries. All rights reserved.
Currency –annualised for FY15 Currency A: Average
rate FY’14 B: Spot rate (31/03/14)
Delta (B / A)
FY’15 rev impact**
EMEA -2-3%*
EUR 1.19 1.21 +2%
NOK 9.54 10.0 +5%
RUB 52.55 59.83 +14%
Asia Pacific -4-5%
INR 96.16 99.62 +4%
JPY 159.42 171.11 +7%
KRW 1,738.60 1,782.37 +3%
AUD 1.71 1.80 +5%
Americas -4-5%
USD 1.59 1.66 +4%
BRL 3.59 3.77 +5%
MXP 20.54 21.77 +6%
Total -4-5%
* Excluding UK sterling revenues ** If we assume same regional revenue split as FY‟14 25

Copyright © 2014 AVEVA Solutions Limited and its subsidiaries. All rights reserved.
SIEMENS
AVEVA products and competitive landscape
Aspen
Hexagon
Bentley
Dassault
Aspen
SIEMENS
Bentley
Hexagon
AVEVA ES AVEVA EDS
Dassault
SAP
In-house solutions In-house solutions
Point solutions
Project phase 2-6 years (c.$1.6 billion) Operations phase up to 50 years (>$2 billion)
Autodesk
26
Conceptual Design
FEED
Detailed Design
Construction & Commissioning
Operations
Decommissioning

Copyright © 2014 AVEVA Solutions Limited and its subsidiaries. All rights reserved.
Customer examples 2013/14
AMEC
– 5 year baseline agreement, standardising on IE&D
Fluor and Jacobs Engineering
– Multi year agreements provide strategic platform for growth
Petroleum Development Oman
– Mandate AVEVA 4D construction management system (ERM plus AVEVA NET)
Bruce Steel
– First Bocad project in Canadian oil-sands, competitive replacement
APLNG (Conoco Phillips, Origin Energy, Sinopec)
– AVEVA NET for project information control and handover
Compania Minera Milpo S.S.A.
– Mining company with headquarters in Lima; first AVEVA NET contract in Peru
27

Copyright © 2014 AVEVA Solutions Limited and its subsidiaries. All rights reserved.
Definition of terms Item Definition
Initial Licence Fee Initial Licence Fee (ILF) - users are charged an initial licence fee per seat together with an obligatory annual fee.
Annual Fee Charged in association with an ILF providing customer support and maintenance, which includes core updates. Users must pay the annual fee in order to maintain the right to use the software.
Rental licence model An alternative to the ILF plus annual fee model, there are three different types of rental licence: Monthly invoicing, contractual period (typically one year, invoiced up front) or token licensing.
Token-based licensing The user pays for a 'basket of tokens' representing licences to use different software products over a defined period of time. The customer can draw down on these licences as required.
Revenue recognition
ILFs – recognised upfront after usual delivery and acceptance conditions are met. Annual fees – recognised ratably over the period (typically 12 months). Rental licences - an estimated licence element is recognised up front, and the remaining maintenance element is recognised ratably over the contracted period. Services are recognised on a percentage complete basis.
Revenue by geography The sales force is organised into three geographic regions. Revenue is allocated based on where the contracting entity of the customer is based. AVEVA's global accounts often choose to purchase software in one geography for use in another.
Recurring revenue Annual fees plus rental fees.
Adjusted PBT Profit Before Tax adjusted to exclude the effects of amortisation of intangibles (excluding software), share-based payments, gain/loss on fair value of forward foreign exchange contracts and exceptional items.
Constant currency The period‟s reported result restated to reflect the previous year‟s average exchange rates, for the purpose of a constant currency comparison.
Adjusted EPS Adjusted PBT is used to calculate the adjusted earnings per share, after an adjustment for the tax effect of the items adjusted.
Cash conversion Cash flow from operations divided by the operating profit for the period, measured as a percentage.
Enterprise Solutions backlog Contracted Enterprise Solutions revenue that has not yet been recognised but which is expected to be recognised in the next 12 months. Revenue backlog also includes 12 months of annual fees.
33
28