aveva group plc interim report 2013/media/aveva... · 02 aveva group plc | interim report 2013...
TRANSCRIPT

AVEVA Group plcInterim report 2013

about us
Celebrating 45 years
The artwork on the front cover was commissioned for AVEVA’s 45th anniversary and provided to all of our offices in recognition of this major milestone.
overview
About uS IFC
hIghLIghtS 01
ChIeF exeCutIve’S revIew 02
business review
FINANCe revIew 05
finanCials
INdepeNdeNt revIew report 09
CoNSoLIdAted INCome StAtemeNt 10
CoNSoLIdAted StAtemeNt oF CompreheNSIve INCome 11
CoNSoLIdAted bALANCe Sheet 12
CoNSoLIdAted StAtemeNt oF ChANgeSIN ShArehoLderS’ equIty 13
CoNSoLIdAted CASh FLow StAtemeNt 14
NoteS to the INterIm report 15
reSpoNSIbILIty StAtemeNt oF the dIreCtorS 25
otHer information
CompANy INFormAtIoN ANd AdvISerS 26
group dIreCtory IBC
Contents01
www.AvevA.Com
INNoVATIoN IS our buSINESSIn 2012 AVEVA celebrates 45 years of providing engineering, design and information management solutions to the process plant, power and marine industries. This is an impressive milestone for any software company and firmly positions AVEVA as one of the most consistently successful businesses in the technology sector.
We attribute this success to AVEVA’s business philosophy; to be more than just a vendor of technology, but an active and engaged partner in our customers’ development and success. We have achieved this through four and a half decades of pioneering vision and determination to unlock the power of software technology and human ingenuity.

Interim report 2013 | AVEVA Group plc 01
FINANCIALSovervIew buSINeSS revIew
Overview
Highlights
in figures
2009
69.9 78.5 85.2 97.6 108.5
2010 2011 2012 2013
£108.5m +11%
Revenue (£m) Adjusted* profit before tax (£m)
2009
22.0 24.5 26.2 28.6 32.3
2010 2011 2012 2013
£32.3m +13%
2009
10.3 12.9 15.2 16.2 18.7
2010 2011 2012 2013
£18.7m +15%
Research and Development expenditure (£m)
2009
3.00 3.36 4.00 4.50 5.00
2010 2011 2012 2013
5.00p +11%
Interim dividend per share (p)
Total revenue grew 11% in the six months ended 30 September 2013 to £108.5 million with the Group continuing to benefit from underlying strength in the Oil & Gas market and through its strong relationship with the Group’s major EPC customers.
B Good performance in H1 with group revenue up 11% to £108.5m and adjusted profit before tax up 13% to £32.3m
B Engineering & Design Systems revenue up 12% : Enterprise Solutions revenue up 5%
B AVEVA Everything 3D™ – momentum on track, with one major EPC customer intending to use the platform for all new projects from Q4 2014 and our discussions on adoption with other leading EPCs progressing in line with expectations
B High recurring revenues maintained at 70% of total sales, with strong growth in rental licences (+14% versus prior year)
B Adjusted profit before tax margin increased 46 basis points to 29.8% (2012 – 29.3%)
B Innovation and technology leadership continues as we enter H2, with the launch of AVEVA E3D™ Insight for Mobile and Cloud in October
B Cash generated from operations before tax increased 32% over the prior year, as a result of strong working capital management and cash collection
* Adjusted profit before tax, adjusted profit margin and adjusted basic earnings per share are calculated before amortisation of intangible assets (excluding other software), share-based payments, gain/loss on fair value of forward foreign exchange contracts and exceptional items. In addition, adjusted basic earnings per share also include the tax effects of these adjustments.

AVEVA Group plc | Interim report 201302 Overview
www.AvevA.Com
overview
During the period we saw revenue growth of 11% driven primarily by the Oil & Gas market and a 13% increase in adjusted profit before tax (reported profit before tax growth of 6%). In particular we saw a strong performance from the Asia Pacific region, with revenue up 22% over the prior year and encouraging progress in North America. Our customers continue to be attracted by our rental model with rental fees up 14% in the period, compared to the 11% expansion in initial licence fees. This continues to drive our recurring revenue which grew by 13% during the first half reflecting the strength of our business model. Recurring revenue represents 70% of total revenue.
The Engineering & Design Systems (EDS) division saw strong growth with revenue up 12% in the first half driven by further growth in demand from Engineering Procurement and Construction (EPC) customers. The response to AVEVA Everything 3D™ (AVEVA E3D™) from evaluation customers over the course of this year, and in particular at our recent AVEVA World Summit in Boston, Massachusetts, continues to be very positive and we remain confident of the opportunities this product will generate going forward.
In Enterprise Solutions (ES) we continue to make good progress with the major Owner Operators and EPCs, although revenue growth of 5% over the prior year was slower than expected. This was principally due to two customer-specific external factors, as well as the unpredictability that the longer sales cycles, a characteristic of this business, bring. However, given the growing pipeline we remain positive about the opportunities for ES in the medium to long-term.
Chief executive’s review
Richard Longdon | Chief Executive
“ We are pleased with a good performance during the first half of the financial year with further progress made against the Group’s business objectives.”
summary of review
z The Group continued to be highly cash generative in the first half, with cash generated from operating activities before tax of £30.2 million compared to £22.9 million for the same period in the previous year, an increase of 32%.
z The highlight from a regional perspective was the Asia Pacific region, which achieved revenue of £42.3 million, up 22% in the first half of the fiscal year (2012 – £34.7 million).
z We are putting significant focus into our North American business and have already seen encouraging early signs in the first half, with some new customer wins and expansion within existing customers with our schematic products and with AVEVA NET.
z Looking forward, we see the AVEVA E3D™ platform as a facilitator for our strategic development into both Mobile and Cloud collaboration applications. These technologies potentially hold the key to facilitate dramatic cost savings and efficiencies for our customers.

Interim report 2013 | AVEVA Group plc 03Overview
FINANCIALSovervIew buSINeSS revIew
The Group continued to be highly cash generative in the first half, with cash generated from operating activities before tax of £30.2 million compared to £22.9 million for the same period in the previous year, an increase of 32%. The Group had £95.8 million of cash and no debt at the period end, which was after the payments of a special and final dividend totalling £113 million.
engineering & Design systems
We saw further progress in the EDS business, which constitutes 88% of total Group revenue, with 12% revenue growth in the first half of the financial year. The increasing scale, complexity of projects, and an ever increasing focus on safety in the Oil & Gas industry continues to drive strong demand for our Plant design tools, particularly in the offshore market where we signed a number of significant licence deals. We continued to see the backlogs of the major engineering contractors grow and a number of our key EPC customers maintained or expanded their deployments of AVEVA design software during the first half.
In Power, we are aggressively pursuing the market in China and India, where there is expected to be strong demand over time for new-build nuclear construction. In addition, the ageing infrastructure in developed Western economies also provides an opportunity for replacement and lifecycle extensions and we were encouraged to see the announcement of a new nuclear power generation facility at Hinkley Point in the UK as evidence of that. As anticipated, sales of our marine software to conventional shipbuilders were flat during the first half due to the market remaining depressed.
We now have more than 30 customers using the new software platform AVEVA E3D™ and the cumulative monthly revenue, although still small, is building in line with expectations. In addition, we were pleased to see Siemens (Power EPC division), amongst other early adopters, present an enthusiastic assessment of their experiences evaluating AVEVA E3D™ at the recent AVEVA World Summit in Boston, Massachusetts. In particular they outlined their intention to adopt E3D™ for all new projects from the end of 2014. The second half of this financial year will also see a number of AVEVA User Group meetings and we expect the momentum for AVEVA E3D™ to continue to build as a result.
We continue to focus on expanding our design footprint within our existing customer base, as manifested by continued strong growth in sales of the AVEVA Integrated Engineering & Design (AVEVA IE&D) product portfolio. A recent example of this was a competitive win at MAN Diesel & Turbo who successfully standardised AVEVA IE&D across its power plant business unit. Bocad, our structural steel detailing business that we acquired in May 2012, continued to perform satisfactorily
in the first half and we have had success in converting competitor accounts as well as achieving improved pricing for annual fees in the installed base.
enterprise solutions
Whilst we saw continued progress with both our Owner Operator and EPC customers during the first half of the financial year, the ES division delivered a weaker than expected result with revenue growth of 5% compared to a year ago.
The reasons for this are twofold. Firstly, there were two customer-specific external factors impacting revenue in the first half. A major Latin American shipyard customer ran into serious financial difficulties and a major Oil & Gas operator abandoned its plan to roll-out an enterprise-wide information management solution. Secondly, and as previously stated, the Owner Operator market for information management solutions is still evolving and sales cycles are long and hard to predict when measured over the short term and before recurring revenue is built up. As a result, and with the full impact of the above-mentioned customer-specific factors coming through in H2, we now expect Enterprise Solutions to deliver revenue for the full financial year broadly in line with last year.
The pipeline and market opportunity for the Enterprise Solutions division remain strong, and we reached significant milestones on a number of existing and new projects with strategic Owner Operator and EPC customers during the first half, including the BP NOTIME project in Norway, Chevron Gorgon, Shell Carmon Creek, Conoco Phillips CNSO and ADMA-OPCO.
We have continued to build on our strategy of working with partners to assist in co-marketing and solution delivery. Capgemini’s adoption of AVEVA NET as the digital information hub for its iALM solution is of strategic importance and the initial focus is on the UK Nuclear New Build project where iALM has been selected.
We remain confident that the Enterprise Solutions business will continue to make good progress in this emerging sector, as we address customer demand for integrated information management.
geograpHiC performanCe
The highlight from a regional perspective was the Asia Pacific region, which achieved revenue of £42.3 million, up 22% in the first half of the fiscal year (2012 – £34.7 million). One of the key drivers of growth within the region was South Korea, where we saw the continued trend of major shipyards purchasing licences for offshore Oil & Gas projects. We performed satisfactorily in China, although the revenue remains second half weighted due to the spending patterns within state owned entities.

AVEVA Group plc | Interim report 201304 Overview
www.AvevA.Com
geograpHiC performanCe continued
We were also encouraged by our performance in the Americas. We achieved 9% growth in the first half with revenue of £17.8 million (2012 – £16.3 million). This was driven by encouraging progress in North America whilst Latin America was flat compared to the same period last year. We have yet to see signs of a measurable and sustained improvement in Brazil, despite initial positive signs in the first quarter with offshore and onshore contract wins. The economic and political backdrop continues to impact overall demand in Brazil and whilst the long-term opportunity is significant, timing remains uncertain.
We are putting significant focus into our North American business and have already seen encouraging early signs in the first half, with some new customer wins and expansion within existing customers with our schematic products and with AVEVA NET. Oil & Gas has been the main driver for North America with offshore projects, as well as increased activity in petrochemical and LNG export projects resulting from shale discoveries, underpinning the growth in the region.
The reported revenue from EMEA showed an increase of 4% to £48.4 million in the first half (2012 – £46.6 million). We saw good performances in Central Europe and the UK but experienced tougher market conditions in the Middle East and Russia during the first half. The EMEA result was also impacted by Enterprise Solutions, which resides principally within EMEA from a revenue-reporting standpoint.
researCH & Development
Innovation and technology leadership lies at the heart of AVEVA, and we continued to deliver new solutions and to invest in an exciting roadmap of new products during the first half. At the recent AVEVA World Summit, customers were particularly enthusiastic about our new mobile application, AVEVA E3D Insight™, which puts live design data into the hands of project managers using mobile devices on site in fabrication and construction. Developed in collaboration with Microsoft, the product maximises project efficiency by providing authorised users with direct access to the live AVEVA E3D™design model, regardless of their location.
Looking forward, we see the AVEVA E3D™ platform as a facilitator for our strategic development into both Mobile applications and Cloud-based collaboration. These technologies potentially hold the key to facilitate dramatic cost savings and efficiencies for our customers through improving project execution and minimising waste.
Chief executive’s reviewcontinued
We are continuing with our strategy of strengthening our Research and Development capabilities through the establishment of a new Research & Development centre in Hyderabad, India where we have been able to recruit high quality engineers.
summary anD outlook
We are pleased to have achieved continued good revenue and profit growth in the first half of the financial year. The Group remains well positioned to extend its leadership position through continued innovation, technology leadership and a global platform.
The momentum within Engineering & Design Systems remains strong, driven by long-term secular trends within global energy markets, as well as the broadening of our design application product footprint within our customer base. Regionally, we have been encouraged to see the excellent growth in Asia Pacific during the period and solid growth in the Americas.
The slower than anticipated growth from Enterprise Solutions in the first half will lead to a lower than expected revenue outcome for that division for the full financial year, with revenue now expected to be broadly in line with that achieved last year. Beyond the year end, the outlook for Enterprise Solutions remains positive, with expected growth in demand for integrated information management driven by efficiency, safety and compliance from both our Owner Operator and EPC customers. Our confidence in the long-term opportunity is underpinned by a substantial and growing pipeline of opportunities.
The response at the recent AVEVA World Summit to our new flagship platform, AVEVA E3D™, supports our view that this product has the capability to generate significant business going forward, both from existing customer migrations, but also, more importantly, from market share gains.
Therefore, as we enter the second half of the financial year, the Group is well positioned to deliver against the Board’s expectations for the full year.
RICHARD LONGDONChief Executive18 November 2013

Interim report 2013 | AVEVA Group plc 05Business review
FINANCIALSovervIew buSINeSS revIew
summary
The Group is continuing to benefit from the underlying strength in the Oil & Gas market and through its strong relationships with the Group’s major EPC customers has translated this into further sustainable growth in recurring revenue – up 13% from one year ago.
Adjusted profit before tax increased 13% to £32.3 million (2012 – £28.6 million) and on a reported basis, profit before tax increased by 6% to £27.3 million (2012 – £25.8 million).
revenue
Total revenue increased by 11% to £108.5 million (2012 – £97.6 million) during the first half.
£mH1
2013/14H1
2012/13Total revenue
growth
Annual fees 28.4 25.8 10%Rental fees 47.2 41.3 14%
Recurring revenue 75.6 67.1 13%Initial licence fees 21.6 19.5 11%Services 11.3 11.0 3%
Total revenue 108.5 97.6 11%
The Group’s recurring revenue continued to grow, up 13% or £8.5 million to £75.6 million (2012 – £67.1 million) and now represents 70% (2012 – 69%) of total revenue. As we have stated previously, a number of our customers prefer the flexibility that our rental models offer and as
finance review
James Kidd | Chief Financial Officer
“ AVEVA continued to perform well during the first half and has delivered double-digit growth in all three of our top key performance indicators of revenue, recurring revenue and adjusted profit before tax.”
summary of review
z The Group’s recurring revenue continued to grow, up 13% or £8.5 million to £75.6 million (2012 – £67.1 million) and now represents 70% (2012 – 69%) of total revenue.
z We saw particularly strong growth in Asia Pacific, up 22% (2012 – 21%), and Americas delivered solid growth of 9% (2012 – 6%).
z Revenue from Engineering & Design Systems was £95.7 million, up 12% on the previous year. The increase in rental licence fees is seen particularly strongly in EDS where the EPCs’ have a strong preference for this model, up 15% to £45.7 million.
z The Group showed strong cash generation in the first half of the year resulting from continued focus on collections from customers. Cash generated from operating activities before tax was £30.2 million compared to £22.9 million for the same period in the previous year, an increase of 32%.

AVEVA Group plc | Interim report 201306 Business review
www.AvevA.Com
in figures
2009
69.9 78.5 85.2 97.6 108.5
2010 2011 2012 2013
£108.5m +11%
Revenue (£m) Adjusted* profit before tax (£m)
2009
22.0 24.5 26.2 28.6 32.3
2010 2011 2012 2013
£32.3m +13%
revenue continued
a result we saw sales of rental licences continue to grow, up 14% (2012 – 17%) during the period, outperforming the growth in initial licence fees.
As a global business, AVEVA is exposed to fluctuations in foreign currency exchange rates. During the first half reported revenue benefited by a £2.3 million positive net variance versus the comparative six months in 2012, mainly caused by GBP weakening against Euro and Korean Won offset partly by GBP strengthening against Japanese Yen. Underlying revenue, on a constant currency basis, was £106.2 million, an increase of 9% on the same period in the previous year.
We saw particularly strong growth in Asia Pacific, up 22% (2012 – 21%), and Americas delivered solid growth of 9% (2012 – 6%), although due to the tougher market conditions and the impact in Enterprise Solutions highlighted in the Chief Executive’s review, EMEA revenue grew by 4% (2012 – 13%).
£mH1
2013/14H1
2012/13Total revenue
growth
Asia Pacific 42.3 34.7 22%Americas 17.8 16.3 9%EMEA 48.4 46.6 4%
Total revenue 108.5 97.6 11%
Total revenue from end user markets remained in line with previous periods with Oil & Gas accounting for approximately 45–50%, Marine 20–25%, Power 15% and Other, consisting of Mining, Petrochemical, Chemical and Paper Pulp 10–20%.
segment performanCe
The performance of our primary segments is set out opposite.
£mH1
2013/14H1
2012/13 % change
EDSRevenue 95.7 85.4 12%Segment costs (23.8) (20.8) 14%
Contribution 71.9 64.6 11%
ESRevenue 12.8 12.2 5%Segment costs (14.4) (14.0) 3%
Contribution (1.6) (1.8) 11%
engineering & Design systems (eDs)
Revenue from Engineering & Design Systems was £95.7 million, up 12% on the previous year. The increase in rental licence fees is seen particularly strongly in EDS where the EPCs have a strong preference for this model, up 15% to £45.7 million. The Group benefited particularly from increased licence usage for our 3D design software, PDMS, but also is achieving success in expanding our footprint by selling additional licences for other complementary products such as engineering, electrical and instrumentation.
Segment costs for EDS increased by 14% to £23.8 million as a result of continuing investment in the development of new products, notably AVEVA E3D Insight™, and the development and evolution of our existing products. During the first six months of this year, we delivered a significant upgrade to AVEVA PDMS™ and full integration of AVEVA Bocad software with AVEVA’s range of 3D design tools, including AVEVA E3D™. We also continued to hire technical sales specialists to support our sales teams in selling our wider portfolio of schematic software and Bocad.
EDS delivered a segment contribution of £71.9 million (2012 – £64.6 million), up 11% on the previous year.
finance reviewcontinued

Interim report 2013 | AVEVA Group plc 07Business review
FINANCIALSovervIew buSINeSS revIew
in figures
2009
3.00 3.36 4.00 4.50 5.00
2010 2011 2012 2013
5.00p +11%
Interim dividend per share (p)
2009
48.1 53.3 59.0 67.1 75.6
2010 2011 2012 2013
£75.6m +13%
Recurring revenue (£m)
enterprise solutions (es)
Our Enterprise Solutions segment’s revenue grew by 5% to £12.8 million (2012 – £12.2 million). While this segment continued to grow, this rate of growth was disappointing. However, we remain confident that this does not reflect the strong pipeline of sale opportunities and longer-term growth potential for the ES business. This is particularly the case given that the dip in growth rate for the first half of the year is partly explained by the two customer-specific factors described in the Chief Executive’s review. The phasing of revenue also partly reflects the second half weighting of some of our customers’ rental licence renewals. The backlog in Enterprise Solutions at 30 September 2013 was £11.4 million from £14.7 million at 31 March 2013 also reflecting in part the same two customer issues that arose in the first half.
Enterprise Solutions costs were £14.4 million compared to £14.0 million in the same period last year, an increase of 3%. We continue to focus on managing the business capture and service delivery costs to best align with the global nature of our existing projects and pipeline of opportunities. We are also continuing with our strategy to strengthen Research & Development with the establishment of a Research & Development function and service delivery and support team in Hyderabad, India.
Enterprise Solutions incurred a segment loss of £1.6 million compared to £1.8 million in the previous year.
sHareD operating Costs
Shared selling and distribution expenses increased to £27.2 million (2012 – £25.7 million) due to further investments in our sales and support organisation particularly in North America, India and throughout Asia Pacific together with office expansions in a number of locations.
Other shared operating expenses increased by 22% to £11.1 million (2012 – £9.1 million) because of foreign exchange losses, investment in information technology and other corporate costs.
exCeptional items
Exceptional items totalled £2.2 million during the first half (2012 – £0.7 million). Of this cost, £1.1 million was in respect of redundancy costs relating to the Bocad organisation. A charge of £0.1 million (2012 – £0.7 million) was also incurred in respect of the final phase of the Bocad acquisition and integration for which we do not expect any further costs in the second half. The Group also has provided £1.0 million against a potential underpaid sales tax liability together with any related interest for late payment in respect of sales at one of the Group’s subsidiary companies.
profit before tax
Adjusted profit before tax for the six months ended 30 September 2013 was £32.3 million (2012 – £28.6 million), an increase of 13%. The adjusted profit margin was 29.8% compared to 29.3% for the same period last year. Typically our first half margin is lower than the full year margin as a result of our revenue being more heavily weighted to the second half.
Reported profit before tax was £27.3 million (2012 – £25.8 million).
taxation
The effective tax rate for the first half was 27.6% (2012 – 29%) which is higher than the underlying UK tax rate of 23% because of profits earned in higher tax jurisdictions and non-deductible expenses.

AVEVA Group plc | Interim report 201308 Business review
www.AvevA.Com
DiviDenDs anD sHare ConsoliDation
During the first half the Company paid a special dividend of 147 pence per share totalling £100 million, which was also accompanied by a share consolidation of 15 new ordinary shares for every 16 ordinary shares held. This reduced the number of shares in issue at the time of the share consolidation from 68,115,648 shares to 63,858,420 ordinary shares and also amended the nominal value of the shares to 3 5/9p pence each. At 30 September 2013, the Group had 63,870,765 shares of 3 5/9p each in issue (30 September 2012 – 68,073,931 shares of 3.33p each).
Also during the first half the Company paid a final dividend in respect of 2012/13 of 19.5 pence per share at a cost of £13.3 million.
The Board is declaring an interim dividend of 5 pence per share (2012 – 4.5 pence per share), an increase of 11%. The dividend will be payable on 3 February 2014 to shareholders on the register on 3 January 2014.
earnings per sHare
Basic earnings per share were 29.64 pence (2012 – 27.03 pence), an increase of 10%, and diluted earnings per share were 29.59 pence (2012 – 26.95 pence). Adjusted basic earnings per share were 35.23 pence, an increase of 17% over the same period in 2012/13 (2012 – 30.19 pence).
Earnings per share growth benefited by approximately 2% as a result of the share consolidation in the first half.
balanCe sHeet anD CasH flows
AVEVA continues to maintain a strong balance sheet. Net assets at 30 September 2013 were £156.8 million compared to £251.6 million at 31 March 2013, following the special and final dividend payments of £113 million during the first half.
Gross trade receivables at 30 September 2013 were £58.7 million (2012 – £54.4 million). The bad debt provision at 30 September 2013 remained consistent with the previous year end provision at £4.7 million (31 March 2013 – £4.8 million).
Deferred revenue at 30 September 2013 was £30.4 million compared to £31.2 million at 30 September 2012 mainly because of movements in foreign exchange rates used to revalue foreign currency denominated balances.
Net cash (including treasury deposits) at 30 September 2013 was £95.8 million, a decrease of £94.6 million from 31 March 2013, principally as a result of the special dividend as noted above. During the first half £113.3 million was paid out in dividends (2012 – £11.5 million) and £6.7 million in corporation tax
payments (2012 – £9.4 million). Total cash and treasury deposits held in the UK represented 74% of the total balance held (2012 – 76%). The Group continues to have no debt.
The Group showed strong cash generation in the first half of the year resulting from continued focus on collections from customers. Cash generated from operating activities before tax was £30.2 million compared to £22.9 million for the same period in the previous year, an increase of 32%. Cash conversion, measured by cash generated from operating activities before tax as a percentage of profit from operations, was 112% compared to 91% in the previous period.
risks anD unCertainties
The principal risks and uncertainties faced by the Group have not changed from those set out in the annual report for the year ended 31 March 2013. Further details are included in note 4.
JAMES KIDDChief Financial Officer18 November 2013
finance reviewcontinued

Financial statements
FINANCIALSovervIew buSINeSS revIew
Interim report 2013 | AVEVA Group plc 09
independent review report
introDuCtion
We have been engaged by the Company to review the condensed set of financial statements in the half-yearly financial report for the six months ended 30 September 2013 which comprise the Consolidated income statement, the Consolidated statement of comprehensive income, the Consolidated balance sheet, the Consolidated statement of changes in shareholders’ equity, the Consolidated cash flow statement and the related notes 1 to 16. We have read the other information contained in the half-yearly financial report and considered whether it contains any apparent misstatements or material inconsistencies with the information in the condensed set of financial statements.
This report is made solely to the Company in accordance with guidance contained in International Standard on Review Engagements 2410 (UK and Ireland) ‘Review of Interim Financial Information Performed by the Independent Auditor of the Entity’ issued by the Auditing Practices Board. To the fullest extent permitted by law, we do not accept or assume responsibility to anyone other than the Company, for our work, for this report, or for the conclusions we have formed.
DireCtors’ responsibilities
The half-yearly financial report is the responsibility of, and has been approved by, the Directors. The Directors are responsible for preparing the half-yearly financial report in accordance with the Disclosure and Transparency Rules of the United Kingdom’s Financial Conduct Authority.
As disclosed in note 2, the annual financial statements of the Group are prepared in accordance with IFRS as adopted by the European Union. The condensed set of financial statements included in this half-yearly financial report has been prepared in accordance with International Accounting Standard 34, ‘Interim Financial Reporting’, as adopted by the European Union.
our responsibility
Our responsibility is to express to the Company a conclusion on the condensed set of financial statements in the half-yearly financial report based on our review.
sCope of review
We conducted our review in accordance with International Standard on Review Engagements (UK and Ireland) 2410, ‘Review of Interim Financial Information Performed by the Independent Auditor of the Entity’ issued by the Auditing Practices Board for use in the United Kingdom. A review of interim financial information consists of making enquiries, primarily of persons responsible for financial and accounting matters, and applying analytical and other review procedures. A review is substantially less in scope than an audit conducted in accordance with International Standards on Auditing (UK and Ireland) and consequently does not enable us to obtain assurance that we would become aware of all significant matters that might be identified in an audit. Accordingly, we do not express an audit opinion.
ConClusion
Based on our review, nothing has come to our attention that causes us to believe that the condensed set of financial statements in the half-yearly financial report for the six months ended 30 September 2013 is not prepared, in all material respects, in accordance with International Accounting Standard 34 as adopted by the European Union and the Disclosure and Transparency Rules of the United Kingdom’s Financial Conduct Authority.
ERNST & YOUNG LLPCambridge18 November 2013
Notes:
1. The maintenance and integrity of the AVEVA Group plc web site is the responsibility of the directors; the work carried out by the auditors does not involve consideration of these matters and, accordingly, the auditors accept no responsibility for any changes that may have occurred to the financial information since it was initially presented on the web site.
2. Legislation in the United Kingdom governing the preparation and dissemination of financial statements may differ from legislation in other jurisdictions.

Financial statementsAVEVA Group plc | Interim report 2013
www.AvevA.Com
10
Six months endedYear ended
31 March30 September
2013 2012* 2013*£000 £000 £000
Notes (unaudited) (unaudited) (audited)
Revenue 5,6 108,475 97,607 220,230Cost of sales (8,448) (7,427) (16,141)
Gross profit 100,027 90,180 204,089Operating expensesResearch and development costs (18,707) (16,244) (35,539)Selling and distribution expenses (44,153) (40,450) (87,588)Administrative expenses (10,174) (8,276) (18,570)
Total operating expenses (73,034) (64,970) (141,697)
Profit from operations 26,993 25,210 62,392Finance revenue 1,949 1,983 4,059Finance expense (1,600) (1,430) (2,956)
Analysis of profit before taxAdjusted profit before tax 2 32,267 28,586 70,562Amortisation of intangibles (excluding other software) (2,330) (1,870) (3,946)Share-based payments (1,498) (394) (1,226)Gain/(loss) on fair value of forward foreign exchange contracts 1,148 112 (796)Exceptional items 7 (2,245) (671) (1,099)
Profit before tax 27,342 25,763 63,495Income tax expense 8 (7,544) (7,462) (18,098)
Profit for the period attributable to equity holders of the parent 19,798 18,301 45,397
Earnings per share 10 – basic 29.64p 27.03p 66.97p– diluted 29.59p 26.95p 66.82p
Proposed dividend per share 9 5.0p 4.5p 24.0p
* Restated for the impact of IAS 19 (revised 2011), see note 2.
Consolidated income statementFor the six months ended 30 September 2013

Financial statements
FINANCIALSovervIew buSINeSS revIew
Interim report 2013 | AVEVA Group plc 11
Consolidated statement of comprehensive incomeFor the six months ended 30 September 2013
Six months endedYear ended
31 March30 September
2013 2012* 2013*£000 £000 £000
(unaudited) (unaudited) (audited)
Profit for the period 19,798 18,301 45,397Items that may be reclassified to profit or loss in subsequent periods: Exchange difference arising on translation of foreign operations (4,372) (2,218) 2,886Items that will not be reclassified to profit or loss in subsequent periods:Actuarial gain/(loss) on defined benefit pension schemes 3,250 (998) (5,878)Income tax effect (879) 337 1,312
Total of items that will not be reclassified to profit or loss in subsequent periods 2,371 (661) 4,566
Total comprehensive income for the period, net of tax 17,797 15,422 43,717
* Restated for the impact of IAS 19 (revised 2011), see note 2.

Financial statementsAVEVA Group plc | Interim report 2013
www.AvevA.Com
12
As at 30 September As at31 March
2013 2012 2013£000 £000 £000
Notes (unaudited) (unaudited) (audited)
Non-current assets Goodwill 39,430 39,399 40,527Other intangible assets 23,477 24,314 25,041Property, plant and equipment 8,543 8,956 9,150Deferred tax assets 4,338 4,241 6,291Other receivables 12 1,339 802 1,113
77,127 77,712 82,122
Current assets Trade and other receivables 12 59,965 57,143 80,277Current tax assets 1,427 1,624 1,865Financial assets 574 334 —Treasury deposits 11 44,198 116,080 136,085Cash and cash equivalents 11 51,614 50,324 54,272
157,778 225,505 272,499
Total assets 234,905 303,217 354,621
EquityIssued share capital 2,271 2,269 2,269Share premium 27,288 27,288 27,288Other reserves 13,129 12,608 17,712Retained earnings 114,088 183,086 204,337
Total equity 156,776 225,251 251,606
Current liabilitiesTrade and other payables 13 53,166 54,491 73,543Financial liabilities — — 574Current tax liabilities 10,355 8,014 9,858
63,521 62,505 83,975
Non-current liabilitiesDeferred tax liabilities 1,306 3,330 2,081Retirement benefit obligations 15 13,302 12,131 16,959
14,608 15,461 19,040
Total equity and liabilities 234,905 303,217 354,621
Consolidated balance sheet30 September 2013
Financial statements
FINANCIALSovervIew buSINeSS revIew
Interim report 2013 | AVEVA Group plc 13
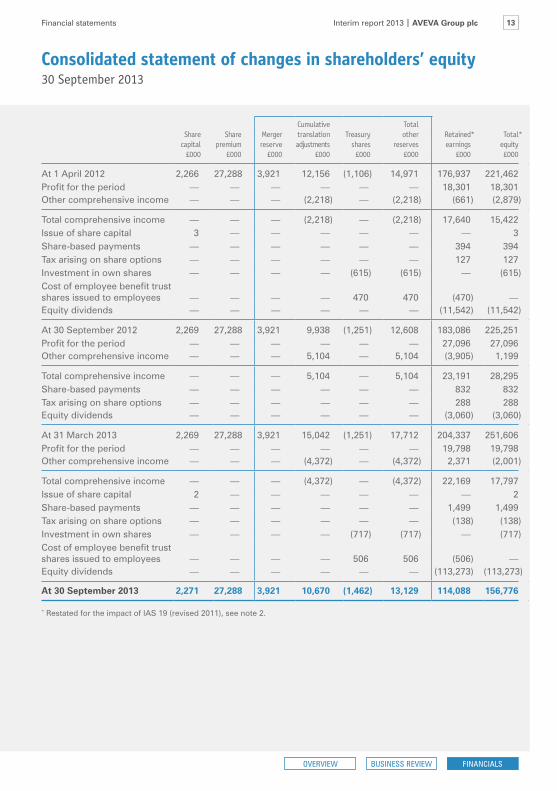
Consolidated statement of changes in shareholders’ equity30 September 2013
Cumulative TotalShare Share Merger translation Treasury other Retained* Total*
capital premium reserve adjustments shares reserves earnings equity£000 £000 £000 £000 £000 £000 £000 £000
At 1 April 2012 2,266 27,288 3,921 12,156 (1,106) 14,971 176,937 221,462Profit for the period — — — — — — 18,301 18,301Other comprehensive income — — — (2,218) — (2,218) (661) (2,879)
Total comprehensive income — — — (2,218) — (2,218) 17,640 15,422Issue of share capital 3 — — — — — — 3Share-based payments — — — — — — 394 394Tax arising on share options — — — — — — 127 127Investment in own shares — — — — (615) (615) — (615)Cost of employee benefit trust shares issued to employees — — — — 470 470 (470) —Equity dividends — — — — — — (11,542) (11,542)
At 30 September 2012 2,269 27,288 3,921 9,938 (1,251) 12,608 183,086 225,251Profit for the period — — — — — — 27,096 27,096Other comprehensive income — — — 5,104 — 5,104 (3,905) 1,199
Total comprehensive income — — — 5,104 — 5,104 23,191 28,295Share-based payments — — — — — — 832 832Tax arising on share options — — — — — — 288 288Equity dividends — — — — — — (3,060) (3,060)
At 31 March 2013 2,269 27,288 3,921 15,042 (1,251) 17,712 204,337 251,606Profit for the period — — — — — — 19,798 19,798Other comprehensive income — — — (4,372) — (4,372) 2,371 (2,001)
Total comprehensive income — — — (4,372) — (4,372) 22,169 17,797Issue of share capital 2 — — — — — — 2Share-based payments — — — — — — 1,499 1,499Tax arising on share options — — — — — — (138) (138)Investment in own shares — — — — (717) (717) — (717)Cost of employee benefit trust shares issued to employees — — — — 506 506 (506) —Equity dividends — — — — — — (113,273) (113,273)
At 30 September 2013 2,271 27,288 3,921 10,670 (1,462) 13,129 114,088 156,776
* Restated for the impact of IAS 19 (revised 2011), see note 2.

Financial statementsAVEVA Group plc | Interim report 2013
www.AvevA.Com
14
Six months endedYear ended
31 March30 September
2013 2012* 2013*£000 £000 £000
(unaudited) (unaudited) (audited)
Cash flows from operating activitiesProfit for the year 19,798 18,301 45,397Income tax 7,544 7,462 18,098Net finance revenue (349) (553) (1,103)Amortisation of intangible assets 2,414 1,903 4,022Depreciation of property, plant and equipment 1,451 1,224 2,599(Gain)/loss on disposal of property, plant and equipment (90) 122 254Share-based payments 1,498 394 1,226Difference between pension contributions paid and amounts recognised in the Consolidated income statement (656) 239 (261)Research and development expenditure tax credit (400) — —Changes in working capital:Trade and other receivables 20,299 12,253 (11,136)Trade and other payables (20,201) (18,345) 429Changes to fair value of forward foreign exchange contracts (1,148) (112) 796
Cash generated from operating activities before tax 30,160 22,888 60,321Income taxes paid (6,743) (9,395) (19,567)
Net cash generated from operating activities 23,417 13,493 40,754
Cash flows from investing activitiesPurchase of property, plant and equipment (1,432) (1,831) (3,862)Purchase of intangibles (1,221) (651) (1,341)Acquisition of subsidiaries and business undertakings, net of cash acquired — (11,496) (12,485)Proceeds from disposal of property, plant and equipment 209 130 693Interest received 704 821 1,736Redemption/(purchase) of treasury deposits (net) 91,887 14,203 (5,803)
Net cash from/(used in) investing activities 90,147 1,176 (21,062)
Cash flows from financing activitiesInterest paid (51) (67) (165)Purchase of own shares (717) (615) (615)Proceeds from the issue of shares 2 3 3Dividends paid to equity holders of the parent (113,273) (11,542) (14,602)
Net cash used in financing activities (114,039) (12,221) (15,379)
Net (decrease)/increase in cash and cash equivalents (475) 2,448 4,313Net foreign exchange difference (2,183) (793) 1,290Opening cash and cash equivalents 54,272 48,669 48,669
Closing cash and cash equivalents 51,614 50,324 54,272
* Restated for the impact of IAS 19 (revised 2011), see note 2.
Consolidated cash flow statementFor the six months ended 30 September 2013

Financial statements
FINANCIALSovervIew buSINeSS revIew
Interim report 2013 | AVEVA Group plc 15
notes to the interim report
1 tHe interim report
The interim report was approved by the Board on 18 November 2013. The financial information set out in the interim report is unaudited but has been reviewed by the auditor, Ernst & Young LLP, and their report to the Company is set out on page 8.
The interim report will be posted to shareholders in due course and copies will be available from the registered office of AVEVA Group plc, High Cross, Madingley Road, Cambridge CB3 0HB and on the Company’s website at www.aveva.com.
2 basis of preparation anD aCCounting poliCies
The interim report for the six months ended 30 September 2013 has been prepared in accordance with IAS 34 Interim Financial Reporting and the disclosure requirements of the Listing Rules.
The Consolidated income statement, the Consolidated statement of comprehensive income, the Consolidated statement of changes in shareholders’ equity and affected notes have been restated for the six months ended 30 September 2012 and the year ended 31 March 2013 to reflect changes in the way in which returns on scheme assets are recognised in accordance with IAS 19 Employee Benefits (revised). The effect of this has been to reduce the element of finance revenue associated with retirement benefit obligations by £267,000 in the six months ended 30 September 2013, by £76,000 in the six months ended 30 September 2012 and by £152,000 in the year ended 31 March 2013. The results of the Group for prior periods have been restated for this change in accounting policy. There was no impact on the disclosed defined benefit pension obligation at either period end.
The amendments to IAS 1 introduce a grouping of items presented in other comprehensive income (OCI). Items that could be reclassified (or recycled) to profit or loss at a future point in time are now presented separately from items that will never be reclassified. The amendment affected presentation only and had no impact on the Group’s financial position or performance.
In all other respects, the interim report has been prepared on the basis of the accounting policies set out in the most recently published annual report of the Group for the year ended 31 March 2013.
The interim report does not include all the information and disclosures required in the annual report and should be read in conjunction with the annual report for the year ended 31 March 2013.
The financial information set out within this report does not constitute AVEVA’s Consolidated statutory financial statements as defined in Section 435 of the Companies Act 2006. The results for the year ended 31 March 2013 have been extracted from the Consolidated statutory financial statements for AVEVA Group plc for the year ended 31 March 2013 which are prepared in accordance with IFRS as adopted by the European Union, on which the auditor gave an unqualified report (which made no statement under Section 498 (2) or (3) respectively of the Companies Act 2006 and did not draw attention to any matters by way of emphasis), and have been filed with the Registrar of Companies.
The Group presents a non-GAAP performance measure on the face of the Consolidated income statement. The Directors believe that this alternative measure of profit provides a reliable and consistent measure of the Group’s underlying performance. The face of the Consolidated income statement presents adjusted profit before tax and reconciles this to profit before tax as required to be presented under the applicable accounting standards. Adjusted earnings per share is calculated having adjusted profit after tax for the same items and their tax effect. The term adjusted profit is not defined under IFRS and may not be comparable with similarly titled profit measures reported by other companies. It is not intended to be a substitute for, or superior to, GAAP measures of profit.
3 going ConCern
As disclosed in the most recent annual report, the Group continues to have significant financial resources and continues to be profitable. At 30 September 2013, the Group had bank and cash and treasury deposits of £95.8 million (31 March 2013 – £166.4 million), after having paid a special dividend to shareholders during the six month period of £100 million, and no debt.
Therefore, after making enquiries and considering the cash flow forecasts for the Group, the Directors have a reasonable expectation that the Group has adequate resources to continue its operational existence for the foreseeable future. For this reason they continue to adopt the going concern basis in preparing the interim financial statements.

Financial statementsAVEVA Group plc | Interim report 2013
www.AvevA.Com
16
4 risks anD unCertainties
AVEVA has continued to be successful in the period, but as with any organisation there are a number of potential risks and uncertainties which could have a material impact on the Group’s long-term performance.
The primary risk and uncertainty related to the Group’s performance for the remainder of the year is the challenging macroeconomic environment, which could have a material impact on the Group’s performance over the remaining six months of the financial year and could cause actual results to differ materially from expected and historical results.
The other principal risks and uncertainties faced by the Group have not changed from those set out in the annual report for the year ended 31 March 2013. These include:
B dependency on key markets;
B competition;
B Enterprise Solutions;
B identification and successful integration of acquisitions;
B protection of the Group’s intellectual property rights;
B research and development;
B risks associated with widespread international operations;
B recruitment and retention of employees; and
B foreign exchange risk.
These risks are described in more detail on pages 24 and 25 of the 2013 annual report. The Directors routinely monitor all of these risks and uncertainties and appropriate actions are taken where possible to mitigate these risks. Included in the Business review is a commentary on the outlook of the Group for the remaining six months of the year.
5 revenue
An analysis of the Group’s revenue is as follows:
Six months endedYear ended
31 March30 September
2013 2012 2013£000 £000 £000
(unaudited) (unaudited) (audited)
Annual fees 28,350 25,840 54,391Rental licence fees 47,203 41,293 98,833
Total recurring revenue 75,553 67,133 153,224Initial licence fees 21,615 19,461 42,431Training and services 11,307 11,013 24,575
Total revenue 108,475 97,607 220,230Finance revenue 1,949 1,983 4,059
110,424 99,590 224,289
The operations of the Group are not subject to significant seasonality.
Services consist of consultancy and training fees.
notes to the interim reportcontinued

Financial statements
FINANCIALSovervIew buSINeSS revIew
Interim report 2013 | AVEVA Group plc 17
6 segment information
The Group is organised into two lines of business, being Engineering & Design and Enterprise Solutions, which are considered to be the two reportable segments for the Group. The products of each of the lines of business are taken to market by a shared sales force that is itself organised into three geographical sales divisions: Asia Pacific; Americas; and Europe, Middle East and Africa (EMEA).
The Executive Board monitors the operating results of the lines of business for the purposes of making decisions about performance assessment and resource allocation. Performance is evaluated based on adjusted profit contribution using the same accounting policies as adopted for the Group’s financial statements. There is no inter-segment revenue. Balance sheet information is not included in the information provided to the Executive Board. Support functions such as head office departments are controlled and monitored centrally.
Six months ended 30 September 2013 (unaudited)
Engineering Enterprise& Design Solutions Total
£000 £000 £000
Income statementRevenueAnnual fees 25,539 2,811 28,350Rental licence fees 45,688 1,515 47,203Initial licence fees 19,882 1,733 21,615Training and services 4,571 6,736 11,307
Segment revenue 95,680 12,795 108,475Operating costs (23,802) (14,441) (38,243)
Segment profit/(loss) contribution 71,878 (1,646) 70,232
Reconciliation of segment profit contribution to profit before taxShared selling and distribution expenses (27,240)Other shared operating expenses (11,074)Net finance revenue 349
Adjusted profit before tax 32,267
Exceptional items and other normalised adjustments# (4,925)
Profit before tax 27,342
# Normalised adjustments include amortisation of intangible assets (excluding other software), share-based payments and gains/losses on fair value of forward foreign exchange contracts.

Financial statementsAVEVA Group plc | Interim report 2013
www.AvevA.Com
18
6 segment information continued
Six months ended 30 September 2012 (unaudited)*
Engineering Enterprise& Design Solutions Total
£000 £000 £000
Income statementRevenueAnnual fees 23,373 2,467 25,840Rental licence fees 39,684 1,609 41,293Initial licence fees 17,032 2,429 19,461Training and services 5,310 5,703 11,013
Segment revenue 85,399 12,208 97,607Operating costs (20,794) (13,979) (34,773)
Segment profit/(loss) contribution 64,605 (1,771) 62,834
Reconciliation of segment profit contribution to profit before taxShared selling and distribution expenses (25,709)Other shared operating expenses (9,092)Net finance revenue 553
Adjusted profit before tax 28,586
Exceptional items and other normalised adjustments# (2,823)
Profit before tax 25,763
Year ended 31 March 2013 (audited)*
Engineering Enterprise& Design Solutions Total
£000 £000 £000
Income statementRevenueAnnual fees 49,032 5,359 54,391Rental licence fees 93,343 5,490 98,833Initial licence fees 36,268 6,163 42,431Training and services 10,902 13,673 24,575
Segment revenue 189,545 30,685 220,230Operating costs (45,439) (28,670) (74,109)
Segment profit contribution 144,106 2,015 146,121
Reconciliation of segment profit contribution to profit before taxShared selling and distribution expenses (54,957)Other shared operating expenses (21,705)Net finance revenue 1,103
Adjusted profit before tax 70,562
Exceptional items and other normalised adjustments# (7,067)
Profit before tax 63,495
* Restated for the impact of IAS 19 (revised 2011), see note 2.
# Normalised adjustments include amortisation of intangible assets (excluding other software), share-based payments and gains/losses on fair value of forward foreign exchange contracts.
notes to the interim reportcontinued

Financial statements
FINANCIALSovervIew buSINeSS revIew
Interim report 2013 | AVEVA Group plc 19
6 segment information continued
analysis of revenue by geographical location
Six months ended 30 September 2013 (unaudited)
Asia Pacific EMEA Americas Total£000 £000 £000 £000
RevenueAnnual fees 10,337 15,246 2,767 28,350Rental licence fees 16,487 19,192 11,524 47,203Initial licence fees 13,672 5,974 1,969 21,615Training and services 1,839 7,941 1,527 11,307
Total revenue 42,335 48,353 17,787 108,475
Six months ended 30 September 2012 (unaudited)
Asia Pacific EMEA Americas Total£000 £000 £000 £000
RevenueAnnual fees 10,888 12,605 2,347 25,840Rental licence fees 12,459 18,205 10,630 41,294Initial licence fees 9,745 8,548 1,168 19,461Training and services 1,568 7,257 2,187 11,012
Total revenue 34,660 46,615 16,332 97,607
Year ended 31 March 2013 (audited)
Asia Pacific EMEA Americas Total£000 £000 £000 £000
RevenueAnnual fees 22,962 26,707 4,722 54,391Rental licence fees 26,083 46,787 25,963 98,833Initial licence fees 20,237 18,027 4,167 42,431Training and services 3,993 16,148 4,434 24,575
Total revenue 73,275 107,669 39,286 220,230
7 exCeptional items
During the period the Group incurred exceptional costs of £2.2 million related to acquisition and integration costs of £0.1 million, exceptional restructuring costs of £1.1 million and a provision for underpaid sales taxes in an overseas location of £1.0 million.
The restructuring costs relate to rationalisation of the Group’s resources and principally relates to Bocad.
The Group has provided for a potential underpaid sales tax liability, mostly in respect of prior periods, related to the local sales of one of the Group’s subsidiary companies. The provision includes an estimate of the underpaid tax as well as related interest for late payment.

Financial statementsAVEVA Group plc | Interim report 2013
www.AvevA.Com
20
8 inCome tax expense
The current year income tax expense for the six months ended 30 September 2013 is estimated at 27.6% (2012 – 29.0%) of profit before tax. The total tax charge of £7.5 million (2012 – £7.5 million) is made up of UK tax of £4.6 million (2012 – £4.8 million) and overseas tax of £2.9 million (2012 – £2.7 million).
At the balance sheet date the UK government had enacted a 2% reduction in the main rate of UK corporation tax from 23% to 21% from 1 April 2014 and a further 1% reduction to 20% from 1 April 2015. The impact of these changes on the deferred tax balances of the Group is included in the tax charge.
During the period legislation was enacted to allow UK companies to elect for the Research and Development Expenditure Credit (RDEC) on qualifying expenditure incurred since 1 April 2013, instead of the existing super-deduction rules. These interim statements assume that the election will be made and therefore the RDEC is recorded as income included in profit before tax, netted against Research and Development expenses. In previous periods there was a reduction in the income tax expense.
9 orDinary DiviDenDs
The proposed interim dividend of 5.0 pence per ordinary share will be payable on 3 February 2014 to shareholders on the register on 3 January 2014. In accordance with IFRS, no provision for the interim dividend has been made in these financial statements.
An analysis of dividends paid is set out below:
Six months endedYear ended
31 March30 September
2013 2012 2013£000 £000 £000
(unaudited) (unaudited) (audited)
Final 2011/12 paid at 17.0 pence per share — — 11,572Interim 2012/13 paid at 4.5 pence per share — — 3,030Final 2012/13 paid at 19.5 pence per share 13,261 11,542 —Special dividend paid at 147.0 pence per share 100,012 — —
113,273 11,542 14,602
10 earnings per sHare
Six months endedYear ended
31 March30 September
2013 2012* 2013*Pence Pence Pence
(unaudited) (unaudited) (audited)
Earnings per share for the period:– basic 29.64 27.03 66.97– diluted 29.59 26.95 66.82Adjusted earnings per share:– basic 35.23 30.19 74.87– diluted 35.16 30.10 74.70
* Restated for the impact of IAS 19 (revised 2011), see note 2.
notes to the interim reportcontinued

Financial statements
FINANCIALSovervIew buSINeSS revIew
Interim report 2013 | AVEVA Group plc 21
10 earnings per sHare continued
The calculation of earnings per share is based on the profit after tax for the six months ended 30 September 2013 of £19.8 million and the following weighted average number of shares:
Six months endedYear ended
31 March30 September
2013 2012 2013Number Number Number
of shares of shares of shares(unaudited) (unaudited) (audited)
Weighted average number of ordinary shares for basic earnings per share 66,787,183 67,929,646 67,962,515Effect of dilution: employee share options 127,281 186,844 153,801
Weighted average number of ordinary shares adjusted for the effect of dilution 66,914,464 68,116,490 68,116,316
Details of the calculation of adjusted earnings per share are set out below:
Six months endedYear ended
31 March30 September
2013 2012* 2013*£000 £000 £000
(unaudited) (unaudited) (audited)
Profit after tax for the period 19,798 18,301 45,397Intangible amortisation (excluding other software) 2,330 1,870 3,946Share-based payments 1,498 394 1,226(Gains)/losses on fair value of forward foreign exchange contracts (1,148) (112) 796Exceptional items 2,245 671 1,099Tax effect (1,196) (678) (1,696)
Adjusted profit after tax 23,527 20,446 50,768
* Restated for the impact of IAS 19 (revised 2011), see note 2.
11 CasH anD CasH equivalents anD treasury Deposits
Six months endedYear ended
31 March30 September
2013 2012 2013£000 £000 £000
(unaudited) (unaudited) (audited)
Cash at bank and in hand 48,050 50,048 51,458Short-term deposits 3,564 276 2,814
Total cash and cash equivalents 51,614 50,324 54,272Treasury deposits 44,198 116,080 136,085
Total cash and deposits 95,812 166,404 190,357
Treasury deposits represent bank deposits with an original maturity of over three months.

Financial statementsAVEVA Group plc | Interim report 2013
www.AvevA.Com
22
12 traDe anD otHer reCeivables
Current
Six months endedYear ended
31 March30 September
2013 2012 2013£000 £000 £000
(unaudited) (unaudited) (audited)
Trade receivables 54,030 49,600 74,066Prepayments and other receivables 5,102 5,315 5,155Accrued income 833 2,228 1,056
59,965 57,143 80,277
non-current
Six months endedYear ended
31 March30 September
2013 2012 2013£000 £000 £000
(unaudited) (unaudited) (audited)
Other receivables 1,339 802 1,113
Non-current other receivables consist of rental deposits for operating leases.
13 traDe anD otHer payables
Six months endedYear ended
31 March30 September
2013 2012 2013£000 £000 £000
(unaudited) (unaudited) (audited)
Trade payables 3,495 3,462 4,093Social security, employee and sales taxes 5,502 4,933 8,827Accruals and other payables 13,121 14,021 23,160Deferred income 30,419 31,208 36,585Deferred consideration 629 867 878
53,166 54,491 73,543
notes to the interim reportcontinued

Financial statements
FINANCIALSovervIew buSINeSS revIew
Interim report 2013 | AVEVA Group plc 23
14 finanCial instruments
Financial instruments which are recognised at fair value subsequent to initial recognition are grouped into Levels 1 to 3 based on the degree to which the fair value is observable. The three levels are defined as follows:
B Level 1 fair value measurements are those derived from quoted prices (unadjusted) in active markets for identical assets or liabilities;
B Level 2 fair value measurements are those derived from inputs other than quoted prices included within Level 1 that are observable for the asset or liability, either directly (i.e. as prices) or indirectly (i.e. derived from prices); and
B Level 3 fair value measurements are those derived from valuation techniques that include inputs for the asset or liability that are not based on observable market data (unobservable inputs).
The Group’s financial assets include forward foreign exchange contracts which were measured at Level 2 fair value subsequent to initial recognition and were calculated as the present value of the estimated cash flows based on spot and forward exchange rates. There were no transfers between levels during the periods disclosed. At 30 September 2013 the fair value of the financial asset in respect of foreign exchange contracts was £574,000 (31 March 2013 – asset of £574,000 and at 30 September 2012 – £334,000 asset).
15 retirement benefit obligations
The movement in the provision for retirement benefit obligations during the period was as follows:
UK defined German South benefit defined Korean scheme benefit severance Total
Restated schemes pay Restated£000 £000 £000 £000
At 1 April 2012 7,808 759 1,308 9,875Arising from business combination — 880 — 880Current service cost 780 20 170 970Interest on pension scheme liabilities 1,343 25 — 1,368Expected return on pension scheme assets (1,162) (7) — (1,169)Actuarial loss/(gain) 1,022 (24) — 998Employer contributions (654) (59) (18) (731)Exchange adjustment — (56) (4) (60)
At 30 September 2012 9,137 1,538 1,456 12,131Current service cost 800 20 125 945Interest on pension scheme liabilities 1,350 26 61 1,437Expected return on pension scheme assets (1,161) (7) — (1,168)Actuarial loss 4,494 321 65 4,880Employer contributions (1,406) (18) (12) (1,436)Exchange adjustment — 65 105 170
At 31 March 2013 13,214 1,945 1,800 16,959Current service cost 829 29 160 1,018Interest on pension scheme liabilities 1,524 25 — 1,549Expected return on pension scheme assets (1,245) (7) — (1,252)Actuarial (gain)/loss (3,274) 25 — (3,249)Employer contributions (699) (934) (41) (1,674)Exchange adjustment — (8) (41) (49)
At 30 September 2013 10,349 1,075 1,878 13,302

Financial statementsAVEVA Group plc | Interim report 2013
www.AvevA.Com
24
16 relateD party transaCtions
Transactions between Group subsidiaries have been eliminated on consolidation. A list of subsidiaries can be found in the notes to the AVEVA Group plc financial statements in the 2013 annual report.
notes to the interim reportcontinued

Financial statements
FINANCIALSovervIew buSINeSS revIew
Interim report 2013 | AVEVA Group plc 25
The Directors of the Company confirm that to the best of our knowledge:
B the interim report has been prepared in accordance with IAS 34;
B the interim report includes a fair review of the information required by DTR 4.2.7R, being an indication of the important events that have occurred during the first six months of the financial year and a description of the principal risks and uncertainties for the remaining six months of the year; and
B the interim report includes a fair review of the information required by DTR 4.2.8R, being disclosure of related party transactions and changes therein since the last annual report.
By order of the Board
RICHARD LONGDON JAMES KIDDChief Executive Chief Financial Officer18 November 2013
responsibility statement of the DirectorsIn respect of the interim report

www.AvevA.Com
26 AVEVA Group plc | Interim report 2013 Other information
Company information and advisers
DireCtors
philip aiken Chairman philip Dayer Non-Executive Director and Senior Independent Director Jonathan brooks Non-Executive Director Jennifer allerton Non-Executive Director richard longdon Chief Executive James kidd Chief Financial Officer
seCretary
Helen barrett-Hague
registereD offiCe
High Cross Madingley Road Cambridge CB3 0HB
registereD number
2937296
auDitor
ernst & young llp
One Cambridge Business Park Cambridge CB4 0WZ
bankers
barclays bank plc
15 Bene’t Street Cambridge CB2 3PZ
soliCitors
ashurst llp
Broadwalk House 5 Appold Street London EC2A 2HA
mills & reeve llp
Francis House 112 Hills Road Cambridge CB2 1PH
Joint stoCkbrokers
goldman sachs international
Peterborough Court 133 Fleet Street London EC4A 2BB
numis securities limited
The London Stock Exchange Building 10 Paternoster Square London EC4M 7LT
registrars
Capita registrars limited
The Registry 34 Beckenham Road Beckenham BR3 4TU
finanCial pr
Hudson sandler
29 Cloth Fair London EC1A 7NN
Headquartered in Cambridge, England, AVEVA Group plc and its operating subsidiaries currently employ staff worldwide in Australia, Austria, Belgium, Brazil, Canada, Chile, China, Columbia, Denmark, France, Germany, Hong Kong, Hungary, India, Italy, Japan, Malaysia, Mexico, Norway, Poland, Russia, Saudi Arabia, Singapore, Spain, Sweden, South Korea, United Arab Emirates, United Kingdom and the United States of America. AVEVA also has representatives in additional countries around the world.
For more details on AVEVA worldwide offices, visit www.aveva.com/offices.

aalborg, Denmarkal khobar, saudi arabiabeijing, Chinabogata, Columbiabremen, germanybrisbane, australiabudapest, Hungarybusan, south koreaCalgary, CanadaCambridge, ukCharlotte, usaChesterfield, ukDubai, uaefrankfurt, germanygenoa, italyguangzhou, ChinaHamburg, germanyHelsinki, finlandHong kong, ChinaHouston, usaHyderabad, indiakarlstad, swedenkuala lumpur, malaysia
lyon, francemadrid, spainmalmö, swedenmanchester, ukmexico City, mexicomelbourne, australiamoscow, russiamumbai, indiaoslo, norwayparis, franceperg, austriaperth, australiario de Janeiro, brazilsantiago, Chileseoul, south koreashanghai, Chinasingaporest petersburg, russiastavanger, norwaystockholm, swedenwilmington, usawroclaw, polandyokohama, Japan
Corporate HeaDquartersaveva solutions ltdHigh Cross, Madingley Road, Cambridge CB3 0HB, UK
www.aveva.com/offices
group DireCtory

AVEVA Group plcHigh CrossMadingley RoadCambridge CB3 0HBUK
Tel +44 (0)1223 556655Fax +44 (0)1223 556666