avaliação dos efeitos neurotóxicos de cianotoxinas em
TRANSCRIPT
Universidade Federal de São Carlos
Centro de Ciências Biológicas e da Saúde
Programa de Pós-Graduação em Ecologia e Recursos Naturais
Emanuela Cristina de Freitas
Avaliação dos efeitos neurotóxicos de cianotoxinas em cladóceros
com ênfase na utilização de um biomarcador bioquímico para sua
detecção
São Carlos
2013

Universidade Federal de São Carlos
Centro de Ciências Biológicas e da Saúde
Programa de Pós-Graduação em Ecologia e Recursos Naturais
Emanuela Cristina de Freitas
Avaliação dos efeitos neurotóxicos de cianotoxinas em cladóceros
com ênfase na utilização de um biomarcador bioquímico para sua
detecção
Orientadora: Dra. Odete Rocha
Co-orientadora: Dra. Liane B. Printes
Co-orientadora Doutorado-Sanduíche: Dra. Susana Loureiro
São Carlos
2013
Tese de Doutorado apresentada ao Programa de Pós-Graduação em Ecologia e Recursos Naturais do Centro de Ciências Biológicas e da Saúde da Universidade Federal de São Carlos, como parte dos requisitos para a obtenção do título de Doutor em Ciências, área de concentração em Ecologia e Recursos Naturais

Ficha catalográfica elaborada pelo DePT da Biblioteca Comunitária/UFSCar
F866ae
Freitas, Emanuela Cristina de. Avaliação dos efeitos neurotóxicos de cianotoxinas em cladóceros com ênfase na utilização de um biomarcador bioquímico para sua detecção / Emanuela Cristina de Freitas. -- São Carlos : UFSCar, 2013. 193 f. Tese (Doutorado) -- Universidade Federal de São Carlos, 2013. 1. Meio ambiente de água doce. 2. Anatoxina-a(s). 3. Microcistina. 4. Colinesterases. 5. Misturas complexas. 6. Ecotoxicologia tropical. I. Título. CDD: 574.52632 (20a)


“Dedico este trabalho a todos que contribuíram para que este
sonho se tornasse uma realidade”
“Para minha pequena e querida família
... meu porto seguro...”

“There is not a single creature on Earth which has more or less right to be here”
(Anthony D. Williams)
“Por vezes sentimos que aquilo que fazemos não é senão uma gota de água no mar.
Mas o mar seria menor se lhe faltasse uma gota”
(Madre Teresa de Calcutá)

AGRADECIMENTOS
À querida professora Dra. Odete Rocha, pela orientação, apoio, confiança, grande
amizade e, principalmente, pelos valiosos ensinamentos ao longo desses dez anos em que
estamos trabalhando juntas.
À Dra. Liane B. Printes pela co-orientação e valiosos ensinamentos que muito
acrescentaram em minha vida acadêmica. Muito obrigada pela oportunidade !
À Professora Dra. Susana Loureiro pela co-orientação, pelos valiosos ensinamentos e pela
oportunidade de fazer um doutorado sanduíche em Portugal. Essa experiência enriqueceu tanto
minha vida acadêmica quanto minha vida pessoal. Muito obrigada pela realização de um sonho !
À Professora Dra. Sandra Azevedo da Universidade Federal do Rio de Janeiro pelo
fornecimento das cepas de Anabaena spiroides e de Microcystis aeruginosa, sem as quais este trabalho
não poderia ser realizado.
À Professora Dra. Marisa Narciso Fernandes do Departamento de Ciências Fisiológicas
da Universidade Federal de São Carlos pela permissão na utilização de seu laboratório de análises
bioquímicas, o qual foi essencial para a realização deste trabalho.
Ao Professor Dr. Armando Vieira e ao técnico Luís do Departamento de Botânica da
Universidade Federal de São Carlos pela permissão no uso da centrífuga de fluxo contínuo,
centrífuga refrigerada e sonicador.
Às Professoras Dra. Maria da Graça Gama Melão, Dra. Cleoni dos Santos Carvalho e
Dra. Mirna Helena Regali Seleghim pelas contribuições no Exame de Qualificação.
Aos professores Dr. João Sarkis Yunes, Dr. Evaldo Luiz Gaeta Espíndola, Dra. Maria da
Graça da Gama Melão e Dra. Marisa Narciso Fernandes pelas contribuições no Exame de
Defesa.
Aos técnicos Cláudio, Márcio e Rafael do setor de criogenia do Departamento de Física
da Universidade Federal de São Carlos pelo fornecimento do nitrogênio líquido. Também ao
técnico Celso do Departamento de Física da Escola de Engenharia de São Carlos da
Universidade de São Paulo pelo fornecimento do nitrogênio líquido quando este não pode ser
fornecido pela UFSCar.
Ao técnico Abel Ferreira do Departamento de Biologia da Universidade de Aveiro pela
ajuda e apoio essenciais no laboratório.
À minha mãe Ana e irmã Lúcia por absolutamente tudo, principalmente pelas palavras de
apoio, ajuda, dedicação e amor. Amo vocês !
Ao meu querido pai Jorge que nos deixou na convivência de todos os dias. Ainda sinto
que sua presença é forte em minha vida.

À Inessa L. Bagatini pela amizade, apoio, auxílio e incentivo no laboratório. Muito
obrigada, querida !
À querida amiga Elisa G. Carvalho e família pelas conversas, pela ajuda e apoio sempre.
Muito obrigada por tudo !
À amiga Renata Takenaka por ter uma importante contribuição em minha iniciação na
vida acadêmica.
Aos amigos feitos em Portugal: Carlos, Rita, Cátia, Paulinha, Fabianne, Maria, Carolina,
Tayres e tantos outros pela simpatia com que me receberam. Obrigada a todos pela amizade e
ajuda na minha adaptação em Aveiro. Muito obrigada pelo apoio.
A todos os amigos do Departamento de Ecologia e Biologia Evolutiva;
Ao CNPq (Conselho Nacional de Desenvolvimento Científico e Tecnológico) pelas
bolsas concedidas (No. processos 141095/2009-1 e 201322/2012-9).
A todos que contribuíram de alguma forma para a realização deste trabalho.

SUMÁRIO
Resumo...........................................................................................................................................................i
Abstract.........................................................................................................................................................iii
Lista de figuras............................................................................................................................................v
Lista de tabelas...........................................................................................................................................ix
Apresentação da tese...............................................................................................................................xii
1. Introdução e justificativa......................................................................................................................1
1.1. Cianobactérias......................................................................................................................................2
1.1.1. Peptídeos cíclicos hepatotóxicos.................................................................................................4
1.1.1.1. Microcistinas...................................................................................................................................5
1.1.1.2. Nodularinas.....................................................................................................................................6
1.1.2. Alcalóides............................................................................................................................................6
1.1.2.1. Saxitoxinas.......................................................................................................................................7
1.1.2.2. Anatoxina-a e seu homólogo Homoanatoxina-a.................................................................8
1.1.2.3. Anatoxina-a(s)................................................................................................................................9
1.1.2.4. Cilindrospermopsinas................................................................................................................10
1.1.2.5. Aplisiatoxina e Lingbiatoxina-a.............................................................................................11
1.1.3. Lipopolissacarídeos.......................................................................................................................11
1.1.4. Outros compostos bioativos.......................................................................................................12
1.2. Efeitos das cianobactérias sobre o zooplâncton......................................................................12
1.3. Cladóceros...........................................................................................................................................14
1.3.1. Os cladóceros na Ecotoxicologia..............................................................................................16
1.4. Biomarcadores...................................................................................................................................20
1.4.1. Biomarcadores em estudos de Avaliação de Risco Ecológico.........................................24
1.4.2. Biomarcadores para as cianotoxinas.......................................................................................27
1.4.3. Biomarcadores em cladóceros...................................................................................................30
1.4.3.1. Colinesterases..............................................................................................................................30
1.4.3.1.1. A atividade das colinesterases como um biomarcador bioquímico.........................32
1.5. Misturas tóxicas.................................................................................................................................33
1.6. Justificativa..........................................................................................................................................35
Referências bibliográficas......................................................................................................................36
2. Objetivos e hipóteses..........................................................................................................................54
2.1. Objetivos gerais.................................................................................................................................54
2.2. Objetivos específicos.......................................................................................................................54
2.3. Hipóteses.............................................................................................................................................55
3. Metodologia geral................................................................................................................................56
3.1. Cultivo dos cladóceros.....................................................................................................................56
3.1.1. Origem do material biológico – Pseudosida ramosa e Daphnia magna.......................56
3.1.2. Água de cultivo – meio ASTM...................................................................................................57
3.1.2.1. Complemento vitamínico.........................................................................................................58
3.1.3. Estrutura do sistema de cultivo.................................................................................................58
3.1.3.1. Pseudosida ramosa.....................................................................................................................59
3.1.3.2. Daphnia magna...........................................................................................................................60
3.1.4. Alimentação dos cladóceros cultivados..................................................................................60
3.1.4.1. Cultivo da alga clorofícea Pseudokirchneriella subcapitata..........................................61
3.1.4.1.1. Preparo do inóculo algal........................................................................................................63
3.2. Origem e cultivo das cianobactérias Anabaena spiroides e Microcystis
aeruginosa...................................................................................................................................................63
3.2.1. Preparo do inóculo das cianobactérias....................................................................................65
3.3. Lavagem das vidrarias e dos materiais de trabalho................................................................66
Referências bibliográficas......................................................................................................................67
4. Resultados e discussão.......................................................................................................................68
Capítulo 4.1. Measurements of cholinesterase activity in the tropical freshwater
cladoceran Pseudosida ramosa and its standardization as a biomarker.................................68
Abstract........................................................................................................................................................68
4.1.1. Introduction.....................................................................................................................................68
4.1.2. Material and methods...................................................................................................................69
4.1.2.1. Organisms and culture conditions........................................................................................69
4.1.2.2. Treatment of the organisms for their use in the ChE assays........................................70
4.1.2.3. General description of the method of ChE assays...........................................................71
4.1.2.4. Protein concentration................................................................................................................72
4.1.2.5. ChE assay conditions................................................................................................................73
4.1.2.5.1. Effect of pH and molarity on measured reaction rate in the ChE assays..............73
4.1.2.5.2. Effect of ATCI concentration on measured reaction rate and kinetic
characteristics in the ChE assays.........................................................................................................73
4.1.2.5.3. Measured reaction rate as a function of enzyme concentration in the ChE
assays............................................................................................................................................................73
4.1.2.5.4. Effect of the number of organisms and homogenate dilutions on the reaction
rate of substrate hydrolysis and ChE activity...................................................................................74
4.1.2.5.5. Limit of quantitation..............................................................................................................74
4.1.2.6. Data treatment and statistical analysis................................................................................75
4.1.3. Results and Discussion................................................................................................................75
4.1.4. Conclusions.....................................................................................................................................83
Acknowledgments....................................................................................................................................83
References...................................................................................................................................................84
Capítulo 4.2. Acute effects of the anatoxin-a(s) extract and paraoxon-methyl on
freshwater cladocerans from tropical and temperate regions: links between the ChE
activity and survival and its implications for tropical ecotoxicological
studies..........................................................................................................................................................88
Abstract........................................................................................................................................................88
4.2.1. Introduction.....................................................................................................................................88
4.2.2. Material and methods..................................................................................................................90
4.2.2.1. Test organisms and culture conditions...............................................................................90
4.2.2.2. Chemicals and preparation of the test solutions..............................................................91
4.2.2.2.1. Anatoxin-a(s) extracts............................................................................................................91
4.2.2.2.2. Paraoxon-methyl.....................................................................................................................92
4.2.2.3. Chemical detection....................................................................................................................93
4.2.2.4. Standard acute toxicity tests...................................................................................................93
4.2.2.5. Relationship between ChE activity and survival..............................................................94
4.2.2.6. ChE assays...................................................................................................................................95
4.2.2.7. Data treatment and statistical analysis................................................................................96
4.2.3. Results...............................................................................................................................................97
4.2.3.1. Validity of the tests and abiotic variables............................................................................97
4.2.3.2. Standard acute toxicity tests...................................................................................................98
4.2.3.2. ChE assays...................................................................................................................................98
4.2.3.3. Relationship between the ChE activity and survival.....................................................101
4.2.4. Discussion.....................................................................................................................................104
4.2.5. Conclusions...................................................................................................................................108
Acknowledgments..................................................................................................................................109
References.................................................................................................................................................110
Capítulo 4.3. Is the use of native species a better choice to assess the anatoxin-a(s) in
tropical species? The specificity of ChE activity of two cladoceran species to detect the
presence and sub-lethal effects of anatoxin-a(s) extracts through different levels of
biological organization.........................................................................................................................116
Abstract......................................................................................................................................................116
4.3.1. Introduction...................................................................................................................................116
4.3.2. Material and methods................................................................................................................119
4.3.2.1. Test organisms and culture conditions.............................................................................119
4.3.2.2. Cyanobacterial cultures and preparation of the stock solutions................................120
4.3.2.2.1. Culture of Microcystis aeruginosa and preparation of the microcystin
extracts.......................................................................................................................................................120
4.3.2.2.2. Culture of Anabaena spiroides and preparation of the anatoxin-a(s)
extracts.......................................................................................................................................................121
4.3.2.3. Chemical detection..................................................................................................................122
4.3.2.4. Effects of the microcystin extract on ChE activity of P. ramosa and D.
magna.........................................................................................................................................................122
4.3.2.5. Analysis of ChE activity, life history parameters and population growth rate in P.
ramosa and D. magna...........................................................................................................................123
4.3.2.5.1. Experimental design............................................................................................................123
4.3.2.5.2. Life history parameters and population growth rate..................................................125
4.3.2.6. Measurement of ChE activity...............................................................................................126
4.3.2.7. Data treatment and statistical analysis..............................................................................127
4.3.3. Results............................................................................................................................................127

4.3.3.1. Microcystin analysis................................................................................................................127
4.3.3.2. Validity of the tests and abiotic variables.........................................................................128
4.3.3.3. Effects of the microcystin extract on ChE activity of P. ramosa and D.
magna.........................................................................................................................................................128
4.3.3.4. Effects of the anatoxin-a(s) extract on ChE activity, life history parameters and
population growth rate of P. ramosa and D. magna....................................................................131
4.3.3.4.1. ChE activity............................................................................................................................131
4.3.3.4.2. Body length............................................................................................................................132
4.3.3.4.3. Age at first reproduction.....................................................................................................133
4.3.3.4.4. Total number of accumulated live neonates per female...........................................133
4.3.3.4.5. Survival.....................................................................................................................................134
4.3.3.4.6. Population growth rate........................................................................................................136
4.3.3.5. Relationships between the 48-h ChE inhibition and effects at individual (21-day
reproduction) and populational levels (21-day population growth rate)................................136
4.3.4. Discussion.....................................................................................................................................137
4.3.5. Conclusions...................................................................................................................................141
Acknowledgments..................................................................................................................................142
References.................................................................................................................................................143
Capítulo 4.4. Can mixtures of cyanotoxins represent a risk to the zooplankton? The case
study of Daphnia magna Straus exposed to the hepatotoxic and neurotoxic
cyanobacterial extracts..........................................................................................................................151
Abstract......................................................................................................................................................151
4.4.1. Introduction...................................................................................................................................151
4.4.2. Material and methods................................................................................................................153
4.4.2.1. Test organism and culture conditions...............................................................................153
4.4.2.2. Origin and laboratory cultures of Microcystis aeruginosa and Anabaena
spiroides....................................................................................................................................................154
4.4.2.3. Preparation of the cyanobacterial extracts for assays...................................................154
4.4.2.4. Cyanotoxin analysis.................................................................................................................155
4.4.2.5. Single toxicity tests..................................................................................................................155
4.4.2.5.1. Acute toxicity tests................................................................................................................155
4.4.2.5.2. Feeding inhibition and post-exposure tests.................................................................156

4.4.2.6. Mixture toxicity tests..............................................................................................................157
4.4.2.6.1. Acute toxicity test..................................................................................................................157
4.4.2.6.2. Feeding inhibition and post-exposure test...................................................................157
4.4.2.7. Data analysis..............................................................................................................................158
4.4.3. Results............................................................................................................................................161
4.4.3.1. Cyanotoxin analysis.................................................................................................................161
4.4.3.2. Single toxicity tests..................................................................................................................161
4.4.3.3. Mixture toxicity tests..............................................................................................................164
4.4.4. Discussion.....................................................................................................................................168
4.4.5. Conclusions...................................................................................................................................172
Acknowledgements................................................................................................................................173
References.................................................................................................................................................174
5. Conclusões gerais..............................................................................................................................179
6. Considerações finais e recomendações.......................................................................................180
Apêndices..................................................................................................................................................181
Apêndice A...............................................................................................................................................182
Apêndice B...............................................................................................................................................189

i
RESUMO
Esta tese teve como objetivo avaliar o uso das colinesterases (ChE) das espécies de
cladóceros Pseudosida ramosa e Daphnia magna como um biomarcador bioquímico da presença e
dos efeitos de anatoxina-a(s) em diferentes níveis de organização biológica (molecular, individual
e populacional), além dos efeitos combinados das misturas dos extratos hepatotóxicos
(microcistinas) e neurotóxicos (anatoxina-a(s)) em D. magna. Um ensaio de microplacas foi
adaptado e otimizado para medir a atividade de ChE da P. ramosa, a fim de produzir um
protocolo de ensaio para esta espécie. A análise sobre o desempenho dos ensaios de ChE em P.
ramosa mostrou que estes são adequados para a quantificação da atividade enzimática nesta
espécie. P. ramosa mostrou ser uma alternativa adequada para o cladócero exótico D. magna.
Assim, foi proposto um protocolo de ensaio, o qual reúne a melhor combinação de parâmetros
para a utilização da atividade de ChE da P. ramosa como um biomarcador bioquímico. A atividade
de ChE da P. ramosa e da D. magna foram específicas para a indicação da presença de anatoxina-
a(s), uma vez que nenhum efeito sobre a atividade enzimática dessas espécies foi observado
quando elas foram expostas às microcistinas. Nas exposições agudas (48 h) ao extrato de
anatoxina-a(s) e ao paraoxon-metil, P. ramosa foi mais sensível do que D. magna para os
parâmetros atividade de ChE e sobrevivência. Também, P. ramosa foi mais sensível do que D.
magna quando exposta ao extrato de anatoxina-a(s) por sete dias. Quando as relações entre a
inibição de ChE e os parâmetros individuais e populacionais foram avaliados, diferentes respostas
foram observadas para as espécies estudadas. A inibição de ChE em P. ramosa teve uma relação
muito próxima com a sobrevivência nas exposições agudas ao extrato de anatoxina-a(s) e ao
paraoxon-metil. Para D. magna, por outro lado, esta relação não foi linear, sendo níveis altos de
inibição de ChE associados com quase nenhuma mortalidade. A atividade de ChE em P. ramosa
foi também um bom preditor dos efeitos crônicos do extrato de anatoxina-a(s) em níveis mais
elevados de organização biológica, uma vez que a inibição de ChE (48 h) foi associada
linearmente aos efeitos sub-letais na reprodução (21 dias) e na taxa de crescimento populacional
(21 dias). Para D. magna, essas relações não puderam ser estabelecidas, possivelmente devido a
diferenças espécie-específicas nas afinidades da acetilcolinesterase e das pseudocolinesterases aos
tóxicos. Assim, para a utilização de ChE como um biomarcador bioquímico nas avaliações de
risco de florescimentos de cianobactérias neurotóxicas em regiões tropicais, recomenda-se o uso
de espécies nativas, especialmente da P. ramosa, uma vez que a espécie modelo D. magna poderia
superestimar o risco para as espécies locais. Quando os efeitos das misturas dos extratos
hepatotóxicos e neurotóxicos foram avaliados sobre a sobrevivência e as taxas alimentares da D.
magna, respostas aditivas e sinergísticas foram observadas apenas nas taxas alimentares. Portanto,

ii
uma vez que diferentes tipos de cianotoxinas são encontrados nos ambientes naturais em
combinação, os riscos dessas toxinas sobre a comunidade zooplanctônica deveriam ser avaliados
não apenas individualmente, mas também como misturas.
Palavras-chave: anatoxina-a(s); microcistinas; paraoxon-metil; biomarcador bioquímico;
colinesterases; misturas complexas; Pseudosida ramosa; Daphnia magna.

iii
ABSTRACT
This thesis aimed to evaluate the use of cholinesterases (ChE) of the cladoceran species
Pseudosida ramosa and Daphnia magna as a biochemical biomarker of the presence and effects of
anatoxin-a(s) at different levels of biological organization (molecular, individual and population),
besides the combined effects of the mixtures of the hepatotoxic (microcystins) and neurotoxic
(anatoxin-a(s)) extracts in D. magna. A microplate assay was adapted and optimized for measuring
the ChE activity of P. ramosa, in order to produce an assay protocol for this species. The analysis
on the performance of ChE assays in P. ramosa showed that these are suitable for the quantifying
of enzymatic activity in this species. P. ramosa showed to be an adequate alternative to the exotic
cladoceran D. magna. Thus, it was proposed an assay protocol, which it meets the best
combination of parameters for the using of ChE activity of P. ramosa as a biochemical biomarker.
The ChE activity of P. ramosa and D. magna were specific for the indication of the presence of
anatoxin-a(s), since no effect on the enzymatic activity of these species was observed when they
were exposed to the microcystins. In the acute exposures (48-h) to the anatoxin-a(s) extract and
to the paraoxon-methyl, P. ramosa was more sensitive than D. magna for ChE activity and survival
endpoints. Also, P. ramosa was more sensitive than D. magna when exposed to the anatoxin-a(s)
extract for 7 days. When the relationships between the ChE inhibition and individual and
populational endpoints were evaluated, different responses were observed for the studied species.
The ChE inhibition in P. ramosa had a very close relationship with the survival in the acute
exposures to the anatoxin-a(s) extract and to the paraoxon-methyl. For D. magna, on the other
hand, this relationship was not linear, being high levels of ChE inhibition associated with almost
no mortality. The ChE activity in P. ramosa was also a good predictor of the chronic effects of
anatoxin-a(s) extract at higher levels of biological organization, since ChE inhibition (48 h) was
linearly linked to the sub-lethal effects on the reproduction (21 days) and on the population
growth rate (21 days). For D. magna, these relationships could not be established, possibly due to
species-specific differences in the affinities of both acetylcholinesterase and
pseudocholinesterases to the toxicants. Thus, for the using of ChE as a biochemical biomarker in
the risk assessments of neurotoxic cyanobacteria blooms in tropical regions, it is recommended
the use of native species, especially of P. ramosa, since the model species D. magna could
overestimate the risk to the local species. When the effects of the mixtures of the hepatotoxic and
neurotoxic extracts were evaluated on the survival and feeding rates of D. magna, additive and
synergistic responses were only observed on the feeding rates. Therefore, since different types of
cyanotoxins are found in the natural environments in combination, the risks of these toxins on
the zooplanktonic community should be evaluated not only individually, but also as mixtures.

iv
Keywords: anatoxin-a(s); microcystins; paraoxon-methyl; biochemical biomarker;
cholinesterases; complex mixtures; Pseudosida ramosa; Daphnia magna.
v
LISTA DE FIGURAS
1. Introdução e justificativa......................................................................................................................1
Fig. 1.1 Estrutura química geral dos peptídeos cíclicos hepatotóxicos. (A) Microcistinas e (B)
Nodularinas.....................................................................................................................................5
Fig. 1.2 Estrutura química de alcalóides. (1) Neurotoxinas: (A) Saxitoxinas, (B) Anatoxina-a, (C)
Homoanatoxina-a e (D) Anatoxina-a(s); (2) Citotoxinas: (E) Cilindrospermopsina; (3)
Dermatotoxina: (F) Aplisiatoxina e (G) Lingbiatoxina-a.........................................................7
Fig. 1.3 Estrutura química geral dos lipopolissacarídeos (LPS)...........................................................12
Fig. 1.4 Relações entre um distúrbio induzido por estresse e um subsequente dano a saúde........23
Fig. 1.5 Os impactos do aumento do distúrbio induzido por uma condição de estresse sobre os
diferentes níveis de organização biológica................................................................................24
Fig. 1.6 Ligação entre as respostas bioquímicas, individuais, populacionais, das comunidades e
dos ecossistemas e os efeitos e sua importância na escala de tempo...................................27
Fig. 1.7 Modo de ação da acetilcolinesterase (AChE(. A acetilcolina liga-se a acetilcolinesterase e
é hidrolisada em acetato (A) e colina (Ch)................................................................................31
3. Metodologia geral................................................................................................................................56
Fig. 3.1 Vista geral de um indivíduo de Pseudosida ramosa, cultivado em laboratório. Aumento
50x..................................................................................................................................................56
Fig. 3.2 Vista geral de um indivíduo adulto de Daphnia magna, cultivado em laboratório. Aumento
50x..................................................................................................................................................57

vi
Fig. 3.3 Visão geral de um cultivo da alga clorofícea Pseudokirchneriella subcapitata em fase
exponencial de crescimento........................................................................................................63
4. Resultados e discussão.......................................................................................................................68
Capítulo 4.1. Measurements of cholinesterase activity in the tropical freshwater
cladoceran Pseudosida ramosa and its standardization as a biomarker.................................68
Fig. 4.1.1 The effect of the pH of buffers on the rate of acetylthiocholine iodide hydrolysis
(mOD min-1) in P. ramosa.........................................................................................................76
Fig. 4.1.2 The effect of the buffer molarity on the rate of acetylthiocholine iodide hydrolysis
(mOD min-1) in P. ramosa.........................................................................................................77
Fig. 4.1.3 The effect of the substrate concentration on the reaction rate of acetylthiocholine
iodide hydrolysis (mOD min-1) in P. ramosa..........................................................................78
Fig. 4.1.4 The effect of protein concentration on the reaction rate of acetylthiocholine iodide
hydrolysis (mOD min-1) in P. ramosa......................................................................................79
Fig. 4.1.5 Linear regression for standard deviations of the reaction rate estimated for a series of
six homogenate supernatant dilutions (6.25%, 12.5%, 25%, 50%, 75% and 100%).
From left to right (three assays): individuals of P. ramosa with (A) ≤ 72 h-old, (B) 7
days-old, (C) 14 days-old and (D) 21 days-old.....................................................................82
Capítulo 4.2. Acute effects of the anatoxin-a(s) extract and paraoxon-methyl on
freshwater cladocerans from tropical and temperate regions: links between the ChE
activity and survival and its implications for tropical ecotoxicological
studies..........................................................................................................................................................88
Fig. 4.2.1 Chemical structure of the molecules (A) anatoxin-a(s) and (B) paraoxon-methyl.........93

vii
Fig. 4.2.2 Cholinesterase (ChE) activity in juveniles of P. ramosa and D. magna exposed to various
concentrations of anatoxin-a(s) extract and paraoxon-methyl for 48-h
exposure...................................................................................................................................101
Fig. 4.2.3 Percentages of cholinesterase (ChE) activity and survival in Pseudosida ramosa (A and C)
and Daphnia magna (B and D) when exposed to the anatoxin-a(s) extract and paraoxon-
methyl for 48-h.......................................................................................................................102
Fig. 4.2.4 Relationship between the percentage of inhibition of cholinesterase (ChE) activity and
percentage of survival in Pseudosida ramosa (A and C) and Daphnia magna (B and D)
when exposed for 48-h to the anatoxin-a(s) extract (A and B) and paraoxon-methyl (C
and D)......................................................................................................................................104
Capítulo 4.3. Is the use of native species a better choice to assess the anatoxin-a(s) in
tropical species? The specificity of ChE activity of two cladoceran species to detect the
presence and sub-lethal effects of anatoxin-a(s) extracts through different levels of
biological organization.........................................................................................................................116
Fig. 4.3.1 Experimental design of the test performed to measure the ChE activity, life history
parameters and population growth rate in both P. ramosa and D. magna, when they were
exposed to the anatoxin-a(s) extract....................................................................................125
Fig. 4.3.2 Cholinesterase (ChE) activity in juveniles of (A) P. ramosa and (B) D. magna, after 48-h
exposure to various concentrations of microcystin extract.............................................130
Fig. 4.3.3 Cholinesterase (ChE) activity of (A) P. ramosa and (B) D. magna after 2 and 7 days of
exposure to the sub-lethal concentrations of anatoxin-a(s) extract and after the first
week (14 days) and the second week of recovery in clean medium (21 days)..............132
Fig. 4.3.4 Life history parameters measured in P. ramosa and D. magna after 2 and 7 days of
exposure to the sub-lethal concentrations of anatoxin-a(s) extract and after the first
week (14 days) and the second week of recovery in clean medium (21 days)..............135

viii
Fig. 4.3.5 Relationships between the (A) 48-h ChE (cholinesterase) inhibition and 21-day
reproduction and between the (B) 48-h ChE inhibition and 21-day population growth
rate, in both P. ramosa and D. magna, after 7 days of exposure to the sub-lethal
concentrations of anatoxin-a(s) extract and after two weeks of recovery in clean
medium....................................................................................................................................137
Capítulo 4.4. Can mixtures of cyanotoxins represent a risk to the zooplankton? The case
study of Daphnia magna Straus exposed to the hepatotoxic and neurotoxic
cyanobacterial extracts..........................................................................................................................151
Fig. 4.4.1 Schematic experimental designs for the binary mixtures used for (A) acute toxicity test
– full factorial design and (B) feeding inhibition and post-exposure test – ray
design........................................................................................................................................158
Fig. 4.4.2 D. magna feeding rates for 24-h exposure and 4-h post-exposure periods in the feeding
inhibition tests at various nominal concentrations of (A) hepatotoxic and (B)
neurotoxic cyanobacterial extracts.......................................................................................164
Fig. 4.4.3 Relationship between LCx (or ECx) values from real data and LCx (or ECx) values
calculated from the modelled data and obtained from the Independent Action model
and deviations from it in the exposure of Daphnia magna to the mixtures of hepatotoxic
and neurotoxic extracts: (A) mortality, (B) 24-h feeding rate (exposure period) and (C)
4-h feeding rate (post-exposure period)..............................................................................167

ix
LISTA DE TABELAS
1. Introdução e justificativa......................................................................................................................1
Tabela 1.1 Descrição dos três principais grupos de cianotoxinas em relação aos diferentes
gêneros que as produzem, aos seus modos de ação e às estruturas-alvo primárias nos
mamíferos em que elas atuam................................................................................................4
Tabela 1.2 Alguns dos principais biomarcadores utilizados para avaliar os danos nas funções
biológicas dos organismos quando expostos a diferentes classes de compostos
químicos..................................................................................................................................21
Tabela 1.3 Biomarcadores utilizados para a avaliação dos efeitos de diferentes tipos de
cianotoxinas em espécies pertencentes a vários grupos taxonômicos...........................29
3. Metodologia geral................................................................................................................................56
Tabela 3.1 Preparo da água reconstituída dos tipos mole, moderadamente dura e dura...............58
Tabela 3.2 Volumes adicionados de alimento complementar aos cultivos de Pseudosida ramosa e
Daphnia magna.........................................................................................................................61
Tabela 3.3 Quantidades das substâncias químicas utilizadas para o preparo da solução-estoque
do meio de cultivo CHU-12.................................................................................................62
Tabela 3.4 Quantidades das substâncias químicas utilizadas para o preparo das soluções-estoque
do meio de cultivo ASM-1...................................................................................................64
4. Resultados e discussão.......................................................................................................................68
Capítulo 4.1. Measurements of cholinesterase activity in the tropical freshwater
cladoceran Pseudosida ramosa and its standardization as a biomarker.................................68

x
Table 4.1.1 Effect of the number of organisms and homogenate dilutions on the reaction rate of
acetylthiocholine iodide hydrolysis and cholinesterases (ChE) activity in the P. ramosa
assays.......................................................................................................................................81
Capítulo 4.2. Acute effects of the anatoxin-a(s) extract and paraoxon-methyl on
freshwater cladocerans from tropical and temperate regions: links between the ChE
activity and survival and its implications for tropical ecotoxicological studies.....................88
Table 4.2.1 Values of nominal and actual concentrations and percentage of variation between
nominal and actual concentrations for the lowest and highest tested concentrations
of paraoxon-methyl (µg L-1) at the end of both acute toxicity tests and ChE assays
performed with P. ramosa and D. magna.............................................................................97
Table 4.2.2 Median lethal (48-h LC50) and median ChE inhibition (48-h IC50) concentrations and
ratios between the 48-h IC50 and 48-h LC50 for both P. ramosa and D. magna exposed
to the anatoxin-a(s) extract and paraoxon-methyl...........................................................98
Table 4.2.3 Values of toxicity endpoints obtained after 48-h exposure to three acute toxicity
tests with anatoxin-a(s) extract for both P. ramosa and D. magna...................................99
Table 4.2.4 Values of toxicity endpoints obtained after 48-h exposure to three acute toxicity
tests with paraoxon-methyl for both P. ramosa and D. magna........................................99
Capítulo 4.3. Is the use of native species a better choice to assess the anatoxin-a(s) in
tropical species? The specificity of ChE activity of two cladoceran species to detect the
presence and sub-lethal effects of anatoxin-a(s) extracts through different levels of
biological organization.........................................................................................................................116
Table 4.3.1 Values of toxicity endpoints obtained after 48-h exposure to three acute toxicity
tests with microcystin extract for both P. ramosa and D. magna...................................129
Table 4.3.2 Mean values of 21-day population growth rates of P. ramosa and D. magna after 7
days of exposure to the sub-lethal concentrations of anatoxin-a(s) extract and after
two weeks of recovery in clean medium.........................................................................136

xi
Table 4.3.3 Statistical results and equations for the linear regression analysis between the 48-h
ChE inhibition vs. 21-day reproduction (R) and between the 48-h ChE inhibition vs.
21-day population growth rate (PGR), for both P. ramosa and D. magna, after 7 days
of exposure to the two sub-lethal concentrations of anatoxin-a(s) extract and after
two weeks of recovery in clean medium.........................................................................137
Capítulo 4.4. Can mixtures of cyanotoxins represent a risk to the zooplankton? The case
study of Daphnia magna Straus exposed to the hepatotoxic and neurotoxic
cyanobacterial extracts..........................................................................................................................151
Table 4.4.1 Interpretation of additional parameters (“a” and “b”) that define the functional form
of the pattern of deviations from Independent action (IA).........................................160
Table 4.4.2 Values of 48-h LC50 for acute tests and 24-h EC50 (exposure period) and 4-h EC50
(post-exposure period) for feeding inhibition tests and their respective slope values
obtained for D. magna in the assessment of each cyanobaterial extract in both single
and mixture toxicity tests...................................................................................................162
Table 4.4.3 Summary of the analysis for the acute test (48-h) and feeding inhibition test (24-h
exposure and 4-h post-exposure periods) for Daphnia magna exposed to the mixtures
of hepatotoxic (HE) and neurotoxic (NE) cyanobacterial extracts............................165

xii
APRESENTAÇÃO DA TESE
A presente tese foi construída de forma a facilitar a publicação dos resultados obtidos e,
em relação ao seu formato, nós gostaríamos de fazer algumas considerações.
A divisão da tese foi feita da seguinte forma: (1) Introdução e justificativa; (2) Objetivos e
hipóteses; (3) Metodologia geral; (4) Resultados e discussão (composto por quatro capítulos); (5)
Conclusões gerais; (6) Considerações finais e recomendações; e (7) Apêndice.
Inicialmente, realizou-se uma revisão da literatura com a finalidade de se ter todo o embasamento
teórico necessário para o desenvolvimento da tese. Além disso, foi também exposta uma
justificativa para a realização do trabalho. Posteriormente, os objetivos e as hipóteses levantadas
nos demais capítulos da tese foram definidos, seguidos de uma descrição geral sobre a
metodologia utilizada para testar tais hipóteses. Os resultados obtidos e a discussão foram
redigidos em capítulos no formato de artigos científicos. Cada um deles foi formatado de acordo
com as normas das revistas científicas a que serão submetidos. Como as revistas que escolhemos
para publicá-los exigem a sua redação em inglês, nossos capítulos, foram escritos nesse idioma. A
divisão neste formato se justifica, pois torna a publicação dos artigos científicos menos
trabalhosa, embora, devido à independência de um capítulo em relação aos demais, repetições se
tornam inevitáveis. Resumidamente, o primeiro capítulo apresenta os resultados da adaptação e
da otimização de um ensaio em microplacas para medir a atividade de colinesterases (ChE) do
cladócero tropical Pseudosida ramosa. O segundo e terceiro capítulos abordam a investigação do
uso de ChE da P. ramosa como um biomarcador bioquímico da neurotoxina anatoxina-a(s), nos
quais foram comparados o seu desempenho com aquele da Daphnia magna, uma espécie oriunda
de regiões temperadas utilizada internacionalmente nos ensaios ecotoxicológicos. A fim de
estabelecer a ligação entre uma resposta em nível suborganismal com parâmetros individuais e
populacionais mais relevantes ecologicamente, no segundo capítulo, a relação entre a inibição de
ChE vs. a sobrevivência foi estabelecida para o extrato de anatoxina-a(s) e para o organofosforado
paraoxon-metil, enquanto que no terceiro capítulo a especificidade do ensaio de ChE para a
anatoxina-a(s) foi avaliada por meio de um ensaio enzimático com o extrato de microcistinas e as
relações entre a inibição de ChE vs. a reprodução e a inibição de ChE vs. a taxa de crescimento
populacional foram estabelecidas para o extrato de anatoxina-a(s). No quarto e último capítulo
foram avaliados os efeitos das misturas de dois tipos de cianotoxinas (hepatotóxica e neurotóxica)
sobre a sobrevivência e a alimentação da D. magna. Com base nesses quatro capítulos, as
conclusões gerais da tese e as considerações finais e recomendações foram elaboradas. No
apêndice, um protocolo detalhado do ensaio de ChE com o cladócero P. ramosa foi proposto.

Introdução e justificativa 1
1. INTRODUÇÃO E JUSTIFICATIVA
A eutrofização vem se tornando um problema crescente para os ecossistemas aquáticos
brasileiros, assim como para muitos outros países ao redor do mundo (Azevedo et al., 2002;
Becker et al., 2010).
Inúmeros são os impactos gerados pelo enriquecimento das águas com nutrientes,
principalmente o nitrogênio e o fósforo, provenientes de esgotos urbanos e de efluentes de
atividades agro-pastoris e industriais (Osswald et al., 2007). Entre os diferentes impactos gerados,
sem dúvida, o que desperta mais atenção é o aumento da ocorrência de intensas florações de
cianobactérias. Em ambientes aquáticos não eutróficos, as cianobactérias são um componente
presente normalmente no ciclo sazonal da comunidade fitoplanctônica. No entanto, em situações
de águas ricas em nutrientes, elas podem se tornar dominantes por curtos ou longos períodos de
tempo. Em condições eutróficas, a rápida proliferação das cianobactérias em detrimento de
outros grupos fitoplanctônicos se deve à associação de dois fatores principais que são a
abundância de elementos químicos que compõem diferentes estruturas celulares (proteínas,
ácidos nucléicos, membranas fosfolipídicas) (Tundisi, 2003) e características fisiológicas que lhes
conferem uma maior vantagem competitiva sobre outras espécies de microalgas (Whitton e Potts,
2000). Além disso, um pH neutro a alcalino e temperaturas acima de 20ºC também favorecem a
ocorrência de florações de cianobactérias nos ecossistemas aquáticos (Chorus e Bartram, 1999).
Paerl e Huisman (2008) relatam que o processo de aquecimento global poderá intensificar ainda
mais a formação de florações em razão do aumento da temperatura média da água dos ambientes
aquáticos, principalmente nos países de clima temperado, o que promoverá, também, a
estratificação térmica por períodos mais longos, condições propícias para a dominância de
cianobactérias.
O crescimento massivo de cianobactérias nos ecossistemas aquáticos limita sua utilização
como áreas de recreação e de abastecimento em razão da produção de toxinas e de mudanças nas
propriedades organolépticas da água (produção de odor e gosto desagradáveis), além de gerar
impactos na saúde pública e riscos ambientais, incluindo perdas econômicas (Osswald et al.,
2007). Uma vez que o aparecimento de problemas associados com as cianobactérias tem
aumentado, um maior interesse da comunidade científica por este assunto tem sido despertado, o
que tem provocado não só um aumento do conhecimento científico sobre sua biologia, com
também tem aumentado o número de casos de toxicidade detectados e uma ampliação de sua
distribuição geográfica (Kaebernick e Neilan, 2001). No entanto, a importância e o papel
ecológico dessas toxinas continuam não sendo ainda inteiramente compreendidos (Kaebernick e
Neilan, 2001).

Introdução e justificativa 2
1.1. Cianobactérias
As cianobactérias são microrganismos procarióticos, semelhantes às bactérias, mas que
possuem pigmentos fotossintéticos (clorofila-a e b) e um pigmento acessório (ficocianina), o que
lhes confere uma coloração verde azulada (Whitton e Potts, 2000). Esses pigmentos em conjunto
absorvem a luz em um espectro mais amplo do que as plantas terrestres podem absorver,
fazendo com que as cianobactérias sejam consideradas importantes produtores primários
(Dittman e Wiegand, 2006). Em razão de sua longa história evolutiva (existem fósseis de
cianobactérias datados em 3,5 bilhões de anos) (Falconer, 2005), as cianobactérias são
consideradas os primeiros organismos responsáveis pela produção de oxigênio na Terra, sendo
capazes de colonizar praticamente todos os ecossistemas do planeta, embora sejam mais
comumente encontrados no plâncton de ambientes marinhos e de água doce (Carmichael, 1994).
Elas possuem ainda mecanismos para tolerar a incidência de raios ultravioleta, concentrações
elevadas de metais, baixas concentrações de oxigênio e temperaturas muito baixas ou muito altas
(Whitton e Potts, 2000). Além disso, algumas espécies podem fixar, em estruturas denominadas
heterocitos, o nitrogênio atmosférico na forma metabolizável de amônio; formarem acinetos, que
são células diferenciadas que funcionam como esporos de resistência; e controlarem sua posição
na coluna de água por meio de estruturas denominadas aerótopos (Whitton e Potts, 2000). Todas
estas características conferem vantagens competitivas em relação aos outros organismos
fitoplanctônicos, mesmo quando existe falta de nitrato ou amônia ou baixas intensidades
luminosas (Kaebernick e Neilan, 2001). Entretanto, o fato mais marcante em relação às
cianobactérias é a sua capacidade de produzir uma grande e diversificada quantidade de
metabólitos secundários (i.e., que não são utilizados em seu metabolismo primário), também
denominados genericamente de cianotoxinas, os quais se acredita que possam atuar como
hormônios, antibióticos, aleloquímicos, toxinas e outras funções ainda desconhecidas
(Carmichael, 1992).
Das espécies conhecidas, cerca de 40 cepas, dentre os aproximadamente 150 gêneros
descritos de cianobactérias, estão relacionados à produção de potentes toxinas (Apeldoorn et al.,
2007). Nem todas as florações de cianobactérias são tóxicas e algumas podem ser tóxicas durante
apenas um período do ano, do mês ou da semana. Para a mesma espécie existem cepas tóxicas e
não tóxicas convivendo no mesmo habitat. Desta forma, predizer a ocorrência de florações
tóxicas torna-se impossível (Molica e Azevedo, 2009; Osswald et al., 2007).
As cianobactérias têm sido correlacionadas com efeitos letais não só em organismos
aquáticos, como zooplâncton e peixes (Amado et al., 2011; Atencio et al., 2008; Chen et al., 2005;

Introdução e justificativa 3
Wiegand et al., 2002), como também em aves (Henriksen et al., 1997) e mamíferos (Jackson et al.,
1984), incluindo os seres humanos (Jochiminsen et al., 1998; Kuiper-Goodman et al., 1999a).
Desde o final do século XIX, elas são reconhecidas como potenciais agentes produtores de
toxinas (Francis, 1878 apud Fernandes, 2001). Na China, em 1996, especulou-se que um caso de
câncer tenha ocorrido devido à presença de cianobactérias na água de consumo (Ueno et al.,
1996), embora este caso não tenha sido confirmado. O primeiro relato toxicológico comprovado,
envolvendo seres humanos, e relacionado com as cianotoxinas ocorreu em 1996, na cidade de
Caruaru (Açude Tabocas), Pernambuco, Brasil, onde vários pacientes que realizavam hemodiálise
no Hospital de Caruaru foram expostos a microcistinas (cianotoxinas hepatotóxicas), levando à
morte quase 50% dos pacientes que foram submetidos à hemodiálise com água contaminada por
esta toxina (Jochiminsen et al., 1998; Pouria et al., 1998). Este primeiro relato de morte causada
por uma cianotoxina chamou a atenção do mundo para o problema da proliferação generalizada
das cianobactérias, sendo amplamente divulgado pela imprensa internacional.
Existem diferentes tipos de cianotoxinas, que diferem em sua ação tóxica bem como em
sua natureza química. De acordo com sua estrutura química, as cianotoxinas são classificadas em
três principais grupos: peptídeos cíclicos, alcalóides e lipopolissacarídeos (LPS) (Codd et al., 2005;
Wiegand e Pflugmacher, 2005). Uma visão geral das cianotoxinas identificadas, os diferentes
gêneros que as produzem, os seus diferentes modos de ação e as estruturas-alvo primárias nos
mamíferos podem ser vistas na Tabela 1.1.

Introdução e justificativa 4
Tabela 1.1. Descrição dos três principais grupos de cianotoxinas em relação aos diferentes gêneros que as produzem, aos seus modos de ação e às estruturas-alvo primárias nos mamíferos em que elas atuam; adaptado de Chrorus e Bartram (1999) e Wiegand e Pflugmacher (2005)
Grupo da cianotoxina Principais gêneros Modo de ação Estruturas-alvo Peptídeos cíclicos Microcistinas Microcystis, Anabaena, Planktothrix
(Oscillatoria), Nostoc, Hapalosiphon, Anabaenopsis
Inibição de proteínas fosfatases (PP 1 e 2A)
Fígado
Nodularinas Nodularia Inibição de proteínas fosfatases (PP 1 e 2A)
Fígado
Alcalóides Saxitoxinas Anabaena, Aphanizomenon, Lyngbya,
Cylindrospermopsis Ligação e bloqueio dos canais de sódio em células nervosas
Axônio
Anatoxina-a Anabaena, Planktothrix (Oscillatoria), Aphanizomenon
Ligação irreversível ao receptor nicotínico S da acetilcolina
Sinapses
Anatoxina-a(s) Anabaena Inibição da atividade da acetilcolinesterase
Sinapses
Cilindrospermopsinas Cylindrospermopsis, Aphanizomenon, Umezakia
Inibidor da síntese de proteínas; Danos ao DNA
Principalmente o fígado, mas também rim, baço, timo e coração
Aplisiatoxina Lyngbya, Schizothrix, Planktothrix (Oscillatoria)
Pele, trato gastrointestinal
Lingbiatoxina-a Lyngbya Pele, trato gastrointestinal Lipopolissacarídeos (LPS) Todas Irritantes em potencial;
afetam qualquer tecido exposto
1.1.1. Peptídeos cíclicos hepatotóxicos
No grupo dos peptídeos cíclicos, incluem-se as microcistinas (MCs) e as nodularinas
(NODLN) (Fig. 1.1), constituídas por sete e cinco aminoácidos, respectivamente. Ambas
possuem estruturas químicas semelhantes e modos de ação hepatotóxicos, sendo conhecidas
como hepatotoxinas (Carmichael, 1992, 1994, 1997).
As microcistinas e as nodularinas atuam nos hepatócitos, chegando até eles por meio de
receptores dos ácidos biliares (Eriksson et al., 1990; Falconer, 1991). No fígado, elas promovem a
desorganização do citoesqueleto dos hepatócitos, tendo como consequência a perda de estrutura
do órgão e o desenvolvimento de graves lesões internas. A perda de contato entre as células
promove o aparecimento de espaços internos que são preenchidos por sangue que flui dos
capilares para estes locais, provocando um quadro de hemorragia intra-hepática (Carmichael,
1994). Sabe-se também que tanto as microcistinas quanto as nodularinas são potentes inibidores
de proteínas fosfatases do tipo 1 e 2A de células eucariontes, sendo reconhecidas como
promotoras de tumores hepáticos (Falconer, 1991).
A Organização Mundial de Saúde preconiza que o valor máximo aceitável de
microcistinas totais em água de consumo humano ingerida por dia seja de 1 µg L-1 (WHO, 1998,

Introdução e justificativa 5
2004). No Brasil, este mesmo valor foi também incluído como o valor máximo aceitável de
ingestão na água de consumo humano (Ministério da Saúde, 2004, 2011).
Fig. 1.1 Estrutura química geral dos peptídeos cíclicos hepatotóxicos. (A) Microcistinas (ciclo-D-Ala1-X2-D-MeAsp3-Z4-Adda5-D-Glu6-Mdha7) e (B) Nodularinas (ciclo-D-MeAsp1-Z2-Adda3-D-Glu4-Mdhb5). Os números em sobrescrito na fórmula das cianotoxinas especificam a posição de cada aminoácido na representação gráfica das moléculas. Fonte: Chorus e Bartram (1999)
1.1.1.1. Microcistinas
A estrutura geral das microcistinas é ciclo-(D-Ala-X-D-MeAsp-Z-Adda-D-Glu-Mdha)
(Fig. 1.1 A), em que X e Z são os dois L-aminoácidos variáveis, D-MeAsp é D-eritro ácido
metilaspártico, Mdha é N-metildeidroalanina, Adda é o ácido 3-amino-9-metoxi-2,6,8-trimetil-10-
fenil-deca-4,6-dienóico, que está também presente nas nodularinas e foi identificado como um
dos responsáveis pela atividade biológica dessas hepatotoxinas (Carmichael et al., 1988; Harada et
al., 1990; Nishiwaki-Matsushima et al., 1992). A primeira nomenclatura das microcistinas foi
proposta por Carmichael et al. (1988). Nela, somente as variações entre os seus dois L-
aminoácidos foram utilizadas para diferenciar as microcistinas, distinguindo apenas três variantes
principais: microcistina-LR (leucina-arginina), microcistina-RR (arginina-arginina) e microcistina-
YA (tirosina-alanina). Entretanto, já são conhecidas mais de 70 variantes de microcistinas, sendo
que para a sua classificação, além das variações nos seus dois L-aminoácidos, passaram também a

Introdução e justificativa 6
ser utilizados as diferenças no grau de metilação dos aminoácidos e as variações isoméricas no
aminoácido Adda (Meriluoto e Codd, 2005).
As microcistinas agem de uma forma mais lenta, podendo causar morte em um intervalo
de poucas horas a poucos dias. A DL50 (dose letal que leva à mortalidade de 50% dos indivíduos)
em camundongos para a maior parte das microcistinas situa-se entre 25 e 1.000 µg kg-1 de peso
corpóreo por injeção intraperitonial (Codd et al., 2005) e entre 5.000 e 10.900 µg kg-1 de peso
corpóreo por administração oral (Chorus e Bartram, 1999).
No Brasil, a primeira detecção da presença de microcistinas foi feita por Azevedo et al.
(1994) em uma cepa de Microcystis aeruginosa. Desde então, há inúmeros casos registrados de
produção de microcistinas por diferentes espécies de cianobactérias (Bittencourt-Oliveira et al.,
2005; Domingos et al., 1999; Sant’Anna et al., 2008; Vieira et al., 2003).
1.1.1.2. Nodularinas
As nodularinas foram pela primeira vez identificadas na espécie Nodularia spumigena
(Sivonen et al., 1989). Hoje se reconhecem sete variantes de nodularinas distintas, incluindo as
motuporinas produzidas por cianobactérias simbiontes de esponjas do mar (Apeldoorn et al.,
2007).
A estrutura geral das nodularinas é o ciclo-(D-MeAsp-L-Arg-Adda-D-glutamato-Mdhb) (Fig.
1.1 B) e, ao contrário das microcistinas, elas agem de uma forma um pouco mais rápida. A DL50
em camundongos situa-se entre 50 e 200 µg kg-1 de peso corpóreo por injeção intraperitonial
(Rinehart et al., 1994). Até a presente data, nenhuma detecção de nodularina foi feita em
ecossistemas aquáticos brasileiros.
1.1.2. Alcalóides
No grupo dos alcalóides, incluem-se compostos heterocíclicos nitrogenados (com pelo
menos uma estrutura em anel), sendo classificados de acordo com o seu modo de ação em três
grupos: alcalóides neurotóxicos, citotóxicos e dermatotóxicos (Fig. 1.2).
No grupo dos alcalóides neurotóxicos, pode-se encontrar as saxitoxinas, a anatoxina-a e
seu homólogo homoanatoxina-a e a anatoxina-a(s). Essas toxinas agem em vertebrados através de
diferentes mecanismos fisiológicos, contudo, todas elas levam à morte por parada respiratória,
que geralmente é bastante rápida (minutos a poucas horas) (Chorus e Bartram, 1999). Dentre as
neurotoxinas, a anatoxina-a(s) é a que possui o menor número de registros de ocorrência. No

Introdução e justificativa 7
entanto, por ela apresentar um elevado risco à saúde humana e de outros organismos aquáticos e
terrestres, esta cianotoxina tem despertado o interesse para pesquisas (Molica e Azevedo, 2009).
No grupo dos alcalóides citotóxicos encontra-se a cilindrospermopsina, detectada
inicialmente na espécie Cylindrospermopsis raciborskii (Hawkins et al., 1985). Na sua forma pura, ela
afeta principalmente o fígado, provocando também necrose nas células renais, glândulas adrenais,
pulmões, coração, medula e timo (Hawkins et al., 1985, 1997). Também há registros de que ela
inibe a síntese de glutationa e a síntese protéica em geral (Runnegar et al., 1994).
No grupo dos alcalóides dermatotóxicos estão incluídos a aplisiatoxina e a lingbiatoxina-a,
que provocam casos de dermatite de contato em banhistas de águas costeiras (Codd et al., 1999).
Fig. 1.2 Estrutura química de alcalóides. (1) Neurotoxinas: (A) Saxitoxinas, (B) Anatoxina-a, (C) Homoanatoxina-a e (D) Anatoxina-a(s); (2) Citotoxinas: (E) Cilindrospermopsina e (3) Dermatotoxinas: (F) Aplisiatoxina e (G) Lingbiatoxina-a. Fonte: Chorus e Bartram (1999)
1.1.2.1. Saxitoxinas
Saxitoxinas é o nome adotado para um grupo de neurotoxinas conhecidas como toxinas
paralisantes de mariscos (ou “paralytic shellfish toxins” – PST) que foram primeiramente isoladas de
dinoflagelados marinhos, responsáveis pela ocorrência de marés vermelhas (Anderson, 1994). Estas
neurotoxinas são um grupo de alcalóides carbamatos que, dependendo do tipo de radical que

Introdução e justificativa 8
possuem (R1, R2, R3, R4 ou R5, Fig. 1.2 A) são classificadas como não sulfatados (saxitoxina e
neosaxitoxina), com um único grupamento sulfato (G-toxinas) ou com dois grupamentos sulfatos
(C-toxinas). Além dessas, estruturas com grupamentos decarbamoil (dcSTX ou dcGTX) e novas
toxinas relacionadas têm sido recentemente isoladas (Chorus e Bartram, 1999). A toxicidade
desse grupo de alcalóides varia bastante, sendo a saxitoxina a mais potente. A DL50 em
camundongos para saxitoxina purificada é de 10-30 µg kg-1 de peso corpóreo por injeção
intraperitonial (Codd et al., 2005), enquanto que por consumo oral, a DL50 é de aproximadamente
263 µg kg-1 de peso corpóreo (Chorus e Bartram, 1999). Essas neurotoxinas inibem a condução
nervosa por bloqueio dos canais de sódio e cálcio, afetando a permeabilidade ao potássio e
impedindo a posterior estimulação das células musculares (Carmichael, 1994). Aproximadamente,
2.000 casos de intoxicação humana são registrados anualmente (15% de mortalidade) em razão
do consumo de peixes ou mariscos que se alimentaram de dinoflagelados marinhos produtores
de saxitoxinas (Hallegraeff, 2003). Os sinais clínicos de intoxicação humana por saxitoxinas
incluem tontura, adormecimento da boca e de extremidades, fraqueza muscular, náusea, vômito,
sede e taquicardia, sendo que tais sintomas podem começar 5 minutos após a ingestão e a morte
pode ocorrer entre 2 a 12 horas (Carmichael, 1994).
Fitzgerald et al. (1999) propuseram um valor de 3 µg L-1 como um limite máximo aceitável
de saxitoxinas em água para consumo humano. Este limite foi incorporado como recomendação
na Portaria 1.469 (Ministério da Saúde, 2000) e referendado pelo mesmo órgão por meio da
Portaria no. 2.914 (Ministério da Saúde, 2011) que trata do controle e vigilância da qualidade da
água para consumo humano e seu padrão de potabilidade. No Brasil, a análise desse grupo de
neurotoxinas, em amostras de água para consumo humano, tornou-se de extrema importância,
visto que tem sido observado em vários mananciais de abastecimento, desde a região nordeste até
a região sul do país, um grande aumento da ocorrência de cepas de cianobactérias produtoras
deste grupo de neurotoxinas (Lagos et al., 1999; Molica et al., 2002). Sant’Anna et al. (2008)
relataram a produção de saxitoxinas por cepas de Planktolyngbya cf. reilingii e Raphidiopsis brookii
isoladas de ecossistemas aquáticos brasileiros e por Anabaena circinalis e Aphanizomenon issatschenkoi,
a partir de amostras de florações dominadas por essas espécies.
1.1.2.2. Anatoxina-a e seu homólogo Homoanatoxina-a
A anatoxina-a (2-acetil-9-azabiciclo[4.2.1]non-2-eno) é um alcalóide que possui uma
amina secundária bicíclica (Fig. 1.2 B), com massa molecular de 165 u.m.a. (Koskinen e
Rapoport, 1985) e age como um potente bloqueador neuromuscular pós-sináptico de receptores

Introdução e justificativa 9
nicotínicos e colinérgicos. Esta ação se dá porque a anatoxina-a liga-se irreversivelmente aos
receptores de acetilcolina, não sendo degradada pela acetilcolinesterase. Isso provoca a contínua
contração das células musculares, levando à fadiga e paralisia muscular (Skulberg et al., 1992). A
DL50 em camundongos para a toxina purificada é de 200 µg kg-1 de peso corpóreo por injeção
intraperitonial, com um tempo de sobrevivência de 1 a 20 minutos (Carmichael, 1992).
O análogo metilênico da anatoxina-a, a homoanatoxina-a, foi isolado pela primeira vez de
uma cultura de Planktothrix (Oscillatoria) formosa NIVA-CYA 92, sendo que o seu mecanismo de
toxicidade é semelhante ao da anatoxina-a, ou seja, age como um potente agente bloqueador
neuromuscular (Skulberg et al., 1992). Outro estudo demonstrou que a homoanatoxina-a produz
um aumento da liberação de acetilcolina nas terminações dos nervos colinérgicos periféricos por
meio da abertura de canais de Ca2+ (Aas et al., 1996). Este análogo da anatoxina-a difere por ter
uma unidade de metileno adicional (Fig. 1.2 C) (Osswald et al., 2007).
As espécies dos gêneros Aphanizomenon (Rapala et al., 1993; Wood et al., 2007), Arthrospira
(Ballot et al., 2004), Cylindrospermum (Sivonen et al., 1989), Oscillatoria (Edwards et al., 1992),
Phormidium (Gugger et al., 2005), Planktothrix (Viaggiu et al., 2004), Anabaena (Chorus e Bartram,
1999) e Raphidiopsis (Namikoshi et al., 2003) foram relatadas como produtoras de anatoxina-a. No
entanto, no Brasil, ainda não há nenhum registro da existência desta neurotoxina em águas
superficiais. Os sinais de envenenamento por esta toxina, em animais selvagens e domésticos,
incluem desequilíbrio, fasciculação muscular, respiração ofegante e convulsões. A morte é devida
à parada respiratória (Carmichael, 1994).
1.1.2.3. Anatoxina-a(s)
A anatoxina-a(s) também é uma cianotoxina pertencente ao grupo de alcalóides
neurotóxicos. Ela é um éster metílico da N-hidroxiguanidina fosfato, de massa molecular 252
u.m.a., e caracteriza-se por ser quimicamente diferente das outras anatoxinas já mencionadas (Fig.
1.2 D). O “s” do nome da anatoxina-a(s) deriva da excessiva salivação viscosa observada em
camundongos tratados com esta cianotoxina (James et al., 1998) e, por essa razão, a letra “s” de
salivação foi adicionada ao nome do composto.
Este composto age como um inseticida organofosforado sintético, sendo considerado o
único organofosforado conhecido de ocorrência natural (James et al., 1998). O seu mecanismo de
ação é a inibição da ação da enzima acetilcolinesterase, impedindo a degradação da acetilcolina
ligada aos receptores (Mahmood e Carmichael, 1986). Por consequência, há uma excessiva
estimulação colinérgica e abertura dos canais iônicos, provocando a exaustão do músculo. Um

Introdução e justificativa 10
fato muito importante do ponto de vista clínico é que a inibição da acetilcolinesterase produzida
pela anatoxina-a(s) não pode ser revertida por oximas (Hyde e Carmichael, 1991). A DL50 em
camundongos para a anatoxina-a(s) purificada é de 20 µg kg-1 de peso corpóreo por injeção
intraperitonial, sendo dez vezes mais potente que a anatoxina-a. A fasciculação muscular pós-
morte é um sintoma bem característico (Carmichael et al., 1990).
Cook et al. (1988) fizeram uma comparação da capacidade de inibição da
acetilcolinesterase entre a anatoxina-a(s) e inseticidas sintéticos inibidores reversíveis (carbamatos)
e irreversíveis (organofosforados). Os resultados obtidos sugeriram uma capacidade inibitória da
acetilcolinesterase pela anatoxina-a(s) comparável com o paraoxon (inseticida organofosforado).
Além disso, esta neurotoxina apresenta pouca tendência à bioacumulação e baixa permanência
em células adiposas e membranas celulares, sendo muito mais solúvel em água do que os
organofosforados sintéticos.
Devido à baixa ocorrência deste tipo de neurotoxina em todo o mundo e a dificuldade
para a sua quantificação, ainda não foi estabelecido um limite máximo aceitável para o consumo
oral humano (Carmichael, 1994). No Brasil, a presença desta toxina por meio de testes de
inibição de acetilcolinesterase já foi confirmada em florações de Anabaena spiroides no Rio Grande
do Sul (Monserrat et al., 2001) e em Pernambuco (Molica et al., 2005) e, por isso, recentemente,
foi incluída por meio da Portaria no. 2.914 (Ministério da Saúde, 2011) a recomendação de que a
análise da presença desta cianotoxina seja feita, quando a presença de gêneros de cianobactérias
potencialmente produtores de anatoxina-a(s) for detectada.
1.1.2.4. Cilindrospermopsinas
São conhecidos dois análogos das cilindrospermopsinas, a deoxi-cilindrospermopsina
identificada em C. raciborskii (Norris et al., 1999) e a 7-epicilindrospermopsina produzida por
Aphanizomenon ovalisporum (Banker et al., 1997).
O modo de ação das cilindrospermopsinas (Fig. 1.2 E) se dá pela inibição da síntese
protéica (Froscio et al., 2001). Além disso, foi observado que elas podem também causar danos
genéticos (Falconer e Humpage, 2001; Humpage et al., 2000; Shen et al., 2002).
As cilindrospermopsinas são toxinas de ação muito lenta, produzindo seu efeito tóxico
em 5 a 7 dias. A DL50 em camundongos após 24 horas de exposição é de 2.000 µg kg-1 de peso
corpóreo por injeção intraperitonial e passa a ser de 200 µg kg-1 de peso corpóreo após 5 dias de
exposição (Harada et al., 1994). Shaw et al. (2000) sugeriram um limite máximo aceitável de 15 µg
L-1 de cilindrospermopsinas para águas destinadas ao consumo humano. No entanto, Humpage e
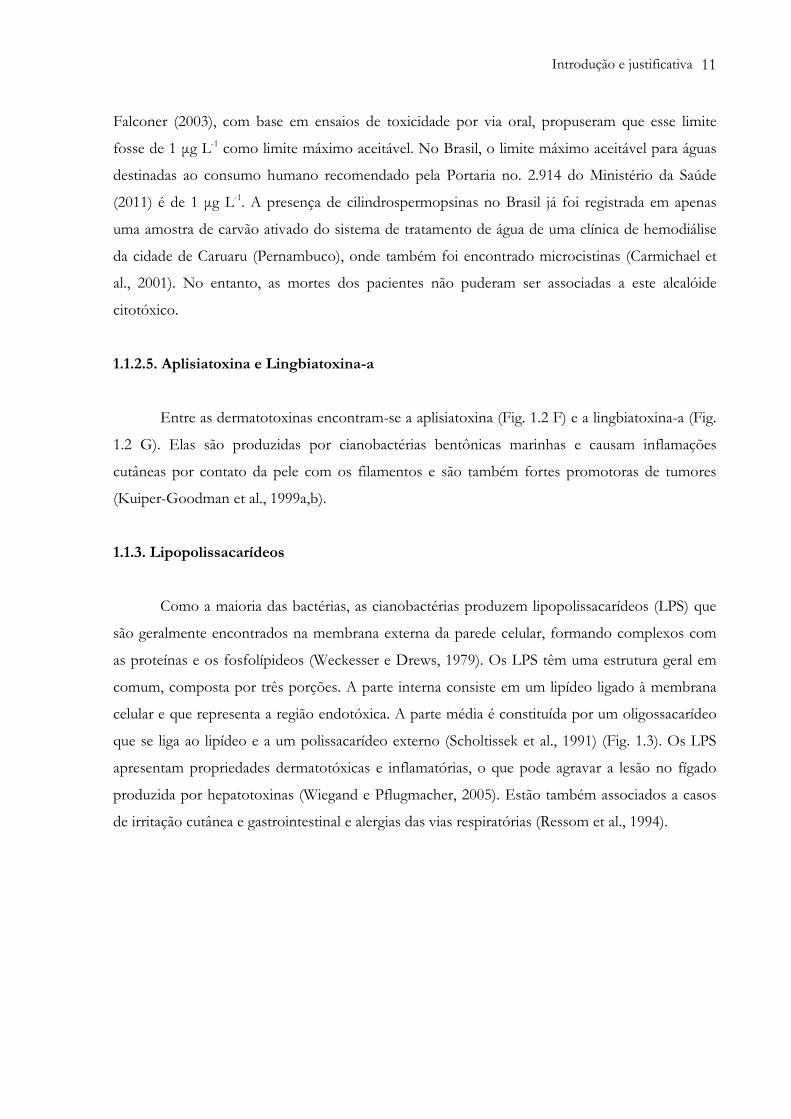
Introdução e justificativa 11
Falconer (2003), com base em ensaios de toxicidade por via oral, propuseram que esse limite
fosse de 1 µg L-1 como limite máximo aceitável. No Brasil, o limite máximo aceitável para águas
destinadas ao consumo humano recomendado pela Portaria no. 2.914 do Ministério da Saúde
(2011) é de 1 µg L-1. A presença de cilindrospermopsinas no Brasil já foi registrada em apenas
uma amostra de carvão ativado do sistema de tratamento de água de uma clínica de hemodiálise
da cidade de Caruaru (Pernambuco), onde também foi encontrado microcistinas (Carmichael et
al., 2001). No entanto, as mortes dos pacientes não puderam ser associadas a este alcalóide
citotóxico.
1.1.2.5. Aplisiatoxina e Lingbiatoxina-a
Entre as dermatotoxinas encontram-se a aplisiatoxina (Fig. 1.2 F) e a lingbiatoxina-a (Fig.
1.2 G). Elas são produzidas por cianobactérias bentônicas marinhas e causam inflamações
cutâneas por contato da pele com os filamentos e são também fortes promotoras de tumores
(Kuiper-Goodman et al., 1999a,b).
1.1.3. Lipopolissacarídeos
Como a maioria das bactérias, as cianobactérias produzem lipopolissacarídeos (LPS) que
são geralmente encontrados na membrana externa da parede celular, formando complexos com
as proteínas e os fosfolípideos (Weckesser e Drews, 1979). Os LPS têm uma estrutura geral em
comum, composta por três porções. A parte interna consiste em um lipídeo ligado à membrana
celular e que representa a região endotóxica. A parte média é constituída por um oligossacarídeo
que se liga ao lipídeo e a um polissacarídeo externo (Scholtissek et al., 1991) (Fig. 1.3). Os LPS
apresentam propriedades dermatotóxicas e inflamatórias, o que pode agravar a lesão no fígado
produzida por hepatotoxinas (Wiegand e Pflugmacher, 2005). Estão também associados a casos
de irritação cutânea e gastrointestinal e alergias das vias respiratórias (Ressom et al., 1994).

Introdução e justificativa 12
Fig. 1.3 Estrutura química geral dos lipopolissacarídeos (LPS). Fonte: Wiegand e Pflugmacher (2005)
1.1.4. Outros compostos bioativos
As cianobactérias, além das cianotoxinas já citadas, produzem compostos de constituição
química muito diversa, alguns dos quais apresentam propriedades antibióticas, antivirais,
antifúngicas e antialgais. Por isso, são de grande interesse para a aplicação farmacológica, em
medicina, na agricultura e na investigação científica (Borowitzka, 1995; Carmichael, 1992, 1997;
Patterson et al., 1994).
As cianobactérias também são responsáveis por produzirem compostos cuja atividade e
composição química são ainda parcial ou totalmente desconhecidas (Chorus e Bartram, 1999).
Esses compostos também incluem substâncias que podem ser tóxicas para as comunidades
aquáticas. Por exemplo, as frações lipossolúveis das cepas não tóxicas de Microcystis aeruginosa e de
Aphanizomenon flos-aquae inibiram o crescimento da alga Chlorella sp (Ikawa et al., 1994, 1996). Em
outro caso, uma cepa de Oscillatoria agardhii, não tóxica para camundongos, revelou-se tóxica para
os crustáceos Daphnia pulex e Artemia salina (Reinikainen et al., 1995).
1.2. Efeitos das cianobactérias sobre o zooplâncton
Diversos trabalhos sobre as interações entre as cianobactérias e o zooplâncton, sejam
estudos in situ ou em laboratório, têm demonstrado que as cianobactérias, em grande parte,

Introdução e justificativa 13
interferem negativamente com o zooplâncton, sendo que essa interação negativa ocorre tanto
pelo fato das cianobactérias não constituírem um bom alimento quanto pelo fato delas
produzirem um amplo espectro de toxinas (De Bernardi e Giussani, 1990; Hanazato, 1995;
Haney, 1987).
A morfologia das células e a sua digestibilidade constituem em fatores determinantes para
a baixa qualidade das cianobactérias como alimento para a comunidade zooplanctônica (Holm e
Shapiro, 1984; Porter e Orcutt, 1980). As células filamentosas e as colônias são de difícil ingestão,
além do que algumas cianobactérias produzem ainda camadas gelatinosas que as protegem e
impedem a digestão eficiente das células ao longo do tubo digestório das espécies
zooplanctônicas (Kobayashi, 1992). De Bernardi e Giussani (1990) observaram que a taxa de
assimilação de cladóceros do gênero Daphnia foi muito baixa quando alimentados com
cianobactérias. Além disso, o zooplâncton tem sido considerado um dos principais alvos das
toxinas produzidas pelas cianobactérias, uma vez que se acredita que tais metabólitos secundários
são produzidos com a finalidade de defesa contra a herbivoria (Lampert, 1981). Ferrão-Filho et al.
(2008) mostraram que a saxitoxina, uma toxina neurotóxica produzida por C. raciborskii, causou efeitos
paralisantes nos movimentos natatórios de cladóceros, o que poderia explicar um possível papel anti-
herbivoria dessas toxinas. A forma de exposição do zooplâncton às toxinas pode ser por meio da dieta
(ingestão das células) ou por contato direto com a água quando ocorre lise celular (principalmente
na fase de senescência da floração de cianobactérias), podendo seus efeitos negativos ser
altamente variáveis entre os gêneros, as espécies e até mesmo entre os clones (DeMott et al.,
1991; Gilbert, 1990; Hietala et al., 1997). Em grande parte, a exposição às toxinas dissolvidas e às
células intactas ocorre simultaneamente, adicionando-se os efeitos do baixo valor nutricional à
toxicidade das cianotoxinas (DeMott et al., 1991).
Uma possível consequência danosa para o ecossistema como um todo da interação
negativa entre as cianobactérias e os organismos zooplanctônicos é um desequilíbrio nas cadeias
alimentares entre os produtores e os predadores. Além disso, também se pode observar uma
mudança na composição das espécies zooplanctônicas quando as cianobactérias tornam-se
dominantes nos ecossistemas aquáticos. O que normalmente se observa é uma pressão seletiva
que favorece as espécies de menores dimensões em detrimento das espécies de maior tamanho
(De Bernardi e Giussani, 1990; Hietala et al., 1997).
Os cladóceros, componentes da comunidade zooplanctônica, são considerados excelentes
indicadores da presença de cianotoxinas nos ecossistemas de água doce por muitos autores, uma
vez que tais toxinas possuem efeitos agudos e crônicos específicos sobre estes organismos
(DeMott et al., 1991; Ferrão-Filho et al., 2000, 2008; Sotero-Barbosa et al., 2006).

Introdução e justificativa 14
1.3. Cladóceros
Os cladóceros, comumente referidos como pulgas d’água, têm grande representatividade
nos corpos de água lênticos de todo o mundo e também do Brasil. Estimativas conservadoras
apontam cerca de 620 espécies ocorrendo em todo o mundo (Forró et al., 2008) e, estima-se em
cerca de 150, o número de espécies com ocorrência no Brasil (Rocha e Güntzel, 2000).
Devido ao fato dos cladóceros converterem o fitoplâncton, as bactérias e outras partículas
em suspensão em proteína animal, eles são considerados espécies importantes ecologicamente
(Rand, 1995), sendo um dos principais componentes da interação fitoplâncton-zooplâncton-
larvas de peixe. Eles consomem o fitoplâncton e são, por sua vez, fortemente predados pelas
larvas de peixes (Dettmers e Stein, 1992). Basicamente, a alimentação dos cladóceros é feita por
meio de correntes de água, a partir da qual as pequenas partículas são filtradas (Green, 1961).
Morfologicamente, os cladóceros caracterizam-se por apresentar segmentação reduzida
do corpo, tórax e abdômen fundidos em um tronco, onde estão inseridos quatro a seis pares de
apêndices na porção anterior, os quais funcionam individualmente como brânquias e estruturas
filtradoras de alimento. Apresentam carapaça única, dobrada na porção ventral, dando a
impressão de uma estrutura bivalve, a qual encerra todo o tronco, mas usualmente não a parte
cefálica. A maioria das espécies de Cladocera tem tamanho entre 0,5 e 3,0 mm de comprimento,
sendo de hábito rastejador ou bentônico, movendo-se entre os detritos na região litorânea de
lagos e de reservatórios, mas existem também famílias predominantemente de hábito planctônico
(Brooks, 1959). Os machos diferem das fêmeas principalmente pelo menor tamanho corporal,
antênulas maiores e pela modificação do pós-abdômen e do primeiro par de patas em um gancho
copulatório utilizado para segurar a fêmea durante a cópula. A abertura genital do macho localiza-
se próxima à unha do pós-abdômen (Brooks, 1959).
A anatomia interna dos cladóceros é relativamente simples. O sistema digestório é um
tubo simples e o sistema circulatório é formado por um único coração bulboso. A excreção é
feita por glândulas maxilares e o sistema nervoso apresenta sinais de redução em comparação
com outros crustáceos. O sistema reprodutivo consiste de um par de gônadas e, nas fêmeas, os
ovidutos abrem-se ao longo da superfície dorsal do tronco posterior (Schram, 1986).
O ciclo de vida dos Cladocera abrange tanto a reprodução assexuada, por partenogênese,
quanto a reprodução sexuada (Brooks, 1959), sendo esta estratégia reprodutiva conhecida como
partenogênese cíclica. A reprodução partenogenética é a predominante, ocorrendo geralmente em
períodos onde as condições ambientais são favoráveis. As gônadas estendem-se em ambos os
lados da porção mediana do intestino. Nas fêmeas, os ovários produzem mitoticamente ovos
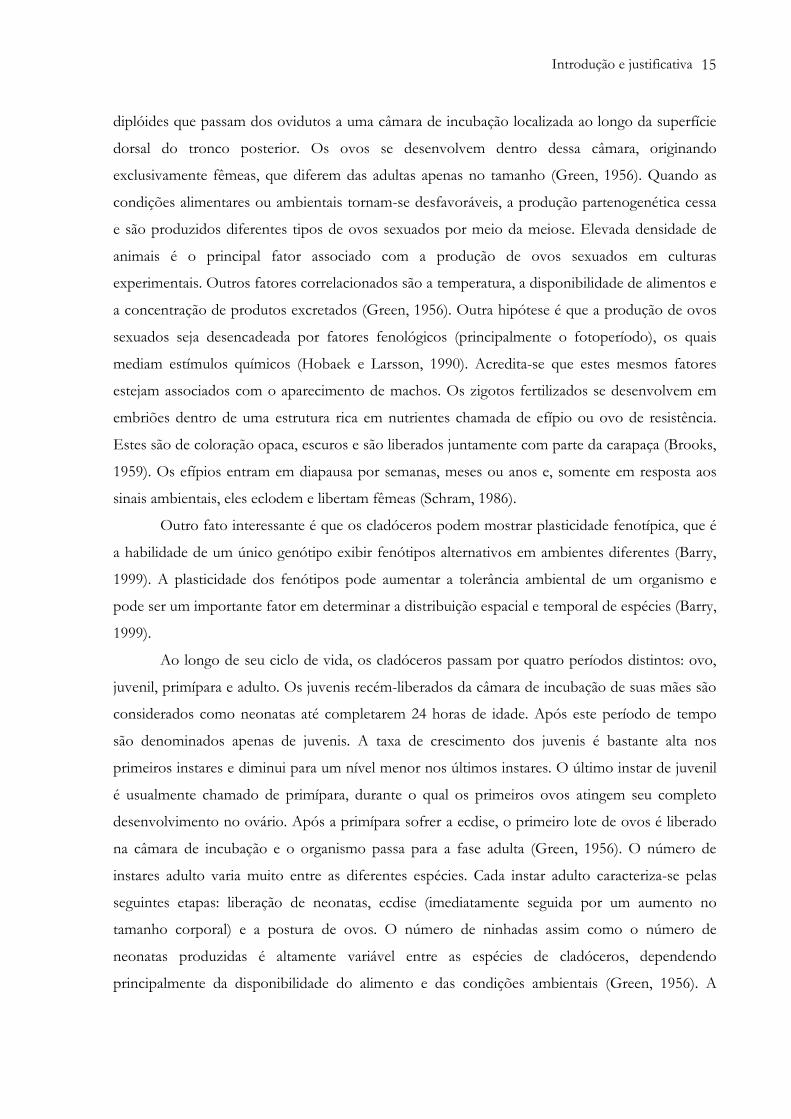
Introdução e justificativa 15
diplóides que passam dos ovidutos a uma câmara de incubação localizada ao longo da superfície
dorsal do tronco posterior. Os ovos se desenvolvem dentro dessa câmara, originando
exclusivamente fêmeas, que diferem das adultas apenas no tamanho (Green, 1956). Quando as
condições alimentares ou ambientais tornam-se desfavoráveis, a produção partenogenética cessa
e são produzidos diferentes tipos de ovos sexuados por meio da meiose. Elevada densidade de
animais é o principal fator associado com a produção de ovos sexuados em culturas
experimentais. Outros fatores correlacionados são a temperatura, a disponibilidade de alimentos e
a concentração de produtos excretados (Green, 1956). Outra hipótese é que a produção de ovos
sexuados seja desencadeada por fatores fenológicos (principalmente o fotoperíodo), os quais
mediam estímulos químicos (Hobaek e Larsson, 1990). Acredita-se que estes mesmos fatores
estejam associados com o aparecimento de machos. Os zigotos fertilizados se desenvolvem em
embriões dentro de uma estrutura rica em nutrientes chamada de efípio ou ovo de resistência.
Estes são de coloração opaca, escuros e são liberados juntamente com parte da carapaça (Brooks,
1959). Os efípios entram em diapausa por semanas, meses ou anos e, somente em resposta aos
sinais ambientais, eles eclodem e libertam fêmeas (Schram, 1986).
Outro fato interessante é que os cladóceros podem mostrar plasticidade fenotípica, que é
a habilidade de um único genótipo exibir fenótipos alternativos em ambientes diferentes (Barry,
1999). A plasticidade dos fenótipos pode aumentar a tolerância ambiental de um organismo e
pode ser um importante fator em determinar a distribuição espacial e temporal de espécies (Barry,
1999).
Ao longo de seu ciclo de vida, os cladóceros passam por quatro períodos distintos: ovo,
juvenil, primípara e adulto. Os juvenis recém-liberados da câmara de incubação de suas mães são
considerados como neonatas até completarem 24 horas de idade. Após este período de tempo
são denominados apenas de juvenis. A taxa de crescimento dos juvenis é bastante alta nos
primeiros instares e diminui para um nível menor nos últimos instares. O último instar de juvenil
é usualmente chamado de primípara, durante o qual os primeiros ovos atingem seu completo
desenvolvimento no ovário. Após a primípara sofrer a ecdise, o primeiro lote de ovos é liberado
na câmara de incubação e o organismo passa para a fase adulta (Green, 1956). O número de
instares adulto varia muito entre as diferentes espécies. Cada instar adulto caracteriza-se pelas
seguintes etapas: liberação de neonatas, ecdise (imediatamente seguida por um aumento no
tamanho corporal) e a postura de ovos. O número de ninhadas assim como o número de
neonatas produzidas é altamente variável entre as espécies de cladóceros, dependendo
principalmente da disponibilidade do alimento e das condições ambientais (Green, 1956). A

Introdução e justificativa 16
sobrevivência dos cladóceros varia com a temperatura e geralmente aumenta com a diminuição
da temperatura, devido a menor atividade metabólica (Rand, 1995).
Os Cladocera são atualmente subdivididos em quatro ordens. As ordens Ctenopoda e
Anomopoda são representadas por oito famílias (Sididae, Holopedidae, Moinidae, Daphnidae,
Bosminidae, Macrothricidae, Ilyocryptidae e Chydoridae), as quais reúnem grande parte das
espécies (Rocha et al., 2011). Dentre estas, as famílias Sididae e Daphnidae são amplamente
distribuídas mundialmente. No entanto, enquanto que os dafinídeos são grandemente
distribuídos em regiões temperadas, os sidídeos são representados por muitas espécies nas regiões
tropicais e subtropicais (Korovchinsky, 2006).
1.3.1. Os cladóceros na Ecotoxicologia
Entre os invertebrados de água doce utilizados como organismos-teste, os cladóceros são
os mais amplamente utilizados em avaliações ecotoxicológicas (Calow, 1993; Walker et al., 2001).
Para tais avaliações com cladóceros existem protocolos nacionais e internacionais padronizados e
que são utilizados para a determinação rotineira da toxicidade de químicos e poluentes (ABNT,
2009, 2010; ISO, 1982; OECD, 2004, 2008; U.S. EPA, 1984, 2002). O uso de cladóceros em
testes ecotoxicológicos tem inúmeras vantagens, incluindo entre elas a sua ampla distribuição em
ambientes de água doce; a sua grande relevância ecológica nas cadeias alimentares, atuando como
consumidores primários; a sua alta sensibilidade a uma ampla gama de químicos tóxicos; o seu
fácil manuseio e cultivo em laboratório, além de seu pequeno tamanho que requer pequenos
volumes de água e espaço; um ciclo de vida relativamente curto, com a possibilidade de se obter
clones a partir da reprodução partenogenética; e sua alta fecundidade. Todas essas características
fazem deles organismos-teste adequados para os ensaios ecotoxicológicos (Adema, 1978; Dodson
et al., 1995; Koivisto, 1995; Persoone e Janssen, 1993; Trayler e Davis, 1996).
O cladócero mais comumente utilizado em ecotoxicologia aquática é indubitavelmente a
Daphnia magna (Baillieul e Blust, 1999; Biesinger e Christensen, 1972; Lilius et al., 1995; Winner e
Farrell, 1976). Ela tem sido utilizada como organismo-teste por pelo menos quatro décadas
(Adema, 1978; Biesinger e Christensen, 1972), sendo que o seu diferencial em relação aos demais
cladóceros são suas neonatas grandes e de fácil observação nas soluções de ensaio (Rand, 1995).
No entanto, a distribuição geográfica natural da D. magna é restrita a áreas de altas e médias
latitudes setentrionais (Mitchell et al., 2004), caracterizadas por habitats com água
moderadamente dura a dura (um mínimo de 150 mg CaCO3 L-1). Este fato restringe o uso deste
cladócero como um organismo-teste em regiões tropicais, uma vez que tais regiões apresentam

Introdução e justificativa 17
um predomínio de habitats de água mole e soluções com águas desta dureza podem afetar tanto a
sua resistência às substâncias testadas bem como levá-las à morte devido ao estresse osmótico
(Lilius et al., 1995; Rand, 1995; U.S. EPA, 2002). Além disso, para as regiões tropicais, a espécie
D. magna é um organismo exótico e sempre há o risco de vir a se tornar uma espécie invasora.
Desta forma, o uso de espécies oriundas de regiões temperadas como um organismo-teste em
ensaios a serem realizados em regiões tropicais tem sido questionado (Do Hong et al., 2004;
Freitas e Rocha, 2011a, 2011c, 2012a).
Em contrapartida, o que se observa é que a maioria das pesquisas ecotoxicológicas em
países tropicais é conduzida com espécies pertencentes às regiões temperadas (Espíndola et al.,
2000; Okumura et al., 2007; Rodgher e Espíndola, 2008; Sotero-Barbosa et al., 2007; Takenaka et
al., 2007), sendo um paradoxo que relativamente pouca pesquisa seja conduzida com espécies
autóctones (Do Hong et al., 2004; Freitas e Rocha, 2011a, 2011b, 2011c, 2012a; Okumura et al.,
2007; Takenaka et al., 2006, 2007). Entretanto, recentemente no Brasil, esforços têm sido feitos
no sentido de criar protocolos padronizados para espécies nativas, objetivando o seu uso em
ensaios ecotoxicológicos (Freitas, 2009; Massaro, 2011; Okumura, 2011; Ribeiro, 2011). Para a
espécie Ceriodaphnia silvestrii já existe um protocolo padronizado pela Associação Brasileira de
Normas Técnicas para a realização de ensaios crônicos (ABNT, 2010).
Entre as espécies nativas que estão sendo cogitadas como um organismo-teste para o
Brasil, pode-se citar a espécie Pseudosida ramosa, um cladócero pertencente à família Sididae. O uso
de representantes dessa família em estudos ecotoxicológicos é justificável, uma vez que
Korovchinsky (2006) apontou que, enquanto os dafinídeos são amplamente distribuídos em
regiões temperadas, os sidídeos nas regiões tropicais são representados por muitas espécies de
diferentes gêneros, tais como Latonopsis, Diaphanosoma, Sarsilatona, e também o gênero Pseudosida.
De acordo com a literatura, P. ramosa tem uma ampla distribuição em regiões tropicais e
subtropicais. Existem registros de sua ocorrência na Tailândia (Maiphae et al., 2005; Sanoamuang,
1998), México (Elías-Gutiérrez et al., 2001), Venezuela (Roa e Vasquez, 1991), Paraguai (Rey e
Vasquez, 1986), Cuba, Guatemala (Korovchinsky, 1992) e Argentina (Morrone e Coscarón,
1998). No Brasil, ela tem sido registrada em várias localidades, desde o norte até o sul do país
(Brandorff et al., 1982; Elmoor-Loureiro, 2007; Freitas e Rocha, 2006; Lansac-Tôha et al., 2009;
Neves et al., 2003; Rocha e Güntzel, 1999). Embora protocolos padronizados para testar a
toxicidade de químicos e poluentes ambientais com a espécie P. ramosa ainda não tenham sido
estabelecidos, esta espécie tem certas características que a tornam um excelente organismo-teste.
Por exemplo, a P. ramosa é de fácil cultivo em laboratório uma vez que é bastante resistente ao
manuseio e manipulação e possui os seguintes parâmetros do ciclo de vida que se assemelham

Introdução e justificativa 18
àqueles da D. magna: um tamanho relativamente grande (2,36 mm de comprimento médio), um
tempo curto de desenvolvimento (tempo de geração de 8 dias) e uma fecundidade total média de
38,8 ovos por fêmea, quando cutivada na temperatura de 25ºC (Freitas e Rocha, 2006). Além
disso, informações detalhadas sobre a sua biologia, incluindo a duração do desenvolvimento
embrionário e pós-embrionário, e as melhores condições para cultivá-la em laboratório já foram
descritas (Freitas e Rocha, 2006). O cladócero P. ramosa também tem sido considerado um bom
substituto para D. magna em testes ecotoxicológicos padronizados (i.e., testes de toxicidade aguda
e crônica) (Freitas e Rocha, 2011a, 2011b, 2011c, 2012a, 2012b).
Os testes ecotoxicológicos clássicos feitos com cladóceros são os testes de toxicidade
aguda e crônica (Sherratt et al., 1999; Whitehouse et al., 1996). Os primeiros têm como parâmetro
de avaliação a mortalidade, uma duração de 24 a 48 horas e são geralmente realizados em
condições estáticas (OECD, 2004). Já os testes de toxicidade crônica avaliam, entre outros
parâmetros, os efeitos em longo prazo dos tóxicos sobre o comprimento corpóreo, a idade para a
primeira reprodução, a reprodução, a sobrevivência, etc. Eles podem durar de uma a várias
semanas, dependendo da espécie, e são geralmente realizados em condições semi-estáticas
(OECD, 2008).
Em adição aos testes ecotoxicológicos clássicos, alguns estudos com cladóceros têm sido
realizados com a finalidade de descobrir diferentes formas de avaliar os riscos ecológicos
impostos por uma ampla gama de substâncias químicas, sejam elas de origem natural ou de
origem antropogênica. Por exemplo, Guilhermino et al. (1999) propuseram uma alternativa ao
convencional teste de reprodução de 21 dias com a D. magna. De acordo com estes autores, as
medidas dos parâmetros reprodução e crescimento até a postura da primeira ninhada já seriam
suficientes para prever a toxicidade de algumas substâncias químicas. Mudanças nas taxas
alimentares dos cladóceros após um determinado período de exposição aos tóxicos também têm
sido propostas por diferentes autores (Allen et al., 1995; McWilliam e Baird, 2002). Ferrão-Filho
et al. (2008) propuseram que as medições dos movimentos natatórios de algumas espécies de
cladóceros expostos a uma saxitoxina pudessem ser utilizadas como uma forma de quantificar os
efeitos de exposição esta cianotoxina. Outros estudos avaliaram os efeitos dos tóxicos sobre as
populações por meio da determinação das taxas de crescimento populacional, as quais podem ser
estimadas utilizando-se medidas convencionais de testes de reprodução combinados com
informações adicionais referentes à produção da primeira ninhada, à distribuição das ninhadas
durante o tempo de ensaio e às taxas de sobrevivência materna (Sibly, 1996).
Algumas abordagens em estudos ecotoxicológicos com cladóceros envolvem
investigações moleculares e bioquímicas (Atienzar et al., 1999; Besten e Tuk, 2000; Day e Scott,

Introdução e justificativa 19
1990; Sturm e Hansen, 1999), além da avaliação dos efeitos combinados de misturas de tóxicos
sobre estes organismos (Jonker et al., 2004, 2005).
A identificação de biomarcadores moleculares e bioquímicos em cladóceros tem revelado
que estes são uma ferramenta bastante adequada para avaliar os efeitos de substâncias tóxicas nos
ambientes. Atienzar et al. (1999) desenvolveram um método de perfis de DNA para avaliar os
efeitos que os tóxicos induzem no material genético de populações laboratoriais de D. magna. As
medições qualitativas da estabilidade do genoma foram comparáveis aos índices tradicionais de
“fitness” ou “saúde” (i.e., sobrevivência, fecundidade). Em outro estudo, as alterações em nível
do RNA mensageiro foram medidas em Daphnia pulex expostas ao arsênio e os resultados foram
comparados com os efeitos demográficos, sendo que as respostas moleculares foram mais
sensíveis do que as respostas demográficas (Chen et al., 1999). A aplicação do teste cometa
também já foi utilizado para avaliar danos ao DNA da D. magna (Besten e Tuk, 2000). Em relação
aos biomarcadores bioquímicos, os mais utilizados nas avaliações ecotoxicológicas com
cladóceros são: (1) acetilcolinesterase (AChE) (Barata et al., 2001; Day e Scott, 1990; Diamantino
et al., 2000; Guilhermino et al., 1996a; Jemec et al., 2008; Printes e Callaghan, 2004) e
colinesterases em geral (ChE) (Damásio et al., 2007); (2) catalase (CAT) (Barata et al., 2005;
Jemec et al., 2007, 2008; Kim et al., 2010); (3) lactato desidrogenase (LDH) (Diamantino et al.,
2001); (4) monooxigenases como citocromo P450-dependente (Sturm e Hansen, 1999); (5)
superóxido dismutase (SOD) (Barata et al. 2005; Kim et al., 2010); (6) glutationa peroxidase
(GPx) (Barata et al., 2005; Kim et al., 2010); (7) glutationa S-transferase (GST) (Barata et al.,
2005; Damásio et al., 2007; Jemec et al., 2008; Kim et al., 2010); (8) peroxidação lipidíca (LPO)
(Barata et al., 2005) e (9) enzimas digestivas, tais como celulase, amilase, β-galactosidase e tripsina
(De Coen e Janssen, 1997). Embora os cladóceros tenham sido estudados ao longo de muitos
anos, o conhecimento sobre as rotas metabólicas neste grupo em particular de crustáceos é ainda
muito limitado (Barata et al., 2001).
As avaliações dos efeitos combinados de misturas de químicos têm sido propostas por
Cassee et al. (1998) e Jonker et al. (2004, 2005). Uma vez que as substâncias químicas se
apresentam na forma de misturas complexas na natureza, as avaliações de risco em ambientes
naturais se tornam mais difíceis. Isso porque podem ocorrer interações sinergísticas e
antagonísticas entre os diferentes químicos ou mesmo padrões de efeitos mais complexos, tais
como respostas dependentes do nível da dose ou da proporção da dose. Loureiro et al. (2010),
para misturas dos inseticidas imidacloprid e thiacloprid, observaram desvios para o sinergismo
nas exposições agudas (imobilização) e antagonismo nas exposições subletais (taxas de
alimentação) ao utilizar a D. magna como organismo-teste. Os mesmos autores observaram

Introdução e justificativa 20
padrões diferentes de interação quando as misturas do metal níquel e do inseticida chlorpyrifos
foram avaliadas. Para a exposição aguda, um desvio para o sinergismo foi observado, enquanto
que para as taxas de alimentação um desvio de proporção da dose foi obtido. Fatores ambientais
também podem interagir com compostos químicos. Ribeiro et al. (2011) observaram um desvio
de proporção da dose para as taxas de alimentação e a reprodução de D. magna quando ela foi
submetida a exposições combinadas de radiação ultra-violeta (UV) e do fungicida carbendazim.
Na alimentação, um desvio para o antagonismo foi observado quando a radiação UV foi um fator
dominante na combinação e, na reprodução, ocorreu um desvio para o sinergismo quando a
radiação UV foi dominante na combinação. Desta forma, os estudos sobre os efeitos conjuntos
das substâncias químicas são muito importantes, uma vez que eles nos revelam como as misturas
complexas de diferentes químicos atuam sobre a biota aquática.
1.4. Biomarcadores
Nas últimas décadas, têm-se realizado várias pesquisas no sentido de desenvolver e validar
o uso de biomarcadores em estudos que avaliam os impactos que químicos e/ou poluentes
podem produzir no meio ambiente (McCarthy e Shugart, 1990; Peakall, 1992; Peakall e Shugart,
1993; Printes et al., 2008; Walker, 1992).
Um biomarcador pode ser definido como uma resposta biológica a um tóxico (ou
tóxicos) que proporciona uma medida da exposição e também, algumas vezes, do efeito tóxico
(Peakall, 1994). De acordo com esta definição, uma resposta biológica pode representar
diferentes níveis de organização biológica, isto é, pode variar desde o nível molecular até a função
e a estrutura do ecossistema (Peakall, 1994; Walker, 1995a). Walker et al. (2001), entretanto,
propuseram uma limitação do conceito de biomarcador para as respostas biológicas observadas
até o nível de organismo, nas quais tais respostas representariam um desvio do funcionamento
normal mantido por mecanismos homeostáticos. Na prática, o termo biomarcador realmente tem
sido utilizado em um sentido mais restrito, como respostas em nível molecular, bioquímico,
citológico, fisiológico, histológico e morfológico, produzidas em consequência da exposição a
diferentes tóxicos (Lagadic et al., 1994; McCarthy e Shugart, 1990; Van Gestel e Van Brummelen,
1996), enquanto que as respostas relacionadas com os níveis de população, de comunidade e de
ecossistema são usualmente denominadas de indicadores biológicos ou bioindicadores ecológicos
(Lagadic et al., 1994; Van Gestel e Van Brummelen, 1996; Walker et al., 2001).
Os biomarcadores variam desde aqueles que são altamente específicos na sua resposta
(inibição da rota heme do ácido aminolevulínico desidrogenase dada pelo chumbo) até aqueles

Introdução e justificativa 21
que não são específicos (proteínas do estresse que indicam o estresse experimentado pelas
células) (Hyne e Maher, 2003; Walker et al., 2001). Na Tabela 1.2 são apresentados alguns
exemplos de biomarcadores utilizados para avaliar os danos nas funções biológicas dos
organismos quando expostos a diferentes classes de compostos químicos.
Tabela 1.2. Alguns dos principais biomarcadores utilizados para avaliar os danos nas funções biológicas dos organismos quando expostos a diferentes classes de compostos químicos; adaptado de Benson e Di Giulio (1992), Hyne e Maher (2003), McCarthy e Shugart (1990) e Peakall (1992)
Biomarcador Uso Oxidases de função mista Indicadores de exposição a químicos orgânicos, tais como
hidrocarbonetos poliaromáticos (PAHs) e policlorobifenóis (PCBs)
Glutationa S-transferase Indicador de exposição a pesticidas e metalóides Glutationa Indicador de estresse oxidativo Celulase/Carbohidrase Indicador de exposição a pesticidas Acetilcolinesterase/Colinesterases em geral Indicadores de exposição a pesticidas organofosforados e
carbamatos; substâncias inibidoras colinérgicas em geral Carboxilesterase Indicador de exposição a piretroide e pesticidas carbamatos Ruptura das hélices do DNA, formação de adutos, troca de cromátides
Indicadores de exposição a agentes de alquilação ou de arilação
Ácido aminolevulínico desidrogenase Indicador de exposição a chumbo Metalotioneínas Indicadores de exposição a metais Retinóides Indicadores de exposição à dioxina e furanos Porfirinas Indicadores de exposição a hidrocarbonetos aromáticos
clorados Mudança na energia do adenilato e proporção ATP/ADP Indicadores de exposição ao estresse Proteínas de estresse Indicadores de estresse experimentado pelas células
Os biomarcadores utilizados em estudos ecotoxicológicos podem ser classificados em três
classes de acordo com Depledge et al. (1993), Timbrell et al. (1996) e Walker et al. (2001):
1) Biomarcadores de exposição: são aqueles que indicam que um organismo foi exposto a
um tóxico, ou grupo de tóxicos, mas não dão informações do grau de efeito adverso que estas
mudanças causam nos organismos. Eles podem ser úteis no monitoramento ou varredura dos
efeitos tóxicos. Um exemplo de um biomarcador específico de exposição é a indução das
metalotioneínas por metais;
2) Biomarcadores de efeito: são aqueles que demonstram o efeito adverso de um tóxico
em particular, ou grupo de tóxicos, nos organismos. A inibição da acetilcolinesterase pelos
pesticidas organofosforados e carbamatos é considerada como um importante biomarcador
bioquímico específico de efeito, uma vez que o grau de inibição desta enzima pode ser
relacionado aos efeitos tóxicos;
3) Biomarcadores de susceptibilidade: são aqueles relacionados à variabilidade genética do
metabolismo quando os organismos são expostos aos tóxicos, ocorrendo o aparecimento da
resistência em alguns indivíduos.

Introdução e justificativa 22
De acordo com Peakall (1992), essa divisão em biomarcadores de exposição e de efeito é
artificial, uma vez que qualquer alteração de uma função biológica desencadeada por tóxicos é
uma indicação de exposição e, se uma mudança ocorreu, já é indicativo de um efeito. Peakall
(1999) também questiona o uso do termo biomarcador de susceptibilidade, dado que uma
susceptibilidade não pode ser considerada um efeito. Tal autor sugeriu que esse termo deveria ser
eliminado. Apesar das desvantagens em dividir os biomarcadores em diferentes classes, esta
divisão facilita a discussão sobre eles (Depledge e Fossi, 1994).
A resposta de um organismo a um determinado tóxico é considerada como uma resposta
desencadeada por uma condição de estresse. Por definição, estresse é um estado produzido por
um fator ambiental, ou outros fatores, que prolonga as respostas adaptativas de um organismo
para além do seu funcionamento normal, de tal forma que as chances de sobrevivência e/ou de
reprodução são significantemente diminuídas (De Coen et al., 2000). De acordo com Depledge et
al. (1993), a resposta dos organismos a uma condição de estresse passa por fases distintas
relacionadas com o grau do distúrbio na função biológica normal e o comprometimento do
estado de saúde do organismo (Fig. 1.4). O organismo saudável utiliza mecanismos
homeostáticos para manter suas funções biológicas em um estado de equilíbrio e dentro de uma
faixa ótima de funcionamento. Entretanto, em uma condição de estresse (e.g., uma exposição a
um tóxico), o organismo passa por uma perturbação inicial que gera respostas suborganismais, as
quais tentam fazer com que ele volte para um estado de equilíbrio (fase de compensação). Com o
aumento do distúrbio, desvios a partir da condição saudável são observados e respostas
compensatórias são desencadeadas. Na fase de não compensação, a sobrevivência e a capacidade
reprodutiva do organismo são afetadas, sendo que o organismo pode ter também a sua
capacidade para suportar um estresse adicional diminuída. Quando o distúrbio persiste, reparos
adicionais e/ou compensação são impossíveis e o organismo morre (fase de não compensação
incurável). No entanto, apenas se as condições melhorarem o suficiente e rapidamente e os
processos de reparo forem capazes de restaurar os mecanismos compensatórios, um organismo
doente pode ter ainda uma chance de recuperação e retornar para a fase saudável (fase de não
compensação curável).

Introdução e justificativa 23
Fig. 1.4 Relações entre um distúrbio induzido por estresse e um subsequente dano a saúde. Fonte: adaptado de De Coen et al. (2000) e Depledge (1989)
Apesar do conceito acima citado ter sido principalmente formulado para indicadores
fisiológicos de um organismo, ele pode ser perfeitamente expandido para cada nível de
organização biológica. Na Fig. 1.5, os efeitos resultantes do aumento do distúrbio induzido por
condições de estresse são ilustrados para os diferentes níveis de organização biológica. Nesta
abordagem do continuum biológico reconhece-se que o distúrbio interfere em nível bioquímico e,
por último, desencadeia efeitos em nível de organismo (De Coen et al., 2000). O organismo
integra as respostas bioquímicas mais importantes, as quais eventualmente se manifestam no
crescimento, na reprodução e na sobrevivência (i.e., os principais determinantes de mudanças
populacionais). Com o aumento dos níveis de organização biológica, os efeitos do distúrbio são
traduzidos em parâmetros que não existem para um nível de organização inferior. Para o nível de
ecossistema, por exemplo, ajustes compensatórios podem ocorrer, os quais permitem que a sua
estrutura e a sua função não sejam afetadas. Esta “resistência do ecossistema” pode levar a
situações onde algumas espécies sejam perdidas devido ao distúrbio, mas logo são substituídas
por outras espécies que possuem as mesmas funções. Entretanto, quando alguma espécie-chave é
perdida ou afetada, o ponto de resistência pode ser excedido e isso leva a danos no
funcionamento do ecossistema. Neste contexto do continuum biológico, o uso de biomarcadores
nas avaliações ambientais oferece algumas vantagens quando comparado aos testes
ecotoxicológicos convencionais. De forma geral, os biomarcadores medem as respostas
biológicas iniciais induzidas pela interação entre o químico e o receptor-alvo biológico. É por
meio desta interação que uma cascata de eventos pode ter início, ou seja, uma resposta começa

Introdução e justificativa 24
em nível molecular e repercute para efeitos adversos em níveis mais elevados de organização
biológica (De Coen et al., 2000). Desta forma, o uso de biomarcadores possibilita determinar
onde o organismo está situado no continuum biológico e indicar desvios precoces do
funcionamento normal quando os organismos passam por algum distúrbio induzido por uma
condição de estresse (De Coen et al., 2000; Depledge et al., 1993).
Fig. 1.5 Os impactos do aumento do distúrbio induzido por uma condição de estresse sobre os diferentes níveis de organização biológica. Fonte: De Coen et al. (2000)
1.4.1. Biomarcadores em estudos de Avaliação de Risco Ecológico
A Avaliação de Risco Ecológico difere das demais abordagens de avaliação ambiental por
assumir pressupostos, ter parâmetros bem claros, calcular as chances probabilísticas dos riscos e
dar ênfase para os resultados de toxicidade quantitativos (Suter, 1995). A Avaliação de Risco
Ecológico baseia-se em comparações entre os resultados de toxicidade laboratoriais e as
observações em campo e uma distinção é feita entre o perigo (o potencial para causar dano) e o
risco (a probabilidade que o dano ocorra) (Walker, 1995a). Ela pode ter tanto uma abordagem
preditiva, em que os riscos de ações futuras são estimados, como uma abordagem em
retrospectiva, na qual os riscos de ações humanas que foram iniciadas no passado e que podem
ainda ter consequências em curso são estimados (Suter, 1995). Diversas agências governamentais
de diferentes países utilizam os estudos de avaliação de risco para obter informações acuradas da
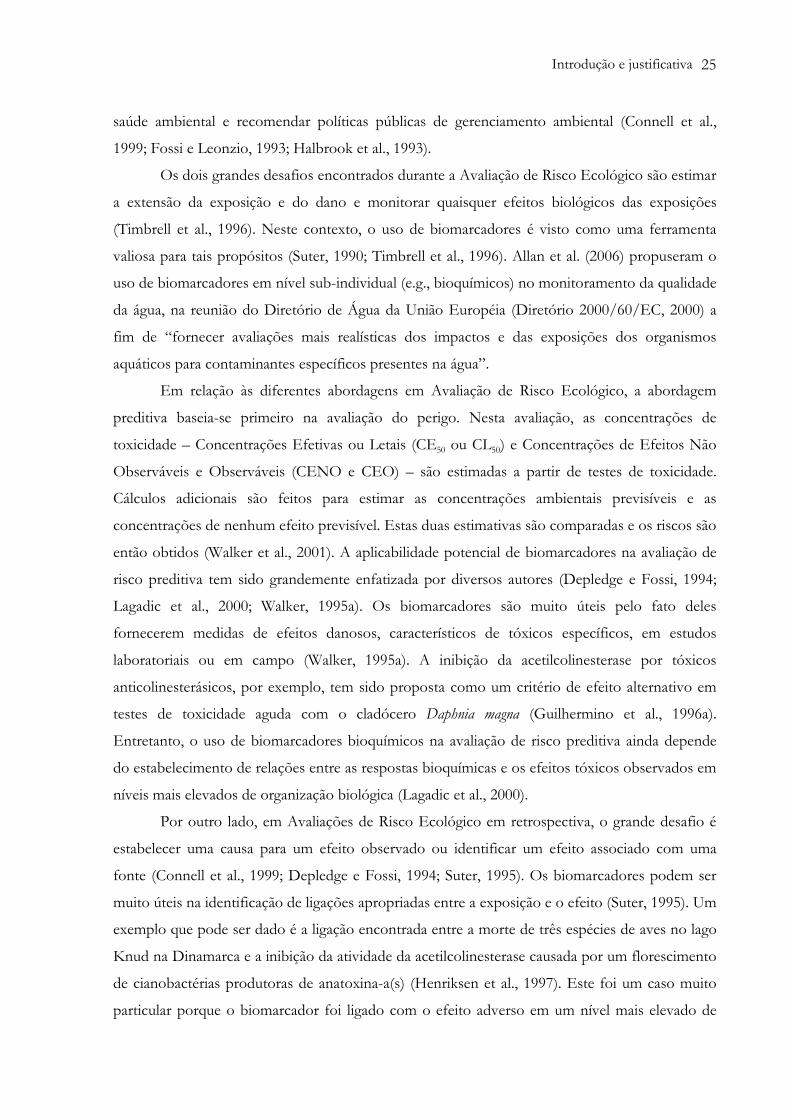
Introdução e justificativa 25
saúde ambiental e recomendar políticas públicas de gerenciamento ambiental (Connell et al.,
1999; Fossi e Leonzio, 1993; Halbrook et al., 1993).
Os dois grandes desafios encontrados durante a Avaliação de Risco Ecológico são estimar
a extensão da exposição e do dano e monitorar quaisquer efeitos biológicos das exposições
(Timbrell et al., 1996). Neste contexto, o uso de biomarcadores é visto como uma ferramenta
valiosa para tais propósitos (Suter, 1990; Timbrell et al., 1996). Allan et al. (2006) propuseram o
uso de biomarcadores em nível sub-individual (e.g., bioquímicos) no monitoramento da qualidade
da água, na reunião do Diretório de Água da União Européia (Diretório 2000/60/EC, 2000) a
fim de “fornecer avaliações mais realísticas dos impactos e das exposições dos organismos
aquáticos para contaminantes específicos presentes na água”.
Em relação às diferentes abordagens em Avaliação de Risco Ecológico, a abordagem
preditiva baseia-se primeiro na avaliação do perigo. Nesta avaliação, as concentrações de
toxicidade – Concentrações Efetivas ou Letais (CE50 ou CL50) e Concentrações de Efeitos Não
Observáveis e Observáveis (CENO e CEO) – são estimadas a partir de testes de toxicidade.
Cálculos adicionais são feitos para estimar as concentrações ambientais previsíveis e as
concentrações de nenhum efeito previsível. Estas duas estimativas são comparadas e os riscos são
então obtidos (Walker et al., 2001). A aplicabilidade potencial de biomarcadores na avaliação de
risco preditiva tem sido grandemente enfatizada por diversos autores (Depledge e Fossi, 1994;
Lagadic et al., 2000; Walker, 1995a). Os biomarcadores são muito úteis pelo fato deles
fornecerem medidas de efeitos danosos, característicos de tóxicos específicos, em estudos
laboratoriais ou em campo (Walker, 1995a). A inibição da acetilcolinesterase por tóxicos
anticolinesterásicos, por exemplo, tem sido proposta como um critério de efeito alternativo em
testes de toxicidade aguda com o cladócero Daphnia magna (Guilhermino et al., 1996a).
Entretanto, o uso de biomarcadores bioquímicos na avaliação de risco preditiva ainda depende
do estabelecimento de relações entre as respostas bioquímicas e os efeitos tóxicos observados em
níveis mais elevados de organização biológica (Lagadic et al., 2000).
Por outro lado, em Avaliações de Risco Ecológico em retrospectiva, o grande desafio é
estabelecer uma causa para um efeito observado ou identificar um efeito associado com uma
fonte (Connell et al., 1999; Depledge e Fossi, 1994; Suter, 1995). Os biomarcadores podem ser
muito úteis na identificação de ligações apropriadas entre a exposição e o efeito (Suter, 1995). Um
exemplo que pode ser dado é a ligação encontrada entre a morte de três espécies de aves no lago
Knud na Dinamarca e a inibição da atividade da acetilcolinesterase causada por um florescimento
de cianobactérias produtoras de anatoxina-a(s) (Henriksen et al., 1997). Este foi um caso muito
particular porque o biomarcador foi ligado com o efeito adverso em um nível mais elevado de

Introdução e justificativa 26
organização biológica. Os biomarcadores aplicados na avaliação em retrospectiva podem,
portanto, ter utilidade na avaliação da eficácia de padrões estabelecidos previamente para a
liberação de tóxicos no ambiente, bem como para a tomada de ações de bioremediação. Os
biomarcadores podem também fornecer medidas de potenciação de toxicidade de misturas
químicas (Walker, 1995a).
Alguns desafios e obstáculos, contudo, são enfrentados quando os biomarcadores são
utilizados em programas de Avaliação de Risco Ecológico (Hyne e Maher, 2003; Peakall, 1992).
São eles: (1) o biomarcador deve medir uma resposta que seja representativa de um importante
processo biológico; (2) o modo de ação da maioria dos tóxicos deve ser conhecido; (3) os
biomarcadores devem responder de uma maneira dose-dependente ao tóxico para que relações
quantitativas sejam estabelecidas; (4) as respostas devido à exposição tóxica devem ser
distinguidas de fontes naturais de variabilidade, tais como fatores abióticos, gênero (sexo),
estágios do desenvolvimento ontogenético e dieta (composição e quantidade); (5) o biomarcador
deve ser sensível e ser aplicável em escalas de tempo e de espaço; e (6) as respostas dos
biomarcadores devem ser casualmente relacionadas aos efeitos em níveis mais elevados de
organização, tais como populacionais e ecológicos.
Portanto, para que seja possível o uso de biomarcadores em avaliações de risco, é
essencial que seja estabelecida uma ligação entre a sua resposta e os efeitos que podem ser
observados nos níveis mais elevados de organização biológica (Depledge e Fossi, 1994; Lagadic et
al., 1994; Peakall, 1992; Walker, 1995b). Desta forma, esforços têm sido feitos no sentido de
correlacionar a resposta de um biomarcador com os efeitos adversos para os indivíduos ou para
as populações.
As ligações entre os diferentes níveis de organização biológica que são estudadas em
Ecotoxicologia estão ilustradas na Fig. 1.6. Três considerações podem ser feitas com base nesta
figura. Primeiro, torna-se cada vez mais difícil relacionar os efeitos com as causas conforme
aumenta a complexidade de organização biológica. Segundo, a escala de tempo aumenta,
mudando de segundos ou minutos para anos ou mesmo décadas e, por último, a importância
aumenta, uma vez que uma maior preocupação é dada para a manutenção da função do
ecossistema do que para as mudanças moleculares (Peakall, 1994).

Introdução e justificativa 27
Fig. 1.6 Ligação entre as respostas bioquímicas, individuais, populacionais, das comunidades e dos ecossistemas e os efeitos e sua importância na escala de tempo. Fonte: adaptado de Peakall (1994)
As ligações entre as respostas dos biomarcadores e os efeitos em níveis mais elevados de
organização biológica, principalmente relacionados à comunidade e ao ecossistema, são difíceis
de serem avaliadas devido à existência de um longo período latente entre a exposição e a
expressão dos efeitos adversos. Entretanto, a ligação entre as respostas dos biomarcadores e os
efeitos observados em nível populacional é possível de ser feita e pode ser estabelecida a partir de
um conhecimento completo da história de vida de um organismo e dos efeitos tóxicos de
químicos sobre os parâmetros do ciclo de vida. Modelos de dinâmica populacional auxiliam na
tradução dos efeitos a partir do nível individual para o nível populacional (Calow, 1994; Sibly,
1996), uma vez que a sobrevivência e a reprodução dos indivíduos são consideradas os
parâmetros mais relevantes para predizer os efeitos em nível populacional (Van Gestel e Van
Brummelen, 1996).
1.4.2. Biomarcadores para as cianotoxinas
Os biomarcadores mais utilizados em estudos de toxicidade com as cianotoxinas para os
diferentes grupos taxonômicos são de acordo com Wiegand e Pflugmacher (2005):
1) Microcistinas e nodularinas: proteínas fosfatases PP1 e PP2A, lactato desidrogenase
(LDH), superóxido dismutase (SOD), ATP-sintase (específica para microcistina-LR), glutationa
(GSH) e gluationa S-transferase (GST);

Introdução e justificativa 28
2) Saxitoxinas: bloqueio dos canais de sódio nos axônios e GST;
3) Anatoxina-a e Homoanatoxina-a: competição com a acetilcolina pelos receptores
nicotínicos s, peroxidases, monoxigenases como a citocromo P450 e GST;
4) Anatoxina-a(s): acetilcolinesterases e colinesterases em geral, citocromo P450 e GST;
5) Cilindrospermopsina: inibição da síntese de proteínas, danos ao DNA e citocromo
P450;
6) Lipopolissacarídeos (LPS): mediadores inflamatórios (fatores de necrose tumoral –
TNF), interleucinas, tromboxano A2 e prostaglandina I2), GST e ativação da rota de desacilação
lisossomal.
Na Tabela 1.3 é apresentada uma revisão sucinta de alguns trabalhos recentes que
utilizaram biomarcadores para a avaliação dos efeitos de diferentes tipos de cianotoxinas em
espécies pertencentes a vários grupos taxonômicos.

Introdução e justificativa 29
Tabela 1.3. Biomarcadores utilizados para a avaliação dos efeitos de diferentes tipos de cianotoxinas em espécies pertencentes a vários grupos taxonômicos Grupo taxonômico Enzimab Toxinac Origem da toxina Organismo-teste Autor Algae GST, GPx, LPO, GSH MC-LR
MC-LR/MC-RR/MC-YR Fornecido por Carmichael
Florescimento de Microcystis aeruginosa Chlorella vulgaris
Scenedesmus quadricauda Mohamed (2008)
Briófita GST, GPx, POD Microcin MC-LR
Microcystis sp (cepa SF608) Microcystis aeruginosa (cepa PCC7813)
Vesicularia dubyana Wiegand et al. (2002)
Cladocera (Crustacea) GST, GPx, POD Microcin MC-LR
Microcystis sp (cepa SF608) Microcystis aeruginosa (cepa PCC7813)
Daphnia magna Wiegand et al. (2002)
GST, LDH, GSH, PP1 e PP2A MC-LR Microcystis aeruginosa (PCC7806) Daphnia magna Chen et al. (2005) AChE ANTX-a(s) Anabaena spiroides Daphnia pulicaria Barros et al. (1998) GST, CAT, LPO, LDH MC-LR Toxina comercial Daphnia magna Ortiz-Rodríguez e
Wiegand (2010) Crustacea GST NODLN
MC-LR MC-HtyR
Nodularia spumigena (cepa DUN902) Microcystis (cepa PCC7813)
Oscillatoria agardhii
Artemia salina Beattie et al. (2003)
AChE Neurotoxina não identificada
Anabaena spiroides Callinectes sapidus Monserrat et al. (2001)
Pisces GSH, GST MC Microcystis aeruginosa (cepa RST9501) Cyprinus carpio Amado et al. (2011) SOD, CAT, GSH, LPO MC-LR Florescimento de Microcystis spp Tinca tinca Atencio et al. (2008) PP2A MC-LR Toxina comercial Oryzias latipes Mezhoud et al. (2008) GST MC-LR
LPS Microcystis (cepa PCC7813) Microcystis (cepa CYA43)
Danio rerio Best et al. (2002)
AChE Neurotoxina não identificada
Anabaena spiroides Odontesthes argentinensis Monserrat et al. (2001)
Aves AChE ANTX-a(s) Anabaena lemmermannii aves Henriksen et al. (1997) Mamíferos Soro sanguíneo (AKP, γ-GT,
AST, ALT) Não identificada Anabaena spiroides Camundongo (SPF) Pan et al. (2009)
DNA-PK MC-LR Microcystis aeruginosa (cepa PCC7813) Células do sistema imune do homem
Lankoff et al. (2006)
N.H.a AChE NODLN Nostoc (cepa 78-12A) Enzima e substrato artificiais
Becher et al. (2009)
AChE ANTX-a(s) Anabaena spiroides (cepa ITEP-024/025/026)
Enzima e substrato artificiais
Molica et al. (2005)
a N.H. não há nenhuma espécie estudada; b GST (glutationa S-transferase); GPx (glutationa peroxidase); LPO (peroxidação lipídica); GSH (glutationa); POD (peroxidases); LDH (lactato desidrogenase); PP1 e PP2A (proteínas fosfatases); AChE (acetilcolinesterase); CAT (catalase); SOD (superóxido dismutase); AKP (fosfatase alcalina); γ-GT (γ-glutamil transpeptidase); AST (aspartato amino-transferase); ALT (alanina amino-transferase); DNA-PK (proteína quinase DNA-dependente); c MC (microcistina); MC-LR (microcistina-leucina/arginina); MC-RR (microcistina-arginina/arginina); MC-YR (microcistina-tirosina/arginina); MC-HtyR (microcistina-homotirosina/arginina); NODLN (nodularina); LPS (lipopolissacarídeos); ANTX-a(s) (anatoxina-a(s)).

Introdução e justificativa 30
1.4.3. Biomarcadores em cladóceros
Embora a medição de enzimas seja perfeitamente viável para os cladóceros, o uso deste
grupo taxonômico tem sido relativamente negligenciado em pesquisas com biomarcadores (De
Coen et al., 2000), principalmente para as espécies de regiões tropicais. Os cladóceros oferecem
algumas vantagens práticas nos estudos que utilizam tal abordagem, tais como (De Coen et al.,
2000; Depledge e Fossi, 1994; Lagadic, 1999): (1) são importantes componentes das cadeias
alimentares, sendo que uma redução significante nas suas populações pode indicar importantes
consequências ecológicas; (2) constituem populações numerosas e amostras ambientais de
indivíduos podem ser tomadas rapidamente para a análise sem que ocorra um impacto
significante nas populações; (3) é possível dentro de um curto período de tempo correlacionar as
respostas bioquímicas e fisiológicas com os efeitos danosos em níveis populacionais e de
comunidade, uma vez que os cladóceros possuem um ciclo de vida relativamente curto, um
tamanho corporal pequeno, uma taxa reprodutiva alta e um curto tempo de geração; e (4)
questões éticas e legais favorecem seu uso.
Entre os diferentes biomarcadores que são utilizados nos estudos com os cladóceros
podem-se destacar as colinesterases, que são um importante biomarcador bioquímico para
substâncias anticolinesterásicas. Uma revisão detalhada das colinesterases segue abaixo.
1.4.3.1. Colinesterases
As esterases são tipicamente subdivididas em duas principais classes de acordo com sua
reatividade com alguns substratos artificiais (Peakall, 1992). As esterases do tipo “A”
caracterizam-se por hidrolisar p-nitrofenil acetato em taxas maiores do que o p-nitrofenil
butirato, enquanto que as esterases do tipo “B” hidrolisam o p-nitrofenil butirato na mesma taxa
ou em taxas maiores que o p-nitrofenil acetato (Peakall, 1992).
As colinesterases (ChE) representam uma subclasse das esterases do tipo “B”,
conjuntamente com outras esterases e carboxilesterases. Elas são caracterizadas pela presença de
um sítio aniônico e um sítio ativo (esterase), sendo enzimas essenciais para o funcionamento
normal do sistema nervoso central e periférico e amplamente distribuídas em tecidos neurais e
não neurais (Fribroulet et al., 1990; Peakall, 1992). Dois tipos de colinesterases são reconhecidos
em vertebrados e de acordo com suas propriedades catalíticas a determinados substratos e com
suas taxas de inibição a determinados inibidores específicos (Eto, 1974; Hyne e Maher, 2003;
Walker et al., 2001) são divididas em:

Introdução e justificativa 31
1) Acetilcolinesterase (AChE): é altamente específica para o substrato acetilcolina e
fortemente inibida por BW284C51. A acetilcolina (ACh) é responsável pela transmissão do
impulso nervoso a partir dos terminais dos nervos motores aos músculos, bem como na
transmissão sináptica entre as células nervosas. A hidrólise da acetilcolina é catalisada pela AChE,
produzindo acetato e colina como metabólitos (Fig. 1.7);
2) Butirilcolinesterase (BuChE) ou pseudocolinesterase (PChE): é uma esterase
relativamente não específica que hidrolisa mais de um substrato, tais como butirilcolina e a
própria acetilcolina. É fortemente inibida pela iso-OMPA. A função fisiológica da PChE é ainda
desconhecida, sendo estudada em conjunto com a AChE.
Fig. 1.7 Modo de ação da acetilcolinesterase (AChE). A acetilcolina liga-se a acetilcolinesterase e é hidrolisada em acetato (A) e colina (Ch). Fonte: adaptado de Silverthorn (2010)
Existem evidências de que uma gama de diferentes formas de colinesterases estejam
presentes em uma variedade de espécies e mesmo nos indivíduos de uma mesma espécie (Habig e
Di Giulio, 1991). Barata et al. (2001) não encontraram uma contribuição significativa da PChE
para a hidrólise do substrato acetiltiocolina em cinco clones de Daphnia magna. Tais autores
afirmaram que a atividade enzimática poderia ser referida apenas em termos de atividade da
AChE. Por outro lado, Diamantino et al. (2003) constataram que as colinesterases de
homogeneizados dos organismos inteiros de D. magna não podem ser classificadas nem como
AChE e nem como PChE, pelo fato delas apresentarem características de ambas as enzimas.

Introdução e justificativa 32
1.4.3.1.1. A atividade das colinesterases como um biomarcador bioquímico
As colinesterases são os sítios-alvo de ação para muitos pesticidas (organofosforados e
carbamatos), bem como para outras substâncias anticolinesterásicas, tais como íons metálicos
(arsênio, cobre, mercúrio e zinco) (Diamantino et al., 2003), detergentes (Guilhermino et al.,
1998; Lagadic et al., 1994) e cianotoxinas neurotóxicas (Molica et al., 2005; Monserrat et al.,
2001), entre outros. As substâncias anticolinesterásicas inibem a atividade da AChE nas sinapses
nervosas e, como consequência, ocorre um acúmulo do neurotransmissor acetilcolina no receptor
pós-sináptico (Domingues et al., 2010). Por essa razão, a inibição da atividade das colinesterases
tem sido utilizada como um biomarcador bioquímico, visto que a sua porcentagem de inibição
pode ser utilizada como um indicador de exposição ou de efeito por um considerável período de
tempo mesmo após o tóxico ser metabolizado ou eliminado do corpo do organismo (Fulton e
Key, 2001; Hyne e Maher, 2003).
Considerando a existência de diferentes formas de colinesterases, a principal preocupação
na sua utilização como um biomarcador é que as suas múltiplas formas podem obscurecer a
correlação entre os efeitos e a inibição da atividade enzimática (Hyne e Maher, 2003). Também
diferentes estágios de desenvolvimento podem gerar erros uma vez que a concentração das
colinesterases varia de acordo com o estágio de desenvolvimento em que o organismo se
encontra. Por isso, é essencial utilizar um material biológico com um estágio de desenvolvimento
bem definido (Hyne e Maher, 2003). Algumas variáveis ambientais também têm sido sugeridas
como fatores que podem interferir com a interpretação acurada das respostas da atividade das
colinesterases, sendo a temperatura a principal variável ambiental (Zinkl et al., 1991). Entretanto,
o uso de um controle que tenha experimentado temperaturas ambientais similares àquelas dos
organismos expostos aos tóxicos pode eliminar esta fonte de variabilidade.
O monitoramento em campo da AChE cerebral de peixes e de aves constitui em uma
técnica comumente utilizada para diagnosticar exposições a substâncias anticolinesterásicas (Zinkl
et al., 1991). O grande sucesso na aplicação desta técnica instigou diversos pesquisadores a
pensarem se as medições da atividade de colinesterases em cladóceros podem também refletir sua
exposição quantitativa aos tóxicos anticolinesterásicos e capacitá-los a serem utilizados como
bioindicadores. Day e Scott (1990) mediram a atividade da AChE em indivíduos de Daphnia
magna quando expostos a diferentes tipos de organofosforados. No entanto, as inibições da
atividade enzimática foram apenas detectadas para concentrações muito próximas àquelas
consideradas letais. Guilhermino et al. (1996b) otimizaram as condições de ensaio para medir a
atividade da AChE em D. magna e também avaliaram o efeito do paration, do paraoxon, do

Introdução e justificativa 33
cádmio e do 3,4-dicloroanilina (DCA) sobre a sua atividade (Guilhermino et al., 1996a). Com
relação ao paration e ao paraoxon, tais autores observaram que os valores de inibição da AChE in
vivo foram muito próximos àqueles encontrados a partir dos ensaios agudos convencionais. O
DCA e o cádmio não tiveram nenhum efeito sobre a atividade da AChE in vivo. Printes e
Callaghan (2004) observaram a existência de uma relação entre a redução na atividade da AChE e
a imobilidade em D. magna, quando os dafinídeos foram expostos a diferentes pesticidas
anticolinesterásicos. Estas autoras associaram uma redução de até 50% da atividade da AChE
com efeitos prejudiciais na mobilidade e também concluíram que o valor do uso da atividade da
AChE como um biomarcador em D. magna depende do químico testado.
Significantes avanços têm sido feitos no entendimento das interações bioquímicas de
contaminantes com os organismos aquáticos (Di Giulio et al., 1995). O desenvolvimento atual
das pesquisas com relação aos biomarcadores em invertebrados aquáticos já tem permitido a
incorporação destas respostas como ferramentas em programas de avaliação ambiental,
principalmente com relação ao uso das colinesterases (Lagadic et al., 2000; Peakall, 1999).
Entretanto, pouca informação sobre a ligação entre a atividade das colinesterases e as respostas
em níveis mais elevados de organização biológica tem sido obtida para os cladóceros (Duquesne,
2006; Printes e Callaghan, 2004; Printes et al., 2008), sendo que tais estudos são inexistentes para
as espécies de cladóceros oriundas de regiões tropicais. Desta forma, para que as colinesterases
dos invertebrados aquáticos, especialmente dos cladóceros tropicais, possam ser amplamente
utilizadas em Avaliações de Risco Ecológico, mais pesquisas são necessárias no sentido de
estabelecer a ligação entre a inibição das colinesterases e os efeitos tóxicos em níveis mais
elevados de organização biológica para as diferentes substâncias químicas, tanto de origem
natural (e.g., cianotoxinas neurotóxicas) como de origem antropogênica (e.g., pesticidas
organofosforados e carbamatos).
1.5. Misturas tóxicas
A maior parte do conhecimento e da compreensão dos efeitos das diferentes cianotoxinas
sobre os organismos aquáticos é baseada na avaliação do efeito individual de cada uma delas
(Babica et al., 2007; Ferrão-Filho et al., 2008; LeBlanc et al., 2005; Sotero-Santos et al., 2008;
Wiegand et al., 1999), sendo raros os estudos que investigam os efeitos conjuntos destas toxinas
naturais em misturas complexas (Pinheiro et al., 2012). Uma vez que no ambiente o que
normalmente se verifica é a coexistência de mais de uma cianotoxina, é essencial que estudos

Introdução e justificativa 34
sobre os efeitos combinados das cianotoxinas na biota aquática sejam realizados a fim de que
seus resultados possam contribuir para a Avaliação de Risco Ecológico.
Alguns modelos teóricos têm sido desenvolvidos e aplicados para explicar o
comportamento das misturas químicas (e.g., Barata et al., 2006; Cassee et al., 1998; Jonker et al.,
2004, 2005). Estes modelos são baseados em dois conceitos de referência, sendo utilizados para
descrever a toxicidade conjunta baseada no modo de ação dos tóxicos individuais. Tais conceitos
de referência assumem que não há nenhuma interação entre os tóxicos. O modelo da Adição de
Concentração (AC) (Loewe e Muischnek, 1926) assume que os tóxicos individuais com o mesmo
modo de ação atuam sobre o mesmo sistema biológico (i.e., sobre o mesmo alvo molecular) e
contribui para uma resposta comum em proporção a suas toxicidades relativas. Este modelo
conceitual é definido como a soma das toxicidades relativas dos componentes individuais em
uma mistura (Ferreira et al., 2008; Groten, 2000; Loureiro et al., 2010). Alternativamente, o
modelo da Ação Independente (AI) (Bliss, 1939) assume que os tóxicos afetam os organismos
por meio de diferentes modos de ação e seus efeitos são, portanto, estatisticamente
independentes um do outro durante a exposição, a tomada e a ação tóxica. O modelo da Ação
Independente calcula os efeitos conjuntos pela multiplicação das probabilidades das respostas
(Ferreira et al., 2008; Loureiro et al., 2010; Olmstead e LeBlanc, 2005). As misturas químicas
podem ser também compostas de tóxicos cujos modos de ação sejam desconhecidos ou
ambíguos e, consequentemente, em tais casos, os modelos de AC e AI são aplicados para a
predição do efeito real. A ambiguidade nos modos de ação pode ser devido às especificidades da
toxicodinâmica, ou seja, os químicos individuais em uma mistura podem atuar na mesma enzima,
célula ou órgão, mas eles podem danificar diferentes processos fisiológicos (Loureiro et al., 2010).
Embora, em algumas misturas, os modos de ação dos compostos químicos sejam
conhecidos, eles podem desviar do padrão dos modelos de referência acima citados. Assim, as
diferentes combinações de uma mistura podem causar um efeito mais severo (sinergismo) ou
menos severo (antagonismo) do que aquele calculado pelos modelos de AC e AI. Ainda, os
desvios podem ser dependentes do nível da dose (diferentes desvios para altas ou baixas
concentrações) ou da proporção do tóxico (desvios diferentes a partir da composição da mistura)
(Ferreira et al., 2008; Loureiro et al., 2010). Tais desvios em relação aos modelos de referência
podem ser de natureza física, química e/ou biológica e as interações podem ocorrer na fase de
toxicocinética (processos de tomada, distribuição, metabolismo e excreção) ou na fase de
toxicodinâmica (efeitos dos químicos nos receptores, sítios celulares ou órgãos) (Cassee et al.
1998, Ferreira et al. 2008). Entretanto, os desvios a partir dos modelos de referência das misturas
podem ser caracterizados utilizando o modelo do MIXTOX (Jonker et al., 2005). O modelo

Introdução e justificativa 35
MIXTOX avalia se e como os dados observados desviam a partir dos modelos de AC e AI e testa
se descrições significativamente melhores dos dados observados podem ser alcançadas utilizando
um conjunto de funções de desvio por meio de uma avaliação passo a passo. Estas funções
permitem uma diferenciação entre o sinergismo e o antagonismo, juntamente com os desvios
baseados na dependência do nível da dose e da proporção do tóxico (Loureiro et al., 2010).
1.6. Justificativa
De acordo com a U.S.EPA (1984), o uso de organismos aquáticos para o monitoramento
ambiental é uma importante ferramenta em Ecotoxicologia Aquática, permitindo avaliar a
toxicidade potencial de substâncias biodisponíveis, tanto de origem antropogênica (xenobióticos)
como aquelas provenientes de organismos vivos (metabólitos secundários).
Desta forma, na presente pesquisa propomos avaliar, de uma forma comparativa, os
efeitos da cianotoxina neurotóxica anatoxina-a(s) sobre os cladóceros Pseudosida ramosa (um
representante da biota aquática de regiões tropicais e subtropicais) e Daphnia magna (um
representante de regiões temperadas). Pela primeira vez, o distúrbio tóxico causado pela
anatoxina-a(s) foi estudado para diferentes níveis de organização biológica (molecular, individual
e populacional). Os efeitos observados na atividade das colinesterases (um biomarcador
específico para substâncias anticolinesterásicas, como a anatoxina-a(s)) foram correlacionados
com outros efeitos observados em parâmetros individuais e populacionais. Assim, pode-se
especificar o valor da atividade das colinesterases de cada espécie estudada para a avaliação de
risco preditivo. A ligação entre a resposta do biomarcador e os efeitos adversos para níveis mais
elevados de organização biológica são essenciais para que os cladóceros, principalmente os de
regiões tropicais, sejam utilizados em estudos de Avaliação de Risco Ecológico em ecossistemas
aquáticos que sofrem constantemente com florescimentos de cianobactérias neurotóxicas. Uma
vez que os florescimentos de cianobactérias, principalmente as produtoras de toxinas, têm
aumentado em intensidade e frequência tanto no Brasil como em outros países, tais estudos são
essenciais na atualidade.
Também, pela primeira vez, os efeitos das misturas de extratos neurotóxicos (anatoxina-
a(s)) e hepatotóxicos (microcistinas) de cianobactérias foram avaliados utilizando-se a espécie
Daphnia magna como organismo-teste. Considerando que no meio ambiente o que normalmente
se verifica é a co-ocorrência de mais de uma cianotoxina, é essencial que estudos sobre os efeitos
combinados destas toxinas sobre a biota aquática sejam realizados a fim de que seus resultados
possam contribuir para uma avaliação de risco mais acurada e realística.

Introdução e justificativa 36
Referências bibliográficas Aas, P., Eriksen, S., Kolderup, J., Lundy, P., Haugen, J.-E., Skulberg, O.M., Fonnum, F., 1996. Enhancement of acetylcholine release by homoanatoxin-a from Oscillatoria formosa. Environ. Toxicol. Phar. 2, 223-232. ABNT, Associação Brasileira de Normas Técnicas, 2009. Ecotoxicologia aquática – Toxicidade aguda – Método de ensaio com Daphnia spp (Crustacea, Cladocera). ABNT NBR 12713. 23p. ABNT, Associação Brasileira de Normas Técnicas, 2010. Ecotoxicologia aquática – Toxicidade crônica – Método de ensaio com Ceriodaphnia spp (Crustacea, Cladocera) ABNT NBR 13373. 18p. Adema, D.M.M., 1978. Daphnia magna as a test animal in acute and chronic toxicity tests. Hydrobiologia 59, 125-134. Allan, I.J., Vrana, B., Greenwood, R., Mills, G.A., Roig, B., Gonzales, C., 2006. A “toolbox” for biological and chemical monitoring requirements for the European Union’s Water Framework Directive. Talanta 69, 302-322. Allen, Y., Calow, P., Baird, D.J., 1995. A mechanistic model of contaminant-induced feeding inhibition in Daphnia magna. Environ. Toxicol. Chem. 14, 1625-1630. Amado, L.L., Garcia, M.L., Ramos, P.B., Yunes, J.S., Monserrat, J.M., 2011. Influence of a toxic Microcystis aeruginosa strain on glutathione synthesis and glutathione-S-transferase activity in common carp Cyprinus carpio (Teleostei: Cyprinidae). Arch. Environ. Con. Tox. 60(2), 319-326. Anderson, D., 1994. Red tides. Scientific American August, pp. 52-58. Apeldoorn, M.E., Egmond, H.P., Speijers, G.J.A., Bakker, G.J.I., 2007. Toxins of cyanobacteria. Mol. Nutr. Food Res. 51, 7-60. Atencio, L., Moreno, I., Jos, A., Pichardo, S., Moyano, R., Blanco, A., Cameán, A.M., 2008. Dose- dependent antioxidant responses and pathological changes in tenca (Tinca tinca) after acute oral exposure to Microcystis under laboratory conditions. Toxicon 52, 1-12. Atienzar, F.A., Conradi, M., Evenden, A.J., Jha, A.N., Depledge, M.M., 1999. Qualitative assessment of genotoxicity using random amplified polymorphic DNA: comparison of genomic template stability with key fitness parameters in Daphnia magna exposed to benzo[a] pyrene. Environ. Toxicol. Chem. 18, 2275-2282. Azevedo, S.M.F.O., Evans, W.R., Carmichael, W.W., Namikoshi, M., 1994. First report of microcystins from a Brazilian isolate of the cyanobacterium Microcystis aeruginosa. J. Appl. Phycol. 6, 261-265. Azevedo, S.M.F.O., Carmichael, W.W., Jochimsen, E.M., Rinehart, K.L., Lau, S., Shaw, G.R., Eaglesham, G.K., 2002. Human intoxication by microcystins during renal dialysis treatment in Caruaru-Brazil. Toxicology 181-182, 441-446. Babica, P., Hilscherova, K., Bartova, K., Blaha, L., Marsalek, B., 2007. Effects of dissolved microcystins on growth of planktonic photoautotrophs. Phycologia 46(2), 137-142.

Introdução e justificativa 37
Baillieul, M., Blust, R., 1999. Analysis of the swimming velocity of cadmium-stressed Daphnia magna. Aquat. Toxicol. 44, 245-254. Ballot, A., Krienitz, L., Kotut, K., Wiegand, C., Metcalf, J.S., Codd, G.A., Pflugmacher, S., 2004. Cyanobacteria and cyanobacterial toxins in three alkaline Rift Valley lakes of Kenya - Lakes Bogoria, Nakuru and Elmenteita. J. Plankton Res. 26, 925-935. Banker, R., Carmeli, S., Hadas, O., Telsch, B., Porat, R., Sukenik A., 1997. Identification of cylindrospermopsin in Aphanizomenon Ovalisporum (Cyanophyceae) isolated from Lake Kinneret, Israel. J. Phycol. 33, 613-616. Barata, C., Baird, D.J., Soares, A.M.V.M., Guilhermino, L., 2001. Biochemical factors contributing to response variation among resistant and sensitive clones of Daphnia magna Straus exposed to ethyl parathion. Ecotox. Environ. Safe. 49, 155-163. Barata, C., Varo, I., Navarro, J.C., Arunc, S., Porte, C., 2005. Antioxidant enzyme activities and lipid peroxidation in the freshwater cladoceran Daphnia magna exposed to redox cycling compounds. Comp. Biochem. Phys. C 140, 175-186. Barata, C., Baird, D.J., Nogueira, A.J.A., Soares, A.M.V.M., Riva, M.C., 2006. Toxicity of binary mixtures of metals and pyretroid insecticides to Daphnia magna Straus. Implications for multi-substance risks assessment. Aquat. Toxicol. 78, 1-14. Barros, P., Guilhermino, L., Fidalo, M.L., Soares, A.M.V.M., 1998. Effects of Anabaena flos-aquae and Microcystis aeruginosa on acetylcholinesterase activity of Daphnia pulicaria. In: Reguera, B., Blanco, J., Fernandez, M.L., Wyatt, T. (Eds.), Harmful Algae. Xunta de Galicia IOC, Paris, pp. 602-603. Barry, M.J., 1999. The effects of a pesticide on inducible phenotypic plasticity in Daphnia. Environ. Pollut. 104, 217-224. Beattie, K.A., Ressler, J., Wiegand, C., Krause, E., Codd, G.A., Steinberg, C.E.W., Pflugmacher, S., 2003. Comparative effects and metabolism of two microcystins and nodularin in the brine shrimp Artemia salina. Aquat. Toxicol. 62, 219-226. Becher, P.G., Baumann, H.I., Gademann, K., Jüttner, F., 2009. The cyanobacterial alkaloid nostocarboline: an inhibitor of acetylcholinesterase and trypsin. J. Appl. Phycol. 21, 103-110. Becker, V., Ihara, P., Yunes, J.S., Huszar, V.L.M., 2010. Occurrence of anatoxin-a(s) during a bloom of Anabaena crassa in a water-supply reservoir in southern Brazil. J. Appl. Phycol. 22, 235-241. Benson, W.H., Di Giulio, R.T., 1992. Biomarkers in hazard assessments of contaminated sediments. In: Burton Jr., G.A. (Ed.), Sediment toxicity assessment. Lewis Publishers, Boca Raton, Florida, pp. 241-265. Best, J.H., Pflugmacher, S., Wiegand, C., Eddy, F.B., Metcalf, J.S., Codd, G.A., 2002. Effects of enteric bacterial and cyanobacterial lipopolysaccharides, and of microcystin-LR, on glutathione S-transferase activities in zebra fish (Danio rerio). Aquat. Toxicol. 60, 223-231.

Introdução e justificativa 38
Besten, P.J.D., Tuk, C.W., 2000. Relation between responses in the neural red retention test and the comet assay and life history parameters of Daphnia magna. Mar. Environ. Res. 50, 513-516. Biesinger, K.E., Christensen, G.M., 1972. Effects of various metals on survival, growth, reproduction, and metabolism of Daphnia magna. J. Fish Res. Board Can. 29(12), 1691-1700. Bittencourt-Oliveira, M.C., Kujbida, P., Cardozo, K.H.M., Carvalho, V.M., Moura, A.N., Colepicolo, P., Pinto E., 2005. A novel rhythm of microcystin biosynthesis is described in the cyanobacterium Microcystis panniformis Komárek et al. Biochem. Bioph. Res. Co. 326, 687-694. Bliss, C.I., 1939. The toxicity of poisons applied jointly. Ann. Appl. Biol. 26, 585-615. Borowitzka, M.A., 1995. Microalgae as sources of pharmaceuticals and other biologically active compounds. J. Appl. Phycol. 7, 3-15. Brandorff, G.O., Koste, W., Smirnov, N.N., 1982. The composition and structure of rotiferan and crustacean communities of the lower rio Nhamundá, Amazonas, Brazil. Stud. Neotrop. Fauna Environ. 17(2-3), 69-121. Brooks, J.L., 1959. Cladocera. In: Edmondson, W.T. (Ed.), Freshwater biology. John Wiley & Sons, Inc., New York, pp. 1247. Calow, P., 1993. Handbook of Ecotoxicology. Blackwell Science, Oxford. Calow, P., 1994. Ecotoxicology: What are we trying to protect? Environ. Toxicol. Chem. 13, 1549. Carmichael, W.W., Beasley, V.R., Bunner, D.L., Eloff, J.N., Falconer, I.R., Gorham, P., Harada, K.I., Krishnamurthy, T., Yu, M.J., Moore, R.E., Rinehart, K., Runnegar, M., Skulberg, O.M., Watanabe, M., 1988. Naming of cyclic heptapeptide toxins of cyanobacteria (blue-green algae). Toxicon 26, 971-973. Carmichael, W.W., Mahmood, N.A., Hyde, E.G., 1990. Natural toxins from cyanobacteria (blue-green algae). In: Hall, S., Strichartz, G. (Eds.), Marine toxins, origin, structure and molecular pharmacology. American Chemical Society, Washington D.C., pp. 87-106. Carmichael, W.W., 1992. Cyanobacteria secondary metabolites – the cyanotoxins. J. Appl. Bacteriol. 72, 445-459. Carmichael, W.W., 1994. The toxins of cyanobacteria. Scientific American January, pp. 64-72. Carmichael, W.W., 1997. The cyanotoxins. Adv. Bot. Res. 27, 211-256. Carmichael, W.W., Azevedo, S.M.F.O., An, J.S., Molica, R.J.R., Jochimsen, E.M., Lau, S., Rinehart, K.L., Shaw, G.R., Eaglesham, G.K., 2001. Human fatalities from cyanobacteria: chemical and biological evidence for cyanotoxins. Environ. Health Persp. 109, 663-668. Cassee, F.R., Groten, J.P., van Bladeren, P.J., Feron, V.J., 1998. Toxicological evaluation and risk assessment of chemical mixtures. Crit. Rev. Toxicol. 28, 73-101.

Introdução e justificativa 39
Chen, C.Y., Sillett, K.B., Folt, C.L., Whittemore, S.L., Barchowsky, A., 1999. Molecular and demographic measures of arsenic stress in Daphnia pulex. Hidrobiologia 401, 229-238. Chen, W., Song, L., Ou, D., Gan, N., 2005. Chronic toxicity and responses of several important enzymes in Daphnia magna on exposure to sublethal microcystin-LR. Environ. Toxicol. 20(3), 323-330. Chorus, I., Bartram, J. 1999. Toxic Cyanobacteria in water. A guide to their public health consequences, monitoring and management. E & FN SPON, New York. Codd, G.A., Bell, S.G., Kaya, K., Ward, C.J., Beattie, K.A., Metcalf, J.S., 1999. Cyanobacterial toxins, exposure routes and human health. Eur. J. Phycol. 34, 405-415. Codd, G.A., Morrison, L.F., Metcalf, J.S., 2005. Cyanobacterial toxins: risk management for health protection. Toxicol. Appl. Pharm. 203, 264-272. Connell, D., Lam, P., Richardson, B., Wu, R., 1999. Introduction to Ecotoxicology. Blackwell Science, Oxford. Cook, W.O., Beasley, V.R., Dahlem, A.M., Dellinger, J.A., Harlin, K.S., Carmichael, W.W., 1988. Comparison of effects of anatoxin-a(s) and paraoxon, physostigmine and pyridostigmine on mouse brain cholinesterase activity. Toxicon 26(8), 750-753. Damásio, J., Guilhermino, L., Soares, A.M.V.M., Riva, M.C., Barata, C., 2007. Biochemical mechanisms of resistance in Daphnia magna exposed to the insecticide fenitrothion. Chemosphere 70, 74-82. Day, K.E., Scott, I.M., 1990. Use of acetylcholinesterase activity to detect sublethal toxicity in stream invertebrates exposed to low concentrations of organophosphate insecticides. Aquat. Toxicol. 18, 101-114. De Bernardi, R., Giussani, G., 1990. Are blue-green algae a suitable food for zooplankton? An overview. Hydrobiologia 200/201, 29-41. De Coen, W.M., Janssen, C.R., 1997. The use of biomarkers in Daphnia magna toxicity testing. II. Digestive enzyme activity in Daphnia magna exposed to sublethal concentrations of cadmium, chromium and mercury. Chemosphere 35(5), 1053-1067. De Coen, W.M., Janssen, C.R., Giesy, J.P., 2000. Biomarker applications in ecotoxicology: bridging the gap between toxicology and ecology. In: Persoone, G., Janssen, C., De Coen, W.M. (Eds), New microbiotests for routine toxicity screening and biomonitoring. Kluwer Academic & Plenum Publishers, New York, pp. 13-25. DeMott, W.R., Zhang, Q.X., Carmichael, W.W., 1991. Effects of toxic cyanobcteria and purified toxins on the survival and feeding of a copepod and three species of Daphnia. Limnol. Oceanogr. 36, 1346-1357. Depledge, M.H., 1989. The rational basis for detection of the early indicators of marine pollutants using physiological indicators. Ambio 18, 301-302.

Introdução e justificativa 40
Depledge, M.H., Weeks, J.M., Bjerregaard, P., 1993. Heavy metals. In: Calow, P. (Ed.), Handbook of Ecotoxicology. Blackwell Science, Oxford. Depledge, M.H., Fossi, M.C., 1994. The role of biomarkers in environmental assessment. (2) Invertebrates. Ecotoxicology 3, 161-172. Dettmers, J.M., Stein, R.A., 1992. Food consumption by larval gizzard shad: zooplankton effects and implications for reservoir communities. Trans. Am. Fish Soc. 121, 494-507. Di Giulio, R.T., Benson, W.H., Sanders, B.M., Van Veld, P.A., 1995. Biochemical mechanisms: metabolism, adaptation, and toxicity. In: Rand, M. (Ed.), Fundamentals of aquatic toxicology: effects, environmental fate, and risk assessment. Taylor & Francis, Boca Raton, Florida. Diamantino, T.C., Guilhermino, L., Almeida, E., Soares, A.M.V.M., 2000. Toxicity of sodium molybdate and sodium dichromate to Daphnia magna Straus evaluated in acute, chronic, and acetylcholinesterase inhibition tests. Ecotox. Environ. Safe. 45, 253-259. Diamantino, T.C., Almeida, E., Soares, A.M.V.M., Guilhermino, L., 2001. Lactate dehydrogenase activity as effect criterion in toxicity tests with Daphnia magna Straus. Chemosphere 45, 553-560. Diamantino, T.C., Almeida, E., Soares, A.M.V.M., Guilhermino, L., 2003. Characterization of cholinesterases from Daphnia magna Straus and its inhibition by zinc. B. Environ. Con. Tox. 71, 219-225. Dittmann, E., Wiegand, C., 2006. Cyanobacterial toxins – occurrence, biosynthesis and impact on human affairs. Mol. Nutr. Food Res. 50(1), 7-17. Do Hong, L.C., Becker-Van Slooten, K., Tarradellas, J., 2004. Tropical ecotoxicity testing with Ceriodaphnia cornuta. Environ. Toxicol. 19, 497-504. Dodson, S.I., Hanazato, T., Gorski, P.R., 1995. Behavioral responses of Daphnia pulex exposed to carbaryl and Chaoborus kairomone. Environ. Toxicol. Chem. 14, 43-50. Domingos, P., Rubim, T.K., Molica, R.J.R., Azevedo, S.M.F.O., Carmichael, W.W., 1999. First report of microcystin production by picoplanktonic cyanobacteria isolated from a northeast Brazilian drinking water supply. Environ. Toxicol. 14, 31-35. Domingues, I., Agra, A.R., Monaghan, K., Soares, A.M.V.M., Nogueira, A., 2010. Cholinesterases and glutathione-S-transferase activities in freshwater invertebrates as biomarkers to assess pesticide contamination. Environ. Toxicol. Chem. 29(1), 5-18. Duquesne, S., 2006. Effects of an organophosphate on Daphnia magna at suborganismal and organismal levels: implications for population dynamics. Ecotox. Environ. Safe. 65, 145-150. Edwards, C., Beattie, K.A., Scrimgeour, C.M., Codd, G.A., 1992. Identification of anatoxin-a in benthic cyanobacteria (blue-green algae) and in associated dog poisonings at Loch Insh, Scotland. Toxicon 30, 1165-1175. Elías-Gutiérrez, M., Smirnov, N.N., Suárez-Morales, E., Dimas-Flores, N., 2001. New and little known cladocerans (Crustacea: Anomopoda) from southeastern Mexico. Hydrobiologia 442(1-3), 41-54.

Introdução e justificativa 41
Elmoor-Loureiro, L.M.A., 2007. Phytophilous cladocerans (Crustacea: Anomopoda and Ctenopoda) from Paranã River Valley, Goiás, Brazil. Rev. Bras. Zool. 24(2), 344-352. Eriksson, J.E., Grönberg, L., Nygard, S., Slotte, J.P., Meriluoto, J.A.O., 1990. Hepatocellular uptake of 3H-dihydromicrocystin-LR, a cyclic peptide toxin. Biochim. Bioph. Acta, 1025, 60-66. Espíndola, E.L.G., Rocha, O., Barbosa, R.M., Povinelli, J., 2000. A toxicidade de efluentes (lodo) de estações de tratamento de água a dafinídeos (Daphnia similis), quironomídeos (Chironomus xanthus) e peixes (Hyphessobrycon egues). In: Espíndola, E.L.G., Paschoal, C.B., Rocha, O., Bohrer, M.B.C., Oliveira-Neto, A.L. (Eds.), Ecotoxicologia – perspectivas para o século XXI. Rima Editora, São Carlos, pp. 379-394. Eto, M., 1974. Organophosphorus pesticides. CRC Press, Inc., Boca Raton, Cleveland, Ohio. Falconer, I.R., 1991. Tumor promotion and liver injury caused by oral consumption of cyanobacteria. Environ. Toxic. Water 6, 177-184. Falconer, I.R., Humpage, A.R., 2001. Preliminary evidence for in vivo tumour initiation by oral administration of extracts of the blue-green alga Cylindrospermopsis raciborskii containing the toxin cylindropermopsin. Environ. Toxicol. 16, 192-195. Falconer, I.R., 2005. Cyanobacterial toxins of drinking water supplies: cylindrospermopsins and microcystins. CRC Press, Inc., Boca Raton, Florida. Fernandes, E.M.A., 2001. Avaliação da toxicidade de cianobactérias para Brachydanio rerio utilizando ensaios a diferentes níveis de organização biológica. Dissertação de mestrado, Universidade do Porto, Porto, Portugal. 72 p. Ferrão-Filho, A.S., Azevedo, S.M.F.O., DeMott, W.R., 2000. Effects of toxic and non-toxic cyanobacteria on the life history of tropical and temperate cladocerans. Freshwater Biol. 43, 1-19. Ferrão-Filho, A.S., Costa, S.M., Ribeiro, M.G.L., Azevedo, S.M.F.O., 2008. Effects of a saxitoxin-producer strain of Cylindrospermopsis raciborskii (cyanobacteria) on the swimming movements of cladocerans. Environ. Toxicol. 23, 161-168. Ferreira, A.L.G., Loureiro, S., Soares, A.M.V.M., 2008. Toxicity prediction of binary combinations of cadmium, carbendazim and low dissolved oxygen on Daphnia magna. Aquat. Toxicol. 89, 28-39. Fitzgerald, D., Cunliffe, D., Burch, M., 1999. Development of health alerts for cyanobacteria and related toxins in drinking-water in South Australia. Environ. Toxicol. 14, 203-207. Forró, L., Korovchinsky, N.M., Kotov, A., Petrusek, A., 2008. Global diversity of cladocerans (Cladocera, Crustacea) in freshwater. In: Balian, E.V., Lévêque, C., Segers, H., Martens, K. (Eds.), Freshwater animal diversity assessment. Developments in Hydrobiology, p. 177-184. Fossi, M.C., Leonzio, C., 1993. Non-destructive biomarkers in vertebrates. Lewis Publishers, Boca Raton, Florida. Freitas, E.C., Rocha, O., 2006. The life cycle of Pseudosida ramosa, Daday 1904, an endemic neotropical cladoceran. Acta Limnol. Bras. 18(34), 293-303.

Introdução e justificativa 42
Freitas, E.C., 2009. Utilização da espécie nativa Pseudosida ramosa (Crustacea, Cladocera) como organismo-teste em estudos ecotoxicológicos. Dissertação de mestrado, Universidade Federal de São Carlos, São Carlos, Brasil. 213 p. Freitas, E.C., Rocha, O., 2011a. Acute toxicity tests with the tropical cladoceran Pseudosida ramosa: the importance of using native species as test organisms. Arch. Environ. Con. Tox. 60, 241-249. Freitas, E.C., Rocha, O., 2011b. Acute and chronic effects of sodium and potassium on the tropical freshwater cladoceran Pseudosida ramosa. Ecotoxicology 20, 88-96. Freitas, E.C., Rocha, O., 2011c. Acute and chronic toxicity of chromium and cadmium to the tropical cladoceran Pseudosida ramosa and the implications for ecotoxicological studies. Environ. Toxicol. doi 10.1002/tox.20784 Freitas, E.C., Rocha, O., 2012a. Acute and chronic effects of atrazine and sodium dodecyl sulfate on the tropical freshwater cladoceran Pseudosida ramosa. Ecotoxicology 21, 1347-1357. Freitas, E.C., Rocha, O., 2012b. Effects of sodium and potassium on life history parameters of freswater cladoceran Pseudosida ramosa. J. Braz. Soc. Ecotoxicol. 7(2), 85-91. Friboulet, A., Rieger, F., Goudou, D., Amitai, G., Taylor, P., 1990. Interaction of an organophophate with a peripheral site on acetylcholinesterase. Biochemistry 29, 914-920. Froscio, S.M., Humpage, A.R., Burcham, P.C., Falconer, I.R., 2001. Cell-free protein synthesis inhibition assay for the cyanobacterial toxin cylindrospermopsin. Environ. Toxicol. 16, 408-412. Fulton, M.H., Key, P.B., 2001. Acetylcholinesterase inhibition in estuarine fish and invertebrates as an indicator of organophosphorus insecticide exposure and effects. Environ. Toxicol. Chem. 20, 37-45. Gilbert, J.J., 1990. Differential effects of Anabaena affinis on cladoceran and rotifers: mechanisms and implications. Ecology 71(5), 1727-1740. Green, J., 1956. Growth, size and reproduction in Daphnia (Crustacea: Cladocera). Proc. Zool. Soc. London 126, 173-204. Green, J., 1961. A Biology of Crustacea. H.F. & G. Witherby Ltda, London. Groten, J.P., 2000. Mixtures and interactions. Food Chem. Toxicol. 38, S65-S71. Gugger, M., Lenoir, S., Berger, C., Ledreux, A., Druart, J.-C., Humbert, J.F., Guette, C., Bernard, C., 2005. First report in a river in France of the benthic cyanobacterium Phormidium favosum producing anatoxin-a associated with dog neurotoxicosis. Toxicon 45, 919-928. Guilhermino, L., Lopes, M.C., Carvalho, A.P., Soares, A.M.V.M., 1996a. Inhibition of acetylcholinesterase activity as effect criterion in acute tests with juvenile Daphnia magna. Chemosphere 32(4), 721-738. Guilhermino, L., Lopes, M.C., Carvalho, A.P., Soares, A.M.V.M., 1996b. Acetylcholinesterase activity in juveniles of Daphnia magna Straus. Bull. Environ. Con. Tox. 57, 979-985.

Introdução e justificativa 43
Guilhermino, L., Barros, P., Silva, M.C., Soares, A.M.V.M., 1998. Should the use of inhibition of cholinesterases as a specific biomarker for organophosphate and carbamate pesticides be questioned? Biomarkers 3, 157-163. Guilhermino, L., Sobral, O., Chastinet, C., Ribeiro, R., Gonçalves, F., Silva, M.C., Soares, A.M.V.M., 1999. A Daphnia magna first-brood chronic test: an alternative to the conventional 21-day chronic bioassay? Ecotox. Environ. Safe. 42, 67-74. Habig, C., Di Giulio, R.T., 1991. Biochemical characteristics of cholinesterases in aquatic organisms. In: Mineau, P. (Ed.), Cholinesterase-inhibiting insecticides – their impact on wildlife and the environment. Elsevier Publishers B.V., London. Halbrook, R.S., McCarthy, J.F., Shugart, R., 1993. Conceptual strategy for development and application of a biomarker-based biomonitoring program. In: Peakall, D.B., Shugart, L.R. (Eds.), Biomarkers: research and application in the assessment of environmental health. Springer-Verlag, Berlin, pp. 81-116. Hallegraeff, G.M., 2003. Harmful algal blooms: a global overview. In: Hallegraeff, G.M., Anderson, D.M., Cembella, A.D. (Eds.), Manual on harmful marine microalgae. Monographs on oceanographic methodology, UNESCO, pp. 25-49. Hanazato, T., 1995. Toxic cyanobacteria and the zooplankton community. In: Watanabe, M.F., Harada, K., Carmichael, W.W., Fujiki, H. (Eds.), Toxic Microcystis. CRC Press, Inc., Boca Raton, Tokyo, pp. 79-101. Haney, J.F., 1987. Field studies on zooplankton-cyanobacteria interactions. New Zealand J. Mar. Fresh. Res. 21, 467-475. Harada, K.-I., Ogawa, K., Matsuura, K., Murata, H., Suzuki, M., Watanabe, M., Itezono, Y., Nakayama, N., 1990. Structural determination of geometrical isomers of microcystins LR and RR from cyanobacteria by two-dimensional NMR spectroscopic techniques. Chem. Res. Toxicol. 3, 473-481. Harada, K.-I., Ohtani, I., Iwamoto, K., Suzuki, M., Watanabe, M.F., Watanabe, M., Terao, K., 1994. Isolation of cylindrospermopsin from a cyanobacterium Umezakia natans and its screening method. Toxicon 32, 73-84. Hawkins, P.R., Runnegar, M.T.C., Jackson, A.R.B., Falconer, I.R., 1985. Severe hepatotoxicity caused by the tropical cyanobacterium (blue-green alga) Cylindrospermopsis raciborskii (Woloszynska) Seenaya and Subba Raju isolated from a domestic water supply reservoir. Appl. Environ. Microbiol. 50, 1292-1295. Hawkins, P.R., Chandrasena, N.R., Jones, G.J., Humpage, A.R., Falconer, I.R., 1997. Isolation and toxicity of Cylindrospermopsis raciborskii from an ornamental lake. Toxicon 35(3), 341-346. Henriksen, P., Carmichael, W.W., An, J., Moestrup, Ø., 1997. Detection of an anatoxin-a(s)-like anticholinesterase in natural blooms and sultures of cyanobacteria/blue-green algae from danish lakes and in the stomach contents of poisoned birds. Toxicon 35(6), 901-913. Hietala, J., Laurén-Määttä, C., Walls, M., 1997. Life history responses of Daphnia clones to toxic Microcystis at different food levels. J. Plankton Res. 19(7), 917-926.

Introdução e justificativa 44
Hobaek, A., Larsson, P., 1990. Sex determination in Daphnia magna. Ecology 71, 2255-2268. Holm, N.P., Shapiro, J., 1984. An examination of lipid reserves and the nutritional status of Daphnia pulex fed Aphanizomenon flos-aquae. Limnol. Oceanogr. 29(5), 1137-1140. Humpage, A.R., Fenech, M., Thomas, P., Falconer, I.R., 2000. Micronucleus induction and chromosome loss in transformed human white cells indicate clastogenic and aneugenic action of the cyanobacterial toxin, cylindrospermopsin. Mutat. Res. 472, 155-161. Humpage, A.R., Falconer, I.R., 2003. Oral toxicity of the cyanobacterial toxin cylindrospermopsin in male Swiss Albino mice: determination of no observed adverse effect level for deriving a drinking water guideline value. Environ. Toxicol. 18, 94-103. Hyde, E.G., Carmichael, W.W., 1991. Anatoxin-a(s), a naturally occurring organophosphate, is an irreversible active site-directed inhibitor of acetylcholinesterase (EC 3.1.1.7). J. Biochem. Toxicol. 6, 195-201. Hyne, R.V., Maher, W.A., 2003. Invertebrate biomarkers: links to toxicosis that predict population decline. Ecotox. Environ. Safe. 54, 366-374. Ikawa, M., Sasner, J.J., Haney, J.F., 1994. Lipids of the cyanobacterium Aphanizomenon flos-aquae and inhibition of Chlorella growth. J. Chem. Ecol. 20, 2429-2436. Ikawa, M., Haney, J.F., Sasner, J.J., 1996. Inhibition of Chlorella growth by the lipids of cyanobacterium Microcystis aeruginosa. Hydrobiologia 331, 167-170. ISO, International Organization for Standardization, 1982. Water quality-determination of the mortality of Daphnia magna Straus (Cladocera: Crustacea). ISO 6241-1982. ISO, Geneva, Switzerland. Jackson, A.R.B., McInnes, A., Falconer, I.R., Runnegar, M.T.C., 1984. Clinical and pathological changes in sheep experimentally poisoned by the blue-green alga Microcystis aeruginosa. Vet. Pathol. 21, 102-113. James, K.J., Furey, A., Sherlock, I.R., Stack, M.A., Twohig, M., Caudwell, F.B., Skulberg, O.M., 1998. Sensitive determination of anatoxin-a, homoanatoxin-a and their degradation products by liquid chromatography with fluorimetric detection. J. Chromatogr. A 798(1-2), 147-57. Jemec, A., Tišler, T., Drobne, D., Sepčić, K., Fournier, D., Trebše, P., 2007. Comparative toxicity of imidacloprid, of its commercial liquid formulation and of diazinon to a non-target arthropod, the microcrustacean Daphnia magna. Chemosphere 68, 1408-1418. Jemec, A., Tišler, T., Drobne, D., Sepčić, K., Jamnik, P., Roš, M., 2008. Biochemical biomarkers in chronically metal-stressed daphnids. Comp. Biochem. Phys. C 147, 61-68. Jochiminsen, E.M., Carmichael, W.W., An, J.S., Cardo, D.M., Cookson, S.T., Holmes, C.E., Antunes, M.B., De Mello Filho, D.A., Lyra, T.M., Barreto, V.S., Azevedo, S.M., Jarvis, W.R., 1998. Liver failure and death after exposure to microcystins at a hemodialysis center in Brazil. N. Engli. J. Med. 338(13), 873-878.

Introdução e justificativa 45
Jonker, M.J., Piskiewicz, A.M., Castella, N.II, Kammenga, J.E., 2004. Toxicity of binary mixtures of cadmium-copper and carbendazim-copper to the nematode Caenorhabditis elegans. Environ. Toxicol. Chem. 23, 1529-1537. Jonker, M.J., Svendsen, C., Bedaux, J.J.M., Bongers, M., Kammenga, J.E., 2005. Significance testing of synergistic/antagonistic, dose-level dependent, or dose ratio-dependent effects in mixture dose response analysis. Environ. Toxicol. Chem. 24, 2701-2713. Kaebernick, M., Neilan, B.A., 2001. Ecological and molecular investigations on cyanotoxin production. Microb. Ecol. 35, 1-9. Kim, K.T., Klaine, S.J., Cho, J., Kim, S.-H., Kim, S.D., 2010. Oxidative stress responses of Daphnia magna exposed to TiO2 nanoparticles according to size fraction. Sci. Total Environ. 408, 2268-2272. Kobayashi, T., 1992. A study of physicochemical conditions, phytoplankton and microcrustacean zooplankton in Wallerawang Reservoir, New South Wales. Proc. Linn. Soc. N. S. W. 113(1), 27-41. Koivisto, S., 1995. Is Daphnia magna an ecological representative zooplankton species in toxicity tests? Environ. Pollut. 90, 263-267. Korovchinsky, N.M., 1992. Sididae & Holopedidae: guides to the identificantion of microinvertebrates of the continental waters of the world. SPB Academic Publishing, The Hague, Netherlands. Korovchinsky, N.M., 2006. The Cladocera (Crustacea: Branchiopoda) as a relict group. Zool. J. Linn. Soc. Lond. 147, 109-124. Koskinen, A.M.P., Rapoport, H., 1985. Synthetic and conformational studies on anatoxina: a potent acetylcholine agonist. J. Med. Chem. 28, 1301-1309. Kuiper-Goodman, T., Falconer, I.R., Fitzgerald, J., 1999a. Human health aspects. In: Chorus, I., Bartram, J. (Eds), Toxic cyanobacteria in water. A guide to their public health consequences, monitoring and management. E & FN Spon, Londres. Kuiper-Goodman, T., Falconer, I.R., Fitzgerald, J., 1999b. Toxic cyanobacteria. In: Chorus, I., Bartram, J. (Eds.), Toxic cyanobacteria in water. A guide to their public health consequences, monitoring and managemen. E & FN Spon, London, pp. 113-153. Lagadic, L., Caquet, T., Ramade, F., 1994. The role of biomarkers in environmental risk assessment (5). Invertebrate populations and communities. Ecotoxicology 3, 193-208. Lagadic, L., 1999. Biomarkers in invertebrates. In: Peakall, D.B., Walker, C.H., Migula, P. (Eds.), Biomarkers: a pragmatic basis for remediation of severe pollution in Eastern Europe. Kluwer Academic Publishers, London. Lagadic L., Caquet T., Amiard J.-C., Ramade, F., 2000. Use of biomarkers for environmental quality assessment. Science Publishers, Enfield.
Introdução e justificativa 46
Lagos, N., Onodera, H., Zagatto, P.A., Andrinolo D., Azevedo, S.M.F.O., Oshima, Y., 1999. The first evidence of paralytic shellfish toxins in the freshwater cyanobacterium Cylindrospermopsis raciborskii, isolated from Brazil. Toxicon 37, 1359-1373. Lampert, W., 1981. Toxicity of blue-green Microcystis aeruginosa: effective defense mechanism against grazing pressure by Daphnia. Ver. Internat. Verein. Theor. Ang. Limnol. 21, 1436-1440. Lankoff, A., Bialczyk, J., Dziga, D., Carmichael, W.W., Gradzka, I., Lisowska, H., Kuszewski, T., Gozdz, S., Piorun, I., Wojcik, A., 2006. The repair of gamma-radiation-induced DNA damage is inhibited by microcystin-LR, the PP1 and PP2A phosphatase inhibitor. Mutagenesis 21(1), 83-90. Lansac-Tôha, F.A., Bonecker, C.C., Velho, L.F.M., Simões, N.R., Dias, J.D., Alves, G.M., Takahashi, E.M., 2009. Biodiversity of zooplankton communities in the upper Paraná River floodplain: inter-annual variation from long-term studies. Braz. J. Biol. 69(2), 539-549. LeBlanc, S., Pick, F.R., Aranda-Rodriguez, R., 2005. Allelopathic effects of the toxic cyanobacterium Microcystis aeruginosa on Duckweed, Lemna gibba L. Environ. Toxicol. 20, 67-73. Lilius, H., Hastbacka, T., Isomaa, B., 1995. A comparison of the toxicity of 30 reference chemicals to Daphnia magna and Daphnia pulex. Environ. Toxicol. Chem. 14, 2085-2088. Loewe, S., Muischnek, H., 1926. Combinated effects I announcement – implements to the problem. Naunyn Schmiedebergs Arch. Exp. Pathol. Phar. 114, 313-326. Loureiro, S., Svendsen, C., Ferreira, A.L.G., Pinheiro, C., Ribeiro, F., Soares, A.M.V.M., 2010. Toxicity of three binary mixtures to Daphnia magna: comparing chemical modes of action and deviations from conceptual models. Environ. Toxicol. Chem. 29(8), 1716-1726. Mahmood, N.A., Carmichael, W.W., 1986. The pharmacology of anatoxin-a(s), a neurotoxin produced by the freshwater cyanobacterium Anabaena flos-aquae NRC 525-17. Toxicon 24, 425-434. Maiphae, S., Pholpunthin, P., Dumont, H.J., 2005. Species richness of the Cladocera (Branchiopoda: Anomopoda and Ctenopoda) in southern Thailand, and its complementarity with neighboring regions. Hydrobiologia 537, 147-156. Massaro, F.C., 2011. Estudos ecológicos e ecotoxicológicos de espécies nativas de Hydra (Cnidaria: Hydrozoa). Tese de doutorado, Universidade de São Paulo, São Carlos, Brasil. 502 p. McCarthy, J.F., Shugart, L.R., 1990. Biomarkers of environmental contamination. Lewis Publishers, Boca Raton, Florida. McWilliam, R.A., Baird, D.J., 2002. Post-exposure feeding depression: a new toxicity endpoint for use in laboratory studies with Daphnia magna. Environ. Toxicol. Chem. 21, 1198-1205. Meriluoto, J., Codd, G.A., 2005. Toxic cyanobacterial monitoring and cyanotoxin analysis. Åbo Akademi University Press. Mezhoud, K., Praseuth, D., Puiseux-Dao, S., François, J.-C., Bernard, C., Edery, M., 2008. Global quantitative analysis of protein expression and phosphorylation status in the liver of the medaka fish (Oryzias latipes) exposed to microcystin-LR I. Balneation study. Aquat. Toxicol. 86, 166-175.

Introdução e justificativa 47
Ministério da Saúde, 2000. Portaria no. 1.469, 29 de dezembro de 2000, Brasil. Ministério da Saúde, 2004. Portaria no. 518, 25 de março de 2004, Brasil. Ministério da Saúde, 2011. Portaria no. 2.914, 12 de dezembro de 2011, Brasil. Mitchell, S.E., Halves, J., Lampert, W., 2004. Coexistence of similar genotypes of Daphnia magna in intermittent populations: response to thermal stress. Oikos 106(3), 469-478. Mohamed, Z.A., 2008. Polysaccharides as a protective response against microcystin-induced oxidative stress in Chlorella vulgaris and Scenedesmus quadricauda and their possible significance in the aquatic ecosystem. Ecotoxicology 17, 504-516. Molica, R.J.R., Onodera, H., García, C., Rivas, M., Andrinolo, D., Nascimento, S. M., Meguro, H., Oshima, Y., Azevedo, S.M.F.O., Lagos, N., 2002. Toxins in the freshwater cyanobacterium Cylindrospermopsis raciborskii (Cyanophyceae) isolated from Tabocas reservoir in Caruaru, Brazil, including demonstration of a new saxitoxin analogue. Phycologia 41, 606-611. Molica, R.J.R., Oliveira, E.J.A., Carvalho, P.V.V.C., Costa, A.N.S.F., Cunha, M.C.C., Melo, G.L., Azevedo, S.M.F.O., 2005. Occurrence of saxitoxins and anatoxin-a(s)-like anticholinesterase in a Brazilian drinking water supply. Harmful Algae 4, 743-753. Molica, R., Azevedo, S., 2009. Ecofisiologia de cianobactérias produtoras de cianotoxinas. Oecol. Bras. 13(2), 229-246. Monserrat, J.M., Yunes, J.S., Bianchini, A., 2001. Effects of Anabaena spiroides (Cyanobacteria) aqueous extracts on the acetylicholinesterase activity of aquatic species. Environ. Toxicol. Chem. 20, 87-94. Morrone, J.J., Coscarón, S., 1998. Biodiversidad de artrópodos argentinos: una perspectiva biotaxonómica. Ediciones SUR, La Plata, Argentina. Namikoshi, M., Murakami, T., Watanabe, M.F., Oda, T., Yamada, J., Tsujimura, S., Nagai, H., Oishi, S., 2003. Simultaneous production of homoanatoxin-a, anatoxin-a, and a new non-toxic 4-hydroxyhomoanatoxin-a by the cyanobacterium Raphidiopsis mediterranea Skuja. Toxicon 42, 533-538. Neves, I.F., Rocha, O., Roche, K.F., Pinto, A.A., 2003. Zooplankton community structure of two marginal lakes of the river Cuiabá (Mato Grosso, Brazil) with analysis of Rotifera and Cladocera diversity. Braz. J. Biol. 63(2), 329-343. Nishiwaki-Matsushima, R., Ohta, T., Nishiwaki, S., Suganuma, M., Kohyama, K., Ishikawa, T., Carmichael, W.W., Fujiki, H., 1992. Liver tumor promotion by the cyanobacterial cyclic peptide toxin microcystin-LR. J. Cancer Res. Clin. 118, 420-424. Norris, R.L., Eaglesham, G.K., Pierens, G., Shaw, G.R., Smith, M.J., Chiswell, R.K., Seawright, A.A., Moore, M.R., 1999. Deoxycylindrospermopsin, an analog of cylindrospermopsin from Cylindrospermopsis raciborskii. Environ. Toxicol. 14, 163-165. OECD, Organization for Economic Cooperation and Development, 2004. Guideline for testing of chemicals. Daphnia sp., acute immobilisation test. OECD 202, Paris.
Introdução e justificativa 48
OECD, Organization for Economic Cooperation and Development, 2008. Guidelines for testing of chemicals. Daphnia magna reproduction test. OECD 211, Paris. Okumura, D.T., Sotero-Santos, R.B., Takenaka, R.A., Rocha, O., 2007. Evaluation of cyanobacteria toxicity in tropical reservoirs using crude extracts bioassay with cladocerans. Ecotoxicology 16, 263-270. Okumura, D.T., 2011. Estudos ecotoxicológicos com as espécies Argyrodiaptomus furcatus e Notodiaptomus iheringi (Copepoda, Calanoida). Tese de doutorado, Universidade de São Paulo, São Carlos, Brasil. 312 p. Olmstead, A.W., LeBlanc, G.A., 2005. Toxicity assessment of environmentally relevant pollutant mixtures using a heuristic model. Integr. Environ. Assess. Manag. 1, 114-122. Ortiz-Rodríguez, R., Wiegand, C., 2010. Age related acute effects of microcystin-LR on Daphnia magna biotransformation and oxidative stress. Toxicon 56, 1342-1349. Osswald, J., Rellán, S., Gago, A., Vasconcelos, V., 2007. Toxicology and detection methods of the alkaloid neurotoxin produced by cyanobacteria, anatoxin-a. Environ. Int. 33, 1070-1089. Paerl, H.W., Huisman, J., 2008. Blooms like it hot. Science 320, 57-58. Pan, X., Chang, F., Liu, Y., Li, D., Xu, A., Shen, Y., Huang, Z., 2009. Mouse toxicity of Anabaena flos-aquae from Lake Dianchi, China. Environ. Toxicol. 24(1), 10-18. Patterson, G.M.L., Larsen, L.K., Moore, R.E., 1994. Bioactive natural products from blue-green algae. J. Appl. Phycol. 6, 151-157. Peakall, D.B., 1992. Animal biomarkers as pollution indicators. Ecotoxicology series 1. Chapman & Hall, London. Peakall, D.B., Shugart, L.R., 1993. Biomarkers: research and application in the assessment of environmental health. NATO ASI Series H, vol. 68, Springer-Verlag, Heidelberg. Peakall, D.B. 1994. The role of biomarkers in environmental assessment (1). Introduction. Ecotoxicology 3, 157-160. Peakall, D.B., 1999. The use of biomarkers in hazard assessment. In: Peakall, D.B., Walker, C.H., Migula, P. (Eds.), Biomarkers: a pragmatic basis for remediation of severe pollution in Eastern Europe. Kluwer Academic Publishers, London. Persoone, G., Janssen, C.R., 1993. Freshwater invertebrate toxicity tests. In: Calow, P. (Ed.), Handbook of Ecotoxicology. Blackwell Science, Oxford. Pinheiro, C., Azevedo, J., Campos, A., Loureiro, S., Vasconcelos, V., 2012. Absence of negative allelopathic effects of cylindrospermopsin and microcystin-LR on selected marine and freshwater phytoplankton species. Hydrobiologia doi 10.1007/s10750-012-1372-x

Introdução e justificativa 49
Porter, K.G., Orcutt, J.D., 1980. Nutritional adequacy, manageability and toxicity as factors that determine the food quality of green and blue-green algae for Daphnia. In: Kerfoot, W.C. (Ed.), Evolution and ecology of zooplankton communities. University Press of New England, Hanover, pp. 268-281. Pouria, S., De Andrade, A., Barbosa, J., Cavalcanti, R.L., Borreto, V.T.S., Ward, C.J., Preiser, W., Poon-Grace, K., Neild, G.H., Codd, G.A., 1998. Fatal microcystin intoxications in haemodialysis unit in Caruaru, Brazil. Lancet 253, 21-26. Printes, L.B., Callaghan, A., 2004. A comparative study on the relationship between acetylcholinesterase activity and acute toxicity in Daphnia magna exposed to anticholinesterase insecticides. Environ. Toxicol. Chem. 23(5), 1241-1247. Printes, L.B., Fellowes, M.D.E., Callaghan, A., 2008. Clonal variation in acetylcholinesterase biomarkers and life history traits following OP exposure in Daphnia magna. Ecotox. Environ. Safe. 71, 519-526. Rand, M., 1995. Fundamentals of aquatic toxicology: effects, environmental fate, and risk assessment. Taylor & Francis, Boca Raton, Florida. Rapala, J., Sivonen, K., Luukainen, R., Niemalä, S.I., 1993. Anatoxin-a concentration in Anabaena and Aphanizomenon under different environmental conditions and comparison of growth by toxic and non-toxic Anabaena-strains – a laboratory study. J. Appl. Phycol. 5, 581-591. Reinikainen, M., Kiviranta, J., Ulvi, V., Niku-Paavola M., 1995. Acute toxic effects of a novel cyanobacterial toxin on the crustaceans Artemia salina and Daphnia pulex. Arch. Hydrobiol. 133(1), 61-69. Ressom, R., Soong, F.S., Fitzgerald, J., Turczynowicz, L., El Saadi, O., Roder, D., Maynard, T., Falconer, I.R., 1994. Health effects of toxic cyanobacteria (blue-green algae). Australian Government Public Service, Canberra. Rey, J., Vasquez, E., 1986. Cladocères de quelques corps d’eaux du bassin moyen de l’Orénoque (Venezuela). Ann. Limnol.- Int. J. Lim. 22(2), 137-168. Ribeiro, M.M., 2011. O potencial de Ceriodaphnia cornuta Sars (1885) fa rigaudi como organismo-teste em estudos ecotoxicológicos: uma comparação cogênere. Dissertação de mestrado, Universidade Federal de Minas Gerais, Belo Horizonte, Brasil. 100 p. Ribeiro, F., Ferreira, N.C.G., Ferreira, A., Soares, A.M.V.M., Loureiro, S., 2011. Is ultraviolet radiation a synergistic stressor in combined exposures? The case study of Daphnia magna exposure to UV and carbendazim. Aquat. Toxicol. 102, 114-122. Rinehart, K.L., Namikoshi, M., Choi, B.W., 1994. Structure and biosynthesis of toxins from blue-green algae (cyanobacteria). J. Appl. Phycol. 6, 159-176. Roa, E.Z., Vasquez, W., 1991. Additional cladoceran records for Mantecal and new for Venezuela. Hydrobiologia 225, 45-62.

Introdução e justificativa 50
Rocha, O., Güntzel, A., 1999. Branchiopoda, Cladocera. In: Ismael, D., Valenti, W.C., Matsumura-Tundisi, T., Rocha, O. (Eds.), Biodiversidade do Estado de São Paulo, Brasil: síntese do conhecimento ao final do século XX. Fapesp, São Paulo, pp. 107-120. Rocha, O., Güntzel, A.M., 2000. Crustacea Branchiopoda. In: Ismael, D., Valente, W.C., Matsumura-Tundisi, T., Rocha, O. (Eds.), Invertebrados de água doce. Organizado por Joly, C.A, Bicudo, C.E.M. BIOTA/FAPESP. São Paulo, SP, v.4, pp. 109-120. Rocha, O., Santos-Wisniewski, M.J., Matsumura-Tundisi, T., 2011. Checklist de Cladocera de água doce do Estado de São Paulo. Biota Neotrop. 11(1), 571-592. Rodgher, S., Espíndola, E.L.G., 2008. Effects of interactions between algal densities and cadmium concentrations on Ceriodaphnia dubia fecundity and survival. Ecotox. Environ. Safe. 71, 765-773. Runnegar, M.T.C., Kong, S.M., Zhong, Y.Z., Ge, J.L., Lu, S.C., 1994. The role of glutathione in the toxicity of a novel cyanobacterial alkaloid cylindrospermopsin in cultured rat hepatocytes. Biochem. Bioph. Res. Co. 201, 235-241. Sanoamuang, L.O., 1998. Contributions to the knowledge of the Cladocera of northeast Thailand. Hydrobiologia 362(1–3), 45-53. Sant’Anna, C.L., Azevedo, M.T.P., Werner, V.R., Dogo, C.R., Rios, F.R., Carvalho, L.R., 2008. Review of toxic species of cyanobacteria in Brazil. Algol. Stud. 126, 251-265. Scholtissek, B., Jurgens, U.J., Weckesser, J., 1991. Purification and electrophoretic pattern of the lipopolysaccharide of Microcystis sp. PCC 7806. Algol. Stud. 64, 361-368. Schram, F.R., 1986. Crustaceae. University Press, Oxford. Shaw, G., Seawright, A., Shahin, M., Senogles, P., Mueller, J., Moore, M., 2000. The cyanobacterial toxin, cylindrospermopsin: human health risk assessment. 9th International Conference on Harmful Algal Blooms, Hobart. pp. 56. Shen, X.Y., Lam, P.S.K.S., Shaw, G., Wickramasinghe, W., 2002. Genotoxicity investigation of a cyanobacterial toxin, cylindrospermopsin. Toxicon 40, 1499-1501. Sherratt, T.N., Roberts, G., Williams, P., Whitefield, M., Biggs, J., Shillabeer, N., Maund, S.J., 1999. A life-history approach to predicting the recovery of aquatic invertebrate populations after exposure to xenobiotic chemicals. Environ. Toxicol. Chem. 18, 2512-2518. Sibly, R.M., 1996. Effects of pollutants on individual life histories and population growth rates. In: Newman, M.C., Jagoe, C.H. (Eds.), Ecotoxicology: a hierarchical treatment. Lewis Publishers, Boca Raton, Florida. Silverthorn, D.U., 2010. Fisiologia humana: uma abordagem integrada. 5a. ed. Artmed, Porto Alegre. Sivonen, K., Kononen, K., Carmichael, W.W., Dahlem, A.M., Rinehart, K.L., Kiviranta, J., Niemela, S.I., 1989. Occurrence of the hepatotoxic cyanobacterium Nodularia spumigena in the Baltic Sea and structure of the toxin. Appl. Environ. Microb. 55, 1990-1995.

Introdução e justificativa 51
Skulberg, O.M., Carmichael, W.W., Andersen, R.A., Matsunaga, S., Moore, R.E., Skulberg, R., 1992. Investigations of a neurotoxic oscillatorialean strain (Cyanophyceae) and its toxin. Isolation and characterization of homoanatoxin-a. Environ. Toxicol. Chem. 11(3), 321-329. Sotero-Santos, R.B., Sousa e Silva, C.R., Verani, N.F., Nonaka, K.O., Rocha, O., 2006. Toxicity of a cyanobacteria bloom in Barra Bonita Reservoir (Middle Tietê River, São Paulo, Brazil). Ecotox. Environ. Safe. 64, 163-170. Sotero-Barbosa, R.B., Rocha, O., Povinelli, J., 2007. Toxicity of ferric chloride sludge to aquatic organisms. Chemosphere 68, 628-636. Sotero-Santos, R.B., Carvalho, E.G., Dellamano-Oliveira, M.J., Rocha, O., 2008. Occurrence and toxicity of an Anabaena bloom in a tropical reservoir (Southeast Brazil). Harmful Algae 7, 590-598. Sturm, A., Hansen, P.D., 1999. Altered cholinesterase and monooxygenase levels in Daphnia magna and Chironomus riparius exposed to environmental pollutants. Ecotox. Environ. Safe. 42, 9-15. Suter, G.W., 1990. Use of biomarkers in ecological risk assessment. In: McCarthy, J.F., Shugart, L.R. (Eds.), Biomarkers of environmental contamination. Lewis Publishers, Boca Raton, Florida. Suter, G.W., 1995. Introduction to ecological risk assessment for aquatic toxic effects. In: Rand, M. (Ed.), Fundamentals of aquatic toxicology: effects, environmental fate, and risk assessment. Taylor & Francis, Boca Raton, Florida. Takenaka, R.A., Sotero-Santos, R.M.B., Rocha, O., 2006. Water quality assessment by ecotoxicological and limnological methods in water supplies, Southeast Brazil. Ecotoxicology 15, 73-82. Takenaka, R.A., Dellamano-Oliveira, M.J., Rocha, O. 2007. Toxicidade de extratos de florações de cianobactérias de reservatórios do rio Tietê, SP, aos dafinídeos Ceriodaphnia dubia e Ceriodaphnia silvestrii (Cladocera, Crustacea). J. Braz. Soc. Ecotoxicol. 2, 147-156. Timbrell, J.A., Draper, R., Waterfield, C.J., 1996. Biomarker in toxicology: new uses for some old molecules? Biomarkers 1, 1-11. Trayler, K.M., Davis, J.A., 1996. Sensitivity of Daphnia carinata sensu lato to the insect growth regulator, pyriproxyfen. Ecotox. Environ. Safe. 33(2), 154-156. Tundisi, J.G., 2003. Água no século XXI: enfrentando a escassez. Rima, São Carlos. Ueno, Y., Nagata, T., Tsutsumi, A., Hasegawa, M.F., Watandeble, H.D., Park, G.C., Chen, W., Zyu, S., 1996. Detection of Microcystis, a blue-green algal hepatoxin, in drinking water sample in Haimen and Fusai, endemic areas of primary liver cancer in China, by highly sensitive immunoassay. Carcinogenesis 17, 1317-1321. U.S. EPA, U.S. Environmental Protection Agency, 1984. Technical support document for water quality-based toxic control. Washington, DC. 135p.

Introdução e justificativa 52
U.S. EPA, U.S. Environmental Protection Agency, 2002. Methods for measuring the acute toxicity of effluents and receiving waters to freshwater and marine organisms. Washington, DC. 350p. Van Gestel, C.A.M., Van Brummelen, T.C., 1996. Incorporation of the biomarker concept in ecotoxicology calls for a redefinition of terms. Ecotoxicology 5, 217-225. Viaggiu, E., Melchiorre, S., Volpi, F., Di Corcia, A., Mancini, R., Garibaldi, L., Crichigno, G., Bruno, M., 2004. Anatoxin-a toxin in the cyanobacterium Planktothrix rubescens from a fishing pond in northern Italy. Environ. Toxicol. 19, 191-197. Vieira, J.M.D., Azevedo, M.T.D., Azevedo, S.M.F.O., Honda, R.Y., Correa, B., 2003. Microcystin production by Radiocystis fernandoi (Chroococcales, Cyanobacteria) isolated from a drinking water reservoir in the city of Belém, PA, Brazilian Amazonia region. Toxicon 42, 709-713. Walker, C.H., 1992. Biochemical responses as indicators of toxic effects in ecosystems. Toxicol. Lett. 64/65, 527-533. Walker, C.H., 1995a. The role of biomarkers in ecotoxicology. Ten. 2, 67. Walker, C.H., 1995b. Biochemical biomarkers in ecotoxicology – some recent developments. Sci. Total Environ. 171, 189-195. Walker, C.H., Hopkin, S.P., Sibly, R.M., Peakall, D.B., 2001. Principles of Ecotoxicology. Taylor & Francis, London. Weckesser, J., Drews, G., 1979. Lipopolysaccharides of photosynthetic prokaryotes. Annu. Rev. Microbiol. 33, 215-239. Whitehouse, P., Crane, M., Redshaw, C.J., Turner, C., 1996. Aquatic toxicity tests for the control of effluent discharges in the UK – the influence of test precision. Ecotoxicology 5, 155-168. Whitton, B.A., Potts, M., 2000. The ecology of cyanobacteria: their diversity in time and space. Kluwer, Dordrecht. WHO, World Health Organization, 1998. Guidelines for drinking-water quality: Recommendations, Genebra. 188 p. WHO, World Health Organization, 2004. Guidelines for drinking-water quality: Recommendations, Genebra. 366 p. Wiegand, C., Pflugmacher, S., Oberemm, A., Meems, N., Beattie, K.A., Steinberg, C.E.W., Codd, G.A., 1999. Uptake and effects of microcystin-LR on detoxication enzymes of early life stages of the zebra fish (Danio rerio). Environ. Toxicol. 14, 89-95. Wiegand, C., Peuthert, A., Pflugmacher, S., Carmeli, S., 2002. Effects of microcin SF608 and microcystin-LR, two cyanotobacterial compounds produced by Microcystis sp., on aquatic organisms. Environ. Toxicol. 17(4), 400-406. Wiegand, C., Pflugmacher, S., 2005. Ecotoxicological effects of selected cyanobacterial secondary metabolites a short review. Toxicol. Appl. Pharm. 203, 201-218.

Introdução e justificativa 53
Winner, R.W., Farrell, M., 1976. Acute and chronic toxicity of copper to four species of Daphnia. J. Fish Res. Board Can. 33, 1685-1691. Wood, S.A., Rasmussen, J.P., Holland, P.T., Campbell, R., Crowe, A.L.M., 2007. First report of the cyanotoxin anatoxin-a from Aphanizomenon issatschenkoi (Cyanobacteria). J. Phycol. 43, 356-365. Zinkl, J.G., Lockhart, W.L., Kenny, S.A., Ward, F.J., 1991. The effects of cholinesterase inhibiting insecticides on fish. In: Mineau, P. (Ed.), Cholinesterase-inhibiting insecticides: their impact on wildlife and the environment. Elsevier Publishers B.V., London.
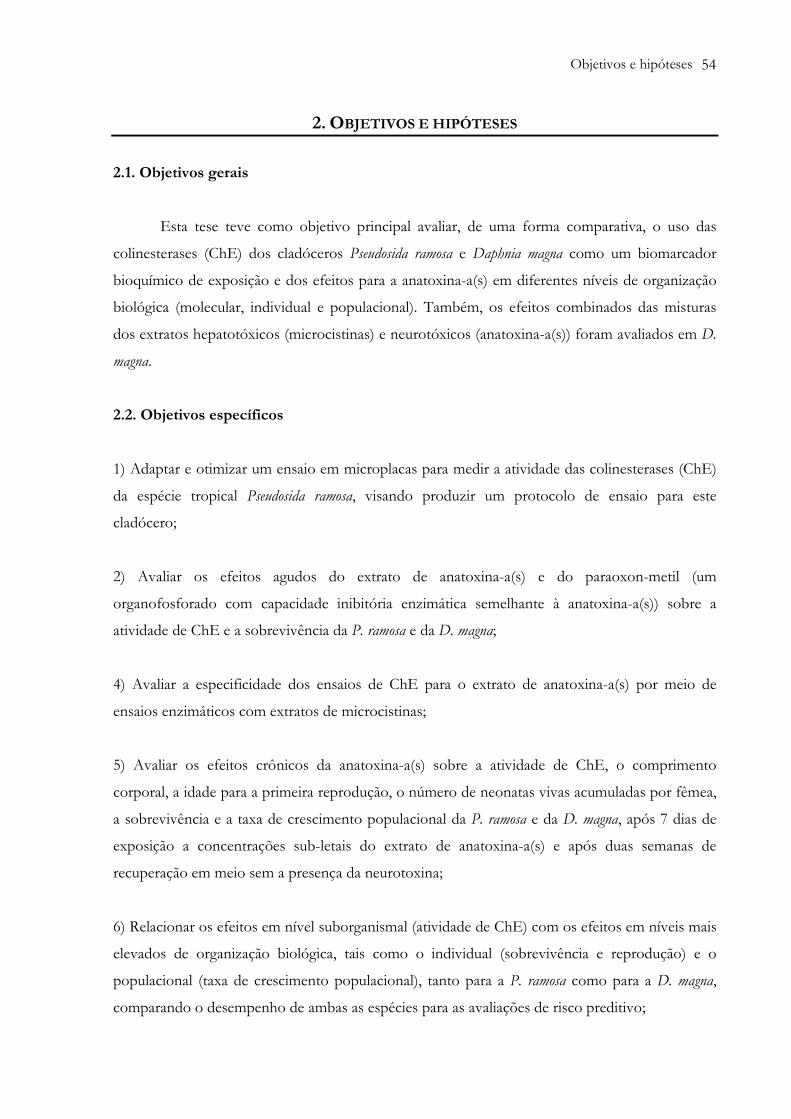
Objetivos e hipóteses 54
2. OBJETIVOS E HIPÓTESES
2.1. Objetivos gerais
Esta tese teve como objetivo principal avaliar, de uma forma comparativa, o uso das
colinesterases (ChE) dos cladóceros Pseudosida ramosa e Daphnia magna como um biomarcador
bioquímico de exposição e dos efeitos para a anatoxina-a(s) em diferentes níveis de organização
biológica (molecular, individual e populacional). Também, os efeitos combinados das misturas
dos extratos hepatotóxicos (microcistinas) e neurotóxicos (anatoxina-a(s)) foram avaliados em D.
magna.
2.2. Objetivos específicos
1) Adaptar e otimizar um ensaio em microplacas para medir a atividade das colinesterases (ChE)
da espécie tropical Pseudosida ramosa, visando produzir um protocolo de ensaio para este
cladócero;
2) Avaliar os efeitos agudos do extrato de anatoxina-a(s) e do paraoxon-metil (um
organofosforado com capacidade inibitória enzimática semelhante à anatoxina-a(s)) sobre a
atividade de ChE e a sobrevivência da P. ramosa e da D. magna;
4) Avaliar a especificidade dos ensaios de ChE para o extrato de anatoxina-a(s) por meio de
ensaios enzimáticos com extratos de microcistinas;
5) Avaliar os efeitos crônicos da anatoxina-a(s) sobre a atividade de ChE, o comprimento
corporal, a idade para a primeira reprodução, o número de neonatas vivas acumuladas por fêmea,
a sobrevivência e a taxa de crescimento populacional da P. ramosa e da D. magna, após 7 dias de
exposição a concentrações sub-letais do extrato de anatoxina-a(s) e após duas semanas de
recuperação em meio sem a presença da neurotoxina;
6) Relacionar os efeitos em nível suborganismal (atividade de ChE) com os efeitos em níveis mais
elevados de organização biológica, tais como o individual (sobrevivência e reprodução) e o
populacional (taxa de crescimento populacional), tanto para a P. ramosa como para a D. magna,
comparando o desempenho de ambas as espécies para as avaliações de risco preditivo;

Objetivos e hipóteses 55
7) Avaliar os efeitos combinados das misturas de dois tipos de cianotoxinas (neurotóxica e
hepatotóxica) sobre a sobrevivência e a alimentação de D. magna.
2.3. Hipóteses
1) A atividade de ChE da P. ramosa é comparável com a atividade de ChE da D. magna;
2) O desempenho da atividade de ChE da P. ramosa como um biomarcador bioquímico é
diferente daquele da D. magna, uma vez que as respostas toxicológicas dos organismos são,
muitas vezes, espécie-específicas;
3) As sensibilidades das espécies estudadas diferem tanto para a atividade de ChE quanto para a
sobrevivência e os diferentes parâmetros da história de vida, quando expostas a concentrações
letais e sub-letais do extrato de anatoxina-a(s);
4) A inibição da atividade de ChE em ambas as espécies estudadas é específica para o extrato de
anatoxina-a(s), visto que as microcistinas são potentes inibidoras das proteínas fosfatases 1 e 2A;
5) Há uma relação direta entre a atividade de ChE e os efeitos sobre a sobrevivência, a
reprodução e a taxa de crescimento populacional dos cladóceros, porém as relações são
diferentes entre as espécies estudadas;
6) Os efeitos combinados da neurotoxina e da hepatotoxina sobre a sobrevivência e a
alimentação da D. magna são diferentes dos efeitos observados para a exposição isolada a cada
tipo de toxina.

Metodologia geral 56
3. METODOLOGIA GERAL
3.1. Cultivo dos cladóceros
3.1.1. Origem do material biológico – Pseudosida ramosa e Daphnia magna
Os indivíduos da espécie de cladócero Pseudosida ramosa Daday 1904 (Fig. 3.1) foram
obtidos a partir de populações existentes na Lagoa do Óleo (21o20’–21o55’S e 47o35’–47o55’W),
uma lagoa marginal da planície de inundação do rio Mogi-Guaçu, Estação Ecológica de Jataí
(Luis Antônio, SP, Brasil), na qual não existem registros da presença de cianobactérias ou de
poluição. Indivíduos desta espécie vêm sendo mantidos no Laboratório de Ecotoxicologia do
Departamento de Ecologia e Biologia Evolutiva (Universidade Federal de São Carlos) desde
2004, sendo que para a obtenção das culturas com genótipos homogêneos, o cultivo foi iniciado a
partir de uma única fêmea partenogenética.
Fig. 3.1 Vista geral de um indivíduo de Pseudosida ramosa, cultivado em laboratório. Aumento 50x. Foto: Freitas, E.C. (2005)
Os indivíduos da espécie Daphnia magna Straus 1820 (Fig. 3.2) utilizados nos ensaios
enzimáticos foram gentilmente fornecidos pelo Laboratório Beckhauser & Barros, Blumenau,
Santa Catarina, Brasil. Para os experimentos das misturas tóxicas das cianotoxinas foram
utilizados indivíduos da espécie Daphnia magna clone beak mantidos no laboratório de
Ecotoxicologia da Universidade de Aveiro, Aveiro, Portugal. Todos os cultivos foram iniciados a
partir de uma única fêmea partenogenética para obtenção de genótipos homogêneos.

Metodologia geral 57
Fig. 3.2 Vista geral de um indivíduo adulto de Daphnia magna, cultivado em laboratório. Aumento 50x. Foto: Freitas, E.C. (2011)
3.1.2. Água de cultivo – meio ASTM
A água utilizada tanto para o cultivo de Pseudosida ramosa como para o cultivo de Daphnia
magna foi a água reconstituída ou meio ASTM (ASTM, 2001; OECD, 2004, 2008). Para a P.
ramosa, a água reconstituída utilizada foi do tipo mole, a qual é recomendada para espécies com
origem de localidades com baixa dureza, enquanto que para a D. magna foi a água reconstituída do
tipo dura (para o clone obtido de Santa Catarina) ou moderadamente dura (para o clone beak)
recomendada para espécies com origem de localidades com alta dureza.
Para preparar os diferentes meios de cultivo (tipo mole, moderadamente duro e duro),
duas soluções-estoque (solução 1 e solução 2) foram feitas separadamente e misturadas em água
destilada (condutividade elétrica < 10 µS cm-1) como descrito na Tabela 3.1. Os reagentes
químicos utilizados foram todos de grau analítico (J.T. Baker ou Mallinckrodt). Os meios de
cultivo foram preparados e armazenados em barrilhetes de PVC com capacidade de 18 L cada
um.

Metodologia geral 58
Tabela 3.1. Preparo da água reconstituída dos tipos mole, moderadamente dura e dura Volume (mL L-1 de água destilada) Qualidade final da água Tipo de água Solução 1a Solução 2b Dureza (mg CaCO3 L-1) pHc Mole 20 10 40-48 7,0-7,6 Moderadamente dura 80 40 150-180 7,4-7,8 Dura 125 62,5 200-250 8,0-8,4 a Solução 1: CaSO4 . 2H2O (1,5 g L-1) dissolvido em 1 L de água destilada; b Solução 2: KCl (0,2 g L-1), NaHCO3 (4,8 g L-1), MgSO4 . 7H2O (6,1 g L-1) dissolvidos em 1 L de água destilada; c Se o pH estava fora da faixa recomendada, ele foi corrigido com ácido clorídrico (HCl, 1N) ou então com hidróxido de sódio (NaOH, 1N).
A água de cultivo foi gentilmente aerada, por no mínimo de 12 horas, após o seu preparo,
sendo a dureza da água (método titulométrico com EDTA) e o pH (Quimis, Q400A, pH metro)
medidos imediatamente antes do uso.
3.1.2.1. Complemento vitamínico
Nos cultivos de Daphnia magna foi necessário o acréscimo de um complemento vitamínico
na água reconstituída. Para cada 1 L de água reconstituída do tipo moderadamente dura e dura foi
acrescentado 0,1 mL do complemento vitamínico imediatamente antes do uso.
Para o preparo do complemento vitamínico foi utilizado soluções-estoque da vitamina B1
(tiamina HCl, 20 mg L-1, Sigma-Aldrich), vitamina H (biotina, 10 mg L-1, Sigma-Aldrich) e
vitamina B12 (cianocobalina, 10 mg L-1, Sigma-Aldrich), das quais se retiraram, respectivamente,
2500 µL, 25 µL e 25 µL para um volume final de 500 mL de água destilada. O complemento
vitamínico assim obtido foi filtrado por meio de um filtro de seringa de 0,2 µm (Filtro de Seringa,
Spritzen), divididos em microtubos e congelados a -20ºC. O complemento vitamínico foi
utilizado por até três meses após o seu preparo.
3.1.3. Estrutura do sistema de cultivo
No laboratório mantiveram-se dois tipos de cultivos: (1) cultivos em massa, onde uma
determinada densidade de organismos foi mantida em conjunto por recipiente de cultivo e; (2)
cultivos individuais, onde um único indivíduo foi mantido por recipiente de cultivo.
Os cultivos em massa tiveram por finalidade constituir uma reserva de organismos, tanto
para os ensaios ecotoxicológicos quanto para a manutenção dos cultivos individuais caso
ocorressem perdas. Metade dos cultivos em massa foi iniciada com indivíduos juvenis com idade
igual ou inferior a 24 horas, obtidos a partir da terceira até a quinta ninhada de fêmeas adultas
dos cultivos prévios em massa, enquanto que a outra metade foi iniciada com fêmeas adultas
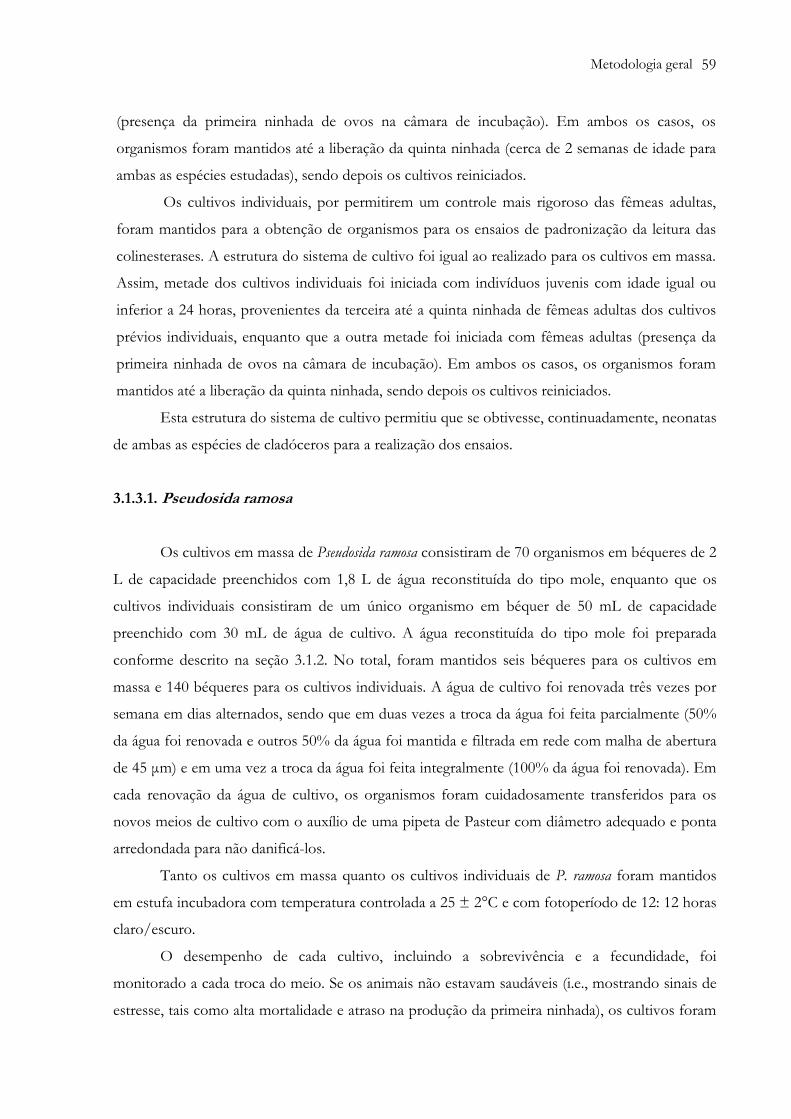
Metodologia geral 59
(presença da primeira ninhada de ovos na câmara de incubação). Em ambos os casos, os
organismos foram mantidos até a liberação da quinta ninhada (cerca de 2 semanas de idade para
ambas as espécies estudadas), sendo depois os cultivos reiniciados.
Os cultivos individuais, por permitirem um controle mais rigoroso das fêmeas adultas,
foram mantidos para a obtenção de organismos para os ensaios de padronização da leitura das
colinesterases. A estrutura do sistema de cultivo foi igual ao realizado para os cultivos em massa.
Assim, metade dos cultivos individuais foi iniciada com indivíduos juvenis com idade igual ou
inferior a 24 horas, provenientes da terceira até a quinta ninhada de fêmeas adultas dos cultivos
prévios individuais, enquanto que a outra metade foi iniciada com fêmeas adultas (presença da
primeira ninhada de ovos na câmara de incubação). Em ambos os casos, os organismos foram
mantidos até a liberação da quinta ninhada, sendo depois os cultivos reiniciados.
Esta estrutura do sistema de cultivo permitiu que se obtivesse, continuadamente, neonatas
de ambas as espécies de cladóceros para a realização dos ensaios.
3.1.3.1. Pseudosida ramosa
Os cultivos em massa de Pseudosida ramosa consistiram de 70 organismos em béqueres de 2
L de capacidade preenchidos com 1,8 L de água reconstituída do tipo mole, enquanto que os
cultivos individuais consistiram de um único organismo em béquer de 50 mL de capacidade
preenchido com 30 mL de água de cultivo. A água reconstituída do tipo mole foi preparada
conforme descrito na seção 3.1.2. No total, foram mantidos seis béqueres para os cultivos em
massa e 140 béqueres para os cultivos individuais. A água de cultivo foi renovada três vezes por
semana em dias alternados, sendo que em duas vezes a troca da água foi feita parcialmente (50%
da água foi renovada e outros 50% da água foi mantida e filtrada em rede com malha de abertura
de 45 µm) e em uma vez a troca da água foi feita integralmente (100% da água foi renovada). Em
cada renovação da água de cultivo, os organismos foram cuidadosamente transferidos para os
novos meios de cultivo com o auxílio de uma pipeta de Pasteur com diâmetro adequado e ponta
arredondada para não danificá-los.
Tanto os cultivos em massa quanto os cultivos individuais de P. ramosa foram mantidos
em estufa incubadora com temperatura controlada a 25 ± 2°C e com fotoperíodo de 12: 12 horas
claro/escuro.
O desempenho de cada cultivo, incluindo a sobrevivência e a fecundidade, foi
monitorado a cada troca do meio. Se os animais não estavam saudáveis (i.e., mostrando sinais de
estresse, tais como alta mortalidade e atraso na produção da primeira ninhada), os cultivos foram
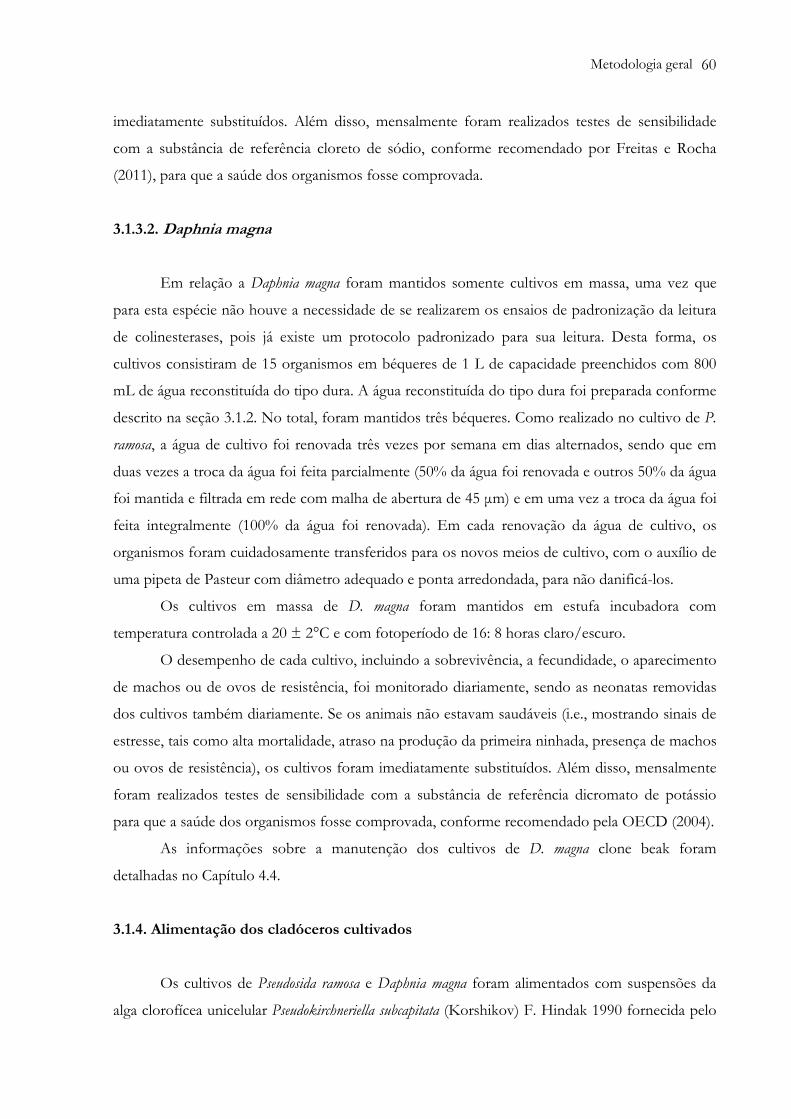
Metodologia geral 60
imediatamente substituídos. Além disso, mensalmente foram realizados testes de sensibilidade
com a substância de referência cloreto de sódio, conforme recomendado por Freitas e Rocha
(2011), para que a saúde dos organismos fosse comprovada.
3.1.3.2. Daphnia magna
Em relação a Daphnia magna foram mantidos somente cultivos em massa, uma vez que
para esta espécie não houve a necessidade de se realizarem os ensaios de padronização da leitura
de colinesterases, pois já existe um protocolo padronizado para sua leitura. Desta forma, os
cultivos consistiram de 15 organismos em béqueres de 1 L de capacidade preenchidos com 800
mL de água reconstituída do tipo dura. A água reconstituída do tipo dura foi preparada conforme
descrito na seção 3.1.2. No total, foram mantidos três béqueres. Como realizado no cultivo de P.
ramosa, a água de cultivo foi renovada três vezes por semana em dias alternados, sendo que em
duas vezes a troca da água foi feita parcialmente (50% da água foi renovada e outros 50% da água
foi mantida e filtrada em rede com malha de abertura de 45 µm) e em uma vez a troca da água foi
feita integralmente (100% da água foi renovada). Em cada renovação da água de cultivo, os
organismos foram cuidadosamente transferidos para os novos meios de cultivo, com o auxílio de
uma pipeta de Pasteur com diâmetro adequado e ponta arredondada, para não danificá-los.
Os cultivos em massa de D. magna foram mantidos em estufa incubadora com
temperatura controlada a 20 ± 2°C e com fotoperíodo de 16: 8 horas claro/escuro.
O desempenho de cada cultivo, incluindo a sobrevivência, a fecundidade, o aparecimento
de machos ou de ovos de resistência, foi monitorado diariamente, sendo as neonatas removidas
dos cultivos também diariamente. Se os animais não estavam saudáveis (i.e., mostrando sinais de
estresse, tais como alta mortalidade, atraso na produção da primeira ninhada, presença de machos
ou ovos de resistência), os cultivos foram imediatamente substituídos. Além disso, mensalmente
foram realizados testes de sensibilidade com a substância de referência dicromato de potássio
para que a saúde dos organismos fosse comprovada, conforme recomendado pela OECD (2004).
As informações sobre a manutenção dos cultivos de D. magna clone beak foram
detalhadas no Capítulo 4.4.
3.1.4. Alimentação dos cladóceros cultivados
Os cultivos de Pseudosida ramosa e Daphnia magna foram alimentados com suspensões da
alga clorofícea unicelular Pseudokirchneriella subcapitata (Korshikov) F. Hindak 1990 fornecida pelo
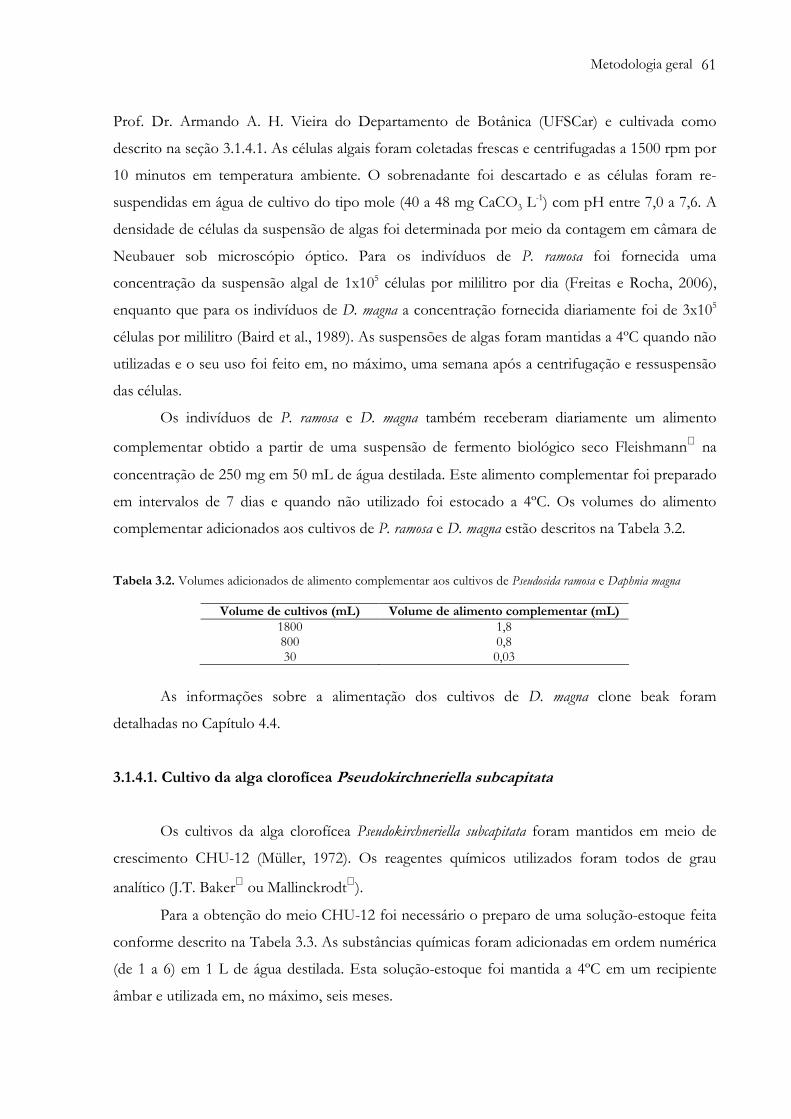
Metodologia geral 61
Prof. Dr. Armando A. H. Vieira do Departamento de Botânica (UFSCar) e cultivada como
descrito na seção 3.1.4.1. As células algais foram coletadas frescas e centrifugadas a 1500 rpm por
10 minutos em temperatura ambiente. O sobrenadante foi descartado e as células foram re-
suspendidas em água de cultivo do tipo mole (40 a 48 mg CaCO3 L-1) com pH entre 7,0 a 7,6. A
densidade de células da suspensão de algas foi determinada por meio da contagem em câmara de
Neubauer sob microscópio óptico. Para os indivíduos de P. ramosa foi fornecida uma
concentração da suspensão algal de 1x10⁵ células por mililitro por dia (Freitas e Rocha, 2006),
enquanto que para os indivíduos de D. magna a concentração fornecida diariamente foi de 3x10⁵
células por mililitro (Baird et al., 1989). As suspensões de algas foram mantidas a 4ºC quando não
utilizadas e o seu uso foi feito em, no máximo, uma semana após a centrifugação e ressuspensão
das células.
Os indivíduos de P. ramosa e D. magna também receberam diariamente um alimento
complementar obtido a partir de uma suspensão de fermento biológico seco Fleishmann na
concentração de 250 mg em 50 mL de água destilada. Este alimento complementar foi preparado
em intervalos de 7 dias e quando não utilizado foi estocado a 4ºC. Os volumes do alimento
complementar adicionados aos cultivos de P. ramosa e D. magna estão descritos na Tabela 3.2.
Tabela 3.2. Volumes adicionados de alimento complementar aos cultivos de Pseudosida ramosa e Daphnia magna
Volume de cultivos (mL) Volume de alimento complementar (mL) 1800 1,8 800 0,8 30 0,03
As informações sobre a alimentação dos cultivos de D. magna clone beak foram
detalhadas no Capítulo 4.4.
3.1.4.1. Cultivo da alga clorofícea Pseudokirchneriella subcapitata
Os cultivos da alga clorofícea Pseudokirchneriella subcapitata foram mantidos em meio de
crescimento CHU-12 (Müller, 1972). Os reagentes químicos utilizados foram todos de grau
analítico (J.T. Baker ou Mallinckrodt).
Para a obtenção do meio CHU-12 foi necessário o preparo de uma solução-estoque feita
conforme descrito na Tabela 3.3. As substâncias químicas foram adicionadas em ordem numérica
(de 1 a 6) em 1 L de água destilada. Esta solução-estoque foi mantida a 4ºC em um recipiente
âmbar e utilizada em, no máximo, seis meses.

Metodologia geral 62
Tabela 3.3. Quantidades das substâncias químicas utilizadas para o preparo da solução-estoque do meio de cultivo CHU-12
Número Substânciaa Peso (g) 1 Ca(NO3)2 4,3 2 K2HPO4 0,5 3 MgSO4 . 7H2O 7,5 4 KCl 0,5 5 Na2CO3 2,0 6 FeCl3 . 6H2O 0,05
a Todos os compostos químicos foram dissolvidos em 1 litro de água destilada, em ordem numérica.
Para o preparo semanal do meio CHU-12 utilizado para o crescimento algal, um volume
de 0,03 L da solução-estoque foi diluído em 1,470 L de água destilada (volume final de 1,500 L) e
armazenado em um frasco do tipo Erlenmeyer de 2 L de capacidade, tampado com um tampão
feito de algodão hidrofóbico e gaze e autoclavado por 20 minutos a 121oC em uma pressão
atmosférica de 1 atm. Após o completo esfriamento em temperatura ambiente do meio CHU-12,
este foi inoculado com uma alíquota de 15 mL da alga clorofícea em fase de crescimento
exponencial (107 a 108 células mL-1) com todos os cuidados para se evitar a contaminação por
bactérias e fungos (feito próximo a uma chama de um bico de Bunsen). Para maiores detalhes do
preparo do inóculo de algas, veja a seção 3.1.4.1.1. Os cultivos foram constantemente aerados
com o auxílio de uma bomba de ar para aquário e uma pipeta (10 mL) tampada com algodão
hidrofóbico previamente autoclavada nas mesmas condições de temperatura, tempo e pressão
atmosférica em que o meio de cultivo foi submetido (Fig. 3.4). A temperatura na sala de cultivo
foi 25 ± 2°C, o fotoperíodo foi 12: 12 horas claro/escuro e a intensidade de luz foi de 1500 lux.
Após um crescimento de aproximadamente 7 dias, o cultivo de algas atingiu o
crescimento exponencial e pode ser processado como descrito na seção 3.1.4.

Metodologia geral 63
Fig. 3.3 Visão geral de um cultivo da alga clorofícea Pseudokirchneriella subcapitata em fase exponencial de crescimento. Foto: Freitas, E.C. (2011)
3.1.4.1.1. Preparo do inóculo algal
O primeiro inóculo de P. subcapitata foi recebido do banco de algas do Departamento de
Botânica (Universidade Federal de São Carlos). Ao recebê-lo, duas sub-amostras foram re-
inoculadas com 1 mL da suspensão de algas em frascos Erlenmeyer de 250 mL de capacidade
com 100 mL de meio CHU-12 previamente autoclavado (121ºC, 20 minutos, 1 atm) e com todos
os cuidados para se evitar a contaminação por bactérias e fungos. Eles foram então expostos por
sete dias às mesmas condições de luz e temperatura como descrito na seção 3.1.4.1, no entanto
sem aeração. Um dos inóculos foi utilizado para estabelecer os cultivos, enquanto que o outro foi
utilizado para manter os subsequentes frascos de inóculos. Novos frascos de inóculos, tanto para
os cultivos quanto para a própria manutenção dos inóculos, foram estabelecidos de 15 em 15
dias.
3.2. Origem e cultivo das cianobactérias Anabaena spiroides e Microcystis aeruginosa
Duas espécies de cianobactérias produtoras de toxinas foram utilizadas nos ensaios
ecotoxicológicos: (1) Anabaena spiroides (produtora de neurotoxina) e (2) Microcystis aeruginosa
(produtora de hepatotoxinas).
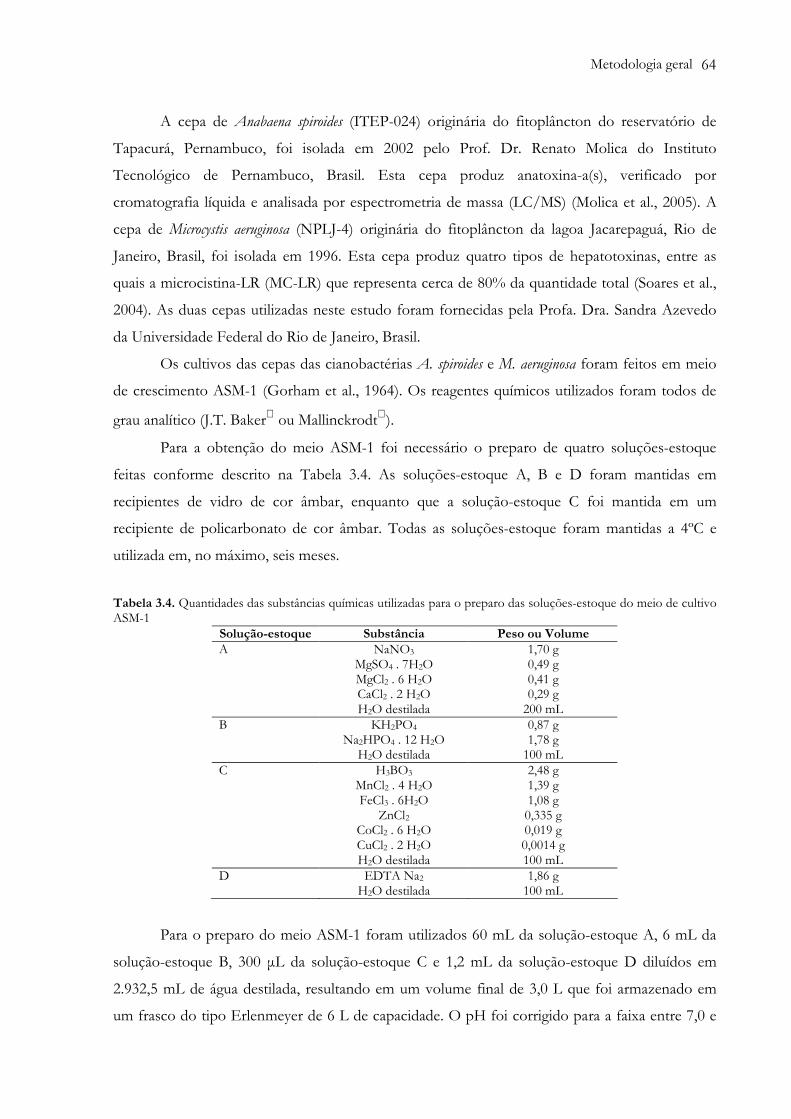
Metodologia geral 64
A cepa de Anabaena spiroides (ITEP-024) originária do fitoplâncton do reservatório de
Tapacurá, Pernambuco, foi isolada em 2002 pelo Prof. Dr. Renato Molica do Instituto
Tecnológico de Pernambuco, Brasil. Esta cepa produz anatoxina-a(s), verificado por
cromatografia líquida e analisada por espectrometria de massa (LC/MS) (Molica et al., 2005). A
cepa de Microcystis aeruginosa (NPLJ-4) originária do fitoplâncton da lagoa Jacarepaguá, Rio de
Janeiro, Brasil, foi isolada em 1996. Esta cepa produz quatro tipos de hepatotoxinas, entre as
quais a microcistina-LR (MC-LR) que representa cerca de 80% da quantidade total (Soares et al.,
2004). As duas cepas utilizadas neste estudo foram fornecidas pela Profa. Dra. Sandra Azevedo
da Universidade Federal do Rio de Janeiro, Brasil.
Os cultivos das cepas das cianobactérias A. spiroides e M. aeruginosa foram feitos em meio
de crescimento ASM-1 (Gorham et al., 1964). Os reagentes químicos utilizados foram todos de
grau analítico (J.T. Baker ou Mallinckrodt).
Para a obtenção do meio ASM-1 foi necessário o preparo de quatro soluções-estoque
feitas conforme descrito na Tabela 3.4. As soluções-estoque A, B e D foram mantidas em
recipientes de vidro de cor âmbar, enquanto que a solução-estoque C foi mantida em um
recipiente de policarbonato de cor âmbar. Todas as soluções-estoque foram mantidas a 4ºC e
utilizada em, no máximo, seis meses.
Tabela 3.4. Quantidades das substâncias químicas utilizadas para o preparo das soluções-estoque do meio de cultivo ASM-1
Solução-estoque Substância Peso ou Volume A NaNO3 1,70 g MgSO4 . 7H2O 0,49 g MgCl2 . 6 H2O 0,41 g CaCl2 . 2 H2O 0,29 g H2O destilada 200 mL B KH2PO4 0,87 g Na2HPO4 . 12 H2O 1,78 g H2O destilada 100 mL C H3BO3 2,48 g MnCl2 . 4 H2O 1,39 g FeCl3 . 6H2O 1,08 g ZnCl2 0,335 g CoCl2 . 6 H2O 0,019 g CuCl2 . 2 H2O 0,0014 g H2O destilada 100 mL D EDTA Na2 1,86 g H2O destilada 100 mL
Para o preparo do meio ASM-1 foram utilizados 60 mL da solução-estoque A, 6 mL da
solução-estoque B, 300 µL da solução-estoque C e 1,2 mL da solução-estoque D diluídos em
2.932,5 mL de água destilada, resultando em um volume final de 3,0 L que foi armazenado em
um frasco do tipo Erlenmeyer de 6 L de capacidade. O pH foi corrigido para a faixa entre 7,0 e

Metodologia geral 65
7,5 com o auxílio de uma solução de ácido clorídrico (HCl, 1N) ou então com hidróxido de sódio
(NaOH, 1N). Após a correção do pH, o frasco foi tampado com um tampão feito de algodão
hidrofóbico e gaze e autoclavado por 45 minutos a 120oC em uma pressão atmosférica de 1 atm.
Após o completo esfriamento em temperatura ambiente do meio ASM-1, este foi
inoculado com uma alíquota de 80 mL da espécie de cianobactéria que se pretendia cultivar em
fase de crescimento exponencial (107 a 108 células mL-1) com todos os cuidados para se evitar a
contaminação por bactérias e fungos (feito em câmera de fluxo laminar). Para maiores detalhes
do preparo do inóculo das cianobactérias, veja a seção 3.2.1. Os cultivos foram constantemente
aerados com o auxílio de uma bomba de ar para aquário e uma pipeta (10 mL) tampada com um
filtro de seringa de 0,2 µm (Spritzen) previamente autoclavados nas mesmas condições de
temperatura, tempo e pressão atmosférica em que o meio de cultivo foi submetido. A
temperatura na sala de cultivo foi 25 ± 2°C com um fotoperíodo de 12: 12 horas claro/escuro.
Após um período de crescimento de aproximadamente 30 dias, os cultivos de ambas as
cianobactérias atingiram o crescimento exponencial e puderam ser concentrados por meio da
centrifugação de fluxo contínuo.
As diferentes metodologias utilizadas para a extração de cada cianotoxina foram descritas
com maiores detalhes em cada experimento em específico (Capítulos 4.2, 4.3 e 4.4).
3.2.1. Preparo do inóculo das cianobactérias
Os primeiros inóculos das cianobactérias A. spiroides e M. aeruginosa ao serem recebidos
foram re-inoculados em quatro sub-amostras (duas sub-amostras de A. spiroides e duas sub-
amostras de M. aeruginosa) com cada sub-amostra recebendo 1 mL da suspensão da respectiva
cianobactéria em frascos Erlenmeyer com 250 mL de capacidade e preenchidos com 100 mL de
meio ASM-1 previamente autoclavado (120ºC, 20 minutos, 1 atm) e com todos os cuidados para
se evitar a contaminação por bactérias e fungos. Eles foram então expostos por 15 dias às
mesmas condições de temperatura e fotoperíodo como descrito na seção 3.2, no entanto sem
aeração. Um dos inóculos foi utilizado para estabelecer os cultivos, enquanto que o outro foi
utilizado para manter os subseqüentes frascos de inóculos. Novos frascos de inóculos, tanto para
os cultivos quanto para a própria manutenção dos inóculos, foram estabelecidos de 15 em 15
dias.

Metodologia geral 66
3.3. Lavagem das vidrarias e dos materiais de trabalho
A lavagem rotineira das vidrarias e dos materiais de trabalho nos ensaios ecotoxicológicos
consistiu em deixar por um período 24 horas em uma solução de detergente 2% (Extran). Após
este período de tempo, os materiais foram lavados em água corrente, secos em temperatura
ambiente e depositados em uma solução de ácido clorídrico 10% por 24 horas. Este
procedimento foi necessário a fim de remover depósitos de carbonato de cálcio, restos de
cianotoxinas e metais. Por último, todos os materiais foram lavados em água destilada e secos à
temperatura ambiente (U.S. EPA, 1991).
A lavagem dos materiais de cultivo consistiu apenas do uso de água destilada, sendo secos
em estufa a 50ºC.

Metodologia geral 67
Referências bibliográficas
ASTM, American Society for Testing and Materials, 2001. Standard guide for conducting acute toxicity testing on test materials with fishes, macroinvertebrates, and amphibians. West Conshohocken, PA, pp. E729-E796. Baird, D.J., Soares, A.M.V.M., Girling, A., Barber, I., Bradley, M.C., Calow, P., 1989. The long-term maintenance of Daphnia magna Straus for use in ecotoxicity tests: Problems and prospects. In: Lokke, H., Tyle, H., Bro-Rasmussen, F. (Eds.), Proceedings, First European Conference on Ecotoxicology. Lyngby, Denmark, pp. 144-148. Freitas, E.C., Rocha, O., 2006. The life cycle of Pseudosida ramosa, Daday 1904, an endemic neotropical cladoceran. Acta Limnol. Bras. 18(34), 293-303. Freitas, E.C., Rocha, O., 2011. Acute toxicity tests with the tropical cladoceran Pseudosida ramosa: the importance of using native species as test organisms. Arch. Environ. Con. Tox. 60, 241-249. Gorham, P.R., McLachlan, J., Hammer, U.T., Dim, W.K., 1964. Isolation and culture of toxic strain of Anabaena flos-aquae (Lyngb.) de Bréb. Verh. Int. Verein. Limnol. 15, 796-804. Molica, R.J.R., Oliveira, E.J.A., Carvalho, P.V.V.C., Costa, A.N.S.F., Cunha, M.C.C., Melo, G.L., Azevedo, S.M.F.O., 2005. Occurrence of saxitoxins and anatoxin-a(s)-like anticholinesterase in a Brazilian drinking water supply. Harmful Algae 4, 743-753. Müller, H., 1972. Wachstum and phosphatbedarf von Nitzschia actinastroides (Lemn.) v. Goor in statischer und homokontiuierliecher kultur unter phosphatlimitierung. Arch. Hydrobiol. Suppl. 38, 399-484. OECD, Organization for Economic Cooperation and Development, 2004. Guideline for testing of chemicals. Daphnia sp., acute immobilisation test. OECD 202, Paris. OECD, Organization for Economic Cooperation and Development, 2008. Guidelines for testing of chemicals. Daphnia magna reproduction test. OECD 211, Paris. Soares, R.M., Magalhães, V.F., Azevedo, S.M.F.O., 2004. Accumulation and depuration of microcystins (cyanobacteria hepatotoxins) in Tilapia rendalli (Cichlidae) under laboratory conditions. Aquat. Toxicol. 70, 1-10. U.S. EPA, U.S. Environmental Protection Agency, 1991. Methods for Measuring the Acute Toxicity of Effluent and Receiving Waters to Freshwater and Marine Organisms. Washington, DC. EPA – 600/4-90/027.

Resultados e discussão 68
4. RESULTADOS E DISCUSSÃO
Capítulo 4.1. Measurements of cholinesterase activity in the tropical freshwater
cladoceran Pseudosida ramosa and its standardization as a biomarker
Abstract – The activity of cholinesterase (ChE) has an important role as a biochemical biomarker and has been
recognized as a useful tool for toxicity evaluations in environmental assessment programs. However, obtaining
reliable results requires a prior optimization of the experimental conditions for the appropriate performance of the
ChE assays. Thus, the main objective of this study was to adapt and optimize a microplate assay for measuring the
ChE activity in the tropical cladoceran Pseudosida ramosa. The best readings obtained for the reaction rates were with
buffers of pH 8.0 and molarity of 0.02 M. The measurements of the reaction rates for different substrate
concentrations showed that the maximum reaction rate (32 mOD min-1) was achieved by the final concentration of 2
mM of substrate. In relation to the enzyme concentration, reaction rates were directly proportional to the protein
concentration, confirming the linear kinetics for a maximum reaction rate. Based on results of assays for the effect of
the number of organisms and homogenate dilution on the reaction rate of substrate hydrolysis and ChE activity, we
recommend the using of 30 organisms (3 days-old) in 250 µL of buffer, 20 organisms (7 days-old) in 250 µL of
buffer and 15 organisms (both 14 and 21 days-old) in 300 µL of buffer. The limits of quantitation obtained were
1.419 mOD min-1 (≤ 72 h-old), 1.670 mOD min-1 (7 days-old), 0.943 mOD min-1 (14 days-old) and 0.797 mOD min-
1 (21 days-old). From the results obtained, it is possible to use appropriately ChE activity of P. ramosa as a
biochemical biomarker in the aquatic toxicity studies from tropical regions.
Keywords: cholinesterases; biochemical biomarkers; Pseudosida ramosa; native species; Tropical Ecotoxicology.
4.1.1. Introduction
Widespread concern about the impact of chemical in the aquatic environment has
instigated the development of sensitive and ecologically relevant methods to predict and monitor
their toxic effects (Rand, 1995). The employment of biochemical biomarkers to assess the risks of
exposure to low concentrations of toxicants has evidenced potential for application in this field
(Timbrell et al., 1996).
Measurements of cholinesterase (ChE) activity have been sucessfully applied to monitor
the effects of anti-cholinesterase toxicants (Day and Scott, 1990; Fisher et al., 2000; Guilhermino
et al., 1996a; Printes and Callaghan, 2003; Xuereb et al., 2009). Such toxicants inhibit the enzyme
acetylcholinesterase (AChE), which is responsible for the hydrolytic degradation of acetylcholine
in the synaptic cleft (Domingues et al., 2010; Jemec et al., 2007; Peakall, 1992; Varó et al., 2002).
Once the AChE is inhibited by anti-cholinesterase toxicants, there is an overstimulation of the
Resultados e discussão 69
central and peripheral nervous system, resulting in deleterious effects for the organism, even
leading to death (Xuereb et al., 2009).
Freshwater invertebrates assume a critical role in aquatic toxicology, due to its ecological
importance in the food chains, their high susceptibility to pollutants and their use as test
organisms in ecotoxicological assessments (Sturm and Hansen, 1999). In particular, in relation to
the cladocerans, Daphnia species are among the most common animals currently used in
assessment programs of freshwater environments (ABNT, 2009; OECD, 2004, 2008; U.S.EPA,
2002). In the temperate regions, methods for measuring ChE activity in Daphnia magna are fairly
well established (Day and Scott, 1990; Guilhermino et al., 1996a, 1996b; Printes and Callaghan,
2003; Sturm and Hansen, 1999), however, in tropical regions, there is so far no record in the
literature of protocols for measuring the ChE activity in cladocerans species native of this region.
Since the toxic responses of the organisms to the chemicals are often species-specific, the use of
temperate species in tropical regions for ecotoxicological assessments has been considered
inappropriate by some authors (Do Hong et al., 2004; Freitas and Rocha, 2012). Thus, this study
aims to produce knowledge on the ChE activity of a tropical cladoceran, contributing for the
appropriate use of this enzyme as a biochemical biomarker in the aquatic toxicity studies from
tropical regions. The main objective of this study was, therefore, to adapt and optimize a
microplate assay made by Fisher et al. (2000) and Printes (2003), which were modified from
Ellman et al. (1961), for measuring ChE activity in Pseudosida ramosa. The cladoceran P. ramosa was
shown to be a good substitute to species D. magna in standard ecotoxicological assays (i.e., acute
and chronic toxicity tests) (Freitas and Rocha, 2011a, 2011b, 2011c, 2012), besides having a wide
geographical distribution in the tropical and subtropical regions (Elías-Gutiérrez et al., 2001;
Korovchinsky, 1992; Maiphae et al., 2005; Morrone and Coscarón, 1998; Rey and Vasquez, 1986;
Roa and Vasquez, 1991; Sanoamuang, 1998), including Brazil (Brandorff et al., 1982; Elmoor-
Loureiro, 2007; Freitas and Rocha, 2006; Lansac-Tôha et al., 2009; Neves et al., 2003; Rocha and
Güntzel, 1999).
4.1.2. Material and methods
4.1.2.1. Organisms and culture conditions
Pseudosida ramosa was originally collected from the Óleo Lake (21o20’–21o55’S and 47o35’–
47o55’W), an oxbow lake in the Mogi-Guaçu River flood plain, Jataí Ecological Station, district of
Luis Antônio, São Paulo State, Brazil, and was used to establish a culture that has been

Resultados e discussão 70
maintained in our laboratory since 2004. One ovigerous female was isolated to start a clonal
culture of this cladoceran species.
Each P. ramosa culture consisted of one single organism in a 50 mL beaker filled with 30
mL of soft reconstituted water (or ASTM medium) as recommended by American Society for
Testing and Materials (ASTM, 2001). The ASTM medium was prepared with 0.03 g L-1 of CaSO4.
2H2O; 0.061 g L-1 of MgSO4.7H2O; 0.048 g L-1 of NaHCO3 and 0.002 g L-1 of KCl dissolved in 1
L of distilled water and had a total hardness of 40–48 mg CaCO3 L-1, a pH range of 7.0–7.6 and
an electrical conductivity around 160 µS cm-1.
Cultures were started with juveniles (≤ 24 h-old), which were isolated from
parthenogenetic mothers. Only juveniles from the 3rd to the 5th brood were utilised for
establishing new cultures and for performing of the ChE assays. In general, 140 individual
cultures were kept simultaneously.
The ASTM medium was renewed three times weekly. The culture conditions were:
temperature of 25 ± 2oC, photoperiod of 12h L: 12h D and daily feeding with the green algae
Pseudokirchneriella subcapitata (1x10⁵ cells mL-1) combined with a suspension of 0.05 mg L-1 (dry wt)
of dried baker’s yeast, as recommended by the U.S.EPA (2002).
The algae P. subcapitata was cultured in CHU-12 medium (Müller, 1972), which was
previously autoclaved at 121oC and 1 atm for 20 min. The temperature during culturing was 25 ±
2oC with a photoperiod of 12h L: 12h D and the culture medium was gently aerated. For food
preparation, the algal cells were centrifuged at 352 g for 10 min at temperature room. The
supernatant was discarded and the cells re-suspended in ASTM medium to remove culture
nutrients. The suspensions of algae and dried baking yeast were kept at 4oC and used within a
maximum time interval of one week.
Monthly, the health and sensitivity of the cultures were evaluated by acute toxicity tests
with the reference substance sodium chloride. For P. ramosa, the range of sensitivity to sodium
chloride is between 1,280 and 1,480 mg L-1, with a mean value of 1,380 mg L-1 (Freitas and
Rocha, 2011b). The 48-h LC50 to sodium chloride obtained in our study remained between the
upper and lower limits of the range of sensitivity (ranging from 1,310 to 1,450 mg L-1).
4.1.2.2. Treatment of the organisms for their use in the ChE assays
For ChE assays, juveniles of P. ramosa (± 24 h-old) were obtained from individual
cultures. Neonates were separated in 2,000 mL beakers filled with 1,800 mL of ASTM medium,
being the population density of 35 individuals per liter. They were maintained in the same culture

Resultados e discussão 71
conditions (see section 4.1.2.1) until completing 72 h-, 7 days-, 14 days- or 21 days-old, as
specified for each particular experiment. The only exception was that no food was provided for
the animals with 72 h-old. After the individuals reached the specified ages, they were dried on
absorbent paper to remove all the ASTM medium, transferred to 1.5 mL micro-centrifuge tubes
and snap-frozen by immersion in liquid nitrogen. The juveniles and adults organisms were stored
for up to 3 months at –80ºC before ChE assays.
4.1.2.3. General description of the method of ChE assays
The adapted method for measuring ChE activity in homogenates of P. ramosa was based
on Fisher et al. (2000) and Printes (2003), which were modified from Ellman et al. (1961). This
method has been sucessfuly used to estimate ChE activity in cladocerans, especially in Daphnia
species (Printes and Callaghan, 2003, 2004; Printes et al., 2008).
In this method, an artificial substrate acetylthiocholine iodide (ATCI) is broken down by
cholinesterase producing acetyl and thiocholine. The yellow colour is produced when thiocholine
reacts with 5,5’-dithio bis-2-nitrobenzoate (DTNB). The enzyme activity is measured by
spectrophotometric detection. The molar extinction coefficient of this coloured product is
known and ChE activity can be calculated. To rationalize the activity expression by the
normalization of the protein content, the protein concentration in the homogenate is estimated
using the bicinchoninic acid (BCA) kinetic protein assay (Pierce, Rockford, IL, USA) (Smith et
al., 1985) as described in previous works (Callaghan et al., 2002; Fisher et al., 2000; Printes, 2003;
Printes and Callaghan, 2003).
Whole animals of P. ramosa (the number of the organisms was specified in each particular
experiment) were homogenized in 1.5 mL micro-centrifuge tubes with homogenizing buffer (ice-
cold 0.02 M sodium phosphate buffer pH 8.0 (defined in a previous assay) with 1% Triton X-
100, Sigma). The homogenization was manual using a microcentrifuge tube pestle for this
purpose (40 cycles, 10 s) and it was carried out on ice in a room with temperature of 18oC. To the
initial homogenate, ice-cold 0.02M sodium phosphate buffer pH 8.0 was added, whirlimixed and
centrifuged at 14,000 g and 2-4°C for 4 min. Supernatants were subsequently transferred to clean
pre-cooled micro-centrifuge tubes, whirlimixed and assayed immediately. Additions to the
microtiter plate were made in the following order: 100 µL of 8 mM DTNB (D-8130, Sigma) in
sodium phosphate buffer pH 8.0 supplemented with 0.75 mg mL-1 of sodium hydrogen
carbonate; 50 µL of blank buffer (sodium phosphate buffer pH 8.0 containing 0.1% Triton-X-
100, Sigma) or 50 µL supernatant; and 50 µL of 16 mM ATCI (A-5751, Sigma) in sodium
Resultados e discussão 72
phosphate buffer pH 8.0. The microtiter plate was inserted into the integral incubator of a Dynex
MRX microtiter plate reader (DYNEX Technologies, USA) and incubated at 30oC for 5 min.
This was followed by the measurement of reaction rate (∆OD min-1) at 405 nm and 30oC over a
10 min period with intermittent shaking among each reading cycle. In total was performed 21
cycles of measurements.
Enzyme activity in µM L-1 min-1 g-1 protein was calculated by the following equation:
Activity = (∆ OD/min) / (MEC x C), where ∆OD/min is the variation of optical density
in the time; MEC is 8,160, molar extinction coefficient of the colored product at 405 nm; and C
is the supernatant protein concentration in the assay (g L-1).
The normal reaction rate of the blank assay was up to 3 mOD min-1.
4.1.2.4. Protein concentration
The protein standard curve was prepared with a series of bovine serum albumin (BSA)
(B14046, Pierce), with standards diluted in blank buffer with pH 8.0. The concentrations used
were: 5, 25, 50, 125, 250 and 500 µg mL-1 for juveniles with 72 h-old; 5, 25, 50, 125, 250, 500,
750, 1000 and 2000 µg mL-1 for individuals with 7 days- and 14 days-old; and 5, 25, 50, 125, 250,
500, 750, 1000, 1500, 2000, 2500, 3000, 3500, 4000, 4500 and 5000 µg mL-1 for adults with 21
days-old. The working reagent was prepared in a 50 mL screw cap tube by mixing 500 µL of
Reagent B (23224, Pierce) with 25 mL of Reagent A (23223, Pierce) (Fisher et al., 2000; Printes,
2003; Smith et al., 1985). It was then pre-heated in a water bath at 30oC for 10 min. Additions to
the microtiter plate were made in duplicate in the following order: 20 µL of the BSA standards or
20 µL of supernatants and 200 µL of the working reagent. After the additions, the plate was
immediately placed into the Dynex MRX microtiter plate reader and measurements were taken
using the kinetics mode. Twenty-one measurements of absorbance at 540 nm were taken at 30 s
intervals interspersed by shaking to mix the reaction. Protein content was determined by
calculating the average slope of the reaction and relating it to the standard bovine serum albumin
protein concentrations. The normal reaction rate of the assay blank was 0.1 to 0.9 mOD min-1.

Resultados e discussão 73
4.1.2.5. ChE assay conditions
4.1.2.5.1. Effect of pH and molarity on measured reaction rate in the ChE assays
The effect of pH on the reaction rate of acetylthiocholine iodide (ATCI) hydrolysis
(mOD min-1) was evaluated. Forty neonates of P. ramosa (≤ 72 h-old) treated as in section 4.1.2.2
were homogenized in 25 µL of homogenising buffer and then added to 225 µL of 0.02 M sodium
phosphate buffer. Three replicates for treatments of pH 6.5, 7.0, 7.5 and 8.0 were utilised.
Buffers, DTNB (8 mM) and ATCI (16 mM) were prepared in 0.02 M sodium phosphate buffer
of respective pH. The ChE assay was performed as described in section 4.1.2.3.
After the selection of pH, the effect of the buffer molarity on the reaction rate of ATCI
hydrolysis (mOD min-1) was evaluated. Forty neonates of P. ramosa (≤ 72 h-old), treated as in
section 4.1.2.2, were homogenized as was made in the pH determination. Homogenates were
prepared with sodium phosphate buffer at 0.02 and 0.05 M. Three replicates for each treatment
were used. Buffers, DTNB (8 mM) and ATCI (16 mM) were prepared in sodium phosphate
buffer in pH 8.0 of respective molarity. The ChE assay was performed as described in section
4.1.2.3.
4.1.2.5.2. Effect of ATCI concentration on measured reaction rate and kinetic
characteristics in the ChE assays
Six-hundred juveniles of P. ramosa (≤ 72 h-old) were treated as in section 4.1.2.2.
Subsequently, they were homogenized in batches of 100 juveniles in 1.5 mL micro-centrifuge
tubes with 25 µL of homogenizing buffer. To the initial homogenate, it was added 225 µL of
sodium phosphate buffer. After centrifuging, the supernatants were pooled in a single 1.5 mL
micro-centrifuge tube and the ChE assay performed as in section 4.1.2.3, with the exception that
the measurement period was extended to 14.5 min. Different concentrations of ATCI were used
to give final concentrations of 0.025; 0.05; 0.075; 0.10; 0.25; 0.50; 0.75; 1.00; 2.00; 4.00 and 8.00
mM. Each substrate concentration was assayed in duplicate.
4.1.2.5.3. Measured reaction rate as a function of enzyme concentration in the ChE assays
To investigate the potential responsiveness of the assay to different amounts of enzyme
and to confirm linear kinetics for a maximum reaction rate, four-hundred juveniles of the P.

Resultados e discussão 74
ramosa (≤ 72 h-old) were treated as in section 4.1.2.2. Subsequently, all animals were homogenized
in batches of 100 juveniles at 25 µL of homogenizing buffer and added to 225 µL of sodium
phosphate buffer. The supernatants were pooled in a single 1.5 mL micro-centrifuge tube and a
series of dilution (6.25; 12.5; 25; 50; 75 and 100%) was prepared using ice-cold blank buffer. The
assay was performed as in section 4.1.2.3 with triplicates of each homogenate dilution and the
protein content was determined as described in section 4.1.2.4.
4.1.2.5.4. Effect of the number of organisms and homogenate dilution on the reaction rate
of substrate hydrolysis and ChE activity
The effect of the number of individuals of P. ramosa per homogenate and different
homogenate dilutions on the rate of ATCI hydrolysis (mOD min-1) and ChE activity (µ mol L-1
min-1 g-1 protein) were investigated.
Firstly, juveniles of P. ramosa (≤ 72 h-old) were treated as in section 4.1.2.2 and 10, 20, 30
and 40 organisms were homogenised in 250 µL of buffer. Secondly, 10, 15 and 20 organisms with
7 days-, 14 days- or 21 days-old, treated as in section 4.1.2.2, were homogenised in 250 or 300 µL
of buffer for 7 days-old, 300 or 500 µL of buffer for 14 days-old and 300 or 600 µL of buffer for
21 days-old. These ages were chosen because they are established endpoints in standard
ecotoxicological assays (acute and chronic toxicity tests). Three replicates per treatment were used
and the reaction rate of ATCI hydrolysis and ChE activity were compared. The ChE activity was
measured as in section 4.1.2.3 and the protein content was determined as described in section
4.1.2.4.
4.1.2.5.5. Limit of quantitation
The limit of quantitation (LQ) is the reaction rate equivalent to ten times the standard
deviation of the measurement process (Newman, 1995), being specific to each particular assay.
The standard deviation of the measurement process was determined by plotting the standard
deviations of the reaction rates of substrate hydrolysis estimated for a series of six homogenate
supernatant dilutions (6.25, 12.5, 25, 50, 75 and 100%), which were replicated seven times per
assay and a minimum of three assays were performed.
Altogether, limits of quantitation were calculated for ChE assays with juveniles and adults
of P. ramosa kept as in section 4.1.2.2. Juveniles (≤ 72 h-old) were homogenized at 30 organisms
to 250 µL of buffer. Adult animals were raised until they were 7, 14 and 21 days-old and were

Resultados e discussão 75
homogenized in three homogenate dilutions: 20 organisms in 250 µL of buffer, 15 organisms in
300 µL of buffer and 15 organisms in 300 µL of buffer, respectively. The assays were performed
as in section 4.1.2.3. The choice of the number of organisms for this assay was based on the
results of the effect of the number of organisms and homogenate dilution on the substrate
hydrolysis (ATCI).
4.1.2.6. Data treatment and statistical analysis
Considering the effect of pH and molarity on measured reaction rate and the effect of
number of organisms and homogenate dilution on measured reaction rate and ChE activity, data
were first checked for the normality (Chi-squared test) and homogeneity (Bartlett’s test) of
distribution. All data fitted normal distribution and they were then analyzed by one-way analysis
of variance (ANOVA) followed by Tukey’s test to compare the differences among treatments
(Zar, 1996). Significance testing was performed on all data and, when applicable, significant
differences were indicated. In all statistical tests, significance was accepted when α ≤ 0.05.
For the analysis of effect of ATCI concentration on measured reaction rate, substrate
concentrations (X-intercept) were plotted against the reaction rates (Y-intercept). The maximum
velocity was obtained when the value of the reaction rate became constant.
Data of the measured reaction rate in function of enzyme concentration and limit of
quantitation (LQ) were analyzed by linear regression. In the case of LQ, the Y-intercept was
taken as the standard deviation of the measurement process and the higher value was adopted
and incorporated into the assay standard operating procedure.
The statistical analyses were carried out with the softwares Bioestat version 3.0 (Ayres et
al., 2003) and Toxstat version 3.3 (Gulley et al., 1991).
4.1.3. Results and Discussion
Since pH can affect ChE activity by changing the ionisation state of the active site or
changing the protein structure (Lehninger et al., 1993), in this study, the best pH value for buffers
was chosen in order to optimize assay conditions. The highest reaction rates for P. ramosa were
obtained with buffers of pH 8.0 (12.6 ± 0.5 mOD min-1) and pH 7.5 (11.7 ± 1.0 mOD min-1).
Acetylthiocholine hydrolysis was lower in buffers of pH 7.0 (9.7 ± 0.3 mOD min-1) and pH 6.5
(9.7 ± 0.6 mOD min-1) (F3,8 = 15.02; p = 0.0016) (Fig. 4.1.1). The mean value for the controls

Resultados e discussão 76
(blank assay) with the four buffers was 2.0 mOD min-1. The variation for control readings with
different pH buffers was not high (coefficient of variation = 21.3%).
Other authors (Day and Scott, 1990; Guilhermino et al., 1996a; Jemec et al., 2007; Sturm
and Hansen, 1999), that previously had made ChE assays with D. magna, have used buffers with
pH ranging from 7.0 to 7.5. However, the highest reaction rates for D.magna were obtained with
buffers of pH 7.5 and 8.0 (Printes, 2003). Our findings have indicated the same pattern for P.
ramosa. Thus, buffers with pH 8.0 should be chosen for the ChE assay with this tropical species.
0
2
4
6
8
10
12
14
6.5 7.0 7.5 8.0
pH of buffers
Rea
ctio
n r
ate
(mO
D m
in-1
)
a a
bb
Fig. 4.1.1 The effect of the pH of buffers on the rate of acetylthiocholine iodide hydrolysis (mOD min-1) in P. ramosa (mean for three replicates ± standard deviation). Columns with different letters indicate statistically significant differences (Tukey’s test, p ≤ 0.05)
In relation to the buffer molarity, similar reaction rates were obtained for P. ramosa when
comparing sodium phosphate buffer at 0.02 and 0.05 M (F1,4 = 0.07; p = 0.80). The reaction rates
were 13.0 ± 1.7 and 12.7 ± 1.0 mOD min-1, respectively (Fig. 4.1.2). Printes (2003) obtained the
same pattern for D. magna using buffers with the same molarities. Therefore, such conditions
were considered adequate and sodium phosphate buffers with molarities of 0.02 M were adopted
for the ChE assay with P. ramosa. Other authors, however, worked with different molarities. For
instance, Day and Scott (1990) worked with phosphate buffer at 0.05 M, Guilhermino et al.
(1996a, 1996b) used phosphate buffer at 0.1 M, Sturm and Hansen (1999) performed their assays
with Tris-HCl buffer at 0.1 M and Jemec et al. (2007) used potassium phosphate buffer at 0.1 M.

Resultados e discussão 77
0
2
4
6
8
10
12
14
16
0.02 0.05
Molarity of buffers (M)
Rea
ctio
n r
ate
(mO
D m
in-1
)
Fig. 4.1.2 The effect of the buffer molarity on the rate of acetylthiocholine iodide hydrolysis (mOD min-1) in P. ramosa (mean for three replicates ± standard deviation)
In the assay in which the reaction rate of substrate hydrolysis at different concentrations
of ATCI was evaluated, the curve obtained (Fig. 4.1.3) was consistent to Michaelis-Menten
kinetics (Palmer, 1985). For P. ramosa, the maximum reaction rate was achieved with 2 mM of
ATCI (initial concentration of 8 mM), whereas the maximum velocity (Vmax) was reached in the
reaction rate of substrate hydrolysis of 32 mOD min-1 (Fig. 4.1.3). Printes (2003) obtained similar
results for D. magna under the same assay conditions. Maximum reaction rate was achieved with
the final concentration of 0.5 mM of ATCI (initial concentration of 2 mM) and Vmax was
reached at 30 mOD min-1. This author adopted the final concentration of 4 mM of ATCI (initial
concentration of 16 mM), because this concentration was not limiting for the reaction rate of
substrate hydrolysis. In the case of P. ramosa, this final concentration of ATCI was also not
limiting for the reaction rate. Thus, in the ChE assay with P. ramosa, we recommend the same
final concentration of ATCI, i.e, 4 mM.
In other studies performed with D. magna, the final concentration of ATCI used in the
ChE assays varied greatly from 0.5 to 156 mM of ATCI (Day and Scott, 1990; Guilhermino et al.,
1996a, 1996b; Jemec et al., 2007; Sturm and Hansen, 1999).

Resultados e discussão 78
0
5
10
15
20
25
30
35
0 2 4 6 8 10
ATCI concentrations (mM)
Rea
ctio
n r
ate
(mO
D m
in-1
)
Fig. 4.1.3 The effect of the substrate concentration on the reaction rate of acetylthiocholine iodide hydrolysis (mOD min-1) in P. ramosa (mean for two replicates ± standard deviation)
By the linear regression analysis, reaction rates of substrate hydrolysis were directly
proportional to the protein concentrations (Fig. 4.1.4), confirming the linear kinetics for a
maximum reaction rate. It can be observed that the reaction rate of ATCI hydrolysis increases
with increasing protein concentration (F1,4 = 1097.1; p = 0.0003). The coefficient of
determination (R2) was 0.9964, i.e., 99.64% of the reaction rate can be explained by the protein
concentration. Therefore, the assay is sufficiently sensitive to detect very small changes in
enzymatic activity in P. ramosa. Fisher et al. (2000) and Printes (2003) obtained similar results for
the larvae of dipteran Chironomus riparius and the cladoceran D. magna, respectively. Both found a
direct relation between reaction rates of substrate hydrolysis and protein concentrations.

Resultados e discussão 79
y = 0.0865x - 2.6523R2 = 0.9964
0
5
10
15
20
25
30
35
0 50 100 150 200 250 300 350 400 450
Protein concentration (µg mL-1)
Rea
ctio
n r
ate
(mO
D m
in-1
)
Fig. 4.1.4 The effect of protein concentration on the reaction rate of acetylthiocholine iodide hydrolysis (mOD min-
1) in P. ramosa (mean for three replicates ± standard deviation)
The analysis on the effect of number of organisms on the reaction rate of substrate
hydrolysis (Table 4.1.1) indicated an increase in the reaction rates (mOD min-1) with increasing in
the number of organisms per homogenate for the pre-reproductive phase (3 days-old) (F3,8 =
65.9, p = 0.0001). For the ages in the reproductive phase (7, 14 and 21 days-old), reaction rates of
substrate hydrolysis for the same homogenate dilution were not always significantly highest with
the increase in the number of organisms (Table 4.1.1). However, the mean values were always
highest with the increase of the number of organisms (7 days-old in 250 µL: F2,6 = 18.2, p =
0.004; 7 days-old in 300 µL: F2,6 = 15.4, p = 0.005; 14 days-old in 300 µL: F2,6 = 3.2, p = 0.111;
14 days-old in 500 µL: F2,6 = 5.8, p = 0.03; 21 days-old in 300 µL: F2,6 = 22.2, p = 0.002; 21 days-
old in 600 µL: F2,6 = 24.4, p = 0.002). These results were probably found due to the presence of
eggs and embryos in the hatching chamber of the adult females of P. ramosa.
Printes (2003) obtained highest reaction rates of substrate hydrolysis in adult females of
D. magna with embryos in the hatching chamber when the reaction rates were compared with
those of adult females without embryos. Xuereb et al. (2009) obtained also highest reaction rates
when embryos in the latter stages of development were present in the marsupium of adult
females of the amphipod Gammarus fossarum. This occurred due to the increase of the amount of
ChE given by the embryos. Xuereb et al. (2009) found also that mature oocytes induced a
biological dilution of the fraction of enzyme during the process of homogenization. Therefore,
both oocytes and juveniles in the latter stages of development can be the reason for which the

Resultados e discussão 80
reaction rates of substrate hydrolysis in P. ramosa not always increased significantly with the
increase in the number of organisms. Thus, for ChE assay with P. ramosa, we recommend the use
of adult females of this species without the presence of eggs and/or embryos in the hatching
chamber in order to minimize any possible variability in the assay.
With respect to the analysis of the effect of the number of organisms on the ChE activity,
we observed that there was no statistically significant difference in the ChE activities for the same
dilutions when the number of organisms was increased (Table 4.1.1) (7 days-old in 250 µL: F2,6 =
1.1, p = 0.391; 7 days-old in 300 µL: F2,6 = 0.3, p = 0.733; 14 days-old in 300 µL: F2,6 = 1.8, p =
0.246; 14 days-old in 500 µL: F2,6 = 1.3, p = 0.339; 21 days-old in 300 µL: F2,6 = 4.7, p = 0.058;
21 days-old in 600 µL: F2,6 = 0.4, p = 0.663). The only exception was observed for organisms
with 3 days-old in which the smallest homogenate dilution (10: 250) was significantly different
from the others (F3,8 = 7.4, p = 0.011). This indicates lack of precision when working with a
reduced number of individuals at this stage.
No statistically significant difference was observed in the ChE activity when different
homogenate dilutions were used for the same number of organisms (Table 4.1.1) (for 7 days-old:
10 organisms (F1,4 = 0.25, p = 0.64), 15 organisms (F1,4 = 1.45, p = 0.30) and 20 organisms (F1,4 =
2.69, p = 0.18); for 14 days-old: 10 organisms (F1,4 = 5.96, p = 0.07), 15 organisms (F1,4 = 0.35, p
= 0.59) and 20 organisms (F1,4 = 2.36, p = 0.20); for 21 days-old: 10 organisms (F1,4 = 3.60, p =
0.13), 15 organisms (F1,4 = 0.02, p = 0.90) and 20 organisms (F1,4 = 0.76, p = 0.56)).
In the case of the reaction rates of substrate hydrolysis, significant differences were
observed when different homogenate dilutions were used for the same number of organisms,
except for three cases (for 7 days-old: 10 organisms (F1,4 = 2.34, p = 0.20), 15 organisms (F1,4 =
4.04, p = 0.11) and 20 organisms (F1,4 = 8.37, p = 0.04); for 14 days-old: 10 organisms (F1,4 =
13.99, p = 0.02), 15 organisms (F1,4 = 4.77, p = 0.09) and 20 organisms (F1,4 = 43.27, p = 0.004);
for 21 days-old: 10 organisms (F1,4 = 26.53, p = 0.008), 15 organisms (F1,4 = 15.61, p = 0.02) and
20 organisms (F1,4 = 95.09, p = 0.002)). Probably, eggs and/or embryos contained in the hatching
chamber of the adult females of P. ramosa contributed to that, in these three cases, no statistically
significant difference was found in the reaction rates for the different homogenate dilutions
tested. Again, we recommend the use of adult females without the presence of eggs and/or
embryos in the hatching chamber for the performance of ChE assays.
Although the variation in the number of organisms and effect of the dilution per
homogenate had no overall effect on the ChE activity of P. ramosa, the use of a larger number of
organisms per homogenate and a lower dilution increases the precision of the assay by the
increase in the measurement range. On the other hand, the use of a larger number of organisms

Resultados e discussão 81
increases the necessity of more organisms per replicate for the different treatments of the ChE
assay. Based on these considerations, we seek to use intermediate values for the reaction rates of
substrate hydrolysis, but without this choice interference in the precision of the method for ChE
measurements. Thus, for the performance of ChE assays, we recommend the use of 30
organisms with 3 days-old in 250 µL of buffer, 20 organisms with 7 days-old in 250 µL of buffer
and 15 organisms with both 14 and 21 days-old in 300 µL of buffer.
Table 4.1.1. Effect of the number of organisms and homogenate dilutions on the reaction rate of acetylthiocholine iodide hydrolysis and cholinesterases (ChE) activity in the P. ramosa assays (mean for three replicates ± standard deviation). Values with different letters mean statistical differences (Tukey’s test, p ≤ 0.05) Age (days) Homogenate dilutions
(number of animals/ µL) Reaction rate (mOD min-1)
ChE Activity (µM L-1 min-1g prot-1)
10: 250 4.11 ± 0.19ª 4.31 ± 0.91ª 20: 250 7.89 ± 0.69b 7.46 ± 1.24b
30: 250 13.33 ± 2.19c 7.72 ± 1.32b
3
40: 250 16.89 ± 0.77d 7.66 ± 0.63b
10: 250 6.11 ± 0.19a 5.79 ± 1.34a
15: 250 10.44 ± 1.95b 6.27 ± 1.15a
20: 250 14.56 ± 2.22b 5.02 ± 0.36a
10: 300 5.33 ± 0.88a 6.41 ± 1.64a 15: 300 7.89 ± 1.02a,b 5.64 ± 0.74a
7
20:300 10.22 ± 1.35b 6.38 ± 1.39a 14 10: 300 10.11 ± 1.68a 2.99 ± 0.21a 15: 300 17.78 ± 7.19a 3.53 ± 0.14a 20: 300 18.22 ± 1.95a 3.80 ± 0.89a 10: 500 6.33 ± 0.33a 3.72 ± 0.47a 15: 500 8.67 ± 1.15a,b 3.23 ± 0.88a 20: 500 9.11 ± 1.35b 2.78 ± 0.72a 21 10: 300 10.78 ± 1.35a 3.66 ± 0.10a 15: 300 15.78 ± 2.41b 4.96 ± 0.81a 20: 300 21.00 ± 1.73c 4.88 ± 0.57a 10: 600 6.56 ± 0.38a 4.72 ± 0.96a 15: 600 9.44 ± 1.35b 4.88 ± 0.76a 20: 600 11.22 ± 0.19b 5.31 ± 0.62a
The limit of quantitation (LQ) delimits the lowest reaction rate of substrate hydrolysis in
which readings lower than this limit are not considered accurate for measuring ChE activity. The
LQ is specific for each species and for each particular assay. In this study, for the species P.
ramosa, the limits of quantitation for the ChE assays were obtained for the number of organisms
and homogenate dilution defined in the experiment of the section 4.1.2.5.4. The LQ was of 1.419
mOD min-1 for juveniles with ≤ 72 h-old, 1.670 mOD min-1 for organisms with 7 days-old, 0.943
mOD min-1 for adults with 14 days-old and 0.797 mOD min-1 for adults with 21 days-old (Fig.
4.1.5). Assays with the same specificities of this study and with readings lower than the values of
reaction rates above cited must be disregarded.

Resultados e discussão 82
Fig. 4.1.5 Linear regression for standard deviations of the reaction rate estimated for a series of six homogenate supernatant dilutions (6.25%, 12.5%, 25%, 50%, 75% and 100%). From left to right (three assays): individuals of P.
ramosa with (A) ≤ 72 h-old, (B) 7 days-old, (C) 14 days-old and (D) 21 days-old
The enzymatic activity obtained for individuals of P. ramosa in this study was very
consistent, even when working with different homogenate concentrations (Table 4.1.1).
Differences among ChE activities in cladocerans can be attributed to the age of animals (Printes
and Callaghan, 2003), being the activities in juveniles higher than in adult individuals.
The ChE activity value in juveniles of P. ramosa (≤ 72 h-old) was similar to the values
found for D. magna when the same number of organisms per homogenate was used. Diamantino
et al. (2000, 2003) obtained a ChE activity around 9 µM L-1 min-1 g protein-1 for D. magna, whereas
Guilhermino et al. (2000) obtained an activity between 8 and 9 µM L-1 min-1 g protein-1 for the
same species. In this study, P. ramosa presented a ChE activity of 7.72 ± 1.32 µM L-1 min-1 g
protein-1.

Resultados e discussão 83
In relation to the other age classes (7, 14 and 21 days-old), P. ramosa presented enzymatic
activity values greater than individuals of D. magna with the same age. Printes (2003) found an
enzymatic activity of 0.47 µM L-1 min-1 g protein-1 for individuals of D. magna with 7 days-old (15
organisms per homogenate), whereas P. ramosa presented an enzymatic activity of 5.64 ± 0.74 µM
L-1 min-1 g protein-1. For individuals of D. magna with 21 days-old (20 organisms per
homogenate), Printes (2003) found an activity of 0.84 ± 0.04 µM L-1 min-1 g protein-1, whereas P.
ramosa presented an activity of 4.88 ± 0.57 µM L-1 min-1 g protein-1. These differences found
between the ChE activities in P. ramosa and D. magna are due to the fact that P. ramosa presents a
lower body protein content when compared to D. magna (data unpublished). Thus, when the
reaction rates of substrate hydrolysis are normalized by the protein content, a lower value of
enzyme activity is found for D. magna, because it has a higher protein content in relation to P.
ramosa. Such effect of protein on the expression of ChE activity in Daphnia species has been
previously demonstrated (Printes and Callaghan, 2003).
Thereby, we recommend that only the enzymatic activity values of the juveniles of P.
ramosa are directly compared with juveniles of D. magna. For other ages, the comparison should
be made with caution, always comparing the protein content among the two species.
4.1.4. Conclusions
The optimization of biochemical assays for measuring biomarkers in freshwater
invertebrates is a necessary step to verify if these assays are sufficiently robust to allow the
accurate measurements of a wide range of activity and subtle changes in the enzymatic inhibition.
The present analysis on the performance of ChE assays in P. ramosa showed that it is suitable for
quantifying ChE activity in this species. Furthermore, P. ramosa proved to be a good substitute for
the cladoceran D. magna from temperate regions, since juveniles of P. ramosa presented a ChE
activity similar to that obtained for the juveniles of D. magna in the same assay conditions.
Therefore, from the results obtained, it is possible to propose an assay protocol that gather the
best conditions for the use of ChE activity as a biochemical biomarker to be employed in the
aquatic toxicity studies from tropical regions.
Acknowledgments
We are grateful to the National Council of Scientific and Technological Development
(CNPq) for the financial support provided for this research project (No. 141095/2009-1).
Resultados e discussão 84
References
ABNT - Associação Brasileira de Normas Técnicas, 2009. Aquatic ecotoxicology - Acute Toxicity - Test with Daphnia spp (Cladocera, Crustacea). NBR 12713. Rio de Janeiro, pp. 23. ASTM, 2001. Standard guide for conducting acute toxicity testing on test materials with fishes, macroinvertebrates, and amphibians. West Conshohocken, PA: American Society for Testing and Materials. pp E729–E796. Ayres, M., Ayres Jr., M., Ayres, D.L., Santos, A.S., 2003. Bioestat 3.0 – Aplicações estatísticas nas áreas das ciências biológicas e médicas, third ed. Sociedade Civil Mamirauá, Conservation International, Pará. Brandorff, G.O., Koste, W., Smirnov, N.N., 1982. The composition and structure of rotiferan and crustacean communities of the lower rio Nhamundá, Amazonas, Brazil. Stud. Neotrop. Fauna Environ. 17, 69-121. Callaghan, A., Fisher, T.C., Grosso, A., Holloway, G.J., Crane, M., 2002. Effect of temperature and pirimiphos methyl on biochemical biomarkers in Chironomus riparius Meigen. Ecotoxicol. Environ. Saf. 52, 128-133. Day, K.E., Scott, I.M., 1990. Use of acetylcholinesterase activity to detect sublethal toxicity in stream invertebrates exposed to low concentrations of organophosphate insecticides. Aquat. Toxicol. 18, 101-114. Diamantino, T.C., Guilhermino, L., Almeida, E., Soares, A.M.V.M., 2000. Toxicity of sodium molybdate and sodium dichromate to Daphnia magna Straus evaluated in acute, chronic, and acetylcholinesterase inhibition tests. Ecotoxicol. Environ. Saf. 45, 253-259. Diamantino, T.C., Almeida, E., Soares, A.M.V.M., Guilhermino, L., 2003. Characterization of cholinesterases from Daphnia magna Straus and their inhibition by zinc. Bull. Environ. Contam. Toxicol. 71, 219-225. Do Hong, L.C., Slooten, K.B.-V., Tarradellas, J., 2004. Tropical ecotoxicity testing with Ceriodaphnia cornuta. Environ. Toxicol. 19, 497-504. Domingues, I., Agra, A.R., Monaghan, K., Soares, A.M.V.M., Nogueira, A., 2010. Cholinesterase and glutathione-s-transferase activities in freshwater invertebrates as biomarkers to assess pesticide contamination. Environ. Toxicol. Chem. 29, 5-18. Elías-Gutiérrez, M., Smirnov, N.N., Suárez-Morales, E., Dimas-Flores, N., 2001. New and little known cladocerans (Crustacea: Anomopoda) from southeastern Mexico. Hydrobiologia 442, 41-54. Ellman, G.L., Courtney, K.D., Andres Jr., V.A., Featherstone, R.M., 1961. A new and rapid colorimetric determination of acetylcholinesterase activity. Biochem. Pharmacol. 7, 88-95. Elmoor-Loureiro, L.M.A., 2007. Phytophilous cladocerans (Crustacea: Anomopoda and Ctenopoda) from Paraná River Valley, Goiás, Brazil. Rev. Bras. Zool. 24, 344-352.

Resultados e discussão 85
Fisher, T.C., Crane, M., Callaghan, A., 2000. An optimized microtiterplate assay to detect acetylcholinesterase activity in individual Chironomus riparius Meigen. Environ. Toxicol. Chem. 19, 1749-1752. Freitas, E.C., Rocha, O., 2006. The life cycle of Pseudosida ramosa, Daday 1904, an endemic neotropical cladoceran. Acta Limnol. Bras. 18, 293-303. Freitas, E.C., Rocha, O., 2011a. Acute toxicity tests with the tropical cladoceran Pseudosida ramosa: the importance of using native species as test organisms. Arch. Environ. Contam. Toxicol. 60, 241-249. Freitas, E.C., Rocha, O., 2011b. Acute and chronic effects of sodium and potassium on the tropical freshwater cladoceran Pseudosida ramosa. Ecotoxicology 20, 88-96. Freitas, E.C., Rocha, O., 2011c. Acute and chronic toxicity of chromium and cadmium to the tropical cladoceran Pseudosida ramosa and the implications for ecotoxicological studies. Environ. Toxicol. DOI 10.1002/tox. Freitas, E.C., Rocha, O., 2012. Acute and chronic effects of atrazine and sodium dodecyl sulfate on the tropical freshwater cladoceran Pseudosida ramosa. Ecotoxicology 21, 1347-1357. Guilhermino, L., Lopes, M.C., Carvalho, A.P., Soares, A.M.V.M., 1996a. Inhibition of acetylcholinesterase activity as effect criterion in acute tests with juvenile Daphnia magna. Chemosphere 32, 727-738. Guilhermino, L., Lopes, M.C., Carvalho, A.P., Soares, A.M.V.M., 1996b. Acetylcholinesterase activity in juvenile Daphnia magna Straus. Bull. Environ. Contam. Toxicol. 57, 979-985. Guilhermino, L., Lacerda, M.N., Nogueira, A.J.A., Soares, A.M.V.M., 2000. In vitro and in vivo inhibition of Daphnia magna acetylcholinesterase by surfactant agents: possible implications for contamination biomonitoring. Sci. Total Environ. 247, 137-141. Gulley, D.D., Boetter, A.M., Bergman, H.L., 1991. TOXSTAT Release 3.3. Laramie, University of Wyoming, pp. 19. Jemec, A., Drobne, D., Tišler, T., Trebše, P., Roš, M., Sepčić, K., 2007. The applicability of acetylcholinesterase and glutathione-s-transferase in Daphnia magna toxicity test. Comp. Biochem. Physiol., Part C: Toxicol. Pharmacol. 144, 303-309. Korovchinsky, N.M., 1992. Sididae and Holopedidae: guides to the identification of microinvertebrates of the continental waters of the world. SPB Academic Publishing, The Hague. Lansac-Tôha, F.A., Bonecker, C.C., Velho, L.F.M., Simões, N.R., Dias, J.D., Alves, G.M., Takahashi, E.M., 2009. Biodiversity of zooplankton communities in the upper Paraná River floodplain: inter-annual variation from long-term studies. Braz. J. Biol. 69, 539-549. Lehninger, A.L., Nelson, D.L., Cox, M.M., 1993. Principles of Biochemistry. Worth Publishers, New York.

Resultados e discussão 86
Maiphae, S., Pholpunthin, P., Dumont, H.J., 2005. Species richness of the Cladocera (Branchiopoda: Anomopoda and Ctenopoda) in southern Thailand, and its complementarity with neighboring regions. Hydrobiologia 537, 147-156. Morrone, J.J., Coscarón, S., 1998. Biodiversidad de artrópodos argentinos: una perspectiva biotaxonómica. Ediciones SUR, La Plata. Müller, H., 1972. Wachstum and phosphatbedarf von Nitzschia actinastroides (Lemn.) v. Goor in statischer und homokontiuierliecher kultur unter phosphatlimitierung. Arch. Hydrobiol. Suppl. 38, 399-484. Neves, I.F., Rocha, O., Roche, K.F., Pinto, A.A., 2003. Zooplankton community structure of two marginal lakes of the river Cuiabá (Mato Grosso, Brazil) with analysis of Rotifera and Cladocera diversity. Braz. J. Biol. 63, 329-343. Newman, M.C., 1995. Quantitative methods in aquatic ecotoxicology. Boca Raton, Lewis Publisher, Florida. OECD - Organization for Economic Cooperation and Development, 2004. Guideline for testing of chemicals. Daphnia sp., acute immobilisation test. OECD 202, Paris. OECD - Organization for Economic Cooperation and Development, 2008. Guidelines for testing of chemicals. Daphnia magna reproduction test. OECD 211, Paris. Palmer, T., 1985. Understanding enzymes, second ed. John Wiley & Sons, Chichester. Peakall, D., 1992. Animal biomarkers as pollution indicators, in: Depledge, M.H., Sanders, B. (Eds.), Biomarkers of the nervous system. Chapman & Hall, London, pp. 19-45. Printes, L.B., 2003. The value of acetylcholinesterase activity in Daphnia as a biomarker of environmental contamination. Thesis, University of Reading. pp. 237. Printes, L.B., Callaghan, A., 2003. Intraclonal variability in Daphnia acetylcholinesterase activity: the implications for its applicability as a biomarker. Environ. Toxicol. Chem. 22, 2042-2047. Printes, L.B., Callaghan, A., 2004. A comparative study on the relationship between acetylcholinesterase activity and acute toxicity in Daphnia magna exposed to anticholinesterase insecticides. Environ. Toxicol. Chem. 23, 1241-1247. Printes, L.B., Fellowes, M.D.E., Callaghan, A., 2008. Clonal variation in acetylcholinesterase biomarkers and life history traits following OP exposure in Daphnia magna. Ecotoxicol. Environ. Saf. 71, 519-526. Rand, M., 1995. Fundamentals of aquatic toxicology: effects, environmental fate, and risk assessment, second ed. Boca Raton, Taylor & Francis, Florida. Rey, J., Vasquez, E., 1986. Cladocères de quelques corps d’eaux du bassin moyen de l’Orénoque (Venezuela). Ann. Limnol. 22, 137-168. Roa, E.Z., Vasquez, W., 1991. Additional cladoceran records for Mantecal and new for Venezuela. Hydrobiologia 225, 45-62.
Resultados e discussão 87
Rocha, O., Güntzel, A., 1999. Branchiopoda, Cladocera, in: Ismael, D., Valenti, W.C., Matsumura-Tundisi, T., Rocha, O. (Eds.), Biodiversidade do Estado de São Paulo, Brasil: Síntese do conhecimento ao final do século XX. Fapesp, São Paulo, pp. 107-120. Sanoamuang, L.O., 1998. Contributions to the knowledge of the Cladocera of northeast Thailand. Hydrobiologia 362, 45-53. Smith, P.K., Krohn, R.I., Hermanson, G.T., Mallia, A.K., Gartner, F.H., Provenzano, M.D., Fujimoto, E.K., Goeke, N.M., Olson, B.J., Klenk, D.C., 1985. Measurement of protein using bicinchoninic acid. Anal. Biochem. 150, 76-85. Sturm, A., Hansen, P.D., 1999. Altered cholinesterase and monooxygenase levels in Daphnia magna and Chironomus riparius exposed to environmental pollutants. Ecotoxicol. Environ. Saf. 42, 9-15. Timbrell, J.A., Draper, R., Waterfield, C.J., 1996. Biomarker in toxicology: new uses for some old molecules? Biomarkers 1, 1-11. U.S. EPA – U.S. Environmental Protection Agency, 2002. Methods for measuring the acute toxicity of effluents and receiving waters to freshwater and marine organisms. Washington, DC. Varó, I., Navarro, J.C., Amat, F., Guilhermino, L., 2002. Characterisation of cholinesterases and evaluation of the inhibitory potential of chlorpyrifos and dichlorvos to Artemia salina and Artemia parthenogenetica. Chemosphere 48, 563-569. Xuereb, B., Chaumot, A., Mons, R., Garric, J., Geffard, O., 2009. Acetylcholinesterase activity in Gammarus fossarum (Crustacea Amphipoda): intrinsic variability, reference levels, and a reliable tool for field surveys. Aquat. Toxicol. 93, 225-233. Zar, J.H., 1996. Biostatistical analysis. Prentice-Hall, New Jersey.
Resultados e discussão 88
Capítulo 4.2. Acute effects of the anatoxin-a(s) extract and paraoxon-methyl on
freshwater cladocerans from tropical and temperate regions: links between the ChE
activity and survival and its implications for tropical ecotoxicological studies
Abstract – Cholinesterase (ChE) activity was measured in Pseudosida ramosa and Daphnia magna, which had previously
been exposed to the anatoxin-a(s) extract or to paraoxon-methyl for 48 h. These activities were then related to
survivorship in 48 h. For the anatoxin-a(s) extract, the 48-h LC50 found was 2.27 and 2.70x10⁶ cells mL-1, whereas for
paraoxon-methyl it was 0.60 and 2.17 µg L-1, respectively, for P. ramosa and D. magna. Dose-response relationships
were obtained for both P. ramosa and D. magna, when exposed to the anatoxin-a(s) extract or paraoxon-methyl. Thus,
when the tested concentrations of the toxicants increased, ChE activity and survival decreased. The ratio between
48-h IC50 for ChE and 48-h LC50 ranged from 75 to 81% for P. ramosa and from 77 to 81% for D. magna. This
indicated that the concentrations of both anatoxin-a(s) extract and paraoxon-methyl that cause 50% mortality also
inhibit ChE activity by 50%. Also, it was found that, for the P. ramosa, a 50% inhibition of ChE activity was
associated with a survival of 59.5 and 60.9%, respectively, for anatoxin-a(s) extract and paraoxon-methyl. However,
for the D. magna, at high levels of inhibition of ChE activity, almost no mortality was detected. In this specific case,
50% inhibition of the ChE activity was associated with 90.4 and 95.4% survival, respectively, for both anatoxin-a(s)
extract and paraoxon-methyl. In contrast, enzymatic inhibition slightly above 60%, had a strong detrimental effect on
survival in D. magna. These different patterns found in the relationship between ChE inhibition and survival are
possibly due to species-specific differences in the affinities of both acetylcholinesterase and pseudocholinesterases,
since the cladoceran ChE assays were performed with whole-body homogenates. In conclusion, for the use of ChE
as a biochemical biomarker in risk assessment of cyanobacterial neurotoxic blooms in tropical regions, it is strongly
recommended that native species are used, since our results revealed that P. ramosa was more sensitive than D. magna
for both the assay endpoints and both toxicants. Furthermore, the relationship between ChE activity and survival
had a species-specific response. Therefore, the use of the model species D. magna in acute toxicity tests and ChE
assays in tropical regions may overestimate the risk to local species.
Keywords: anatoxin-a(s); paraoxon-methyl; cholinesterases; biomarkers; Pseudosida ramosa; Daphnia magna
4.2.1. Introduction
As in many other countries around the world, a significant increase in the proliferation of
cyanobacterial blooms has been observed in Brazil, due mainly to the progressive enrichment of
its water bodies with nutrients in excess (Azevedo et al., 2002; Camargo and Alonso, 2006).
Considering that cyanobacteria can produce toxic secondary metabolites, such as hepatotoxins,
neurotoxins, cytotoxins, dermatotoxins and irritant toxins (Carmichael, 1992; Jochiminsen et al.,
1998; Wiegand and Pflugmacher, 2005), several government agencies have been giving increased
attention to these bloom events, especially in freshwater environments (Backer, 2002; Brazilian
Ministry of Health, 2003; WHO, 1998).

Resultados e discussão 89
In Brazil, several studies have shown that in freshwater bodies, hepatotoxins are more
widespread than neurotoxins (Azevedo et al., 1994; Ferrão-Filho et al., 2009; Matthiensen et al.,
2000; Vieira et al., 2005). Recently, however, some records of the presence of neurotoxins have
been documented (Lagos et al., 1999; Molica et al., 2005; Monserrat et al., 2001; Yunes et al.,
2003), further increasing concern about this group of cyanotoxins. Up to date, saxitoxins and
anatoxin-a(s) have been found in Brazilian freshwater bodies (Molica et al., 2005; Monserrat et al.,
2001; Sant’Anna et al., 2008).
The neurotoxins produced by cyanobacteria act in several ways on the nervous system
and are divided into three families: (1) anatoxin-a and homoanatoxin-a, which mimic the effect of
acetylcholine; (2) anatoxin-a(s), which is an anticholinesterase, and (3) saxitoxins, also known as
paralytic shellfish poisons (PSPs) in the marine literature, because they block nerve cell sodium
channels (Chorus and Bartram, 1999). The mode of action of anatoxin-a(s) is very similar to that
of synthetic pesticides, such as organophosphates (OPs) and carbamates. Cook et al. (1988, 1989)
observed that its capacity to inhibit AChE is comparable to that of paraoxon (an OP insecticide).
For a reliable risk assessment of the impact of cyanotoxins on aquatic organisms in a
given region, a set of data on their effects on local species must be gathered. Nevertheless, in
countries in tropical regions, the use of nonindigenous species for ecotoxicological assays is a
common practice, mainly because of a lack of standardized procedures with native species for
this purpose (Freitas and Rocha, 2011a). Since the sensitivity of autochthonous species to several
kinds of toxicants may differ considerably from that of nonindigenous species, the use of
standardized test organisms coming from temperate regions in tropical ecotoxicological assays
has been questioned (Do Hong et al., 2004; Freitas and Rocha, 2012a).
Cladocerans are an important component of phytoplankton-zooplankton-larval fish
interactions. They consume phytoplankton and are, in turn, heavily preyed on by larval fish
(Dettmers and Stein, 1992). The use of cladocerans in toxicity tests has many advantages,
including their ease of handling, the possibility of obtaining clones by parthenogenesis, their short
life cycle and high sensitivity to toxicants (Adema, 1978; Trayler and Davis, 1996). Among
cladocerans, the species Daphnia magna, originating from temperate regions, is a widely used test
organism in Ecotoxicology, while Pseudosida ramosa is a tropical species, with a wide distribution in
tropical and subtropical regions (Elías-Gutiérrez et al., 2001; Korovchinsky, 1992; Maiphae et al.,
2005; Morrone and Coscarón, 1998; Rey and Vasquez, 1986; Roa and Vasquez, 1991;
Sanoamuang, 1998), which is an autochthonous species in Brazil (Brandorff et al., 1982; Elmoor-
Loureiro, 2007; Freitas and Rocha, 2006; Lansac-Tôha et al., 2009; Neves et al., 2003; Rocha and
Güntzel, 1999). Some recent studies have shown that this tropical species is a good substitute for
Resultados e discussão 90
D. magna in conventional ecotoxicological assays (Freitas and Rocha, 2011a, 2011b, 2011c, 2012a,
2012b).
The use of biochemical biomarkers in environmental risk assessment (ERA) studies has
increased steadily in recent years (Adams, 2001). The cholinesterases (ChE), for example, are
widely used as a biomarker to detect the presence of anticholinesterase compounds, since such
toxicants act as non-competitive inhibitors of ChE activity, preventing these enzymes from
hydrolyzing the neurotransmitter acetylcholine (Mahmood and Carmichael, 1986). However, the
major challenge in using biochemical biomarkers for ERA studies is to establish a link between
the response of a biomarker and consequent damage at higher levels of biological organization
(Domingues et al., 2010; Sarkar et al., 2006). This is because the biomarker will only be
informative of exposure and not of effect if it cannot be linked to endpoints that have a clear
ecological significance (Scholz and Hopkins, 2006). Some studies, especially with regard to the
cladocerans from temperate regions, have attempted to establish relationships between the
inhibition of ChE activity and endpoints associated with higher levels of biological organization
(Duquesne, 2006; Jemec et al., 2007; Printes and Callaghan, 2004; Printes et al., 2008). However,
in tropical regions, such studies are still scarce (Moreira-Santos et al., 2005; Printes et al., 2011).
The main objective of this study was to investigate the use of ChE of P. ramosa as a
biomarker for anatoxin-a(s) in risk assessments of cyanobacterial blooms in tropical regions. To
this end, the performance of the ChE activity of P. ramosa as a biomarker was compared with that
of D. magna, a standardized laboratory species, and the relationship between inhibition of ChE
activity and survival was analysed in order to link a response at the single enzyme level with a
more ecologically relevant endpoint. Since the mode of action of anatoxin-a(s) is identical to that
of the organophosphate pesticide paraoxon, the effects of paraoxon-methyl on both P. ramosa
and D. magna were used as a reference in the acute toxicity tests and ChE assays.
4.2.2. Material and methods
4.2.2.1. Test organisms and culture conditions
The assays were carried out with individuals of Pseudosida ramosa and Daphnia magna.
Genetically identical organisms of P. ramosa were obtained from laboratory cultures, which have
been maintained since 2004 in our laboratory, whereas D. magna was kindly provided from
Beckhauser and Barros Laboratory, Blumenau, Santa Catarina State, Brazil.

Resultados e discussão 91
For the cultures of P. ramosa, about 70 individuals were maintained in 1,800 mL of ASTM
soft medium under a light: dark photoperiod of 12: 12 h at 25 ± 2oC. The ASTM soft medium
had a total hardness of 40-48 mg CaCO3 L-1, a pH ranging from 7.0 to 7.6 and an electrical
conductivity around 160 µS cm-1 (ASTM, 2001). In the cultures of D. magna, about 15 individuals
were maintained in 800 mL of ASTM hard medium under a light: dark photoperiod of 16: 8 h at
20 ± 2oC. The ASTM hard medium had a total hardness of 200-250 mg CaCO3 L-1, a pH ranging
from 8.0 to 8.4 and an electrical conductivity around 500 µS cm-1 (U.S.EPA, 2002). The culture
media for both species were renewed thrice weekly and were started with juveniles (≤ 24-h old)
isolated from parthenogenetic mothers. Only juveniles from the 3rd to the 5th brood were used to
establish new cultures and to perform of the acute toxicity tests and ChE assays. The cladoceran
cultures were fed with a suspension of the unicellular green alga Pseudokirchneriella subcapitata,
which was cultured in algal medium as described by Müller (1972). The algae were harvested in
exponential growth phase and centrifuged and the resulting pellet was resuspended in ASTM
medium. The animals were fed daily at a concentration of 1x10⁵ cells mL-1 (for P. ramosa) or 3x10⁵
cells mL-1 (for D. magna). A suspension of 0.05 mg L-1 (dry wt) of dried baker’s yeast was also
given as a food supplement, as recommended by the U.S.EPA (2002). During the assays, the
health and sensitivity of the cultures of P. ramosa and D. magna were checked by acute toxicity
tests with the reference substances sodium chloride and potassium dichromate, respectively. The
LC50 remained within the limits of the ranges of sensitivity specific to each species (Freitas and
Rocha, 2011a; OECD, 2004).
4.2.2.2. Chemicals and preparation of the test solutions
4.2.2.2.1. Anatoxin-a(s) extracts
The extracts of anatoxin-a(s) ((5S)-2-amino-1-((hydroxymethoxyphosphinyl)oxy)-N,N-
dimethyl-4,5-dihydro-1H-imidazole-5-methanamine, C7H17N4O4P, molecular weight 252.2, Fig.
4.2.1 A) were obtained from cultures of cyanobacterium Anabaena spiroides. The strain of A.
spiroides (ITEP-024) was isolated in 2002 from Tapacurá reservoir (Pernambuco, Brazil) by Dr.
Renato Molica (Technology Institute of Pernambuco, Brazil) and supplied by Dr. Sandra
Azevedo (Federal University of Rio de Janeiro). This strain produces only anatoxin-a(s), as
verified by liquid chromatography–mass spectrometry analysis (LC/MS) (Molica et al., 2005). The
filaments of A. spiroides were cultured in 6-L Erlenmeyer flasks containing 3 L of autoclaved
ASM-1 medium (Gorham et al., 1964), with the pH adjusted to 7.0-7.5. The cyanobacterial

Resultados e discussão 92
cultures were grown at 25 ± 2oC, with a light: dark photoperiod of 12: 12 h, in gently aerated
culture medium. At the late exponential phase of growth, filaments of A. spiroides were
concentrated in a continuous flow centrifuge at 5,500 g and 4oC. By the end of the centrifugation,
the algal medium had been completely replaced by distilled water. The cell density (cell mL-1) of
the concentrated filament suspension was then determined by examination under an optical
microscope (magnification 2,000 x) in a Sedgewick-Rafter chamber. After this, the direct
extraction method was used to release the intracellular anatoxin-a(s), since we wanted the extract
to be as natural as possible. This extraction method consisted in freezing the concentrated
suspension at –20oC and thawing at room temperature. The freeze/thaw cycle was repeated four
times and cell lysis was confirmed by direct observation by optical microscope. Finally, cellular
debris were removed by centrifuging at 10,000 g and 4oC for 25 min and only the supernatants
were used in assays. The nominal test concentrations were obtained by diluting the supernatants
in ASTM soft medium (for P. ramosa) or ASTM hard medium (for D. magna). Supernatants and
nominal test concentrations were made up immediately prior to the tests.
4.2.2.2.2. Paraoxon-methyl
Paraoxon-methyl PESTANAL (dimethyl-(4-nitrophenyl)-phosphate, C8H10NO6P,
molecular weight 247.1, Fig. 4.2.1 B), of analytical grade (>96%), was purchased from Sigma-
Aldrich. Stock solutions of 10 mg L-1 and 0.1 mg L-1 paraoxon-methyl were used for the acute
toxicity tests and ChE assays. The first stock solution (10 mg L-1) was prepared by dissolving a
weighed amount of the compound in analytical grade (99.5%) acetone (C3H6O, Merck) and the
second stock solution (0.1 mg L-1) was prepared from the first by diluting it in distilled water. The
nominal test concentrations were obtained by diluting the second stock solution in ASTM soft
medium (for P. ramosa) or ASTM hard medium (for D. magna). Stock solutions and nominal test
concentrations were made up immediately prior to the tests. In all experiments with paraoxon-
methyl, the maximum amount of acetone added to test medium was in up to 0.01% (v/v). Before
the acute toxicity tests and ChE assays were designed, a solution of acetone in ASTM medium
was tested to verify the absence of toxic effects on the organisms used in the experiments. The
acetone solution of 0.01% (v/v) did not show any toxic effect in either species (results not
shown).

Resultados e discussão 93
Fig. 4.2.1 Chemical structure of the molecules (A) anatoxin-a(s) and (B) paraoxon-methyl. Source: PubChem Compound
4.2.2.3. Chemical detection
There is a lack of commercially available analytical standards for anatoxin-a(s), which
hampers the development of specific methods for its direct quantitation. Thus, in this study, it
was not possible to measure anatoxin-a(s) in the tested extracts. However, as cited above, it has
been verified by LC/MS that this strain of A. spiroides produces anatoxin-a(s) (Molica et al., 2005).
Paraoxon-methyl was analyzed by reversed-phase HPLC (C18, 5 µm particle size, 25 cm x 4.6
mm ID column from Supelco, Bellefonte, PA) with a Hewlett Packard (Palo Alto, CA) model
1100 high-performance liquid chromatograph with a 1046A diode array detector. Methanol
(buffer A) and water/acetonitrile/phosphoric acid (buffer B) were used in an elution gradient
consisting of 40% buffer A/60% buffer B, flowing for 30 min at 1.4 mL min-1. The OP
compound was detected at the UV wavelength of 270 nm. The minimum level of detection of
paraoxon-methyl was 2.5 ng. Chemical analyses were performed at the lowest and highest tested
concentrations at the end of the acute toxicity tests and ChE assays.
4.2.2.4. Standard acute toxicity tests
Standard acute toxicity tests were carried out as recommended by Freitas and Rocha
(2011a) and OECD (2004) for the species P. ramosa and D. magna, respectively. The objective of

Resultados e discussão 94
these assays was to estimate the 1, 5, 10, 15 and 50% LCs (Lethal Concentrations) after 48-h of
exposure to the anatoxin-a(s) extract and paraoxon-methyl in order to determine test
concentrations for the assays of relationship between ChE activity and survival.
Definitive acute toxicity tests were carried out at the following nominal concentrations:
(1) for the anatoxin-a(s) extract: 0.5–5.0x10⁶ cells mL-1 for P. ramosa and 1.0–4.0x10⁶ cells mL-1 for
D. magna and (2) for the paraoxon-methyl: 0.1–1.6 µg L-1 for P. ramosa and 0.1–3.2 µg L-1 for D.
magna. The tested concentrations were based on preliminary range-finding tests. A total of three
acute toxicity tests were done for each toxicant and test organism. Briefly, aliquots of 10 mL of
each test concentration, 10 mL of ASTM medium (control) or, in the case of paraoxon-methyl,
10 mL of ASTM medium plus a nominal concentration of 0.01% acetone (v/v) (solvent control)
were placed in cell-culture plate wells with a capacity of 15 mL. Five neonates of P. ramosa or D.
magna (≤ 24-h old) were added to each well. Four replicates were used for each test concentration
and for the control and solvent control, totaling 20 test organisms per treatment. The assay
conditions of the acute toxicity tests were the same described for the culture conditions, except
that test organisms were not fed during the course of the experiment. The test recipients were
maintained for 48-h in total darkness, as recommended by the OECD (2004) for photosensitive
chemicals. Physical and chemical variables (pH, temperature, electrical conductivity, dissolved
oxygen and hardness) were measured at the beginning and end of the tests. At the end of the
acute toxicity tests, the organisms were observed under a stereomicroscope and the number of
dead individuals in the four replicates was counted. In this study, a dead individual was defined as
one showing no heartbeat on examination under the stereomicroscope (Day et al., 1993).
4.2.2.5. Relationship between ChE activity and survival
The mean values of three acute toxicity tests close to the estimated LC1 to LC50 for both
anatoxin-a(s) extract and paraoxon-methyl were used in mass exposure tests to measure the
relationship between ChE activity and survival. The following nominal concentration ranges were
used: (1) for the anatoxin-a(s) extract: 0.06–2.27x10⁶ cells mL-1 for P. ramosa and 1.88–2.70x10⁶
cells mL-1 for D. magna and (2) for the paraoxon-methyl: 0.08–0.60 µg L-1 for P. ramosa and 1.42–
2.17 µg L-1 for D. magna. A total of three mass exposure tests were carried out for each toxicant
and test organism. In these tests, twenty neonates (≤ 24-h old) of P. ramosa or D. magna were
placed in 50 mL glass beakers filled with 40 mL of each test concentration, 40 mL of ASTM
medium (control) or, in the case of paraoxon-methyl, 40 mL of ASTM medium plus a nominal
concentration of 0.01% acetone (v/v) (solvent control). The test concentrations, control and

Resultados e discussão 95
solvent control were prepared in 12 replicates (labeled 1.1, 1.2, 1.3, 1.4, 2.1, 2.2, 2.3, 2.4, 3.1, 3.2,
3.3 and 3.4). After a 48-h exposure period, in total darkness, dead organisms in each replicate
were counted and live organisms were collected for ChE assays. The assay conditions for the
mass exposure tests were the same as those described for the acute toxicity tests. The pH and
dissolved oxygen were measured at the beginning and end of the assays.
In the ChE assays, three replicates per treatment were assessed. Surviving animals from
the replicates 1.1, 1.2, 1.3 and 1.4; 2.1, 2.2, 2.3 and 2.4; and 3.1, 3.2, 3.3 and 3.4 were transferred
to 1.5 mL micro-centrifuge tubes labeled as 1, 2 and 3, respectively. Thirty surviving juveniles
were used for each replicate. All animals were dried on absorbent paper to remove all the liquid
remaining test medium before they were transferred to the micro-centrifuge tubes. Immediately
after their being transferred to the tubes, they were frozen by immersion in liquid nitrogen.
Individuals of P. ramosa and D. magna were stored for up to 3 months at –80ºC before the ChE
assays.
4.2.2.6. ChE assays
The ChE assay procedures were based on the generic assays reported by Freitas et al.
(Capítulo 4.1) and Printes and Callaghan (2004) for P. ramosa and D. magna, respectively. Pooled
frozen organisms, originating from the mass exposure tests, were homogenized in 1.5-mL micro-
centrifuge tubes with 25 µL of homogenizing buffer (ice-cold 0.02 M sodium phosphate buffer,
pH 8.0, with 1% Triton X-100). The manual homogenization was carried out with a
microcentrifuge tube pestle (40 cycles, 10 s), on ice, in a temperature-controlled room at 18oC. To
the initial homogenate, 225 µL of ice-cold 0.02M sodium phosphate buffer pH 8.0 was added,
whirlimixed and centrifuged at 14,000 g and 2-4°C for 4 min. Supernatants were subsequently
transferred to clean pre-cooled micro-centrifuge tubes, whirlimixed and assayed immediately.
Additions to the microtiter plate were made in the following order: 100 µL of 8 mM DTNB (D-
8130, Sigma-Aldrich) in sodium phosphate buffer, pH 8.0, supplemented with 0.75 mg mL-1 of
sodium hydrogen carbonate; 50 µL of blank buffer (sodium phosphate buffer, pH 8.0, containing
0.1% Triton-X-100) or 50 µL supernatant and 50 µL of 16 mM ATCI (A-5751, Sigma-Aldrich) in
sodium phosphate buffer, pH 8.0. The microtiter plate was inserted into the integral incubator of
a Dynex MRX microtiter plate reader (DYNEX Technologies, USA) and incubated at 30oC for 5
min. After this, the reaction rate (∆OD min-1) was measured at 405 nm and 30oC over a 10 min
period, with intermittent shaking between each reading cycle. In total, 21 cycles of measurements

Resultados e discussão 96
were performed. The enzyme activity was given in µmol L-1 min-1 g-1 protein and the normal
reaction rate of the blank assay was up to 3 mOD min-1.
The protein concentrations in the homogenates of both P. ramosa and D. magna were
estimated by the bicinchoninic acid (BCA) kinetic protein assay (Pierce, Rockford, IL, USA)
(Fisher et al., 2000; Smith et al., 1985) as described in previous works (Freitas et al., Capítulo 4.1;
Printes and Callaghan, 2004). The protein standard curve was prepared with a dilution series of
bovine serum albumin (BSA) (B14046, Pierce), with standards diluted in blank buffer with pH
8.0. The concentrations used were: 5, 25, 50, 125, 250 and 500 µg mL-1 for both species. The
normal reaction rate of the assay blank was 0.1 to 0.9 mOD min-1.
4.2.2.7. Data treatment and statistical analysis
The lethal concentrations to 1, 5, 10, 15 and 50% of the organisms (48-h LC1, LC5, LC10,
LC15 and LC50), for both P. ramosa and D. magna, were calculated by the Probit method (Probit
Program, version 1.5) (Finney, 1971), whereas median inhibition concentrations (48-h IC50;
concentration giving 50% of ChE activity) were estimated by nonlinear regression analysis
applied to the three-parameter logistic model (Systat, 2006).
The relationship between the inhibition of ChE activity and survival for P. ramosa was
established with the linear regression model, for exposure both to anatoxin-a(s) extract and to
paraoxon-methyl. On the other hand, for D. magna, this relationship was established by nonlinear
regression analysis applied to the three-parameter logistic model, for exposure both to anatoxin-
a(s) extract and to paraoxon-methyl (Systat, 2006).
All data were first checked for normality (χ2 test) and homogeneity (Bartlett’s test) of
distribution. Normal data were analyzed by one-way analysis of variance (ANOVA), followed by
a post hoc multiple comparisons Tukey test, when differences were found in the data. When the
normality test failed, either the Mann-Whitney test (comparison between control and solvent
control) or Kruskal-Wallis test (all other data) was used and multiple comparisons were made
with Dunn’s method (Systat, 2006). In all statistical tests, significance was accepted when α ≤
0.05.

Resultados e discussão 97
4.2.3. Results
4.2.3.1. Validity of the tests and abiotic variables
The chemical analysis of the lowest and highest tested concentrations of paraoxon-methyl
at the end of the acute toxicity tests and ChE assays showed that the actual find concentrations
were close to the expected nominal concentrations, within 90 to 99% (Table 4.2.1). Thus, all
concentrations were reported as nominal concentrations.
Table 4.2.1. Values of nominal and actual concentrations and percentage of variation between nominal and actual concentrations for the lowest and highest tested concentrations of paraoxon-methyl (µg L-1) at the end of both acute toxicity tests and ChE assays performed with P. ramosa and D. magna
Acute toxicity test Test organisms Nominal concentration Actual concentrationa % variation P. ramosa 0.1 0.092 (0.001) 92.0 1.6 1.584 (0.002) 99.0 D. magna 0.1 0.090 (0.001) 90.0 3.2 3.090 (0.055) 96.6 Test organisms ChE assay Nominal concentration Actual concentration % variation P. ramosa 0.08 0.073 (0.002) 91.3 0.60 0.582 (0.003) 97.0 D. magna 1.42 1.404 (0.005) 98.9 2.17 2.126 (0.010) 98.0
a Values are mean of three samples analysed and standard deviations are in brackets.
The mortality in the controls for all tests was less than 10%, as recommended by the
OECD (2004). Also, in the exposure to paraoxon-methyl, no significant statistical difference was
found between the control and solvent control for mortality (U = 4.5, P = 1.00 for both P. ramosa
and D. magna) and for ChE activity (F1,16 = 0.231, P = 0.637 for P. ramosa and F1,16 = 2.291, P =
0.150 for D. magna), respectively, in the acute toxicity tests and ChE assays.
During the acute toxicity tests, the measured pH of the test solutions ranged from 7.1 to
8.2 for P. ramosa and from 7.8 to 8.7 for D. magna. The pH did not vary by more than 1.0 unit for
the same tested concentration. The temperature ranged from 24.8 to 25.3oC for P. ramosa and
from 21.8 to 22.4oC for D. magna. The electrical conductivity ranged from 142 to 158 µS cm-1 for
P. ramosa and from 495 to 504 µS cm-1 for D. magna. The oxygen content of the test solutions was
above 7.2 mg L-1 in all tests with P. ramosa and above 7.1 mg L-1 in all tests with D. magna. Water
hardness ranged from 40 to 44 mg CaCO3 L-1 for P. ramosa and from 188 to 260 mg CaCO3 L
-1
for D. magna. In relation to ChE assays, the measured pH of the test solutions ranged from 7.1 to
8.2 for P. ramosa and from 7.8 to 8.7 for D. magna. The pH did not vary by more than 1.0 unit for
the same tested concentration. The oxygen content of the test solutions was above 7.1 mg L-1 in
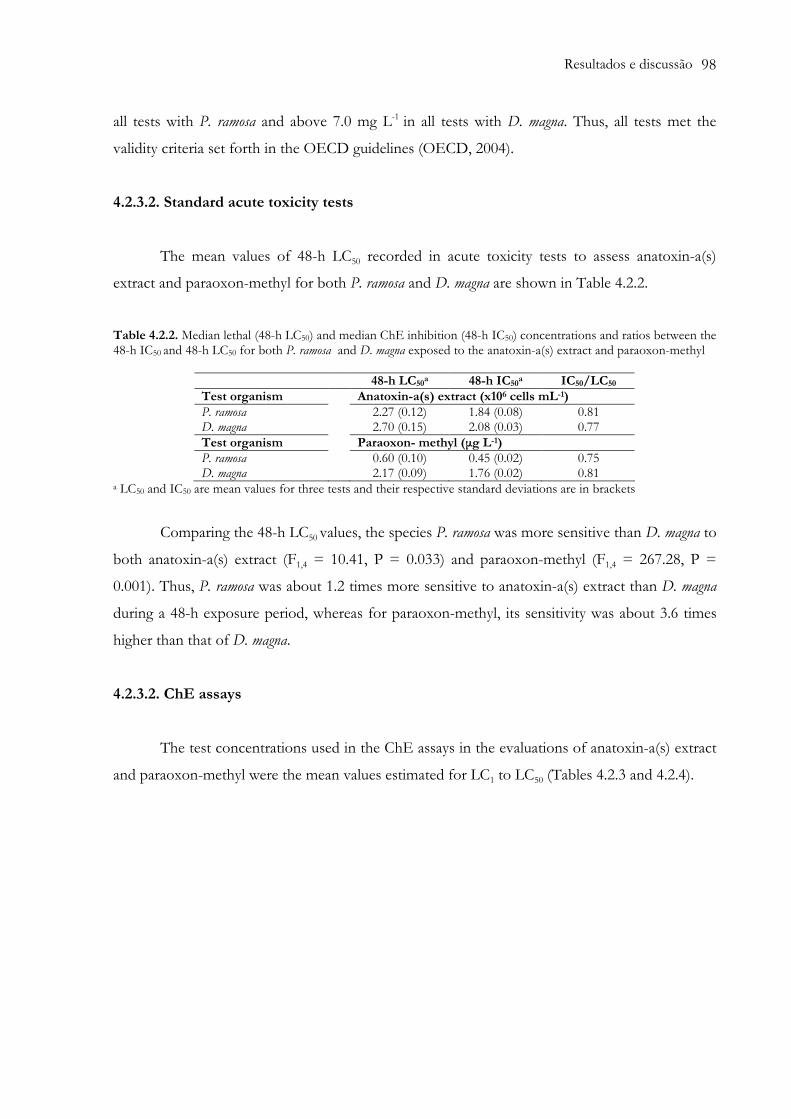
Resultados e discussão 98
all tests with P. ramosa and above 7.0 mg L-1 in all tests with D. magna. Thus, all tests met the
validity criteria set forth in the OECD guidelines (OECD, 2004).
4.2.3.2. Standard acute toxicity tests
The mean values of 48-h LC50 recorded in acute toxicity tests to assess anatoxin-a(s)
extract and paraoxon-methyl for both P. ramosa and D. magna are shown in Table 4.2.2.
Table 4.2.2. Median lethal (48-h LC50) and median ChE inhibition (48-h IC50) concentrations and ratios between the 48-h IC50 and 48-h LC50 for both P. ramosa and D. magna exposed to the anatoxin-a(s) extract and paraoxon-methyl
48-h LC50a 48-h IC50a IC50/LC50 Test organism Anatoxin-a(s) extract (x106 cells mL-1) P. ramosa 2.27 (0.12) 1.84 (0.08) 0.81 D. magna 2.70 (0.15) 2.08 (0.03) 0.77 Test organism Paraoxon- methyl (µg L-1) P. ramosa 0.60 (0.10) 0.45 (0.02) 0.75 D. magna 2.17 (0.09) 1.76 (0.02) 0.81
a LC50 and IC50 are mean values for three tests and their respective standard deviations are in brackets
Comparing the 48-h LC50 values, the species P. ramosa was more sensitive than D. magna to
both anatoxin-a(s) extract (F1,4 = 10.41, P = 0.033) and paraoxon-methyl (F1,4 = 267.28, P =
0.001). Thus, P. ramosa was about 1.2 times more sensitive to anatoxin-a(s) extract than D. magna
during a 48-h exposure period, whereas for paraoxon-methyl, its sensitivity was about 3.6 times
higher than that of D. magna.
4.2.3.2. ChE assays
The test concentrations used in the ChE assays in the evaluations of anatoxin-a(s) extract
and paraoxon-methyl were the mean values estimated for LC1 to LC50 (Tables 4.2.3 and 4.2.4).
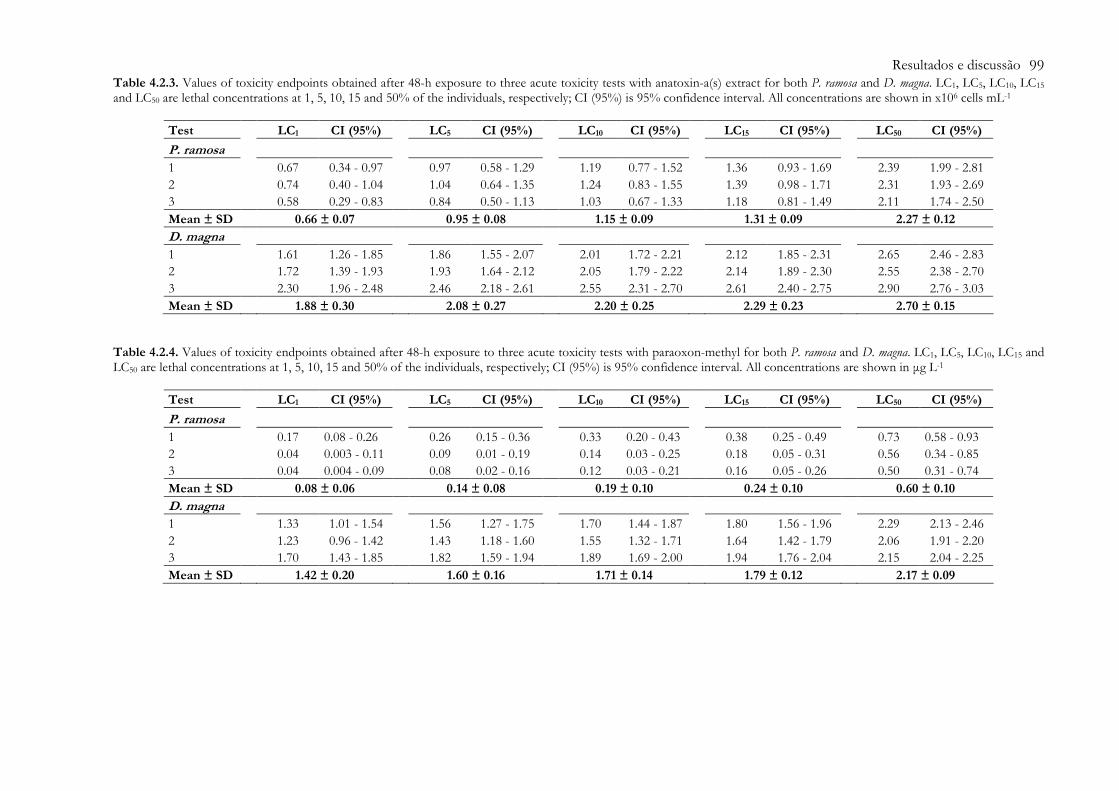
Resultados e discussão 99 Table 4.2.3. Values of toxicity endpoints obtained after 48-h exposure to three acute toxicity tests with anatoxin-a(s) extract for both P. ramosa and D. magna. LC1, LC5, LC10, LC15 and LC50 are lethal concentrations at 1, 5, 10, 15 and 50% of the individuals, respectively; CI (95%) is 95% confidence interval. All concentrations are shown in x106 cells mL-1
Test LC1 CI (95%) LC5 CI (95%) LC10 CI (95%) LC15 CI (95%) LC50 CI (95%)
P. ramosa 1 0.67 0.34 - 0.97 0.97 0.58 - 1.29 1.19 0.77 - 1.52 1.36 0.93 - 1.69 2.39 1.99 - 2.81 2 0.74 0.40 - 1.04 1.04 0.64 - 1.35 1.24 0.83 - 1.55 1.39 0.98 - 1.71 2.31 1.93 - 2.69 3 0.58 0.29 - 0.83 0.84 0.50 - 1.13 1.03 0.67 - 1.33 1.18 0.81 - 1.49 2.11 1.74 - 2.50 Mean ± SD 0.66 ± 0.07 0.95 ± 0.08 1.15 ± 0.09 1.31 ± 0.09 2.27 ± 0.12 D. magna 1 1.61 1.26 - 1.85 1.86 1.55 - 2.07 2.01 1.72 - 2.21 2.12 1.85 - 2.31 2.65 2.46 - 2.83 2 1.72 1.39 - 1.93 1.93 1.64 - 2.12 2.05 1.79 - 2.22 2.14 1.89 - 2.30 2.55 2.38 - 2.70 3 2.30 1.96 - 2.48 2.46 2.18 - 2.61 2.55 2.31 - 2.70 2.61 2.40 - 2.75 2.90 2.76 - 3.03 Mean ± SD 1.88 ± 0.30 2.08 ± 0.27 2.20 ± 0.25 2.29 ± 0.23 2.70 ± 0.15
Table 4.2.4. Values of toxicity endpoints obtained after 48-h exposure to three acute toxicity tests with paraoxon-methyl for both P. ramosa and D. magna. LC1, LC5, LC10, LC15 and LC50 are lethal concentrations at 1, 5, 10, 15 and 50% of the individuals, respectively; CI (95%) is 95% confidence interval. All concentrations are shown in µg L-1
Test LC1 CI (95%) LC5 CI (95%) LC10 CI (95%) LC15 CI (95%) LC50 CI (95%)
P. ramosa 1 0.17 0.08 - 0.26 0.26 0.15 - 0.36 0.33 0.20 - 0.43 0.38 0.25 - 0.49 0.73 0.58 - 0.93 2 0.04 0.003 - 0.11 0.09 0.01 - 0.19 0.14 0.03 - 0.25 0.18 0.05 - 0.31 0.56 0.34 - 0.85 3 0.04 0.004 - 0.09 0.08 0.02 - 0.16 0.12 0.03 - 0.21 0.16 0.05 - 0.26 0.50 0.31 - 0.74 Mean ± SD 0.08 ± 0.06 0.14 ± 0.08 0.19 ± 0.10 0.24 ± 0.10 0.60 ± 0.10 D. magna 1 1.33 1.01 - 1.54 1.56 1.27 - 1.75 1.70 1.44 - 1.87 1.80 1.56 - 1.96 2.29 2.13 - 2.46 2 1.23 0.96 - 1.42 1.43 1.18 - 1.60 1.55 1.32 - 1.71 1.64 1.42 - 1.79 2.06 1.91 - 2.20 3 1.70 1.43 - 1.85 1.82 1.59 - 1.94 1.89 1.69 - 2.00 1.94 1.76 - 2.04 2.15 2.04 - 2.25 Mean ± SD 1.42 ± 0.20 1.60 ± 0.16 1.71 ± 0.14 1.79 ± 0.12 2.17 ± 0.09

Resultados e discussão 100
A significant inhibition of the ChE activity was observed in relation to the control when
juveniles P. ramosa were exposed to the concentrations of 1.31x10⁶ and 2.27x10⁶ cells mL-1 of
anatoxin-a(s) extract (H = 40.74, P < 0.001) and 0.24 and 0.60 µg L-1 of paraoxon-methyl (H =
42.20, P < 0.001) (Fig. 4.2.2). The No Observed Effect Concentration (NOEC) and Lowest
Observed Effect Concentration (LOEC) values calculated for the anatoxin-a(s) extract were,
respectively, 1.15x10⁶ and 1.31x10⁶ cells mL-1. For paraoxon-methyl, NOEC and LOEC values
were 0.19 and 0.24 µg L-1, respectively. In tests with D. magna juveniles, significant inhibition of
ChE activity was observed at all tested concentrations of anatoxin-a(s) extract, i.e. from 1.88x10⁶
to 2.70 x10⁶ cells mL-1 (F5,53 = 164.71, P < 0.001). For paraoxon-methyl, ChE activity of D. magna
was significantly inhibited at 1.71, 1.79 and 2.17 µg L-1 (H = 52.52, P < 0.001) (Fig. 4.2.2). The
NOEC and LOEC values for anatoxin-a(s) extract could not be calculated, whereas for
paraoxon-methyl, the NOEC and LOEC values were 1.60 and 1.71 µg L-1, respectively.
Since the values of NOEC and LOEC for D. magna cannot be calculated for ChE activity
on exposure to the anatoxin-a(s) extract, we can only indicate that P. ramosa was more sensitive
than D. magna in relation to ChE activity. When both organisms were exposed to the paraoxon-
methyl, P. ramosa was more sensitive than D. magna with respect to NOEC and LOEC values.
Another noteworthy fact is that, for both anatoxin-a(s) extract and paraoxon-methyl, the
ChE assays were more sensitive than the acute toxicity tests. As can be seen in Fig. 4.2.2, lower
concentrations than those causing 50% mortality (48-h LC50) significantly inhibited ChE activity
in both P. ramosa and D. magna.

Resultados e discussão 101
Fig. 4.2.2 Cholinesterase (ChE) activity (mean of three assays ± standard deviation) in juveniles of P. ramosa and D. magna exposed to various concentrations of anatoxin-a(s) extract and paraoxon-methyl for 48-h exposure. Control and solvent control are represented by C and C+S, respectively. Asterisk indicates statistically significant difference from the control (Tukey’s test, P ≤ 0.05)
The 48-h IC50 values estimated for ChE activity in P. ramosa and D. magna in the mass
exposures to the anatoxin-a(s) extract and paraoxon-methyl are shown in Table 4.2.2. A
significant statistically difference was found between the 48-h IC50 for P. ramosa and D. magna
when exposed to the anatoxin-a(s) extract (F1,4 = 14.6, P = 0.019). For paraoxon-methyl, a
significant statistically difference was also found between P. ramosa and D. magna regarding the
values of 48-h IC50 (F1,4 = 4771.7, P < 0.001). Thus, the ChE activity of P. ramosa was about 1.1
time more sensitive than D. magna for exposure to the anatoxin-a(s) extract, whereas for
paraoxon-methyl, its sensitivity was about 3.9 times greater than that of D. magna.
4.2.3.3. Relationship between the ChE activity and survival
The IC50 values obtained during the mass exposures were related to the LC50 values
estimated in the conventional toxicity tests (Table 4.2.2). In relation to the anatoxin-a(s) extract, a
higher ratio of IC50/LC50 was found for P. ramosa (0.81) than for D. magna (0.77). On the other

Resultados e discussão 102
hand, for paraoxon-methyl, a higher ratio of IC50/LC50 was found for D. magna (0.81) than for P.
ramosa (0.75). Although these slight differences were observed between the different toxicants
and test organisms, the values of IC50/LC50 were all close to each other.
The effects of sub-lethal to lethal concentrations of the anatoxin-a(s) extract and
paraoxon-methyl on the ChE activity and survival for both P. ramosa and D. magna, after 48-h
mass exposure, are shown in Fig. 4.2.3. A dose-response relationship was demonstrated for both
P. ramosa (Fig. 4.2.3 A and C) and D. magna (Fig. 4.2.3 B and D). Thus, when the tested
concentration increased, ChE activity and survival decreased.
Fig. 4.2.3 Percentages of cholinesterase (ChE) activity and survival in Pseudosida ramosa (A and C) and Daphnia magna (B and D) when exposed to the anatoxin-a(s) extract and paraoxon-methyl for 48-h (mean for three assays ± standard deviation). Control and solvent control are represented by C and C+S, respectively
Direct relationships between the ChE inhibition and survival were observed for both P.
ramosa and D. magna exposed to the anatoxin-a(s) extract and paraoxon-methyl for 48-h (Fig.
4.2.4).
A statistically significant relationship was found between the ChE inhibition and survival
in P. ramosa, for both anatoxin-a(s) extract (F1,4 = 145.90, P = 0.0003) and paraoxon-methyl (F1,5

Resultados e discussão 103
= 234.81, P < 0.0001), with determination coefficients (R2) of 0.973 and 0.979, respectively. For
both toxicants, negative linear relationships were observed, i.e., the decrease in the survival was
directly proportional to the ChE inhibition. For anatoxin-a(s) extract, 50% mortality was linked
to 61.1% ChE inhibition (Fig. 4.2.4 A), while for paraoxon-methyl, 50% mortality was linked to
62.9% ChE inhibition (Fig. 4.2.4 C). In relation to D. magna, a statistically significant relationship
between the ChE inhibition and survival was again found for both anatoxin-a(s) extract (F1,4 =
150.89, P = 0.001) and paraoxon-methyl (F1,5 = 78.54, P = 0.0006), with R2 values of 0.990 and
0.975, respectively. However, unlike what was observed for P. ramosa, no linear relationship was
observed for D. magna. In this specific case, for exposure to either anatoxin-a(s) extract or
paraoxon-methyl, the ChE inhibition in D. magna followed the allosteric decay model with almost
no mortality up to high percentages of inhibition of ChE activity, followed by an accelerating
drop in survival associated with small increases in the ChE inhibition. For anatoxin-a(s) extract,
50% mortality was linked to 77.9% ChE inhibition (Fig. 4.2.4 B), while for paraoxon-methyl,
50% mortality was linked to 71.8% ChE inhibition (Fig. 4.2.4 D).

Resultados e discussão 104
Fig. 4.2.4 Relationship between the percentage of inhibition of cholinesterase (ChE) activity and percentage of survival in Pseudosida ramosa (A and C) and Daphnia magna (B and D), when exposed for 48-h to the anatoxin-a(s) extract (A and B) and paraoxon-methyl (C and D)
4.2.4. Discussion
Biomarkers such as ChE activity in vertebrates and, more recently, in invertebrates have
been continuously used to indicate the presence of anticholinesterase compounds in the
environment. However, the ability of correctly interpret these responses remains a challenge,
especially when tropical species are involved. This and other previous studies have demonstrated
that the ability to predict responses at higher level of biological organization from biomarker
responses depends on the variables considered (Day and Scott, 1990; Printes and Callaghan,
2004; Printes et al., 2008). The tropical cladoceran Pseudosida ramosa has shown a negative linear
relationship between the ChE inhibition and survival following exposure to a natural toxin
(anatoxin-a(s)) and to an OP pesticide (paraoxon-methyl), whereas the same was not found for
the well established temperate species Daphnia magna.

Resultados e discussão 105
With regard to acute toxicity data for the anatoxin-a(s) extract, no value was found in the
literature for 48-h LC50 for either P. ramosa or D. magna. Thus, we could not compare our results
with existing data. For the paraoxon-methyl, the mean value of 48-h LC50 (2.08–2.26 µg L-1)
recorded in this study for D. magna was consistent with some comparable studies available in the
literature. Duquesne (2006), for example, found a 48-h LC50 for D. magna ranging from 2.2 to 2.5
µg L-1, after 24-h exposure to paraoxon-methyl, whereas Barata et al. (2001) reported a 48-h LC50
for D. magna ranging from 1.5 to 2.5 µg L-1 of paraoxon-ethyl. Overall, the lethal effects caused
by 48-h exposure to paraoxon-methyl occur in the range 0.6 to 7.0 µg L-1, depending on the
Daphnia clone tested (Barata et al., 2001; UNEP, 2005). In contrast, Guilhermino et al. (1996)
observed a 48-h LC50 of 0.2 µg L-1 paraoxon-ethyl for D. magna, whereas Carvalho et al. (2003)
found a 48-h LC50 ranging from 0.51 to 0.53 µg L-1 paraoxon-ethyl. We believe that this
inconsistency in the results (a sensitivity about 10 times higher for Guilhermino’s clone) could be
due to genetic variability existing among the clones studied (Baird et al., 1989) and a higher
toxicity of the ethyl compound relative to the methyl compound (Duquesne and Küster, 2010).
The LC50 values indicated that P. ramosa was more sensitive than D. magna, both to
anatoxin-a(s) extract and to paraoxon-methyl. Some previous studies have shown that P. ramosa
has a higher sensitivity to various kinds of chemical, compared to D. magna (Freitas and Rocha,
2011a, 2011b, 2011c, 2012a). Based only on 48-h LC50, the temperate species D. magna was about
1.2 and 3.6 times more tolerant than the tropical species P. ramosa, respectively, to the anatoxin-
a(s) extract and paraoxon-methyl. Therefore, tests that assess acute toxicity in tropical regions
using the model species D. magna may overestimate the risk for local species.
Cholinesterases (ChE) are assumed to be the target enzymes for anticholinesterase
compounds. Persistent inhibition of the ChE active site causes disruption of nerve function,
leading to the death of the organism (Barata et al., 2001; Murphy, 1966). In this study, the effects
of anatoxin-a(s) extract and paraoxon-methyl on ChE activity were assessed in both P. ramosa and
D. magna.
With regard to ChE activity, the LOEC values found for exposure to paraoxon-methyl
were 0.24 and 1.71 µg L-1 for P. ramosa and D. magna, respectively. Here, once again, P. ramosa was
about 7.1 times more sensitive than D. magna. Since the LOEC value for D. magna could not be
calculated when it was exposed to the anatoxin-a(s) extract, we cannot perform any comparison
between P. ramosa and D. magna.
Unfortunately, for exposure to the anatoxin-a(s) extract, no data on 48-h IC50 for ChE
activity is available in the literature, for either P. ramosa or D. magna. In relation to paraoxon-
methyl, Duquesne (2006) found a 48-h IC50 for ChE activity of D. magna ranging from 2.1 to 4.2

Resultados e discussão 106
µg L-1, after 24-h of exposure to the chemical. This range was close to that found in this study
(48-h IC50 ranging from 1.74 to 1.78 µg L-1 for D. magna).
The IC50 values again indicated that P. ramosa was more sensitive than D. magna, for both
anatoxin-a(s) extract and paraoxon-methyl. Based on the 48-h IC50, the temperate species D.
magna was about 1.1 and 3.9 times more tolerant than the tropical species P. ramosa, respectively,
for the anatoxin-a(s) extract and paraoxon-methyl. Thus, as observed for acute toxicity tests, ChE
assays performed with the model species D. magna to assess the toxicity of anticholinesterase
compounds in tropical regions may overestimate the risk to local species.
After exposure of P. ramosa and D. magna to both anatoxin-a(s) extract and paraoxon-
methyl, both the ChE activity and survival were affected in a dose-dependent manner (Fig. 4.2.2
and 4.2.3). The ChE activity was inhibited at lower concentrations than survival in both P. ramosa
and D. magna (Fig. 4.2.2). In these specific cases, the relevance of ChE activity as a biomarker of
exposure to anticholinesterase compounds was confirmed, consistently with a number of studies
performed with D. magna exposed to various organophosphates (Barata et al., 2004; Duquesne,
2006; Printes and Callaghan, 2004; Sturm and Hansen, 1999). However, in other studies, no
inhibition of ChE activity was detected below the levels causing acute toxicity (Barata et al., 2001;
Day and Scott, 1990; Guilhermino et al., 1996). This may be due to differences in the general
susceptibility of different taxa to anticholinesterase compounds and interspecific differences in
the toxicology of a given compound (Day and Scott, 1990; Sturm and Hansen, 1999).
In this study, we find that the ratios between 48-h IC50 for ChE activity and 48-h LC50
ranged from 75 to 81% for P. ramosa and from 77 to 81% for D. magna (Table 4.2.2). This
indicates that the concentrations of both anatoxin-a(s) extract and paraoxon-methyl that cause
50% mortality also inhibit ChE activity by 50%. For the toxic action of anticholinesterase
compounds to be based on ChE inhibition, a toxic response such as mortality should occur at a
fixed species-specific level of ChE inhibition (Sturm and Hansen, 1999). Thus, variability in the
ratios of IC50/LC50 may be due to differences in the slopes of the dose-response curves for ChE
inhibition or may occur when different toxicants exert toxic effects other than ChE inhibition,
such as the inhibition of other esterases (Day and Scott, 1990; Sturm and Hansen, 1999).
Generally, ChE inhibition exceeding 50% is taken to constitute an acutely life-threatening
situation (Barata et al., 2001; Duquesne, 2006; Ludke et al., 1975; Sturm and Hansen, 1999). In
some studies with aquatic invertebrates, inhibition of ChE activity after exposure to
anticholinesterase compounds varied from 40 to 100% (Abdullah et al., 1994; Bocquené et al.,
1991; Escartín and Porte, 1996; Printes and Callaghan, 2004). Barata et al. (2004) found that

Resultados e discussão 107
exposure to organophosphates or chemicals with a similar mode of action, such as anatoxin-a(s),
affect the survival at higher levels of ChE inhibition.
Biochemical biomarkers have been suggested as indicators of chemical exposure and sub-
lethal effects for different reasons (Sturm and Hansen, 1999). Since it is assumed that toxicity is
initially mediated by biochemical processes, a response at the biochemical level should
theoretically precede effects at higher levels of biological organization, such as whole organisms
(Adams et al., 1989). Despite the importance of these studies to the applicability of biochemical
biomarkers in environmental risk assessment, the correpondence between patterns of inhibition
of ChE activity and the likelihood of survival has only been described in a few species, mainly D.
magna (Barata et al., 2001, 2004; Day and Scott, 1990; Duquesne, 2006; Jemec et al., 2007; Printes
and Callaghan, 2004; Printes et al., 2008; Sturm and Hansen, 1999). In the present study, the ChE
inhibition was linked to survival in both P. ramosa and D. magna exposed to anatoxin-a(s) extract
and paraoxon-methyl.
The plot of ChE inhibition against survival revealed significant differences between the
two cladocerans studied in the relationship between the enzymatic target and acute toxicity (Fig.
4.2.4). For P. ramosa, in both the anatoxin-a(s) extract and paraoxon-methyl tests, very similar
negative linear relationships were found between the ChE inhibition and survival. Thus, a 50%
ChE inhibition was related to 59.5 and 60.9% survival, respectively, for anatoxin-a(s) extract and
paraoxon-methyl. However, for D. magna, the ChE activity was strongly inhibited with practically
no effect on survival; a 50% ChE inhibition was related to 90.4 and 95.4% survival, respectively,
for anatoxin-a(s) extract and paraoxon-methyl. On the other hand, above 60% ChE inhibition, a
rapid decrease in survival was related to a small increase in ChE inhibition. Previous studies with
D. magna have shown that high levels of inhibition of ChE activity were not always directly
associated with mortality, when this daphnid was exposed to anticholinesterase compounds
(Barata et al., 2001, 2004; Printes and Callaghan, 2004; Sturm and Hansen, 1999).
Owing to their small size, assays of ChE in cladocerans must be performed with whole-
body homogenates. Therefore, reaction mixture used for the ChE assays may have both
acetylcholinesterase (AChE) and pseudocholinesterases (PChE). Indeed, Diamantino et al. (2003)
found that cholinesterases in whole-body homogenates of D. magna showed characteristics not
only of AChE, but also of PChE.
In this study, the different patterns for the relationship between the inhibition of ChE
activity and survival found in P. ramosa and D. magna may be due to species-specific differences in
the affinities of both AChE and PChE. We hypothesize that, in P. ramosa, AChE and PChE had
similar affinities for the toxicants studied. Thus, they were equally inhibited and a direct linear

Resultados e discussão 108
relationship was obtained between the inhibition of ChE activity and survival. In contrast, in D.
magna, PChE probably had a higher affinity for the toxicants than AChE, thus reducing the
amount of free anticholinesterase compound available to inhibit AChE. This may have given a
protective effect, enhancing the survival of D. magna. Barata et al. (2004) found that
carboxylesterase, a nonspecific PChE, has a protective function against anticholinesterase
compounds. These authors observed that carboxylesterase was about 50 times more active than
AChE, indicating a great potential for the sequestering of anticholinesterase compounds and,
hence, acted to protect the organism against the inhibition of AChE. Higher affinities of PChE
than of AChE have also been reported for rats, fish and mussels (Boone and Chambers, 1996;
Chambers and Chambers, 1990; Escartín and Porte, 1997). With rising inhibitor level, when all
target sites on PChE were saturated by the toxicant, the protective effect afforded by PChE to
the AChE molecules was lost and fast rise in mortality could then be associated with a small
increasing in the inhibition of ChE activity.
4.2.5. Conclusions
In this study, it was shown that P. ramosa was more sensitive than D. magna for both of
the endpoints assessed (acute toxicity and ChE activity) and both toxicants (anatoxin-a(s) extract
and paraoxon-methyl). Thus, the use of non-indigenous species such as D. magna in
ecotoxicological assessments in tropical regions could overestimate the risk for native species.
When the relationship between the inhibition of ChE activity and survival was evaluated,
different responses were observed between the two species, but not between the toxicants.
Similar response profiles for the toxicants was to be expected, since they share the same mode of
action and fairly similar molecular structures.
The inhibition of ChE activity in both P. ramosa and D. magna exposed to anatoxin-a(s)
extract and paraoxon-methyl proved to be a good indicator of exposure. In addition, for P.
ramosa, ChE inhibition showed a well-defined linear relationship with survival, therefore being as
well a good indicator of effect. On the other hand, for D. magna, this relationship was not linear,
high levels of ChE inhibition (up to 50%) being associated with almost no mortality (> 90%
survival). Therefore, when ChE is used as a biochemical biomarker in the risk assessment of
cyanobacterial neurotoxic blooms in tropical regions, it is strongly recommended that the native
species be used, since the linear relationship between the ChE activity and survival was species-
specific and P. ramosa was the more sensitive cladoceran.

Resultados e discussão 109
Acknowledgments
We are grateful to the National Council of Scientific and Technological Development
(CNPq) for the financial support provided for this research project (No. 141095/2009-1).

Resultados e discussão 110
References
Abdullah, A.R., Kumar, A., Chapman, J.C., 1994. Inhibition of acetylcholinesterase in the Australian freshwater shrimp (Paratya australiensis) by profenfos. Environ. Toxicol. Chem. 13, 1861-1866. Adams, S.M., Shepard, K.L., Greeley, M.S.J., Jimenez, B.D., Ryon, M.G., Shugart, L.R., McCarthy, J.F., 1989. The use of bioindicators for assessing the effects of pollutant stress on fish. Mar. Environ. Res. 28, 459-464. Adams, S.M., Giesey, J.P., Tremblay, L.A., Eason, C.T., 2001. The use of biomarkers in ecological risk assessment: recommendations from the Christchurch conference on biomarkers in ecotoxicology. Biomarkers 6, 1-6. Adema, D.M.M., 1978. Daphnia magna as a test animal in acute and chronic toxicity tests. Hydrobiologia 59, 125-134. ASTM, 2001. Standard guide for conducting acute toxicity testing on test materials with fishes, macroinvertebrates, and amphibians. American Society for Testing and Materials, West Conshohocken, PA, pp. E729-E796. Azevedo, S.M.F.O., Evans, W.R., Carmichael, W.W., Namikoshi, M., 1994. First report of microcystins from a Brazilian isolate of the cyanobacterium Microcystis aeruginosa. J. Appl. Phycol. 6, 261-265. Azevedo, S.M.F.O., Carmichael, W.W., Jochimsen, E.M., Rinehart, K.L., Lau, S., Shaw, G.R., Eaglesham, G.K., 2002. Human intoxication by microcystins during renal dialysis treatment in Caruaru-Brazil. Toxicology 181-182, 441-446. Backer, L.C., 2002. Cyanobacterial harmful algal blooms: developing a public health response. Lake Reserv. Manage. 18(1), 20-31. Baird, D.J., Barber, I., Bradley, M., Calow, P., Soares, A.M.V.M., 1989. The Daphnia bioassay: a critique. Hydrobiologia 188/189, 403-406. Barata, C., Baird, D.J., Soares, A.M.V.M., Guilhermino, L., 2001. Biochemical factors contributing to response variation among resistant and sensitive clones of Daphnia magna straus exposed to ethyl parathion. Ecotox. Environ. Safe. 49, 155-163. Barata, C., Solayan, A., Porte, C., 2004. Role of B-esterases in assessing toxicity of organophosphorus (chlorpyrifos, malathion) and carbamate (carbofuran) pesticides to Daphnia magna. Aquat. Toxicol. 66, 125-139. Bocquené, G., Galgani, F., Truquet, P., 1991. Acetylcholinesterase activity in the common prawn (Palaemon serratus) contaminated by carbaryl and phosalone: choice of a method for detection of effects. Ecotox. Environ. Safe. 22, 337-344. Boone, J.S., Chambers, J.E., 1996. Time course of inhibition of cholinesterase and aliesterase activities, an non-protein sulfhydryl levels following exposure to organophosphorus insecticides in mosquitofish (Gambusia affinis). Fund. Appl. Toxicol. 29, 202-207.

Resultados e discussão 111
Brandorff, G.O., Koste, W., Smirnov, N.N., 1982. The composition and structure of rotiferan and crustacean communities of the lower rio Nhamundá, Amazonas, Brazil. Stud. Neotrop. Fauna Environ. 17(2-3), 69-121. Brazilian Ministry of Health, 2003. Cianobactérias tóxicas na água para consumo humano na saúde pública e processos de remoção em água para consumo humano. Fundação Nacional de Saúde, Brasília, pp. 56. Camargo, J.A., Alonso, A., 2006. Ecological and toxicological effects of inorganic nitrogen pollution in aquatic ecosystems: a global assessment. Environ. Int. 32, 831-849. Carmichael, W.W., 1992. Cyanobacteria secondary metabolites – the cyanotoxins. J. Appl. Bacteriol. 72, 445-459. Carvalho, F.D., Machado, I., Sánchez-Martínez, M., Soares, A., Guilhermino, L., 2003. Use of atropine-treated Daphnia magna survival for detection of environmental contamination by acetylcholinesterase inhibitors. Ecotox. Environ. Safe. 53, 43-46. Chambers, J.E., Chambers, H.W., 1990. Time course of inhibition of acethylcholinesterase and aliesterases following parathion and paraoxon exposure in rats. Toxicol. Appl. Pharm. 103, 420-429. Chorus, I., Bartram, J., 1999. Toxic cyanobacteria in water. A guide to their public health consequences, monitoring and management. E & FN SPON, New York. Cook, W.O., Beasley, V.R., Dahlem, A.M., Dellinger, J.A., Harlin, K.S., Carmichael, W.W., 1988. Comparison of effects of anatoxin-a(s) and paraoxon, physostigmine and pyridostigmine on mouse-brain cholinesterase activity. Toxicon 26(8), 750-753. Cook, W.O., Dellinger, J.A., Singh, S.S., Dahlem, A.M., Carmichael, W.W., Beasley, V.R., 1989. Regional brain cholinesterase activity in rats injected intraperitoneally with anatoxin-a(s) or paraoxon. Toxicol. Lett. 49(1), 29-34. Day, K.E., Scott, I.A., 1990. Use of acetylcholinesterase activity to detect sublethal toxicity in stream invertebrates exposed to low concentrations of organophosphate insecticides. Aquat. Toxicol. 18, 101-114. Day, K.E., Holtze, K.E., Metcalfe-Smith, J.L., Bishop, C.T., Dutka, B.J., 1993. Toxicity of leachate from automobile tires to aquatic biota. Chemosphere 27, 665-675. Dettmers, J.M., Stein, R.A., 1992. Food consumption by larval gizzard shad: zooplankton effects and implications for reservoir communities. T. Am. Fish Soc. 121, 494-507. Diamantino, T.C., Almeida, E., Soares, A.M.V.M., Guilhermino, L., 2003. Characterization of cholinesterases from Daphnia magna Strauss and its inhibition by zinc. B. Environ. Contam. Tox. 71, 219-225. Do Hong, L.C., Becker-Van Slooten, K., Tarradellas, J., 2004. Tropical ecotoxicity testing with Ceriodaphnia cornuta. Environ. Toxicol. 19, 497-504.

Resultados e discussão 112
Domingues, I., Agra, A.R., Monaghan, K., Soares, A.M.V.M., Nogueira, A.J.A., 2010. Cholinesterase and glutathione-S-transferase activities in freshwater invertebrates as biomarkers to assess pesticide contamination. Environ. Toxicol. Chem. 29(1), 5-18. Duquesne, S., 2006. Effects of an organophosphate on Daphnia magna at suborganismal and organismal levels: implications for population dynamics. Ecotox. Environ. Safe. 65, 145-150. Duquesne, S., Küster, E., 2010. Biochemical, metabolic, and behavioural responses and recovery of Daphnia magna after exposure to an organophosphate. Ecotox. Environ. Safe. 73, 353-359. Elías-Gutiérrez, M., Smirnov, N.N., Suárez-Morales, E., Dimas-Flores, N., 2001. New and little known cladocerans (Crustacea: Anomopoda) from southeastern Mexico. Hydrobiologia 442(1-3), 41-54. Elmoor-Loureiro, L.M.A., 2007. Phytophilous cladocerans (Crustacea: Anomopoda and Ctenopoda) from Paranã River Valley, Goiás, Brazil. Rev. Bras. Zool. 24(2), 344-352. Escartín, E., Porte, C., 1996. Acetylcholinesterase inhibition in the crayfish Procambarus clarkii exposed to fenitrothion. Ecotox. Environ. Safe. 34, 160-164. Escartín, E., Porte, C., 1997. The use of cholinesterase and carboxylesterase activities from Mytilus galloprovincialis in pollution monitoring. Environ. Toxicol. Chem. 16, 2090-2095. Ferrão-Filho, A.S., Soares, M.C., Magalhães, V.F., Azevedo, S.M.F.O., 2009. Biomonitoring of cyanotoxins in two tropical reservoirs by cladoceran toxicity bioassays. Ecotox. Environ. Safe. 72, 479-489. Finney, D.J., 1971. Probit Analysis, third ed. Cambridge University Press, Cambridge. Fisher, T.C., Crane, M., Callaghan, A., 2000. An optimized microtiterplate assay to detect acetylcholinesterase activity in individual Chironomus riparius Meigen. Environ. Toxicol. Chem. 19, 1749-1752. Freitas, E.C., Rocha, O., 2006. The life cycle of Pseudosida ramosa, Daday 1904, an endemic neotropical cladoceran. Acta Limnol. Bras. 18(34), 293-303. Freitas, E.C., Rocha, O., 2011a. Acute toxicity tests with the tropical cladoceran Pseudosida ramosa: the importance of using native species as test organisms. Arch. Environ. Con. Tox. 60, 241-249. Freitas, E.C., Rocha, O., 2011b. Acute and chronic effects of sodium and potassium on the tropical freshwater cladoceran Pseudosida ramosa. Ecotoxicology 20, 88-96. Freitas, E.C., Rocha, O., 2011c. Acute and chronic toxicity of chromium and cadmium to the tropical cladoceran Pseudosida ramosa and the implications for ecotoxicological studies. Environ. Toxicol. DOI 10.1002/tox Freitas, E.C., Rocha, O., 2012a. Acute and chronic effects of atrazine and sodium dodecyl sulfate on the tropical freshwater cladoceran Pseudosida ramosa. Ecotoxicology 21, 1347-1357. Freitas, E.C., Rocha, O., 2012b. Effects of sodium and potassium on life history parameters of freshwater cladoceran Pseudosida ramosa. J. Braz. Soc. Ecotoxicol.. 7(2), 85-91.

Resultados e discussão 113
Freitas, E.C., Printes, L.B., Fernandes, M.N., Rocha, O. Capítulo 4.1. Measurements of cholinesterases activity in the tropical freshwater cladoceran Pseudosida ramosa and its standardization as a biomarker. Submitted to Chemosphere. Gorham, P.R., McLachlan, J., Hammer, U.T., Dim, W.K., 1964. Isolation and culture of toxic strain of Anabaena flos-aquae (Lyngb.) de Bréb. Verh. Internat. Verein Limnol. 15, 796-804. Guilhermino, L., Lopes, M.C., Carvalho, A.P., Soares, A.M.V.M., 1996. Inhibition of acethylcholinesterase activity as effect criterion in acute tests with juvenile Daphnia magna. Chemosphere 32, 727-738. Jemec, A., Drobne, D., Tišler, T., Trebše, P., Roš, M., Sepčić, K., 2007. The applicability of acetylcholinesterase and glutathione S-transferase in Daphnia magna toxicity test. Comp. Biochem. Phys. C 144, 303-309. Jochiminsen, E.M., Carmichael, W.W., An, J.S., Cardo, D.M., Cookson, S.T., Holmes, C.E., Antunes, M.B., De Mello Filho, D.A., Lyra, T.M., Barreto, V.S., Azevedo, S.M., Jarvis, W.R., 1998. Liver failure and death after exposure to microcystins at a hemodialysis center in Brazil. N. Engl. J. Med. 338(13), 873-878. Korovchinsky, N.M., 1992. Sididae and Holopedidae: guides to the identification of microinvertebrates of the continental waters of the world. SPB Academic Publishing, The Hague. Lagos, N., Onodera, H., Zagatto, P.A., Andrinolo, D., Azevedo, S.M.F.O., Oshima, Y., 1999. The first evidence of paralytic shellfish toxins in the freshwater cyanobacterium Cylindrospermopsis raciborskii, isolated from Brazil. Toxicon 37, 1359-1373. Lansac-Tôha, F.A., Bonecker, C.C., Velho, L.F.M., Simões, N.R., Dias, J.D., Alves, G.M., Takahashi, E.M., 2009. Biodiversity of zooplankton communities in the upper Paraná River floodplain: inter-annual variation from long-term studies. Braz. J. Biol. 69(2), 539-549. Ludke, J.L., Hill, E.F., Dieter, M.P., 1975. Cholinesterase (ChE) response and related mortality among birds fed ChE inhibitors. Arch. Environ. Cont. Tox. 3, 1-21. Mahmood, N.A., Carmichael, W.W., 1986. The pharmacology of anatoxin-a(s), a neurotoxin produced by the freshwater cyanobacterium Anabaena flos-aquae NRC 525-17. Toxicon 24, 425-434. Maiphae, S., Pholpunthin, P., Dumont, H.J., 2005. Species richness of the cladocera (Branchiopoda: Anomopoda and Ctenopoda) in southern Thailand, and its complementarity with neighboring regions. Hydrobiologia 537, 147-156. Matthiensen, A., Beattie, K.A., Yunes, J.S., Kaya, K., Codd, G.A., 2000. [D-Leu(1)]microcystin-LR, from the cyanobacterium Microcystis RST 9501 and from a Microcystis bloom in the Patos Lagoon estuary, Brazil. Phytochemistry 55, 383-387. Molica, R.J.R., Oliveira, E.J.A., Carvalho, P.V.V.C., Costa, A.N.S.F., Cunha, M.C.C., Melo, G.L., Azevedo, A.M.F.O., 2005. Occurrence of saxitoxins and an anatoxin-a(s)-like anticholinesterase in a brazilian drinking water supply. Harmful Algae 4, 743-753.

Resultados e discussão 114
Monserrat, J.M., Yunes, J.S., Bianchini, A., 2001. Effects of Anabaena spiroides (Cyanobacteria) aqueos extracts on the aceltycholinesterase activity of aquatic species. Environ. Toxicol. Chem. 20, 1228-1235. Moreira-Santos, M., Fonseca, A.L., Moreira, S.M., Osten, J.R.-V., Da Silva, E.M., Soares, A.M.V.M., Guilhermino, L., Ribeiro, R., 2005. Short-term sublethal (sediment and aquatic roots of floating macrophytes) assays with a tropical chironomid based on postexposure feeding and biomarkers. Environ. Toxicol. Chem. 24(9), 2234-2242. Morrone, J.J., Coscarón, S., 1998. Biodiversidad de artrópodos argentinos: una perspectiva biotaxonómica. Ediciones SUR, La Plata. Müller, H., 1972. Wachstum and phosphatbedarf von Nitzschia actinastroides (Lemn.) v. Goor in statischer und homokontiuierliecher kultur unter phosphatlimitierung. Arch. Hydrobiol. Suppl. 38, 399-484. Murphy, S.D., 1966. Liver metabolism and toxicity of thiophosphate insecticides in mammalian, avian, and piscine species. Proc. Soc. Exp. Biol. Med. 123, 392-398. Neves, I.F., Rocha, O., Roche, K.F., Pinto, A.A., 2003. Zooplankton community structure of two marginal lakes of the river Cuiabá (Mato Grosso, Brazil) with analysis of rotifera and cladocera diversity. Braz. J. Biol. 63(2), 329-343. OECD, 2004. Guideline for testing of chemicals. Daphnia sp., Acute immobilisation test. OECD 202. Paris, France: Organization for Economic Cooperation and Development. Printes, L.B., Callaghan, A., 2004. A comparative study on the relationship between acetylcholinesterase activity and acute toxicity in Daphnia magna exposed to anticholinesterase insecticides. Environ. Toxicol. Chem. 23(5), 1241-1247. Printes, L.B., Fellowes, M.D.E., Callaghan, A., 2008. Clonal variation in acetylcholinesterase biomarkers and life history traits following OP exposure in Daphnia magna. Ecotox. Environ. Safe. 71, 519-526. Printes, L.B., Fernandes, M.N., Espíndola, E.L.G., 2011. Laboratory measurements of biomarkers and individual performances in Chironomus xanthus to evaluate pesticide contamination of sediments in a river of southeastern Brazil. Ecotox. Environ. Safe. 74(3), 424-430. Rey, J., Vasquez, E., 1986. Cladocères de quelques corps d’eaux du bassin moyen de l’Orénoque (Venezuela). Ann. Limnol. 22(2), 137-168. Roa, E.Z., Vasquez, W., 1991. Additional cladoceran records for Mantecal and new for Venezuela. Hydrobiologia 225, 45-62. Rocha, O., Güntzel, A., 1999. Branchiopoda, cladocera, in: Ismael, D., Valenti, W.C., Matsumura-Tundisi, T., Rocha, O. (Eds.), Biodiversidade do Estado de São Paulo, Brasil: síntese do conhecimento ao final do século XX. Fapesp, São Paulo, pp. 107-120. Sanoamuang, L.O., 1998. Contributions to the knowledge of the cladocera of northeast Thailand. Hydrobiologia 362(1-3), 45-53.
Resultados e discussão 115
Sant’Anna, C.L., Azevedo, M.T.P., Werner, V.R., Dogo, C.R., Rios, F.R., Carvalho, L.R., 2008. Review of toxic species of cyanobacteria in Brazil. Algol. Stud. 126, 251-265. Sarkar, A., Ray, D., Shrivastava, A.N., Sarker, S., 2006. Molecular biomarkers: their significance and application in marine pollution monitoring. Ecotoxicology 15, 333-340. Scholz, N.L., Hopkins, W.A., 2006. Ecotoxicology of anticholinesterase pesticides: data gaps and research challenges. Environ. Toxicol. Chem. 25, 1185-1186. Smith, P.K., Krohn, R.I., Hermanson, G.T., Mallia, A.K., Gartner, F.H., Provenzano, M.D., Fujimoto, E.K., Goeke, N.M., Olson, B.J., Klenk, D.C., 1985. Measurement of protein using bicinchoninic acid. Anal. Biochem. 150, 76-85. Sturm, A., Hansen, P.D., 1999. Altered cholinesterase and monooxygenase levels in Daphnia magna and Chironomus riparius exposed to environmental pollutants. Ecotox. Environ. Safe. 42, 9-15. Systat, 2006. Systat Software, Incorporation. SigmaPlot for Windows version 10.0. Trayler, K.M., Davis, J.A., 1996. Sensitivity of Daphnia carinata sensu lato to the insect growth regulator, pyriproxyfen. Ecotox. Environ. Safe. 33(2), 154-156. U.S.EPA, 2002. Methods for measuring the acute toxicity of effluents and receiving waters to freshwater and marine organisms. The United States Environmental Protection Agency, Washington, D.C. UNEP, 2005. Methyl-parathion: supporting documentation from the European Community. United Nations Environment Programme, UNEP/FAO/RC/CRC. Vieira, J.M., Azevedo, M.T.P., Azevedo, S.M.F.O., Honda, R.Y., Correia, B., 2005. Toxic cyanobacteria and microcystin concentrations in a public water supply reservoir in the Brazilian Amazonia region. Toxicon 45, 901-909. WHO, 1998. Guidelines for drinking-water quality. Addendum to volume 2. Health criteria and other supporting information, second ed. Word Health Organization, Geneva. Wiegand, C., Pflugmacher, S., 2005. Ecotoxicological effects of selected cyanobacterial secondary metabolites a short review. Toxicol. Appl. Pharm. 203, 201-218. Yunes, J.S., Cunha, N.T., Proença, L.A.O., Barros, L.P., Monserrat, J.M., 2003. Cyanobacterial neurotoxins from Southern Brazilian freshwaters. Comments Toxicol. 9, 103-115.

Resultados e discussão 116
Capítulo 4.3. Is the use of native species a better choice to assess the anatoxin-a(s) in
tropical regions? The specificity of ChE activity of two cladoceran species to detect the
presence and sub-lethal effects of anatoxin-a(s) extracts through different levels of
biological organization
Abstract – In this study, the specificity of cholinesterase (ChE) activity to detect the presence of anatoxin-a(s) and
sub-lethal effects of a 7 days exposure to the anatoxin-a(s) extract were evaluated in two cladoceran species. The
ChE activity of both Pseudosida ramosa and Daphnia magna have shown to be a useful tool for indicating the presence
of neurotoxin anatoxin-a(s), since no effect on enzymatic activity of these species was observed when they were
exposed to the hepatotoxin microcystin. However, ChE activity of P. ramosa had a best performance as a biomarker
of exposure to the anatoxin-a(s) than that of D. magna. While the ChE activity of P. ramosa remained inhibited after
two weeks of transference to clean medium, inhibition of ChE activity in D. magna was transient, recovering to the
level found in control after the second week. Furthermore, sub-lethal exposure to the anatoxin-a(s) extract
significantly inhibited ChE activity in P. ramosa and also negatively affected individual (age at first reproduction and
total number of accumulated live neonates per female) and populational endpoints (population growth rate). For D.
magna, inhibition of ChE activity was not related to effects at higher levels of biological organization, since no direct
effect was recorded on the individual and populational endpoints. The ChE activity in P. ramosa showed also to be a
good predictor of chronic effects of anatoxin-a(s) extract at higher levels of biological organization, since 48-h ChE
inhibition was linked to sub-lethal effects on individual (21-day reproduction) and populational levels (21-day
population growth rate). For D. magna, these relationships could not be established, even for high levels of 48-h ChE
inhibition (up to 50%). Since the relationships between the effects of anatoxin-a(s) extract in different levels of
biological organization were species-specific, we concluded that the choice of test organism can interfere with
accuracy of the risk assessment of this neurotoxin, being strongly recommended the use of native species for this
evaluation.
Keywords: anatoxin-a(s); microcystins; cholinesterases; life history parameters; population growth rate; Pseudosida
ramosa; Daphnia magna.
4.3.1. Introduction
Eutrophication is recognised as a worldwide pollution problem in many lakes and
reservoirs, including in Brazil. The enrichment of waters with nutrients, coupled with favorable
conditions of temperature and light, promotes the occurrence of cyanobacterial blooms (Azevedo
et al., 2002; Chorus and Bartram, 1999). Differently of what is usually observed in temperate
regions, in the tropics, the conditions for the formation of cyanobacterial blooms remain
favorable during most of the year, making the problems associated with high cyanobacterial
biomass a challenge to the managers of waters resources in this region (Backer, 2002; Brazilian
Ministry of Health, 2003; WHO, 1998).

Resultados e discussão 117
A remarkable feature of cyanobacteria is that many of them are able to produce secondary
toxic metabolites, which have specific toxic mechanisms on the vertebrates (Carmichael, 1992).
These cyanotoxins can be classified as hepatotoxins (microcystins and nodularin), neurotoxins
(anatoxin-a and homoanatoxin-a, anatoxin-a(s) and saxitoxins), cytotoxins (cylindrospermopsin),
dermatotoxins (aplysiatoxins and lyngbyatoxin-a) and irritant toxins (lipopolysaccharides)
(Carmichael, 1992; Jochiminsen et al., 1998; Wiegand and Pflugmacher, 2005). In Brazil,
hepatotoxins are more widespread in freshwater bodies than neurotoxins (Azevedo et al., 1994;
Ferrão-Filho et al., 2009; Matthiensen et al., 2000; Vieira et al., 2005). Nevertheless, recently, the
occurence of neurotoxic cyanobacterial blooms, especially relative to anatoxin-a(s), have been
more frequently documented (Lagos et al., 1999; Molica et al., 2005; Monserrat et al., 2001;
Yunes et al., 2003), further increasing concern for this type of cyanotoxin. The anatoxin-a(s) is
known to act on the nervous system, inhibiting the activity of acetylcholinesterase and preventing
it from hydrolyzing the neurotransmitter acetylcholine (Mahmood and Carmichael, 1986). Its
mode of action is very similar to that of synthetic pesticides, such as organophosphates (OPs)
and carbamates (Cook et al., 1988, 1989).
The cyanotoxins are produced and stored within the cells. However, larger quantities of
these toxins are released to the surrounding water during senescence of bloom and cell lysis
(Chorus and Bartram, 1999). Some studies have pointed that dissolved cyanotoxins exert specific
toxic effects on zooplankton (DeMott et al., 1991; Ferrão-Filho et al., 2000, 2008; Gilbert, 1990;
Lampert, 1981; Reinikainen et al., 2001; Sotero-Barbosa et al., 2006, 2008).
Of particular interest are the effects of the cyanotoxins on the cladocerans, which are
potential grazers of planktonic cyanobacteria (Lampert, 1981). Cladocerans are a key group of
organisms in freshwater environments and disturbance of their populations may have effects
throughout the aquatic food chain (Rohrlack et al., 2003). Furthermore, the use of cladocerans in
toxicity tests has many advantages, including their ease of handling, the possibility of obtaining
clones by parthenogenesis, their short life cycle and high sensitivity to toxicants (Adema, 1978;
Trayler and Davis, 1996). The effects of cyanotoxins on the cladocerans can be observed through
different levels of biological organization, from the suborganismal (enzymes) (Chen et al., 2005;
Ortiz-Rodríguez and Wiegand, 2010; Printes and Callaghan, 2004; Wiegand et al., 2002) to the
organismal levels (survival and reproduction) (Chen and Xie, 2003; Ghadouani et al., 2003;
Hietala et al., 1997; Thostrup and Christofferson, 1999).
The species Daphnia magna from temperate regions is certainly the most widely used
cladoceran in Ecotoxicology throughout the world. However, its use in ecotoxicological
evaluations in tropical countries has been questioned (Do Hong et al., 2004; Freitas and Rocha,

Resultados e discussão 118
2011a), because large part of the toxic responses of organisms to chemicals is species-specific
(Freitas and Rocha, 2012). Thus, in recent years, a great effort has been done towards using
native species in ecotoxicological evaluations in order to obtain more representative data for a
given local (Do Hong et al., 2004; Domingues et al., 2007). Studies on the species Pseudosida
ramosa, an autochthonous cladoceran species in Brazil (Elmoor-Loureiro, 2007), with a wide
distribution in tropical and subtropical regions (Elías-Gutiérrez et al., 2001; Korovchinsky, 1992;
Maiphae et al., 2005; Morrone and Coscarón, 1998; Rey and Vasquez, 1986; Roa and Vasquez,
1991; Sanoamuang, 1998), is an example of this effort. Some recent studies have shown that this
tropical species is a good substitute to D. magna in conventional ecotoxicological assays (Freitas
and Rocha, 2011a, 2011b, 2011c, 2012).
In the last decades, the interest regarding the use of biomarkers in environmental risk
assessment (ERA) has increased, particularly in relation to biochemical biomarkers. The
biomarker approach is based, in part, on the assumption that low toxicant levels cause
biochemical responses within organisms before these effects can be observed at higher levels of
biological organization (McLoughlin et al., 2000; Van Gestel and Van Brummelen, 1996).
Additionally, a biochemical response may indicate a causal agent of toxicity, since specific
enzymatic systems may be affected by particular toxicants (Peakall, 1992). However, the major
challenge for the use of biochemical biomarkers in ERA studies is to establish links between
biomarker responses and subsequent damages at higher levels of biological organization
(Domingues et al., 2010), since the inhibition of the enzymatic activity will be only informative of
exposure and not of effect if it cannot be linked to endpoints that have a clear ecological
significance (Scholz and Hopkins, 2006). Patterns of cholinesterase (ChE) inhibition and its
correspondence with more ecologically relevant endpoints, especially in relation to D. magna, have
been reported in the literature (Barata et al., 2001, 2004; Duquesne, 2006; Jemec et al., 2007;
Printes and Callaghan, 2004; Printes et al., 2008; Sturm and Hansen, 1999). In contrast, for
tropical species, these studies are scarce (Freitas et al., Capítulo 4.2; Moreira-Santos et al., 2005;
Printes et al., 2011) and studies concerning the links between the responses to sub-lethal
exposures at the suborganismal level (i.e., ChE inhibition) and individual and populational levels
(i.e., reproduction and population growth rate) are missing. It is particularly important for ERA
studies to determine whether an exposure environmentally relevant (e.g., pulse and sub-lethal
exposure) to an anticholinesterase compound, such as anatoxin-a(s), can inhibit ChE activity and
this effect at suborganismal level can be related to effects on the reproduction and eventually on
the population growth rate.
Resultados e discussão 119
The current study was undertaken to address these gaps. The main objectives were: (i) to
investigate the use of ChE in P. ramosa as a biomarker of anatoxin-a(s) in the risk assessments of
cyanobacterial blooms in tropical regions, comparing its performance with that of D. magna, a
laboratory standardized species; (ii) to evaluate the specificity of ChE assay for the anatoxin-a(s),
through enzymatic assays performed with microcystins; (iii) to measure the effects of anatoxin-
a(s) extract after 7 days of exposure to sub-lethal concentrations and two weeks of recovery in
clean medium in both P. ramosa and D. magna. This time interval of exposure was chosen, since
frequently cyanobacterial blooms cannot maintain a high population for a long time period. Such
blooms rapidly die and disappear after one or two weeks (Crayton, 1993). The endpoints
monitored were ChE activity, body size, reproductive performance (age at first reproduction and
number of accumulated live neonates per female), survival and population growth rate; and (iv)
to establish the links between the 48-h ChE inhibition and effects at individual (21-day
reproduction) and populational levels (21-day population growth rate). The population growth
rate integrates potentially complex interactions among life history parameters into a single
parameter and provides an ecologically relevant measure of toxic response (Forbes and Calow,
1999; Sibly, 1996).
4.3.2. Material and methods
4.3.2.1. Test organisms and culture conditions
The assays were carried out with individuals of Pseudosida ramosa and Daphnia magna.
Genetically identical organisms of P. ramosa were obtained from laboratory cultures, which have
been maintained since 2004 in our laboratory, whereas D. magna was kindly provided from
Beckhauser and Barros Laboratory, Blumenau, Santa Catarina State, Brazil.
In the cultures of P. ramosa, about 70 individuals were maintained in 1,800 mL of ASTM
soft medium under a light: dark photoperiod of 12: 12 h at 25 ± 2oC. The ASTM soft medium
had a total hardness of 40-48 mg CaCO3 L-1, a pH ranging from 7.0 to 7.6 and an electrical
conductivity around 160 µS cm-1 (ASTM, 2001). In relation to the cultures of D. magna, about 15
individuals were maintained in 800 mL of ASTM hard medium under a light: dark photoperiod
of 16: 8 h at 20 ± 2oC. The ASTM hard medium had a total hardness of 200-250 mg CaCO3 L-1, a
pH ranging from 8.0 to 8.4 and an electrical conductivity around 500 µS cm-1 (U.S.EPA, 2002).
The culture media for both species were renewed thrice weekly and were started with juveniles (≤
24-h old) isolated from parthenogenetic mothers. Only juveniles from the 3rd to the 5th brood

Resultados e discussão 120
were used to establish new cultures and to perform of toxicity tests. The cladoceran cultures were
fed with a suspension of the unicellular green alga Pseudokirchneriella subcapitata, which was
cultured in algal medium as described by Müller (1972). The algae were harvested in exponential
growth phase, centrifuged and the resulting pellet was resuspended in ASTM medium. The
animals were fed daily at a concentration of 1x10⁵ cells mL-1 for P. ramosa or 3x10⁵ cells mL-1 for
D. magna. A suspension of 0.05 mg L-1 (dry wt) of dried baker’s yeast was also given as a food
supplement, as recommended by the U.S.EPA (2002). During the assays, the health and
sensitivity of the cultures of P. ramosa and D. magna were checked by acute toxicity tests with the
reference substances sodium chloride and potassium dichromate, respectively. The LC50 (lethal
concentrations to 50% individuals) remained within the limits of the ranges of sensitivity specific
to each species (Freitas and Rocha, 2011a; OECD, 2004).
4.3.2.2. Cyanobacterial cultures and preparation of the stock solutions
4.3.2.2.1. Culture of Microcystis aeruginosa and preparation of the microcystin extracts
The extracts of microcystin were obtained from cultures of the cyanobacterium Microcystis
aeruginosa. The strain of M. aeruginosa (NPLJ-4) was isolated in 1996 from Jacarepaguá lagoon, Rio
de Janeiro, Brazil and supplied by Dr. Sandra Azevedo (Federal University of Rio de Janeiro).
This strain produces four types of hepatotoxins, among which microcystin-LR (MC-LR)
represents 80% of the total quantity (Soares et al., 2004).
The cells of M. aeruginosa were cultured in 6-L Erlenmeyer flasks containing 3 L of
autoclaved ASM-1 medium (Gorham et al., 1964), with the pH adjusted to 7.0-7.5. The
cyanobacterial cultures were grown at 25 ± 2oC, with a light: dark photoperiod of 12: 12 h, in
gently aerated culture medium. At the late exponential phase of growth, cells of M. aeruginosa were
concentrated in a continuous flow centrifuge at 8,500 g and 4oC. By the end of the centrifugation,
the algal medium had been completely replaced by distilled water. Immediately after this process,
suspension of concentrated cells was lyophilized at -80oC until full dehydration. Freeze-dried cells
were preserved at -20oC until used for extract preparation.
The direct extraction method was used to release the intracellular microcystins, since we
wanted to extract them as naturally as possible. Thus, for the release of the toxins, 1,000 mg of
freeze-dried cells of M. aeruginosa were dispersed in approximately 10 mL distilled water and
ground manually in a mortar for 10 min. After this procedure, the volume of extract was
completed to 100 mL with distilled water, which resulted in a stock solution of 10,000 mg L-1.

Resultados e discussão 121
Immediately after, microcystin extracts were ultrasonicated on ice in 5 cycles of 1 min each, at a
frequency of 20 kHz. Each cycle was separated by a period of 1 min. Cell lysis was confirmed by
direct observation by optical microscope. Finally, cellular debris were removed by centrifuging at
10,000 g and 4oC for 25 min and the supernatants alone were used in assays. The nominal test
concentrations were obtained by diluting the supernatants in ASTM soft medium (for P. ramosa)
or ASTM hard medium (for D. magna). Supernatants and nominal test concentrations were made
up immediately prior to the tests.
4.3.2.2.2. Culture of Anabaena spiroides and preparation of the anatoxin-a(s) extracts
The extracts of anatoxin-a(s) were obtained from cultures of the cyanobacterium
Anabaena spiroides. The strain of A. spiroides (ITEP-024) was isolated in 2002 from Tapacurá
reservoir (Pernambuco, Brazil) by Dr. Renato Molica (Technology Institute of Pernambuco,
Brazil) and supplied by Dr. Sandra Azevedo (Federal University of Rio de Janeiro). This strain
produces only anatoxin-a(s), as verified by liquid chromatography–mass spectrometry analysis
(LC/MS) (Molica et al., 2005).
The filaments of A. spiroides were cultured as described for the M. aeruginosa. At the late
exponential phase of growth, filaments of A. spiroides were concentrated in a continuous flow
centrifuge at 5,500 g and 4oC. By the end of the centrifugation, the algal medium has been
completely replaced by distilled water. The cell density (cells mL-1) of the concentrated filament
suspension was then determined by examination under an optical microscope (magnification
2,000x) in a Sedgewick-Rafter chamber.
Also, in this case, the direct extraction method was used to release the intracellular
anatoxin-a(s). This extraction method was differed from the method previously used, consisting
in freezing the concentrated filaments suspension at –20oC and thawing at room temperature.
The freeze/thaw cycle was repeated four times and cell lysis was confirmed by direct observation
by optical microscope. Different extraction methods were used since the filaments of A. spiroides
were more easily ruptured than cells of M. aeruginosa. Finally, cellular debris were removed by
centrifuging at 10,000 g and 4oC for 25 min and the supernatants alone were used in assays. The
nominal test concentrations were obtained by diluting the supernatants in ASTM soft medium
(for P. ramosa) or ASTM hard medium (for D. magna). Supernatants and nominal test
concentrations were made up immediately prior to the tests.

Resultados e discussão 122
4.3.2.3. Chemical detection
The microcystin content in the extract was quantified using a commercial enzyme-linked
immunoassay (ELISA) with an Envirogard microcystin plate kit (Strategic Diagnostics, Newark,
USA). The results of the tests relative to the microcystin extract were expressed in both mg of
dry weight freeze-dried cells per liter and µg of microcystin-LR (MC-LR) per liter.
In relation to the anatoxin-a(s), there is a lack of commercially available analytical
standards, which hampers the development of specific direct methods for its direct quantitation.
Thus, in this study, it was not possible to measure anatoxin-a(s) in the tested extracts. However,
as cited above, it has been verified by LC/MS that this strain of A. spiroides produces anatoxin-
a(s) (Molica et al., 2005). The results of the tests relative to the anatoxin-a(s) extract were
expressed in cells per milliliter.
4.3.2.4. Effects of the microcystin extract on ChE activity of P. ramosa and D. magna
The effects of the microcystin extract on ChE activity were evaluated in both P. ramosa
and D. magna. The mean values of the concentrations of microcystin extract close to estimated
LC1 to LC50 obtained in previous acute toxicity tests (a total of three tests) were used as test
concentrations in the mass exposure assays to measure the ChE activity. The acute toxicity tests
were carried out as recommended in Freitas and Rocha (2011a) and OECD (2004).
The following nominal test concentrations of the microcystin extract were used in mass
exposure assays: 29.7–115.2 mg L-1 for P. ramosa and 51.1–202.3 mg L-1 for D. magna. They were
obtained by diluting the supernatants, prepared as described in subsection 4.3.2.2.1, in ASTM
soft medium (for P. ramosa) or ASTM hard medium (for D. magna).
A total of three assays were carried out for each test organism. Briefly, in mass exposure
assays, twenty juveniles (≤ 24-h old) of P. ramosa or D. magna were placed in 50 mL glass beakers
filled with 40 mL of each test concentration or 40 mL of ASTM medium (control). The test
concentrations and control were prepared in 12 replicates (labeled 1.1, 1.2, 1.3, 1.4, 2.1, 2.2, 2.3,
2.4, 3.1, 3.2, 3.3 and 3.4). After 48-h exposure, in total darkness, live organisms were collected for
ChE assays. The assay conditions for the mass exposure tests were the same as those described
for the culture conditions (subsection 4.3.2.1), with the only exception that test organisms were
not fed during the course of the experiment. The pH and dissolved oxygen were measured at the
beginning and end of the assays.

Resultados e discussão 123
In the ChE assays, three replicates per treatment (test concentrations and control) were
assessed. Surviving animals from the replicates 1.1, 1.2, 1.3 and 1.4; 2.1, 2.2, 2.3 and 2.4; and 3.1,
3.2, 3.3 and 3.4 were transferred to 1.5 mL micro-centrifuge tubes labeled as 1, 2 and 3,
respectively. Thirty surviving juveniles were used for each replicate. All animals were dried on
absorbent paper to remove all the remaining test medium before they were transferred to the
micro-centrifuge tubes. Immediately after their being transferred to the tubes, they were frozen
by immersion in liquid nitrogen. All samples were stored at -80oC.
4.3.2.5. Analysis of ChE activity, life history parameters and population growth rate in P.
ramosa and D. magna
For carrying out this experiment, two nominal test concentrations of anatoxin-a(s) extract
were selected (1% and 10% for P. ramosa and 1% and 50% for D. magna), based on a previous
study (Freitas et al., Capítulo 4.2). They were initially chosen to give different levels of inhibition
of ChE activity, after a 48-h exposure period. Since the intention of this experiment was to
evaluate chronic effects of anatoxin-a(s) extract on the individual and populational parameters,
no mortality was expected, even to the highest tested concentrations. Thus, inhibitions of ChE
activity of 10% and 50%, respectively, for P. ramosa and D. magna were linked to less than 10% of
mortality, whereas inhibitions of ChE activity of 1% for both species were associated with no
mortality.
The two nominal test concentrations of the anatoxin-a(s) extract (treatment 1 and 2) were
0.38 and 1.00x10⁶ cells mL-1 for P. ramosa and 0.40 and 2.08x10⁶ cells mL-1 for D. magna. They
were obtained by diluting the supernatants, prepared as described in subsection 4.3.2.2.2, in
ASTM soft medium (for P. ramosa) or ASTM hard medium (for D. magna).
4.3.2.5.1. Experimental design
One experiment was performed to measure the ChE activity, life history parameters and
population growth rate in both P. ramosa and D. magna (Fig. 4.3.1). Four sets of beakers were
simultaneously placed for analyses up to 48 h, 7, 14 and 21 days. In relation to the time interval
of 48 h, thirty juveniles (≤ 24-h old) of P. ramosa or D. magna were placed in 2,000 mL glass
beakers filled with 1,800 mL of each test concentration or 1,800 mL of ASTM medium (control).
The test concentrations and control were prepared in 6 replicates (labeled 1.1, 1.2, 2.1, 2.2, 3.1
and 3.2). For the time intervals of 7, 14 and 21 days, fifteen juveniles (≤ 24-h old) of P. ramosa or

Resultados e discussão 124
D. magna were placed in 1,000 mL glass beakers filled with 800 mL of each test concentration or
800 mL of ASTM medium (control) and replicated as set of beakers at the time interval of 48 h
(i.e., six times). A higher number of juveniles per replicate was required for the set of beakers at
the time interval of 48 h, since more organisms were used for ChE assays.
The exposure to the anatoxin-a(s) extract was performed for 7 days. The nominal test
concentrations were renewed every other day until completing 7 days of exposure. After 7th day,
both cladoceran species were maintained in clean ASTM medium (without the anatoxin-a(s)
extract), which was also renewed every other day until the end of experiment. The pH and
dissolved oxygen were measured in each renewal of medium.
The four sets of beakers were kept in total darkness during the first 48 h as recommended
by OECD (2004). Following 48 h of exposure, the surviving animals of the first set of beakers
(six replicates with 30 individuals each one) were collected for ChE assays and the remaining
three sets of beakers (7, 14 and 21 days) were uncovered and subjected to the same conditions as
described in the culture conditions (subsection 4.3.2.1). From 48 h, all organisms were fed daily
with green algae P. subcapitata and food supplement. At the end of the 7th day, the surviving
animals from the second set of beakers (six replicates with 15 individuals each one) were
collected for ChE assays (7 days of exposure). The same was done for the third set of beakers
(six replicates with 15 individuals each one), i.e., the surviving animals were collected after 14
days for ChE assays (first week of recovery). For the fourth set of beakers (six replicates with 15
individuals each one), the survival of the adult females, body length, age at first reproduction,
total number of accumulated live neonates per female and population growth rate were recorded
in the replicates 1.1, 2.1 and 3.1 until the 21st day of the experiment (Fig. 4.3.1). At the end of the
21 days, the surviving adult females were collected for further ChE assays (second week of
recovery).
For the ChE assays, three replicates per treatment were assessed. Surviving animals from
the replicates 1.1 and 1.2, 2.1 and 2.2, and 3.1 and 3.2 were transferred to 1.5 mL micro-
centrifuge tubes labeled as 1, 2 and 3, respectively. Thirty, twenty, fifteen and fifteen surviving
individuals were used for each replicate, respectively, at the time intervals of 48 h, 7, 14 and 21
days, as illustrated in Fig. 4.3.1. All animals were dried on absorbent paper to remove all
remaining test medium before they were transferred to the micro-centrifuge tubes. Immediately
after their being transferred to the tubes, they were frozen by immersion in liquid nitrogen. All
samples were stored at -80oC.

Resultados e discussão 125
Fig. 4.3.1 Experimental design of the test performed to measure the ChE activity, life history parameters and population growth rate in both P. ramosa and D. magna, when they were exposed to the anatoxin-a(s) extract. Treatment 1 and 2 are tested concentrations of anatoxin-a(s) extract and numbers 1.1, 1.2, 2.1, 2.2, 3.1 and 3.2 are replicates
4.3.2.5.2. Life history parameters and population growth rate
The body length of the individuals of P. ramosa and D. magna was measured at the 0, 7th,
14th and 21st days. For that, each female was transferred in the specific days to a watch glass by
means of a widepoint Pasteur pipette, care was taken to avoid damaging the organism. The length
of the whole body was measured under a stereoscopic microscope, with the aid of a micrometric
ruler, from the top of the head to the rear end of the organism (tip of the carapace).
Measurements were taken and converted to millimeters.
The age at first reproduction was defined as the age at releasing of the first brood of eggs
into the incubation chamber. The newborn juveniles of P. ramosa and D. magna were counted and
removed from the test vessels on a daily basis. The maternal survival was also examined daily.

Resultados e discussão 126
Population growth rate for both P. ramosa and D. magna was measured by calculating the
intrinsic rate of natural increase (rm) (Sibly, 1999). The schedules of survivorship and fecundity
were utilised to solve the Euler-Lotka equation: 1 = Σ lx mx e– rmx, where x is the age of the cohort
(in days), lx is the survival probability at age x, mx is the number of offspring per female of age x
and rm is the intrinsic rate of increase of the population (day-1). Since this equation cannot be
rearranged to solve for rm, its solution was obtained iteratively (Forbes and Calow, 1999).
4.3.2.6. Measurement of ChE activity
The measurement of ChE activity were based on the generic assays reported by Freitas et
al. (Capítulo 4.1) and Printes and Callaghan (2004) for P. ramosa and D. magna, respectively.
Briefly, pooled frozen organisms, originating from the experiments of the subsections 4.3.2.4 and
4.3.2.5, were homogenized in 1.5-mL micro-centrifuge tubes with homogenizing buffer (ice-cold
0.02 M sodium phosphate buffer, pH 8.0, with 1% Triton X-100). The manual homogenization
was carried out with a micro-centrifuge tube pestle (40 cycles, 10 s), on ice, in a temperature-
controlled room at 18oC. To the initial homogenate, ice-cold 0.02M sodium phosphate buffer pH
8.0 was added in a 10:1 ratio, whirlimixed and centrifuged at 14,000 g and 2-4°C for 4 min.
Supernatants were transferred to clean pre-cooled micro-centrifuge tubes, whirlimixed and
assayed immediately. Additions to the microtiter plate were made in the following order: 100 µL
of 8 mM DTNB (D-8130, Sigma-Aldrich) in sodium phosphate buffer, pH 8.0, supplemented
with 0.75 mg mL-1 of sodium hydrogen carbonate; 50 µL of blank buffer (sodium phosphate
buffer, pH 8.0, containing 0.1% Triton-X-100) or 50 µL supernatant, and 50 µL of 16 mM ATCI
(A-5751, Sigma-Aldrich) in sodium phosphate buffer, pH 8.0. The microtiter plate was inserted
into the integral incubator of a Dynex MRX microtiter plate reader (DYNEX Technologies,
USA) and incubated at 30oC for 5 min. After this, the reaction rate (∆OD min-1) was measured at
405 nm and 30oC over a 10 min period, with intermittent shaking between each reading cycle. In
total, 21 cycles of measurements were performed. The enzyme activity was given in µM L-1 min-1
g-1 protein and the normal reaction rate of the blank assay was up to 3 mOD min-1.
The protein concentrations in the homogenates of both P. ramosa and D. magna were
estimated by the bicinchoninic acid (BCA) kinetic protein assay (Pierce, Rockford, IL, USA)
(Fisher et al., 2000; Smith et al., 1985) as described in previous works (Freitas et al., Capítulo 4.1;
Printes and Callaghan, 2004). The protein standard curve was prepared with a dilution series of
bovine serum albumin (BSA) (B14046, Pierce), with standards diluted in blank buffer with pH
8.0. The concentrations used for both cladoceran species were: 5, 25, 50, 125, 250 and 500 µg

Resultados e discussão 127
mL-1 for juveniles with up to 48-h old; 5, 25, 50, 125, 250, 500, 750, 1000 and 2000 µg mL-1 for
individuals with 7 and 14 days old; and 5, 25, 50, 125, 250, 500, 750, 1000, 1500, 2000, 2500,
3000, 3500, 4000, 4500 and 5000 µg mL-1 for adults with 21 days old. The normal reaction rate of
the assay blank was 0.1 to 0.9 mOD min-1.
4.3.2.7. Data treatment and statistical analysis
The lethal concentrations of microcystin extract to 1, 5, 10, 15 and 50% of the organisms
(48-h LC1, LC5, LC10, LC15 and LC50), for both P. ramosa and D. magna, were calculated by the
Probit method (Probit Program, version 1.5) (Finney, 1971). Normal data relative to ChE activity
obtained after exposure to the microcystin extract were analysed by one-way analysis of variance
(ANOVA).
Data relative to ChE activity, life history parameters and population growth rate, obtained
after exposure to the anatoxin-a(s) extract, were first checked for the normality (χ2 test) and
homogeneity (Bartlett’s test) of distribution. Normal data were analyzed by one-way analysis of
variance (ANOVA), followed by a post hoc multiple comparisons Dunnett test, when differences
were found in the data. When the normality test failed, Kruskal-Wallis test was used and multiple
comparisons were made with Dunn’s method (Systat, 2006). In all statistical tests, significance
was accepted when α ≤ 0.05.
The relationships between the 48-h ChE inhibition and 21-day reproduction and between
the 48-h ChE inhibition and 21-day population growth rate, after exposure of both P. ramosa and
D. magna to the anatoxin-a(s) extract, were established with the linear regression model (Systat,
2006).
4.3.3. Results
4.3.3.1. Microcystin analysis
The concentration of MC-LR detected for the freeze-dried cells of M. aeruginosa (NPLJ-4
strain) was 6,010 µg g-1.

Resultados e discussão 128
4.3.3.2. Validity of the tests and abiotic variables
In the tests with microcystin extract, the mortality in the controls was less than 10%, as
recommended by the OECD (2004). In relation to the tests with anatoxin-a(s) extract, no
mortality of adult females was observed in the controls for both P. ramosa and D. magna and total
number of accumulated live neonates per female at the end of the test was > 40 for P. ramosa and
≥ 60 for D. magna in the controls, as described by Freitas and Rocha (2012) and recommended by
OECD (2008), respectively.
During the tests for checking the effects of microcystin extract on ChE activity, the
measured pH of the test solutions ranged from 7.2 to 8.0 for P. ramosa and from 7.6 to 8.4 for D.
magna. The pH did not varied by more than 1.0 unit for the same tested concentration. The
oxygen content of the test solutions was above 7.2 mg L-1 in all tests with P. ramosa and above 7.1
mg L-1 in all tests with D. magna. For the anatoxin-a(s) extract, in the experiment of analysis of
ChE activity, life history parameters and population growth rate, the measured pH of the test
solutions ranged from 7.1 to 8.1 for P. ramosa and from 7.7 to 8.6 for D. magna. The pH did not
varied by more than 1.0 unit for the same tested concentration. The oxygen content of the test
solutions was above 7.3 mg L-1 in tests with P. ramosa and above 7.2 mg L-1 in tests with D. magna.
Thus, all tests met the validity criteria set forth in the OECD guidelines (OECD, 2004, 2008).
4.3.3.3. Effects of the microcystin extract on ChE activity of P. ramosa and D. magna
The tested concentrations of microcystin extract used in the ChE assays were the mean
values estimated for LC1 to LC50 (Table 4.3.1). In relation to P. ramosa, the tested concentrations
were equivalent to 176.7 to 692.4 µg MC-LR L-1, whereas for D. magna were equivalent to 307.1
to 1215.8 µg MC-LR L-1.

Resultados e discussão 129 Table 4.3.1. Values of toxicity endpoints obtained after 48-h exposure to three acute toxicity tests with microcystin extract for both P. ramosa and D. magna. LC1, LC5, LC10, LC15 and LC50 are lethal concentrations at 1, 5, 10, 15 and 50% of the individuals, respectively; CI (95%) is 95% confidence interval. All concentrations are shown in mg L-1
Test LC1 CI (95%) LC5 CI (95%) LC10 CI (95%) LC15 CI (95%) LC50 CI (95%)
P. ramosa 1 46.12 14.02 - 73.40 65.63 26.62 - 94.69 79.20 37.32 - 108.90 89.91 46.74 - 120.00 153.73 113.19 - 193.48 2 23.61 11.57 - 34.70 35.28 20.66 - 47.75 43.71 27.99 - 56.91 50.50 34.24 - 64.31 93.02 74.55 - 115.98 3 19.38 8.71 - 30.10 31.23 17.17 - 44.02 40.27 24.52 - 54.23 47.82 31.06 - 62.68 98.77 77.56 - 125.74 Mean ± SD 29.70 ± 11.74 44.05 ± 15.35 54.39 ± 17.60 62.74 ± 19.24 115.17 ± 27.36 D. magna 1 44.94 23.98 - 65.30 70.28 43.86 - 94.13 89.20 60.20 - 114.99 104.77 74.29 - 132.08 206.83 168.60 - 254.30 2 50.88 28.14 - 71.76 75.39 48.29 - 98.77 92.98 64.10 - 117.66 107.12 77.34 - 132.85 194.83 160.68 - 236.36 3 57.32 32.02 - 80.00 83.29 53.76 - 108.24 101.66 70.53 - 127.76 116.29 84.46 - 143.34 205.30 170.06 - 247.94 Mean ± SD 51.05 ±±±± 5.06 76.32 ±±±± 5.35 94.61 ±±±± 5.22 109.39 ±±±± 4.97 202.32 ±±±± 5.33

Resultados e discussão 130
No inhibition in the ChE activity was observed in relation to the control when juveniles
P. ramosa (F5,12 = 2.58, P = 0.08) (Fig. 4.3.2 A) and D. magna (F5,12 = 2.07, P = 0.14) (Fig. 4.3.2 B)
were exposed to the concentrations of the estimated LC1 to LC50 of microcystin extract.
Fig. 4.3.2 Cholinesterase (ChE) activity (mean for three assays ± standard deviation) in juveniles of (A) P. ramosa and (B) D. magna, after 48-h exposure to various concentrations of microcystin extract

Resultados e discussão 131
4.3.3.4. Effects of the anatoxin-a(s) extract on ChE activity, life history parameters and
population growth rate of P. ramosa and D. magna
4.3.3.4.1. ChE activity
A significant inhibition of ChE activity in relation to the control was observed when P.
ramosa was exposed to the concentration of 1.00x10⁶ cells mL-1 of anatoxin-a(s) extract after 2
days (F2,6 = 292.1, P < 0.001) and 7 days of exposure (F2,6 = 84.1, P < 0.001). For the same tested
concentration, the inhibition of ChE activity was persistent after the first week (14 days) (F2,6 =
77.8, P < 0.001) and the second week of recovery (21 days) (F2,6 = 39.6, P < 0.001) (Fig. 4.3.3 A).
For the concentration of 1.00x10⁶ cells mL-1 of anatoxin-a(s) extract, ChE activities of P. ramosa
were 85 ± 0.7%, 85.5 ± 0.4%, 90.3 ± 1.0% and 88.4 ± 3.1% relative to the control, respectively,
at the time intervals of 2, 7, 14 and 21 days. In relation to D. magna, a significant inhibition of the
ChE activity in relation to the control was also observed for the concentration of 2.08x10⁶ cells
mL-1 of anatoxin-a(s) extract after 2 days (H = 5.6, P = 0.04) and 7 days of exposure (F2,6 =
190.4, P < 0.001). The inhibition of ChE activity was persistent after the first week of recovery
(14 days) for the same tested concentration (F2,6 = 26.5, P < 0.001). However, for the second
week of recovery (21 days), there was a recovery of the ChE activity at a level similar to that of
the control (H = 1.9, P = 0.44) (Fig. 4.3.3 B). For the concentration of 2.08x10⁶ cells mL-1 of
anatoxin-a(s) extract, ChE activities of D. magna were 51 ± 0.5%, 51.2 ± 2.0%, 67.4 ± 2.4% and
97.3 ± 4.2% relative to the control, respectively, at the time intervals of 2, 7, 14 and 21 days.

Resultados e discussão 132
Fig. 4.3.3 Cholinesterase (ChE) activity (mean for three replicates ± standard deviation) of (A) P. ramosa and (B) D. magna after 2 and 7 days of exposure to the sub-lethal concentrations of anatoxin-a(s) extract and after the first week (14 days) and the second week of recovery in clean medium (21 days). The control is represented by C and the asterisk indicates statistically significant difference from the control (P ≤ 0.05)
4.3.3.4.2. Body length
No difference in the body length of P. ramosa was observed in relation to the control after
7 days of exposure (F2,6 = 0.175, P = 0.84) for the concentrations of 0.38 and 1.00x10⁶ cells mL-1

Resultados e discussão 133
of anatoxin-a(s) extract. For the same tested concentrations, no difference in the body length was
also found after the first week (14 days) (F2,6 = 2.92, P = 0.13) and the second week of recovery
(21 days) (H = 6.00, P = 0.07) (Fig. 4.3.4 A). With regard to D. magna, no significant decrease in
the body length was observed in relation to the control for the concentrations of 0.40 and
2.08x10⁶ cells mL-1 of anatoxin-a(s) extract after 7 days of exposure (F2,6 = 3.40, P = 0.10). For
the same tested concentrations, no difference in the body length was also found after the first
week (14 days) (F2,6 = 3.70, P = 0.09) and the second week of recovery (21 days) (F2,6 = 0.70, P =
0.53) (Fig. 4.3.4 B).
4.3.3.4.3. Age at first reproduction
The age at first reproduction of P. ramosa was significantly increased for the highest tested
concentration of the anatoxin-a(s) extract (F2,6 = 407.6, P < 0.001), when compared with the
control. The species P. ramosa reached maturity at 6.56 ± 0.06 days in the control and 6.51 ± 0.03
days in the concentration of 0.38x10⁶ cells mL-1, whereas for the concentration of 1.00x10⁶ cells
mL-1, the maturity was reached at 8.77 ± 0.14 days (Fig. 4.3.4 C). With regard to D. magna, no
significant difference was observed in the age at first reproduction for the two tested
concentrations of anatoxin-a(s) extract, when compared with the control (F2,6 = 3.11, P = 0.12).
This daphnid species reached maturity at 6.96 ± 0.06 days in the control, 7.15 ± 0.32 days in the
concentration of 0.40x10⁶ cells mL-1 and 7.55 ± 0.27 days in the concentration of 2.08x10⁶ cells
mL-1 (Fig. 4.3.4 D).
4.3.3.4.4. Total number of accumulated live neonates per female
A significant decrease in the total number of accumulated live neonates per female was
observed, in relation to the control, when P. ramosa was exposed to the concentration of 1.00x10⁶
cells mL-1 of anatoxin-a(s) extract after 7 days of exposure (H = 6.74.1, P = 0.03). The decrease
in the total number of accumulated live neonates per female was persistent after the first week
(14 days) (F2,6 = 74.2, P < 0.001) and the second week of recovery (21 days) (F2,6 = 1044.3, P <
0.001) for the same tested concentration (Fig. 4.3.4 E). For the concentration of 1.00x10⁶ cells
mL-1 of anatoxin-a(s) extract, the total numbers of accumulated live neonates per female were
0%, 43.0 ± 1.1% and 54.8 ± 0.8% relative to the control, respectively, at the time intervals of 7,
14 and 21 days. With regard to D. magna, no significant decrease in the total number of
accumulated live neonates per female was observed in relation to the control for the tested

Resultados e discussão 134
concentrations of 0.40 and 2.08x10⁶ cells mL-1 of anatoxin-a(s) extract after 7 days of exposure
(F2,6 = 2.22, P = 0.19). Also, no decrease in the total number of accumulated live neonates per
female was found after the first week (14 days) (H = 4.58, P = 0.14) and the second week of
recovery (21 days) (F2,6 = 1.37, P = 0.32) for the same tested concentrations (Fig. 4.3.4 F).
4.3.3.4.5. Survival
The survival was not significantly affected in both P. ramosa (Fig. 4.3.4 G) and D. magna
(Fig. 4.3.4 H) after 2 days (H = 0.00, P = 1.00 for both P. ramosa and D. magna), 7 days (H = 2.00,
P = 0.83 for P. ramosa and H = 8.00, P = 0.07 for D. magna), 14 days (H = 7.62, P = 0.07 for P.
ramosa and H = 7.71, P = 0.07 for D. magna) and 21 days (H = 7.62, P = 0.07 for P. ramosa and H
= 7.71, P = 0.07 for D. magna) of exposure to two sub-lethal concentrations of anatoxin-a(s)
extract.

Resultados e discussão 135
Fig. 4.3.4 Life history parameters (mean for three replicates ± standard deviation) measured in P. ramosa and D. magna after 2 and 7 days of exposure to the sub-lethal concentrations of anatoxin-a(s) extract and after the first week (14 days) and the second week of recovery in clean medium (21 days). The control is represented by C and the asterisk indicates statistically significant difference from the control (P ≤ 0.05)

Resultados e discussão 136
4.3.3.4.6. Population growth rate
At 21-day population growth rate, the rm values of P. ramosa were reduced relative to the
control for the concentration of 1.00x10⁶ cells mL-1 of anatoxin-a(s) extract (H = 7.20, P = 0.004)
(Table 4.3.2). In relation to D. magna, no reduction in the rm values was observed for the two
tested concentrations, i.e. 0.40 and 2.08x10⁶ cells mL-1 of anatoxin-a(s) extract (H = 0.80, P =
0.72) (Table 4.3.2).
Table 4.3.2. Mean values (± standard deviations) of 21-day population growth rates of P. ramosa and D. magna after 7 days of exposure to the sub-lethal concentrations of anatoxin-a(s) extract and after two weeks of recovery in clean medium
Concentrations (cells mL-1) Population growth ratea P. ramosa Control 0.3501 (0.001) 0.38x10⁶ 0.3376 (0.003) 1.00x10⁶ 0.2356 (0.003)* D. magna Control 0.3912 (0.020) 0.40x10⁶ 0.3735 (0.002) 2.08x10⁶ 0.3741 (0.002)
a Asterisk indicates statistically significant difference from the control (P ≤ 0.05)
4.3.3.5. Relationships between the 48-h ChE inhibition and effects at individual (21-day
reproduction) and populational levels (21-day population growth rate)
Statistically significant relationships between the 48-h ChE inhibition and 21-day
reproduction (F1,7 = 330.51, P < 0.001) and between the 48-h ChE inhibition and 21-day
population growth rate (F1,7 = 815.30, P < 0.001) were found for P. ramosa when exposed to the
anatoxin-a(s) extract, with determination coefficients (R2) of 0.9793 and 0.9915, respectively. In
these cases, negative linear relationships were obtained, i.e. the decreases of the 21-day
reproduction and 21-day population growth rate were directly proportional to the increase of the
48-h ChE inhibition. A 21-day reproduction of 70.65% relative to the control was linked to 10%
48-h ChE inhibition (Table 4.3.3, Fig. 4.3.5 A), whereas a 21-day population growth rate of
78.42% relative to the control was linked to 10% 48-h ChE inhibition (Table 4.3.3, Fig. 4.3.5 B).
On the other hand, in relation to D. magna, the relationships between the 48-h ChE
inhibition and 21-day reproduction (F1,7 = 0.380, P = 0.560) and between the 48-h ChE
inhibition and 21-day population growth rate (F1,7 = 0.470, P = 0.520) were not statistically
significant, when this daphnid was exposed to the anatoxin-a(s) extract, with R2 values of 0.0515
and 0.0627, respectively. In this specific case, almost no effect on 21-day reproduction and 21-

Resultados e discussão 137
day population growth rate were observed, even at high percentages of 48-h ChE inhibition. The
48-h ChE inhibitions closed to 50% were associated with 94.9% 21-day reproduction (Table
4.3.3, Fig. 4.3.5 A) and 95.9% 21-day population growth rate (Table 4.3.3, Fig. 4.3.5 B).
Table 4.3.3. Statistical results and equations for the linear regression analysis between the 48-h ChE inhibition vs. 21-day reproduction (R) and between the 48-h ChE inhibition vs. 21-day population growth rate (PGR), for both P. ramosa and D. magna, after 7 days of exposure to the two sub-lethal concentrations of anatoxin-a(s) extract and after two weeks of recovery in clean medium
Species Variables R-squared P-value Equation P. ramosa ChE inhibition vs. R 0.9793 < 0.001 R = 100.95 – (3.03 * ChE inhibition) ChE inhibition vs. PGR 0.9915 < 0.001 PGR = 100.02 – (2.16 * ChE inhibition) D. magna ChE inhibition vs. R 0.0515 0.5600 ––– ChE inhibition vs. PGR 0.0627 0.5200 –––
Fig. 4.3.5 Relationships between the (A) 48-h ChE (cholinesterase) inhibition and 21-day reproduction and between the (B) 48-h ChE inhibition and 21-day population growth rate, in both P. ramosa and D. magna, after 7 days of exposure to the sub-lethal concentrations of anatoxin-a(s) extract and after two weeks of recovery in clean medium
4.3.4. Discussion
One of the main uses of biochemical biomarkers in ERA studies is just for indicate
presence/absence of specific groups of contaminants in aquatic environments (Adams et al.,
2001). This is because specific enzymatic systems may be affected by particular toxicants (Peakall,
1992). In this study, ChE assays showed to be specific for anatoxin-a(s) extract, since significant
differences in ChE activity were not observed when both P. ramosa and D. magna were exposed to
environmentally relevant concentrations of the microcystin extract (ranging from 176.7 to 692.4
µg MC-LR L-1 for P. ramosa and from 307.1 to 1215.8 µg MC-LR L-1 for D. magna). Indeed,
according to our current knowledge, the mode of action of microcystins is not related with the
activity of this enzyme. The MC-LR, the main variant of microcystin present in NPLJ-4 strain, is
Resultados e discussão 138
a potent inhibitor of the phosphatase proteins 1 and 2A (Runnegar et al., 1993). In contrast,
some previous studies suggested that the specificity of ChE as an indicator of exposure to
anticholinesterase compounds should be questioned, since heavy metals and surfactants can
inhibit ChE activity (Guilhermino et al., 1998; Ibrahim et al., 1998). Although the utility of a
biomarker approach may be diminished because of the lack of specificity regarding to
contaminants, biomarkers may still hold value if the information generated can lead to improved
risk assessments (McLoughlin et al., 2000).
The HPLC method used to detect anatoxin-a(s) is not a method of easy execution
(Matsunaga et al., 1989). Usually, bioassays with mice are used as an alternative method for the
detection of neurotoxins produced by cyanobacteria. For both P. ramosa and D. magna, the ChE
assays performed in this study detected a significant inhibition of ChE activity for the anatoxin-
a(s) extract, but not for the microcystin extract. Furthermore, the ChE assays with these
cladocerans were done in microplates, which allowed a rapid processing of a great number of
samples. Also, by using invertebrates as test organisms, such assays have ethical advantages in
relation to tests with vertebrate animals. Thus, the present method may constitute an useful tool
for screening of anatoxin-a(s) in the natural environment or in isolated strains. However, it
should to be considered the possibility that other types of cyanotoxins, rather than anatoxin-a(s)
and microcystin, might influence the ChE activity, since in the natural aquatic environments
frequently more than one type of cyanotoxin can be found together, besides metals and
surfactants also being present.
Although cyanobacterial toxins have an important role in acute events, such as mass
mortalities of fish and birds, it does not mean that there are no chronic effects on the
invertebrates resulting from sub-lethal exposures (Ibelings and Havens, 2008). Thus,
measurements of chronic effects of cyanotoxins on invertebrates are needed. Various studies on
lethal and sub-lethal exposures to the microcystins in cladoceran species are reported in the
literature and they have shown a negative influence of toxic strains of cyanobacteria on their
survival, growth and reproduction (Chen and Xie, 2003; Ferrão-Filho et al., 2002; Gustafsson and
Hansson, 2004; Reinikainen et al., 1995). On the other hand, such studies relative to the effects
of cyanobacterial neurotoxins on the cladocerans are scarce, especially for anatoxin-a(s) (DeMott
et al., 1991; Zagatto et al., 2012).
In this study, the effects of 7 days of exposure to the sub-lethal concentrations of
anatoxin-a(s) extract and recovery after two weeks were measured in both P. ramosa and D. magna.
The results showed that the two species of cladocerans responded in different ways, having
important implications for their use in risk assessments of cyanobacterial blooms.

Resultados e discussão 139
In relation to P. ramosa, the exposure to higher tested concentration of the anatoxin-a(s)
extract (1.00x10⁶ cells mL-1, i.e. a concentration related to 10% 48-h ChE inhibition) induced the
inhibition of ChE activity after 2 and 7 days of exposure, persisting after the first and the second
weeks of recovery in clean medium. This enzymatic effect was also propagated towards different
levels of biological organization, affecting age at first reproduction, total number of accumulated
live neonates per female and population growth rate. Thus, the finding of this work indicated that
ChE activity in P. ramosa exposed to the anatoxin-a(s) extract was a good biomarker of effect
(Walker, 2001), which adds further value for its use in ERA studies. In this case, the stress
created by the anatoxin-a(s) extract caused changes in the metabolism of organism, possibly in its
energy budget. It is known that anatoxin-a(s) causes an injury in the normal activity of the nerve
impulse in the thoracic legs, mandibles and second antennae of the cladocerans (Rohrlack et al.,
2005). The cladocerans basically feed with the assistance of the movements of these appendages
and a paralysis of them may induce a depression in energy uptake (Ferrão-Filho et al., 2007;
Ghadouani et al., 2004; Rohrlack et al., 2005). Furthermore, anatoxin-a(s) extract may induce an
increase of energy spent to cope with the stress. For example, the recovery of ChE occurs
through synthesis of new enzyme (Yuan and Chambers, 1996) and this process may have a cost
for the individual. In general, less energy available can interfere in the reproduction of an
individual and, subsequently, affect the population dynamics.
In contrast, for D. magna, the exposure to higher tested concentration of the anatoxin-a(s)
extract (2.08x10⁶ cells mL-1, i.e. a concentration related to 50% 48-h ChE inhibition) induced the
inhibition of ChE activity after 2 and 7 days of exposure, persisting only after the first week of
recovery in clean medium. After the second week of recovery, levels of ChE activity were similar
to those of control. Unlike what was found for P. ramosa, the enzymatic effect in D. magna was
not propagated towards different levels of biological organization. For this daphnid, the age at
first reproduction and the total number of accumulated live neonates per female were similar to
those found in the control. As a consequence, population growth rate was not also affected.
These results reflect the same pattern found in a previous study. Freitas et al. (Capítulo 4.2)
reported that, while for P. ramosa, a 50% 48-h ChE inhibition was related with 59.5% survival, for
D. magna, a 50% 48-h ChE inhibition was related with 90.4% survival. Only above 60% 48-h
ChE inhibition, it was observed an accelerated negative response on survival associated with a
small increase in the 48-h ChE inhibition in D. magna. Duquesne (2006) found an inhibition of
ChE activity in D. magna up to 50% in relation to the control at a sub-lethal exposure to the
paraoxon-methyl (1.0 mg L-1), an organophosphate with toxicity similar to anatoxin-a(s). For this
tested concentration, this author observed no detectable effects on endpoints at higher levels of

Resultados e discussão 140
biological organization (body size, reproduction and population growth rate). Other studies have
also shown that high levels of inhibition of ChE activity in D. magna exposed to
anticholinesterase compounds were not always directly associated with more ecological relevant
effects at higher levels of biological organization (Barata et al., 2001, 2004; Printes and Callaghan,
2004; Sturm and Hansen, 1999). Printes et al. (2008) found no effect on the body length, age at
first reproduction, 21-day reproduction and 21-day population growth rate, when two clones of
D. magna were exposed for 7 days to a sub-lethal concentration of organophosphate acephate
equivalent to 50% 48-h ChE inhibition. However, in this case, there was a positive association
between the 48-h ChE activity and 21-day population growth rate, with the direction of the slope
of the relationship being different for the two clones.
The body length and survival for both studied species were not affected after 7 days of
exposure to the anatoxin-a(s) extract and two weeks of recovery in clean medium. For the
survival, these results were expected, since the higher tested concentrations were not lethal for
both P. ramosa and D. magna after 48-h exposure in a previous study (Freitas et al., Capítulo 4.2).
However, for the body length, some authors have observed a decrease in the body length for
Daphnia species, when exposed to sub-lethal concentrations of microcystin (Hietala et al., 1997;
Lürling and van der Grinten, 2003).
Another noteworthy fact is that, for P. ramosa, the ChE activity remained inhibited after
two weeks of recovery in clean medium, whereas for D. magna, a recovery close to the control
value was found after the second week. Arguments for using ChE as a biomarker of exposure
include the rapid breakdown of anticholinesterase compounds in the environment, where their
concentrations may fall below detectable levels in hours to days. The inhibition of ChE activity in
many species can persist for much longer than this, thus offering an advantage over using
analytical techniques (Fulton and Key, 2001). The ChE activity in P. ramosa has shown a best
performance as a biomarker of exposure to anatoxin-a(s) than ChE activity in D. magna.
Furthermore, P. ramosa was more sensitive than D. magna to sub-lethal exposures, since the
concentration of 1.00x10⁶ cells mL-1 of anatoxin-a(s) extract impaired its reproduction and its
population dynamics and concentrations up to 2.08x10⁶ cells mL-1 of anatoxin-a(s) extract had no
effect on these individual and populational parameters in D. magna.
In this study, the 48-h ChE inhibition was linked to the effects at individual (21-day
reproduction) and populational levels (21-day population growth rate), when both P. ramosa and
D. magna were exposed to the sub-lethal concentrations of anatoxin-a(s) extract. The plot of 48-h
ChE inhibition against 21-day reproduction or 21-day population growth rate revealed significant
differences between the two cladocerans in the relationship between the enzymatic target and

Resultados e discussão 141
chronic toxicity (Fig. 4.3.5). For P. ramosa, very close negative linear relationships were found
between the 48-h ChE inhibition and 21-day reproduction and between the 48-h ChE inhibition
and 21-day population growth rate, being that the second relationship had the best R2 value than
the first relationship. However, for D. magna, the ChE activity was strongly inhibited (up to 50%)
with no effect on 21-day reproduction and 21-day population growth rate. Thus, relationships
between the 48-h ChE inhibition and 21-day reproduction and between the 48-h ChE inhibition
and 21-day population growth rate could not be established for this species.
These interspecific differences in the sensitivity to the anatoxin-a(s) extract found in P.
ramosa and D. magna appear to be a consequence of different affinities of binding to the enzyme
(Peakall, 1992). Since ChE assays with cladocerans must be performed with whole-body
homogenates due to their small size, a mixture of both acetylcholinesterase (AChE) and
pseudocholinesterases (PChE) can be present (Diamantino et al., 2003). Although the primary
site of action of the anatoxin-a(s) is AChE, it also binds to other forms of cholinesterases (Grue
et al., 1991). Apparently, in P. ramosa, both AChE and PChE had similar affinities for the studied
cyanotoxin and direct linear relationships between the 48-h ChE inhibition and 21-day
reproduction and between the 48-h ChE inhibition and 21-day population growth rate could be
obtained. However, in D. magna, PChE probably had a higher affinity for the studied cyanotoxin
than AChE, thus reducing the amount of free anatoxin-a(s) available to inhibit AChE. This may
have given a protective effect, reflecting on the reproduction of D. magna and, consequently, on
the population growth rate. The carboxylesterase is a recognized non-specific PChE, which has a
protective function against anticholinesterase compounds (Barata et al., 2004). Thus, secondary
target sites in D. magna may have introduced variables that reduced the strength of a predictable
association between the ChE biomarker and individual and populational responses.
4.3.5. Conclusions
This study showed that inhibition of ChE activity is an useful tool for indicating the
presence of neurotoxin anatoxin-a(s), since no effect on enzymatic activity of both P. ramosa and
D. magna was found, when exposed to the hepatotoxin microcystin. However, ChE activity in P.
ramosa had a best performance as a biomarker of exposure to anatoxin-a(s) than that of D. magna,
when both species were exposed for 7 days to the anatoxin-a(s) extract. This has to be taken into
account when the ChE activity is used as a biomarker in ERA studies. Furthermore, P. ramosa was
more sensitive than D. magna in sub-lethal exposures to the anatoxin-a(s) extract, decreasing its
reproduction and its population growth rate at a concentration where no effect was observed for

Resultados e discussão 142
D. magna. Hence, the use of temperate species D. magna in the assessments of toxicity of
anatoxin-a(s) in tropical regions may overestimate the risk to local species.
The 48-h ChE inhibition in P. ramosa had a very close relationship with both 21-day
reproduction and 21-day population growth rate endpoints, whereas for D. magna, these
relationships could not be established, even at higher levels (up to 50%) of 48-h ChE inhibition.
Therefore, inhibition of ChE activity in D. magna was not a good predictor of effects at higher
levels of biological organization in the risk assessment of anatoxin-a(s).
The knowledge gained in this study is highly relevant for the ERA studies of anatoxin-a(s)
in tropical regions based on ChE activity. It has demonstrated that, for the cladocerans, the
relationships between the ChE activity and responses at higher levels of biological organization
are species-specific. Thus, our findings with anatoxin-a(s) extract indicate that the choice of test
organism can interfere with accuracy of the risk assessment of this neurotoxin, being strongly
recommended the use of native species (especially of P. ramosa) for this evaluation.
Acknowledgments
We are grateful to the National Council of Scientific and Technological Development
(CNPq) for the financial support provided for this research project (No. 141095/2009-1).

Resultados e discussão 143
References Adams, S.M., Giesy, J.P., Tremblay, L.A., Eason, C.T., 2001. The use of biomarkers in ecological risk assessment: recommendations from the Christchurch conference on biomarkers in Ecotoxicology. Biomarkers 6(1), 1-6. Adema, D.M.M., 1978. Daphnia magna as a test animal in acute and chronic toxicity tests. Hydrobiologia 59, 125-134. ASTM, 2001. Standard guide for conducting acute toxicity testing on test materials with fishes, macroinvertebrates, and amphibians. American Society for Testing and Materials, West Conshohocken, PA, pp. E729-E796. Azevedo, S.M.F.O., Evans, W.R., Carmichael, W.W., Namikoshi, M., 1994. First report of microcystins from a Brazilian isolate of the cyanobacterium Microcystis aeruginosa. J. Appl. Phycol. 6, 261-265. Azevedo, S.M.F.O., Carmichael, W.W., Jochimsen, E.M., Rinehart, K.L., Lau, S., Shaw, G.R., Eaglesham, G.K., 2002. Human intoxication by microcystins during renal dialysis treatment in Caruaru-Brazil. Toxicology 181-182, 441-446. Backer, L.C., 2002. Cyanobacterial harmful algal blooms: developing a public health response. Lake Reserv. Manage. 18(1), 20-31. Barata, C., Baird, D.J., Soares, A.M.V.M., Guilhermino, L., 2001. Biochemical factors contributing to response variation among resistant and sensitive clones of Daphnia magna Straus exposed to ethyl parathion. Ecotox. Environ. Safe. 49, 155-163. Barata, C., Solayan, A., Porte, C., 2004. Role of B-esterases in assessing toxicity of organophosphorus (chlorpyrifos, malathion) and carbamate (carbofuran) pesticides to Daphnia magna. Aquat. Toxicol. 66, 125-139. Brazilian Ministry of Health, 2003. Cianobactérias tóxicas na água para consumo humano na saúde pública e processos de remoção em água para consumo humano. Fundação Nacional de Saúde, Brasília, pp. 56. Carmichael, W.W., 1992. Cyanobacteria secondary metabolites – the cyanotoxins. J. Appl. Bacteriol. 72, 445-459. Chen, F.Z., Xie, P., 2003. The effects of fresh and decomposed Microcystis aeruginosa on cladocerans from a subtropic Chinese lake. J. Freshwater Ecol. 18, 97-104. Chen, W., Song, L., Ou, D., Gan, N., 2005. Chronic toxicity and responses of several important enzymes in Daphnia magna on exposure to sublethal microcystin-LR. Environ. Toxicol. 20(3), 323-330. Chorus, I., Bartram, J. 1999. Toxic Cyanobacteria in water. A guide to their public health consequences, monitoring and management. E & FN SPON, New York.

Resultados e discussão 144
Cook, W.O., Beasley, V.R., Dahlem, A.M., Dellinger, J.A., Harlin, K.S., Carmichael, W.W., 1988. Comparison of effects of anatoxin-a(s) and paraoxon, physostigmine and pyridostigmine on mouse-brain cholinesterase activity. Toxicon 26(8), 750-753. Cook, W.O., Dellinger, J.A., Singh, S.S., Dahlem, A.M., Carmichael, W.W., Beasley, V.R., 1989. Regional brain cholinesterase activity in rats injected intraperitoneally with anatoxin-a(s) or paraoxon. Toxicol. Lett. 49(1), 29-34. Crayton, M.A., 1993. Toxic cyanobacteria blooms: a field/laboratory guide. Department of Health, Office of Environmental Health Assessments, Washington. DeMott, W.R., Zhang, Q.X., Carmichael, W.W., 1991. Effects of toxic cyanobcteria and purified toxins on the survival and feeding of a copepod and three species of Daphnia. Limnol. Oceanogr. 36, 1346-1357. Diamantino, T.C., Almeida, E., Soares, A.M.V.M., Guilhermino, L., 2003. Characterization of cholinesterases from Daphnia magna Straus and its inhibition by zinc. B. Environ. Contam. Tox. 71, 219-225. Do Hong, L.C., Becker-Van Slooten, K., Tarradellas, J., 2004. Tropical ecotoxicity testing with Ceriodaphnia cornuta. Environ. Toxicol. 19, 497-504. Domingues, I., Guilhermino, L., Soares, A.M.V.M., Nogueira, A.J.A., 2007. Assessing dimethoate contamination in temperate and tropical climates: potential use of biomarkers in bioassays with two chironomid species. Chemosphere 69, 145-154. Domingues, I., Agra, A.R., Monaghan, K., Soares, A.M.V.M., Nogueira, A.J.A., 2010. Cholinesterase and glutathione-S-transferase activities in freshwater invertebrates as biomarkers to assess pesticide contamination. Environ. Toxicol. Chem. 29(1), 5-18. Duquesne, S., 2006. Effects of an organophosphate on Daphnia magna at suborganismal and organismal levels: implications for population dynamics. Ecotox. Environ. Safe. 65, 145-150. Elías-Gutiérrez, M., Smirnov, N.N., Suárez-Morales, E., Dimas-Flores, N., 2001. New and little known cladocerans (Crustacea: Anomopoda) from southeastern Mexico. Hydrobiologia 442(1-3), 41-54. Elmoor-Loureiro, L.M.A., 2007. Phytophilous cladocerans (Crustacea: Anomopoda and Ctenopoda) from Paranã River Valley, Goiás, Brazil. Rev. Bras. Zool. 24(2), 344-352. Ferrão-Filho, A.S., Azevedo, S.M.F.O., DeMott, W.R., 2000. Effects of toxic and non-toxic cyanobacteria on the life history of tropical and temperate cladocerans. Freshwater Biol. 43, 1-19. Ferrão-Filho, A.S., Domingos, P., Azevedo, S.M.F.O., 2002. Influences of a Microcystis aeruginosa Kützing bloom on zooplankton populations in Jacarepaguá Lagoon (Rio de Janeiro, Brazil). Limnologica 32, 295-308. Ferrão-Filho, A.S., Cunha, R., Magalhães, V.F., Soares, M.C.S., Baptista, D.F., 2007. Evaluation of sub-lethal toxicity of cyanobacteria on the swimming activity of aquatic organisms by image analysis. J. Braz. Soc. Ecotoxicol. 2, 93-100.

Resultados e discussão 145
Ferrão-Filho, A.S., Costa, S.M., Ribeiro, M.G.L., Azevedo, S.M.F.O., 2008. Effects of a saxitoxin-producer strain of Cylindrospermopsis raciborskii (cyanobacteria) on the swimming movements of cladocerans. Environ. Toxicol. 23, 161-168. Ferrão-Filho, A.S., Soares, M.C., Magalhães, V.F., Azevedo, S.M.F.O., 2009. Biomonitoring of cyanotoxins in two tropical reservoirs by cladoceran toxicity bioassays. Ecotox. Environ. Safe. 72, 479-489. Finney, D.J., 1971. Probit Analysis, third ed. Cambridge University Press, Cambridge. Fisher, T.C., Crane, M., Callaghan, A., 2000. An optimized microtiterplate assay to detect acetylcholinesterase activity in individual Chironomus riparius Meigen. Environ. Toxicol. Chem. 19, 1749-1752. Forbes, V.E., Calow, P., 1999. Is the per capita rate of increase a good measure of population-level effects in ecotoxicology? Environ. Toxicol. Chem. 18, 1544-1556. Freitas, E.C., Rocha, O., 2011a. Acute toxicity tests with the tropical cladoceran Pseudosida ramosa: the importance of using native species as test organisms. Arch. Environ. Cont. Tox. 60, 241-249. Freitas, E.C., Rocha, O., 2011b. Acute and chronic effects of sodium and potassium on the tropical freshwater cladoceran Pseudosida ramosa. Ecotoxicology 20, 88-96. Freitas, E.C., Rocha, O., 2011c. Acute and chronic toxicity of chromium and cadmium to the tropical cladoceran Pseudosida ramosa and the implications for ecotoxicological studies. Environ. Toxicol. DOI 10.1002/tox Freitas, E.C., Rocha, O., 2012. Acute and chronic effects of atrazine and sodium dodecyl sulfate on the tropical freshwater cladoceran Pseudosida ramosa. Ecotoxicology 21, 1347-1357. Freitas, E.C., Printes, L.B., Fernandes, M.N., Rocha, O., Capítulo 4.1. Measurements of cholinesterases activity in the tropical freshwater cladoceran Pseudosida ramosa and its standardization as a biomarker (Submitted). Freitas, E.C., Printes, L.B., Rocha, O., Capítulo 4.2. Acute effects of the anatoxin-a(s) extract and paraoxon-methyl on freshwater cladocerans from tropical and temperate regions: links between the ChE activity and survival and its implications for tropical ecotoxicological studies (Submitted). Fulton, M.H., Key, P.B., 2001. Acetylcholinesterase inhibition in estuarine fish and invertebrates as an indicator of organophosphorus insecticide exposure and effects. Environ. Toxicol. Chem. 20, 37-45. Ghadouani, A., Pinel-Alloul, B., Prepas, E.E., 2003. Effects of experimentally induced cyanobacterial blooms on crustacean zooplankton communities. Freshwater Biol. 48, 363-381. Ghadouani, A., Pinel-Alloul, B., Plath, K., Codd, G.A., Lampert, W., 2004. Effects of Microcystis aeruginosa and purified microcystin-LR on the feeding behavior of Daphnia pulicaria. Limnol. Oceanogr. 49, 666-679.

Resultados e discussão 146
Gilbert, J.J., 1990. Differential effects of Anabaena affinis on cladocerans and rotifers: mechanisms and implications for zooplankton community structure. Ecology 71, 1727-1740. Gorham, P.R., McLachlan, J., Hammer, U.T., Dim, W.K., 1964. Isolation and culture of toxic strain of Anabaena flos-aquae (Lyngb.) de Bréb. Verh. Internat. Verein. Limnol. 15, 796-804. Grue, C.E., Hart, A.D.M., Mineau, P., 1991. Biological consequences of depressed brain cholinesterase activity in wildlife, in: Mineau, P. (Ed.), Cholinesterase-inhibiting insecticides - their impact on wildlife and the environment. Elsevier, London, pp. 151-209. Guilhermino, L., Barros, P., Silva, MC, Soares, A.M.V.M., 1998. Should the use of inhibition of cholinesterases as a specific biomarker for organophosphate and carbamate pesticides be questioned? Biomarkers 3(2), 157-163. Gustafsson, S., Hansson, L.-A., 2004. Development of tolerance against toxic cyanobacteria in Daphnia. Aquat. Ecol. 38, 37-44. Hietala, J., Laurén-Määttä, C., Walls, M., 1997. Life history responses of Daphnia clones to toxic Microcystis at different food levels. J. Plankton Res. 19(7), 917-926. Ibelings, B.W., Havens, K.E., 2008. Cyanobacterial toxins: a qualitative meta-analysis of concentrations, dosage and effects in freshwater, estuarine and marine biota, in: Hudnell, H.K. (Ed.), Cyanobacterial harmful algal blooms: state of the science and research needs. Springer Science, New York, pp. 675-732. Ibrahim, H., Kheir, R., Helmi, S., Lewis, J., Crane, M., 1998. Effects of organophosphorus, carbamate, pyrethroid and organochlorine pesticides, and a heavy metal on survival and cholinesterase activity of Chironomus riparius Meigen. B. Environ. Contam. Tox. 60, 448-455. Jemec, A., Drobne, D., Tišler, T., Trebše, P., Roš, M., Sepčić, K., 2007. The applicability of acetylcholinesterase and glutathione S-transferase in Daphnia magna toxicity test. Comp. Biochem. Physiol. C 144, 303-309. Jochiminsen, E.M., Carmichael, W.W., An, J.S., Cardo, D.M., Cookson, S.T., Holmes, C.E., Antunes, M.B., De Mello Filho, D.A., Lyra, T.M., Barreto, V.S., Azevedo, S.M., Jarvis, W.R., 1998. Liver failure and death after exposure to microcystins at a hemodialysis center in Brazil. N. Engl. J. Med. 338(13), 873-878. Korovchinsky, N.M., 1992. Sididae and Holopedidae: guides to the identification of microinvertebrates of the continental waters of the world. SPB Academic Publishing, The Hague. Lagos, N., Onodera, H., Zagatto, P.A., Andrinolo, D., Azevedo, S.M.F.O., Oshima, Y., 1999. The first evidence of paralytic shellfish toxins in the freshwater cyanobacterium Cylindrospermopsis raciborskii, isolated from Brazil. Toxicon 37, 1359-1373. Lampert, W., 1981. Toxicity of blue-green Microcystis aeruginosa: effective defense mechanism against grazing pressure by Daphnia. Ver. Internat. Verein. Theor. Ang. Limnol. 21, 1436-1440. Lürling, M., van der Grinten, E., 2003. Life-history characteristics of Daphnia exposed to dissolved microcystin-LR and to the cyanobacterium Microcystis aeruginosa with and without microcystins. Environ. Toxicol. Chem. 22(6), 1281-1287.
Resultados e discussão 147
Mahmood, N.A., Carmichael, W.W., 1986. The pharmacology of anatoxina(s), a neurotoxin produced by the freshwater cyanobacterium Anabaena flos-aquae NRC 525-17. Toxicon 24, 425-434. Maiphae, S., Pholpunthin, P., Dumont, H.J., 2005. Species richness of the cladocera (Branchiopoda: Anomopoda and Ctenopoda) in southern Thailand, and its complementarity with neighboring regions. Hydrobiologia 537, 147-156. Matsunaga, S., Moore, R.E., Niemczura, W.P., Carmichael, WW., 1989. Anatoxin-a(s), a potent anticholinesterase from Anabaena flos-aquae. J. Amer. Chem. Soc. 111, 8021-8023. Matthiensen, A., Beattie, K.A., Yunes, J.S., Kaya, K., Codd, G.A., 2000. [D-Leu(1)]microcystin-LR, from the cyanobacterium Microcystis RST 9501 and from a Microcystis bloom in the Patos Lagoon estuary, Brazil. Phytochemistry 55, 383-387. McLoughlin, N., Yin, D., Maltby, L., Wood, R.M., Yu, H., 2000. Evaluation of sensitivity and specificity of two crustacean biochemical biomarkers. Environ. Toxicol. Chem. 19(8), 2085-2092. Molica, R.J.R., Oliveira, E.J.A., Carvalho, P.V.V.C., Costa, A.N.S.F., Cunha, M.C.C., Melo, G.L., Azevedo, A.M.F.O., 2005. Occurrence of saxitoxins and an anatoxin-a(s)-like anticholinesterase in a Brazilian drinking water supply. Harmful Algae 4, 743-753. Monserrat, J.M., Yunes, J.S., Bianchini, A., 2001. Effects of Anabaena spiroides (Cyanobacteria) aqueous extracts on the aceltycholinesterase activity of aquatic species. Environ. Toxicol. Chem. 20, 1228-1235. Moreira-Santos, M., Fonseca, A.L., Moreira, S.M., Osten, J.R.-V., Da Silva, E.M., Soares, A.M.V.M., Guilhermino, L., Ribeiro, R., 2005. Short-term sublethal (sediment and aquatic roots of floating macrophytes) assays with a tropical chironomid based on postexposure feeding and biomarkers. Environ. Toxicol. Chem. 24(9), 2234-2242. Morrone, J.J., Coscarón, S., 1998. Biodiversidad de artrópodos argentinos: una perspectiva biotaxonómica. Ediciones SUR, La Plata. Müller, H., 1972. Wachstum and phosphatbedarf von Nitzschia actinastroides (Lemn.) v. Goor in statischer und homokontiuierliecher kultur unter phosphatlimitierung. Arch. Hydrobiol. Suppl. 38, 399-484. OECD, 2004. Guideline for testing of chemicals. Daphnia sp., acute immobilisation test. OECD 202. Paris, France: Organization for Economic Cooperation and Development. OECD, 2008. Guideline for testing of chemicals. Daphnia magna reproduction test. OECD 211. Paris, France: Organization for Economic Cooperation and Development. Ortiz-Rodríguez, R., Wiegand, C., 2010. Age related acute effects of microcystin-LR on Daphnia magna biotransformation and oxidative stress. Toxicon 56, 1342-1349. Peakall, D.B., 1992. Animal biomarkers as pollution indicators. Chapman & Hall, London.

Resultados e discussão 148
Printes, L.B., Callaghan, A., 2004. A comparative study on the relationship between acetylcholinesterase activity and acute toxicity in Daphnia magna exposed to anticholinesterase insecticides. Environ. Toxicol. Chem. 23(5), 1241-1247. Printes, L.B., Fellowes, M.D.E., Callaghan, A., 2008. Clonal variation in acetylcholinesterase biomarkers and life history traits following OP exposure in Daphnia magna. Ecotox. Environ. Safe. 71, 519-526. Printes, L.B., Fernandes, M.N., Espíndola, E.L.G., 2011. Laboratory measurements of biomarkers and individual performances in Chironomus xanthus to evaluate pesticide contamination of sediments in a river of southeastern Brazil. Ecotox. Environ. Safe. 74(3), 424-430. Reinikainen, M., Ketola, M., Jantunen, M., Walls, M., 1995. Effects of Microcystis aeruginosa exposure and nutritional status on reproduction of Daphnia pulex. J. Plankton Res. 17, 431-436. Reinikainen, M., Meriluoto, J.A.O., Spoof, L., Harada, K.I., 2001. The toxicities of a polyunsaturated fatty acid and a microcystin to Daphnia magna. Environ. Toxicol. 16, 444-448. Rey, J., Vasquez, E., 1986. Cladocères de quelques corps d’eaux du bassin moyen de l’Orénoque (Venezuela). Ann. Limnol. 22(2), 137-168. Roa, E.Z., Vasquez, W. 1991. Additional cladoceran records for Mantecal and new for Venezuela. Hydrobiologia 225, 45-62. Rohrlack, T., Christoffersen, K., Hansen, P.E., Zhang, W., Zarnecki, O., Henning, M., Fastner, J., Erhard, M., Neilan, B.A., Kaebernick, M., 2003. Isolation, characterization, and quantitative analysis of microviridin J, a new Microcystis metabolite toxic to Daphnia. J. Chem. Ecol. 29, 1757-1770. Rohrlack, T., Christoffersen, K., Dittmann, E., Nogueira, I., Vasconcelos, V., Börner, T., 2005. Ingestion of microcystins by Daphnia: intestinal uptake and toxic effects. Limnol. Oceanogr. 50, 440-448. Runnegar, M.T.C., Kong, S.M., Berndt, N. 1993. Protein phosphatase inhibition and in vivo hepatotoxicity of microcystins. Am. J. Physiol. 265(2), 224-230. Sanoamuang, L.O., 1998. Contributions to the knowledge of the Cladocera of northeast Thailand. Hydrobiologia 362(1-3), 45-53. Scholz, N.L., Hopkins, W.A., 2006. Ecotoxicology of anticholinesterase pesticides: data gaps and research challenges. Environ. Toxicol. Chem. 25, 1185-1186. Sibly, R.M., 1996. Effects of pollutants on individual life histories and population growth rates, in: Newman, M.C., Jagoe, C.H. (Eds.), Ecotoxicology: a hierarchical treatment. CRC Press, Lewis Publishers, Boca Raton, pp. 197-233. Sibly, R.M., 1999. Efficient experimental designs for studying stress and population density in animal populations. Ecol. Appl. 9, 496-503.

Resultados e discussão 149
Smith, P.K., Krohn, R.I., Hermanson, G.T., Mallia, A.K., Gartner, F.H., Provenzano, M.D., Fujimoto, E.K., Goeke, N.M., Olson, B.J., Klenk, D.C., 1985. Measurement of protein using bicinchoninic acid. Anal. Biochem. 150, 76-85. Soares, R.M., Magalhães, V.F., Azevedo, S.M.F.O., 2004. Accumulation and depuration of microcystins (cyanobacteria hepatotoxins) in Tilapia rendalli (Cichlidae) under laboratory conditions. Aquat. Toxicol. 70, 1-10. Sotero-Santos, R.B., Sousa e Silva, C.R., Verani, N.F., Nonaka, K.O., Rocha, O., 2006. Toxicity of a cyanobacteria bloom in Barra Bonita Reservoir (Middle Tietê River, São Paulo, Brazil). Ecotox. Environ. Safe. 64, 163-170. Sotero-Santos, R.B., Carvalho, E.G., Dellamano-Oliveira, M.J., Rocha, O., 2008. Occurrence and toxicity of an Anabaena bloom in a tropical reservoir (Southeast Brazil). Harmful Algae 7, 590-598. Sturm, A., Hansen, P.D., 1999. Altered cholinesterase and monooxygenase levels in Daphnia magna and Chironomus riparius exposed to environmental pollutants. Ecotox. Environ. Safe. 42, 9-15. Systat. 2006. Systat Software, Incorporation. SigmaPlot for Windows version 10.0. Thostrup, L., Christofferson, K., 1999. Accumulation of microcystin in Daphnia magna feeding on toxic microcystis. Arch. Hydrobiol. 145, 447-467. Trayler, K.M., Davis, J.A., 1996. Sensitivity of Daphnia carinata sensu lato to the insect growth regulator, pyriproxyfen. Ecotox. Environ. Safe. 33(2), 154-156. U.S. EPA, 2002. Methods for measuring the acute toxicity of effluents and receiving waters to freshwater and marine organisms. The United States Environmental Protection Agency, Washington, D.C. Van Gestel, C.A.M., Van Brummelen, T.C., 1996. Incorporation of the biomarker concept in ecotoxicology calls for a redefinition of terms. Ecotoxicology 5, 217-225. Vieira, J.M., Azevedo, M.T.P., Azevedo, S.M.F.O., Honda, R.Y., Correia, B., 2005. Toxic cyanobacteria and microcystin concentrations in a public water supply reservoir in the Brazilian Amazonia region. Toxicon 45, 901-909. Walker, C.H., Hopkin, S.P., Sibly, R.M., Peakall, D.B., 2001. Principles of Ecotoxicology. Taylor & Francis, London. WHO, 1998. Guidelines for drinking-water quality. Addendum to volume 2. Health criteria and other supporting information, second ed. Word Health Organization, Geneva. Wiegand, C., Peuthert, A., Pflugmacher, S., Carmeli, S., 2002. Effects of microcin SF608 and microcystin-LR, two cyanotobacterial compounds produced by Microcystis sp., on aquatic organisms. Environ. Toxicol. 17(4), 400-406. Wiegand, C., Pflugmacher, S., 2005. Ecotoxicological effects of selected cyanobacterial secondary metabolites a short review. Toxicol. Appl. Pharm. 203, 201-218.

Resultados e discussão 150
Yuan, J.Z., Chambers, H.W., 1996. Toxicology and biochemistry of two aliesterase inhibitors as synergists of four organophosphorus insecticides in boll weevils (Coleoptera: Curculionidae). Pestic. Biochem. Physiol. 54, 210-219. Yunes, J.S., Cunha, N.T., Proença, L.A.O., Barros, L.P., Monserrat, J.M., 2003. Cyanobacterial neurotoxins from Southern Brazilian freshwaters. Comments Toxicol. 9, 103-115. Zagatto, P.A., Buratini, S.V., Aragão, M.A., Ferrão-Filho, A.S., 2012. Neurotoxicity of two Cylindrospermopsis raciborskii (Cyanobacteria) strains to mice, Daphnia, and fish. Environ. Toxicol. Chem. 31(4), 857-862.

Resultados e discussão 151
Capítulo 4.4. Can mixtures of cyanotoxins represent a risk to the zooplankton? The case
study of Daphnia magna Straus exposed to the hepatotoxic and neurotoxic
cyanobacterial extracts
Abstract – Worldwide, cyanobacterial blooms have been increasing in intensity and frequency, with toxic
cyanobacteria sometimes dominant throughout the year in many freshwater bodies. Since the coexistence of
different types of cyanotoxins in freshwater environments is a common phenomenon, studies on the joint effects of
these toxins would be very useful. In this study, the single and combined effects of two cyanotoxins with different
modes of action (hepatotoxic and neurotoxic) on the survival (lethal exposure) and feeding (sublethal exposure) of
the cladoceran Daphnia magna were investigated. For the single exposures, it was observed that both the survival and
feeding activity of the daphnids were impaired by the hepatotoxic and neurotoxic extracts at environmentally
relevant concentrations. In relation to the mixture exposures, both survival and feeding rate endpoints showed a
good fit to the Independent Action Model. For the acute assay and 24-h exposure period in the feeding inhibition
test, there was no interaction between components of the hepatotoxic and neurotoxic extracts, although a slight
tendency to a synergistic deviation could be seen in the feeding rates. On the other hand, for the 4-h post-exposure
period, a synergistic deviation was found in feeding rates at all mixture concentrations tested. Hence, the combined
exposure of hepatotoxins and neurotoxins should also be taken into account in risk assessments of freshwater
bodies, since the mixture of these toxins can result in more severe post-exposure effects in the feeding of daphnids
than those expected for single exposure.
Keywords: microcystin-LR; anatoxin-a(s); cyanobacterial extracts; binary mixtures; Daphnia magna; synergism.
4.4.1. Introduction
As a result of agricultural, industrial and urban development over the last two centuries,
aquatic environments, especially freshwater bodies, have been subject to the severe impacts from
nutrient inputs. One of these impacts is justly the proliferation of cyanobacterial blooms
(Azevedo et al., 2002; Barros et al., 2004; Becker et al., 2010).
It is common knowledge that cyanobacteria can produce secondary metabolites with toxic
properties, known as cyanotoxins (Carmichael, 1992). Around the world, these toxins have been
responsible for inducing deleterious effects on aquatic communities, besides inducing the death
of wild and domestic animals, including also some human fatalities (Ressom et al., 1994;
Jochiminsen et al., 1998; Carmichael et al., 2001). According to their functional groups relative to
the effects in humans, cyanotoxins can be classified among hepatotoxins, neurotoxins,
cytotoxins, dermatotoxins and irritant toxins (lipopolysaccharides) (Jochiminsen et al., 1998;
Wiegand and Pflugmacher, 2005), the type most commonly found in freshwater habitats being
the hepatotoxins, followed by neurotoxins (Chorus and Bartram, 1999).

Resultados e discussão 152
Most of the studies on the acute and chronic effects of cyanotoxins in aquatic organisms
are based on observing the effects of exposures to single toxins in laboratory assays (Wiegand et
al., 1999; LeBlanc et al., 2005; Babica et al., 2007; Ferrão-Filho et al., 2008; Sotero-Santos et al.,
2008). However, it is observed that in the natural environment organisms are constantly exposed
to complex mixtures of cyanotoxins, such as hepatotoxins and neurotoxins. In Brazil, for
instance, in freshwater reservoirs, is commonly found the coexistence of the species Microcystis
aeruginosa and Anabaena spiroides, both with the potential to produce, respectively, hepatotoxins
and neurotoxins (Matsumura-Tundisi and Tundisi, 2005; Dellamano-Oliveira et al., 2007;
Moschini-Carlos et al., 2009). Since cyanotoxins are rarely found alone in freshwater bodies, but
commonly in combination with others, there are some theoretical models (Cassee et al., 1998;
Jonker et al., 2004, 2005) that can be applied in order to predict/evaluate, in a more realistic way,
the behavior of these toxins when they occur together in the environment. This will enable a
more accurate evaluation of risk of cyanotoxin exposures to aquatic environments.
The theoretical models used to evaluate mixture toxicity are based on two non-interaction
concepts, Concentration Addition (CA) (Loewe and Muischnek, 1926) and Independent Action
(IA) (Bliss, 1939). Both describe the joint toxicity of chemicals based on the mode of action of
each one of them. The Concentration Addition (CA) model assumes that individual toxicants
have the same mode of action and act upon the same biological target, contributing to a common
response in proportion to their respective toxicities. Thus, this conceptual model is defined as a
summation of the relative toxicities of the individual chemicals in the mixture (Groten, 2000;
Ferreira et al., 2008; Loureiro et al., 2010). Alternatively, Independent Action (IA) model assumes
that individual toxicants have different modes of action and thus do not interfere with each other
during their action on the respective target sites. In this case, the IA model is defined as a
multiplication of the probabilities for each individual chemical toxicity in the mixture (Olmstead
and LeBlanc, 2005; Loureiro et al., 2010). When the modes of action of the chemicals are
unknown, both CA and IA models are used and the one that best fits the data is chosen over the
other (Loureiro et al., 2010; Pavlaki et al., 2011).
Deviations from CA and IA concepts may occur when there are interactions between the
effects of toxicants in the mixture. The mechanisms that lead to these interactions may be
physicochemical and/or biological (Cassee et al., 1998; Ferreira et al., 2008). The deviations
expected are those that produce a more severe (synergism) or less severe (antagonism) effect, or
those dependent from the level of both chemicals (different deviations at low and high
concentrations) or dependent on the components’ ratio (deviations differ from the mixture
composition) (Jonker et al., 2005; Ferreira et al., 2008).
Resultados e discussão 153
Zooplankton are considered the main target of cyanotoxins since it is believed that their
secondary metabolites are produced for the purpose of defense against herbivory (Lampert,
1981). Since the cyanotoxins have specific acute and chronic effects on these organisms (DeMott
et al., 1991; Ferrão-Filho et al., 2000; Sotero-Barbosa et al. 2006; Ferrão-Filho et al., 2008), they
are considered excellent indicators of the presence of such toxins in aquatic environments.
In the present study, we performed acute toxicity assays and feeding inhibition tests,
which includes a post-exposure period with the cladoceran Daphnia magna Straus 1820 to
evaluated the effects of combined exposures to binary mixtures of two cyanobacterial extracts
with dissimilar modes of action: hepatotoxic (microcystin) and neurotoxic (anatoxin-a(s)).
Microcystins (MCs) are molecules of cyclic heptapeptides with a hepatotoxic mode of
action (Carmichael, 1992). At the molecular level, they are responsible for the inhibition of
protein phosphatases 1 (PP1) and 2A (PP2A) in the eukaryotic cells (Carmichael, 1992; Falconer,
1999; Martins and Vasconcelos, 2009), besides provoking oxidative damages (Chen et al., 2005;
Leflaive and Ten-Hage, 2007). On the other hand, anatoxin-a(s) (ANTX-a(s)) is an alkaloid with a
neurotoxic mode of action (Mahmood and Carmichael, 1987). It is considered a natural
organophosphate that acts as an irreversible inhibitor of acetylcholinesterase (AChE) activity
(Barros et al., 2004; Molica et al., 2005), preventing the hydrolization of the neurotransmitter
acetylcholine. As a consequence, acetylcholine remains attached to the nerve membrane
receptors, resulting in continuous stimulation of the central and peripheral nervous system
(Becker et al., 2010).
The main objectives of this study were to assess the lethal and sublethal effects of a
mixture of two cyanobacterial extracts – hepatotoxic and neurotoxic – on the test organism D.
magna. For this, we used mortality and feeding as endpoints to evaluate, respectively, lethal and
sublethal exposures.
4.4.2. Material and methods
4.4.2.1. Test organism and culture conditions
All assays were carried out with the cladoceran Daphnia magna Straus clone Beak. Cultures
were maintained in 6-L glass aquariums with 3 L of ASTM moderately hard water medium
(ASTM, 2001), renewed three times weekly. Daphnids were fed daily with Pseudokirchneriella
subcapitata at a concentration of 3x10⁵ cells mL-1 and an organic additive (seaweed extract from
Ascophyllum nodosum) was added to the culture medium at a concentration of 4.8 mL L-1 of ASTM

Resultados e discussão 154
(Baird et al., 1989). Fifty individuals per aquarium were kept under a light: dark photoperiod of
16: 8 h and at 20 ± 1oC. All experiments were initiated with third to fifth brood neonates (≤ 24-h
old) derived from a healthy parent stock. Every three months, the health of the cultures was
evaluated by acute toxicity tests with the reference substance potassium dichromate (K2Cr2O7).
4.4.2.2. Origin and laboratory cultures of Microcystis aeruginosa and Anabaena spiroides
Two species of cyanobacteria were used for the assays: toxic strains of Microcystis aeruginosa
(Kutzing) Kutzing 1846 (producer of hepatotoxin) and Anabaena spiroides Klebahn 1895
(producer of neurotoxin).
The Microcystis aeruginosa strain (NPLJ-4) was isolated in 1996 from Jacarepaguá lagoon,
Rio de Janeiro, Brazil. This strain produces four types of hepatotoxin, among which microcystin-
LR (MC-LR) represents 80% of the total quantity (Soares et al., 2004). The Anabaena spiroides
strain (ITEP-024) was isolated in 2002 from Tapacurá reservoir by Dr. Renato Molica of the
Technology Institute of Pernambuco, Pernambuco, Brazil. This strain produces anatoxin-a(s),
verified by liquid chromatography – mass spectrometry analysis (LC/MS) (Molica et al., 2005).
Both the strains were supplied by Dr. Sandra Azevedo of the Federal University of Rio de
Janeiro, Brazil.
The strains of M. aeruginosa and A. spiroides were cultured in 6-L Erlenmeyer flasks
containing 3 L autoclaved ASM-1 medium (Gorham et al., 1964), with pH adjusted between 7.0
to 7.5. The cyanobacteria were grown at 25 ± 1oC, with a light: dark photoperiod of 12: 12 h, in
gently aerated culture medium. For both strains, cells were harvested at the late exponential phase
of growth by centrifuging and lyophilized at -80oC until full dehydration. Freeze-dried cells were
preserved at -20oC until used for extract preparation.
4.4.2.3. Preparation of the cyanobacterial extracts for assays
For the release of the toxins, 0.50 g of freeze-dried cells of M. aeruginosa or A. spiroides
were dispersed in approximately 10 mL nanopure water and ground manually in a mortar for 10
min. After this procedure, the volume of each extract was completed to 50 mL with nanopure
water. Immediately, both the hepatotoxic and neurotoxic extracts were ultrasonicated on ice in 5
cycles of 1 min each, at a frequency of 20 kHz. Each cycle was separated by a period of 1 min.
Finally, lysed cells were removed by centrifuging at 4000 rpm for 20 min. Only the supernatants

Resultados e discussão 155
were used in the tests and all extracts were prepared just before the assays. Hepatotoxic and
neurotoxic extracts had a final concentration of 10 g L-1.
4.4.2.4. Cyanotoxin analysis
The MC content was quantified using a commercial enzyme-linked immunoassay
(ELISA) with an Envirogard microcystin plate kit (Strategic Diagnostics, Newark, USA). The
results were given as microcystin-LR (MC-LR) equivalents in µg g-1 dry weight of freeze-dried
cells. In relation to the ANTX-a(s), there is a lack of commercially available analytical standards,
which hampers the development of specific direct methods for its quantification. Thus, in this
study, it was not possible to quantify ANTX-a(s) directly in the tested extracts; however, as cited
above, it is known that this strain produces ANTX-a(s), as verified by LC/MS (Molica et al.,
2005).
For the purpose of comparison between hepatotoxic and neurotoxic extracts, the results
of assays for each cyanobacterial extract were expressed in mg dry weight of freeze-dried cells per
liter. In the Discussion section, the results for hepatotoxic extract were also expressed in µg of
MC-LR per g dry weight of freeze-dried cells in order to compare the MC-LR concentrations
found in this study with those in the environment.
4.4.2.5. Single toxicity tests
4.4.2.5.1. Acute toxicity tests
Acute toxicity tests were carried out in accordance with the OECD 202 guideline
(OECD, 2004), using only daphnids born of the 3rd to 5th brood. Hepatotoxic and neurotoxic
extracts, prepared according to section 4.4.2.3, were diluted in ASTM medium to obtain the
desired test concentrations. Briefly, five neonates (≤ 24-h old) were exposed to 50 mL of
hepatotoxic or neurotoxic extract in a glass vial, at concentrations of 12.5, 25, 50, 100, 200, 400
and 800 mg L-1, plus a control with ASTM only. These concentrations were based on preliminary
tests (data unpublished). Five replicates per treatment were used and no food was provided for
the daphnids during assays. The test recipients were maintained for 48-h at 20 ± 1oC, in total
darkness, as recommended by the OECD for photosensitive chemicals (OECD, 2004). After
gentle stirring, the number of organisms immobilised or dead was recorded after 48-h of
exposure and the median lethal concentration (LC50) values calculated.

Resultados e discussão 156
4.4.2.5.2. Feeding inhibition and post-exposure tests
The feeding inhibition and post-exposure tests were based on the method described by
McWilliam and Baird (2002). Organisms less than 24-h old were maintained under the same
culture conditions until they were completed 4-5 days old (corresponding to the fourth instar).
Individuals at this life stage were chosen to avoid moulting occurring during the assays, as it is
known to interfere with feeding activity of daphnids (Allen et al., 1995).
The basic design of the assays was to expose five individuals (4-5 days old) to 50 mL of
hepatotoxic or neurotoxic extract in a glass vial, at concentrations of 15.625, 31.25, 62.5, 125 and
250 mg L-1, plus a negative control with ASTM only. These test concentrations were obtained by
diluting in ASTM medium the hepatotoxic and neurotoxic extracts prepared as described in
section 4.4.2.3. Five replicates were used for control and each treatment during the exposure
period and the animals were fed for 24-h with Pseudokirchneriella subcapitata at a concentration of
5x 10⁵ cells mL-1. A set of three replicates (50 mL), with algae at a concentration of 5x 10⁵ cells
mL-1 but no daphnids, were used as blanks for each treatment in order to determine any changes
from the initial algal concentration. Furthermore, due to the blue-green colour of cyanobacterial
extracts, it was necessary to prepare for each treatment a set of three replicates (50 mL) with only
extracts diluted in ASTM medium to reset the background colour.
After 24-h, all the individuals in each replicate were transferred to 50 mL clean ASTM
medium with a concentration of 5x 10⁵ cells mL-1 of P. subcapitata and allowed to feed for 4-h
(post-exposure period). A blank set of three replicates (50 mL), with algae at 5x 10⁵ cells mL-1,
but no daphnids, was used as previously explained. All assays were done in the dark to produce
uniform feeding rates during the 24-h exposure and 4-h post-exposure periods (Haney, 1985;
McWilliam and Baird, 2002).
Each replicate was vigorously shaken to resuspend settled cells at the end of the exposure
and post-exposure periods and its absorbance was determined at 440 nm by spectrophotometry.
Feeding rates for the 24-h exposure and 4-h post-exposure periods were calculated by the
equation given by Allen et al. (1995) as follows:
F = V (C0 – C24 or 4)/ t, where F is the feeding rate (cells individual-1 h-1); V is volume of
medium in the test vessel (mL); C0 is initial algal cell concentration (cells mL-1); C(24 or 4) is final
algal cell concentration (cells mL-1) and t is duration of the experiment (hours).

Resultados e discussão 157
The values of feeding rates for 24-h exposure and 4-h post-exposure periods for the
different treatments were used to calculate the median effective concentration (EC50) values, in
which feeding rates were inhibited by 50%.
4.4.2.6. Mixture toxicity tests
The mixture tests (acute and feeding inhibition assays) were carried out according to the
same guidelines of the single exposures of cyanobacterial extracts, except for the number of
replicates used per treatment. For the acute toxicity and feeding inhibition tests, three and one
replicate(s) were used per treatment, respectively. Decreasing the number of replicates allowed
more treatments (mixtures) to be used in each test, so that a reliable coverage of the response
surface could be achieved. This has been advocated as a way to increase both the reliability and
power of the analysis, since response surface analysis is based on a regression model and
variances are calculated between data and model values (Jonker et al., 2004, 2005; Ferreira et al.,
2008; Loureiro et al., 2010).
4.4.2.6.1. Acute toxicity test
For the acute toxicity test, an experimental design that included simultaneously a single
evaluation of each cyanobacterial extract and a set of 25 combinations was chosen for the
mixture assay. A full factorial design (Fig. 4.4.1 A) was used because there was no concern over
mortality occurring in mixtures with high concentrations of both cyanobacterial extracts (as
mortality is the endpoint to be measured). The concentrations of the hepatotoxic and neurotoxic
extracts used in both single and combined assays ranged from 25 to 400 mg L-1. The test
concentrations used in the mixture assay were obtained from results of preliminary tests with
single exposure of the cyanobacterial extracts. Three replicates with five organisms (≤ 24-h old)
each were used for the single and combined assays.
4.4.2.6.2. Feeding inhibition and post-exposure test
For the feeding inhibition and post-exposure test, an experimental design that included
simultaneously a single evaluation of each cyanobacterial extract and a set of 23 combinations
was chosen for the mixture assay. A partial fixed-ratio design (Cassee et al., 1998) (Fig. 4.4.1 B)
was used to assess the mixtures of the hepatotoxic and neurotoxic extracts, because this avoided
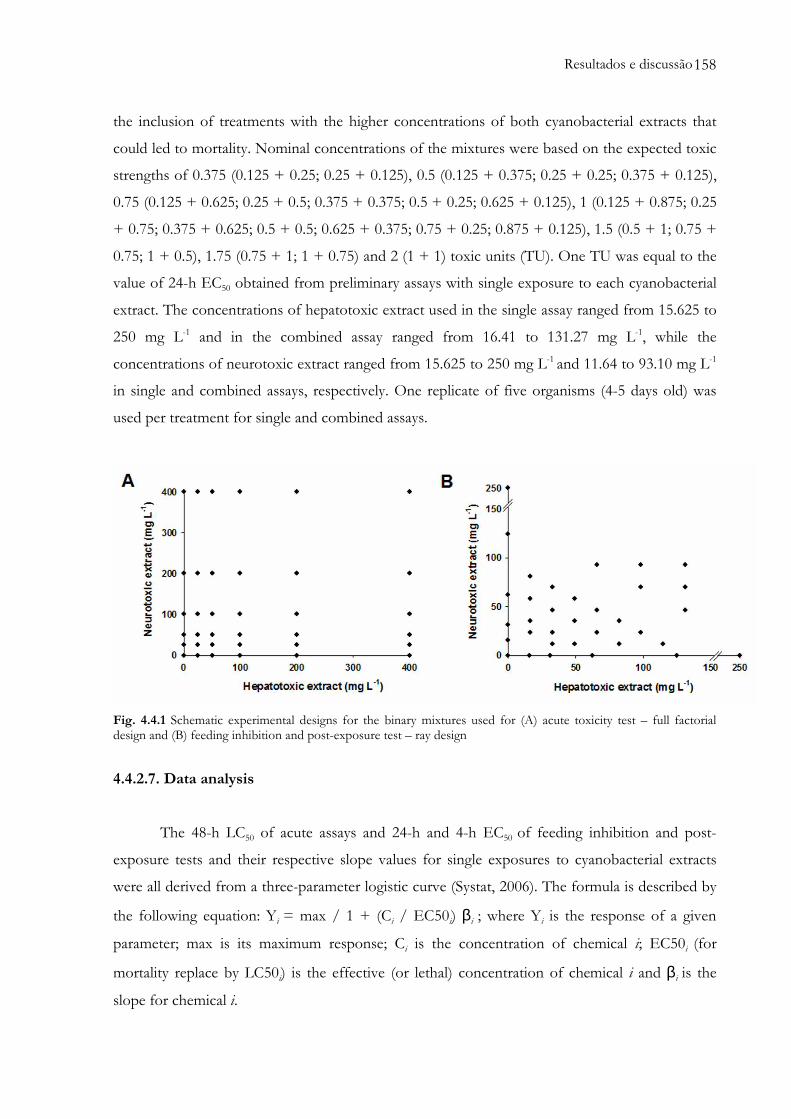
Resultados e discussão 158
the inclusion of treatments with the higher concentrations of both cyanobacterial extracts that
could led to mortality. Nominal concentrations of the mixtures were based on the expected toxic
strengths of 0.375 (0.125 + 0.25; 0.25 + 0.125), 0.5 (0.125 + 0.375; 0.25 + 0.25; 0.375 + 0.125),
0.75 (0.125 + 0.625; 0.25 + 0.5; 0.375 + 0.375; 0.5 + 0.25; 0.625 + 0.125), 1 (0.125 + 0.875; 0.25
+ 0.75; 0.375 + 0.625; 0.5 + 0.5; 0.625 + 0.375; 0.75 + 0.25; 0.875 + 0.125), 1.5 (0.5 + 1; 0.75 +
0.75; 1 + 0.5), 1.75 (0.75 + 1; 1 + 0.75) and 2 (1 + 1) toxic units (TU). One TU was equal to the
value of 24-h EC50 obtained from preliminary assays with single exposure to each cyanobacterial
extract. The concentrations of hepatotoxic extract used in the single assay ranged from 15.625 to
250 mg L-1 and in the combined assay ranged from 16.41 to 131.27 mg L-1, while the
concentrations of neurotoxic extract ranged from 15.625 to 250 mg L-1 and 11.64 to 93.10 mg L-1
in single and combined assays, respectively. One replicate of five organisms (4-5 days old) was
used per treatment for single and combined assays.
Fig. 4.4.1 Schematic experimental designs for the binary mixtures used for (A) acute toxicity test – full factorial design and (B) feeding inhibition and post-exposure test – ray design
4.4.2.7. Data analysis
The 48-h LC50 of acute assays and 24-h and 4-h EC50 of feeding inhibition and post-
exposure tests and their respective slope values for single exposures to cyanobacterial extracts
were all derived from a three-parameter logistic curve (Systat, 2006). The formula is described by
the following equation: Yi = max / 1 + (Ci / EC50i) βi ; where Yi is the response of a given
parameter; max is its maximum response; Ci is the concentration of chemical i; EC50i (for
mortality replace by LC50i) is the effective (or lethal) concentration of chemical i and βi is the
slope for chemical i.

Resultados e discussão 159
The NOEC and LOEC values for the feeding inhibition and post-exposure tests were
obtained by one-way analysis of variance (ANOVA) with SigmaStat software (Systat, 2006). A
post-hoc multiple comparisons Dunnett’s test was carried out when differences were revealed in
data that followed a normal distribution. When the normality test failed, a non-parametric
Kruskal-Wallis test was used and multiple comparisons were made by Dunn’s method. In all
statistical tests, significance was accepted when P ≤ 0.05.
Data from the mixture assays were analyzed through the conceptual model of
Independent Action (IA), since the two cyanobacterial extracts are expected to have different
modes of action. Firstly, the observed data were compared with the expected combined effect
calculated from the single exposures, using the MIXTOX tool (Jonker et al., 2005). Secondly, the
model was extended according to Jonker et al. (2005) and deviations from the IA model, such as
synergistic/antagonistic interactions, dose-ratio and dose-level dependency were modeled by the
addition of two parameters (“a” and “b”), forming a nested framework. The parameter “a”, in
synergistic and antagonistic deviations, can become, respectively, negative or positive. For dose-
ratio dependency, a second parameter “bDR” is included in addition to “a”, allowing the
identification of the role of each compound in the mixture. For two substances, antagonism can
be observed where the toxicity of the mixture is caused mainly by one of the chemicals and
synergism can be observed where the toxicity of the mixture is caused mainly by the other
chemical. To describe deviations for dose-level dependency, again a second parameter “bDL” is
included in addition to “a” (to the synergism equation). The value of “a” indicates the deviation
at low doses and the value of bDL indicates at what dose level the deviation changes. For more
details on these deviation functions please see Jonker et al. (2005) and Table 4.4.1. After the data
were fitted to the IA model, with or without deviations, the best fit was chosen by the method of
maximum likelihood. Where a statistically more descriptive deviation model was identified, the
effects pattern was deduced directly from the parameter values (Table 4.4.1) and the maximum
deviation could be calculated in terms of effect level (Jonker et al., 2005; Loureiro et al., 2010).

Resultados e discussão 160 Table 4.4.1. Interpretation of additional parameters (“a” and “b”) that define the functional form of the pattern of deviations from Independent action (IA); adapted from Jonker et al. (2005)
Deviation pattern Parameter “a” Parameter “b”
Synergism/antagonism (S/A) a > 0 – antagonism a < 0 – synergism
Dose ratio dependence (DR) a > 0 – antagonism, except for those mixture ratios where a significant negative b value
indicates synergism a < 0 – synergism, except for those mixture ratios
where a significant positive b value indicates antagonism
bi > 0 – antagonism where the toxicity of the mixture is caused mainly by toxicant i
bi < 0 – synergism where the toxicity of the mixture is caused mainly by toxicant i
Dose level dependence (DL) a > 0 – antagonism at low dose level and synergism at high dose level
a < 0 – synergism at low dose level and antagonism at high dose level
bDL > 2 – change at dose level lower than EC50 bDL = 2 – change at EC50
1 < bDL < 2 – change at dose level higher than EC50 bDL < 1 – no change, but the magnitude of S/A is effect-
level dependent

Resultados e discussão 161
4.4.3. Results
4.4.3.1. Cyanotoxin analysis
The concentration of MC-LR detected in the freeze-dried cells of M. aeruginosa (NPLJ-4
strain) was 6,010 µg g-1.
4.4.3.2. Single toxicity tests
The values of 48-h LC50 for acute tests and 24-h EC50 (exposure period) and 4-h EC50
(post-exposure period) for feeding inhibition tests determined for each cyanobacterial extract in
the single toxicity tests are shown in Table 4.4.2. In the case of feeding inhibition tests, 24-h EC50
values were used to calculate the TU values used in the mixture assay.

Resultados e discussão 162 Table 4.4.2. Values of 48-h LC50 for acute tests and 24-h EC50 (exposure period) and 4-h EC50 (post-exposure period) for feeding inhibition tests and their respective slope values obtained for D. magna in the assessment of each cyanobaterial extract in both single and mixture toxicity tests Cyanobacterial extract (mg L-1) Acute tests Feeding inhibition tests
48-h LC50 slope 24-h EC50 (exposure period) slope 4-h EC50 (post-exposure period)a slope
Single toxicity tests
Hepatotoxin (NPLJ-4 strain) 243.47 (26.78) 5.08 (2.19) 131.27 (13.90) 1.18 (0.15) 218.83 (32.28) 0.90 (0.15)
Neurotoxin (ITEP-024 strain) 222.74 (12.00) 7.38 (3.52) 93.10 (13.60) 1.13 (0.18) 100.16 (8.34) 1.96 (0.28) Mixture toxicity tests Hepatotoxin (NPLJ-4 strain) 214.12 (6.67) 6.28 (2.27) 126.29 (36.61) 1.14 (0.40) 240.64 (22.89) 1.04 (0.13) Neurotoxin (ITEP-024 strain) 224.87 (19.94) 6.58 (4.48) 86.01 (35.81) 1.09 (0.46) 95.84 (7.11) 2.04 (0.27)
Values of standard errors in brackets a Refers to concentrations in the exposure period

Resultados e discussão 163
Regarding the acute assays, it can be observed that 48-h LC50 values of hepatotoxic
(ranging from 216.69 to 270.25 mg L-1) and neurotoxic (ranging from 210.74 to 234.74 mg L-1)
extracts were very similar, i.e., no difference was found between them. For the feeding inhibition
tests, 24-h EC50 (exposure period) was slightly higher for the hepatotoxic extract (ranging from
117.37 to 145.17 mg L-1) than for the neurotoxic extract (ranging from 79.50 to 106.70 mg L-1).
This difference was also observed in the 4-h EC50 values (post-exposure period), in which the
effects of the neurotoxic extract (ranging from 91.82 to 108.50 mg L-1) were slightly more toxic
for D. magna than those of the hepatotoxic extract (ranging from 186.55 to 251.11 mg L-1).
No mortality occurred in any of the feeding inhibition tests, although it was observed that
some daphnids, at the end of the 24-h exposure and 4-h post-exposure periods, were at the
bottom of their vials at the highest concentration of the neurotoxic extract (250 mg L-1). After 24
hours of exposure, both hepatotoxic and neurotoxic extracts showed a similar trend,
characterised by a decrease in the feeding rates, as the test concentrations were raised (Fig. 4.4.2
A and B). Statistically significant differences relative to the control were found at the
concentrations of 62.5, 125 and 250 mg L-1 for both hepatotoxic (F5,29 = 524.94, P < 0.001, Fig.
4.4.2 A) and neurotoxic (H = 26.33, P < 0.001, Fig. 4.4.2 B) extracts. Thus, the 24-h NOEC (no
observed effect concentration) and 24-h LOEC (lowest observed effect concentration) observed
in the feeding inhibition tests for the two cyanobacterial extracts were, respectively, 31.25 and
62.5 mg L-1. The same pattern was observed for the 4-h post-exposure period, i.e., the
hepatotoxic and neurotoxic extracts continued acting and their effects showed a similar trend,
characterised by a decrease in the feeding rates with rising test concentrations (Fig. 4.4.2 A and
B). Statistically significant differences relative to the control were found at the concentrations of
62.5, 125 and 250 mg L-1 for both hepatotoxic (F5,29 = 25.66, P < 0.001, Fig. 4.4.2 A) and
neurotoxic (F5,29 = 58.64, P < 0.001, Fig. 4.4.2 B) extracts.

Resultados e discussão 164
Fig. 4.4.2 D. magna feeding rates (mean and standard error bars) for 24-h exposure and 4-h post-exposure periods in the feeding inhibition tests at various nominal concentrations of (A) hepatotoxic and (B) neurotoxic cyanobacterial extracts. The symbols * and ■ mean significant statistical differences in relation to the control at P ≤ 0.05
4.4.3.3. Mixture toxicity tests
The values of 48-h LC50 for acute tests and 24-h EC50 (exposure period) and 4-h EC50
(post-exposure period) for feeding inhibition single exposures tests obtained in the evaluation of
each cyanobacterial extract in the mixture toxicity tests are shown also in Table 4.4.2.
Reproducibility of the 48-h LC50, 24-h EC50 (exposure period) and 4-h EC50 (post-
exposure period) values and their slope values between the single and mixture toxicity tests for
each cyanobacterial extract proved to be reliable (Table 4.4.2). Taking into account the standard
errors, no difference was found between them.
Since the hepatotoxic and neurotoxic extracts have dissimilar modes of action, the IA
model was chosen as the reference model to assess the response of D. magna to the mixture
exposures. All parameters and significance test results obtained by fitting the nested MIXTOX
tool are shown in Table 4.4.3 and the variability, in terms of lethal (LCx) or effective (ECx)
concentration, of the observed data in relation to the IA model and their deviations can be seen
in Fig. 4.4.3.
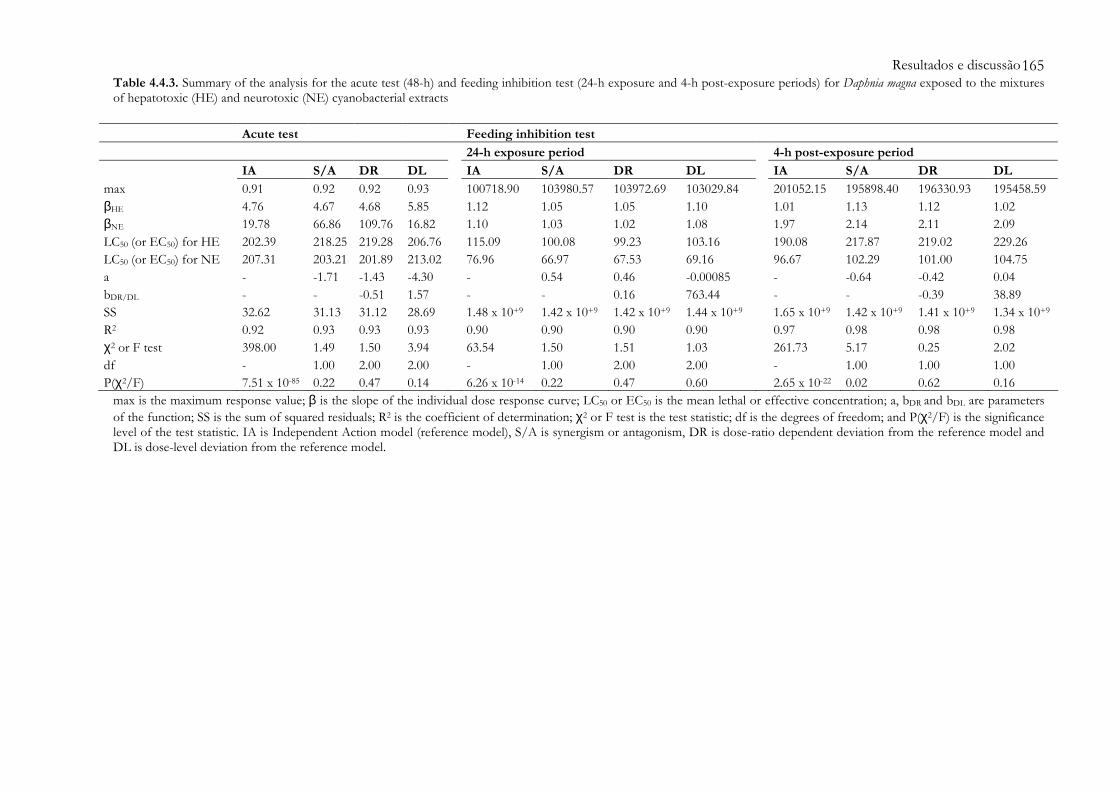
Resultados e discussão 165 Table 4.4.3. Summary of the analysis for the acute test (48-h) and feeding inhibition test (24-h exposure and 4-h post-exposure periods) for Daphnia magna exposed to the mixtures of hepatotoxic (HE) and neurotoxic (NE) cyanobacterial extracts
Acute test Feeding inhibition test
24-h exposure period 4-h post-exposure period
IA S/A DR DL IA S/A DR DL IA S/A DR DL
max 0.91 0.92 0.92 0.93 100718.90 103980.57 103972.69 103029.84 201052.15 195898.40 196330.93 195458.59 βHE 4.76 4.67 4.68 5.85 1.12 1.05 1.05 1.10 1.01 1.13 1.12 1.02 βNE 19.78 66.86 109.76 16.82 1.10 1.03 1.02 1.08 1.97 2.14 2.11 2.09 LC50 (or EC50) for HE 202.39 218.25 219.28 206.76 115.09 100.08 99.23 103.16 190.08 217.87 219.02 229.26 LC50 (or EC50) for NE 207.31 203.21 201.89 213.02 76.96 66.97 67.53 69.16 96.67 102.29 101.00 104.75 a - -1.71 -1.43 -4.30 - 0.54 0.46 -0.00085 - -0.64 -0.42 0.04 bDR/DL - - -0.51 1.57 - - 0.16 763.44 - - -0.39 38.89 SS 32.62 31.13 31.12 28.69 1.48 x 10+9 1.42 x 10+9 1.42 x 10+9 1.44 x 10+9 1.65 x 10+9 1.42 x 10+9 1.41 x 10+9 1.34 x 10+9 R2 0.92 0.93 0.93 0.93 0.90 0.90 0.90 0.90 0.97 0.98 0.98 0.98 χ2 or F test 398.00 1.49 1.50 3.94 63.54 1.50 1.51 1.03 261.73 5.17 0.25 2.02 df - 1.00 2.00 2.00 - 1.00 2.00 2.00 - 1.00 1.00 1.00 P(χ2/F) 7.51 x 10-85 0.22 0.47 0.14 6.26 x 10⁻¹⁴ 0.22 0.47 0.60 2.65 x 10⁻²² 0.02 0.62 0.16
max is the maximum response value; β is the slope of the individual dose response curve; LC50 or EC50 is the mean lethal or effective concentration; a, bDR and bDL are parameters of the function; SS is the sum of squared residuals; R2 is the coefficient of determination; χ2 or F test is the test statistic; df is the degrees of freedom; and P(χ2/F) is the significance level of the test statistic. IA is Independent Action model (reference model), S/A is synergism or antagonism, DR is dose-ratio dependent deviation from the reference model and DL is dose-level deviation from the reference model.

Resultados e discussão 166
For the effects of hepatotoxic and neurotoxic extract mixtures on the survival of D. magna
(Table 4.4.3), the IA model yielded a Sum of Squared Residuals (SS) of 32.62 (P < 0.05),
explaining 92% of our data. After adding parameter “a” to the IA model in order to describe
synergism or antagonism (S/A), the SS value decreased to 31.13, although was not statistically
significant (P = 0.22). Continuing the test for dose-ratio (DR) deviation, when the parameters “a”
and “bDR” were added, there was a decrease of the SS value to 31.12 but again with no
significance (P = 0.47). For dose-level deviation, when the parameters “a” and “bDL” were added,
there was also a decrease of the SS to the value of 28.69, but again not significantly (P = 0.14).
Thus, for survival, only the IA model showed to be the best fit to the data. Therefore, there was
no interaction between hepatotoxic and neurotoxic extracts, when survival was used as an
endpoint. When real and modelled data were transformed in LCx values (Fig. 4.4.3 A), it was
observed that the real data obtained for mortality in the mixture toxicity test showed a good fit to
the modelled data from the IA model (linear regression: F1,35 = 1140.51; P < 0.05; R2 = 0.97).
In relation to the effects of hepatotoxic and neurotoxic extract mixtures on the feeding
rate of D. magna (Table 4.4.3) during the 24-h exposure period, the IA model yielded a SS value
of 1.48 x 10+9 (P < 0.05), explaining 90% of our data. After adding parameter “a” to the IA
model to describe a possible S/A deviation, the SS value decreased slightly to 1.42 x 10+9, but
statistical significance was lost (P = 0.22). Continuing the test for DR deviation, adding “a” and
“bDR”, the SS value remained the same (1.42 x 10+9) (P = 0.47). For DL deviation, no significant
deviation was also found (P = 0.60), when “a” and “bDL” were added. Thus, for the 24-h
exposure period, only the IA model showed to be the best fit to the data. Therefore, there was no
interaction between the hepatotoxic and neurotoxic extracts in respect of the feeding rate
endpoint for the 24-h exposure period. When real and modelled data were transformed in ECx
values (Fig. 4.4.3 B), it can be seen that the real data obtained for feeding rate in the mixture
toxicity test showed a good fit to the modelled data from the IA model (linear regression: F1,33 =
285.76; P < 0.05; R2 = 0.90). Furthermore, in Fig. 4.4.3 B, it can be observed that, for the 24-h
exposure, there is a tendency, though not statistically significant, towards a synergistic deviation,
especially for values lower than the EC40. This tendency was confirmed in the 4-h post-exposure
period.
Regarding the effects of hepatotoxic and neurotoxic extract mixtures on the feeding rate
of D. magna (Table 4.4.3) during the 4-h post-exposure period, the IA model yielded a SS value of
1.65 x 10+9 (P < 0.05), explaining 97% of our data. After adding parameter “a” to the IA model
to describe S/A deviation, the SS value decreased significantly to 1.42 x 10+9 (P = 0.02),
explaining 98% of the data. The parameter “a” had a value of -0.64, which indicates a synergistic

Resultados e discussão 167
deviation (Table 4.4.3). No other significant deviations were observed for a dose-ratio or dose-
level patterns (P=0.62 and P=0.16, respectively). For the 4-h post-exposure period, the S/A
deviation from the IA model showed to be the best fit to the data. Therefore, there was a
synergistic effect upon the hepatotoxic and neurotoxic extracts when it was evaluated the feeding
rate endpoint for the 4-h post-exposure period. When real and modelled data were transformed
in ECx values (Fig. 4.4.3 C), it can be seen that the real data obtained for feeding rate in the
mixture toxicity test had a good fit to the modelled data from the synergistic deviation (linear
regression: F1,33 = 1356.43; P < 0.05; R2 = 0.98).
Fig. 4.4.3 Relationship between LCx (or ECx) values from real data and LCx (or ECx) values calculated from the modelled data and obtained from the Independent Action model and deviations from it in the exposure of Daphnia magna to the mixtures of hepatotoxic and neurotoxic extracts: (A) mortality, (B) 24-h feeding rate (exposure period) and (C) 4-h feeding rate (post-exposure period)

Resultados e discussão 168
4.4.4. Discussion
Globally, in natural freshwater environments, blooms of more than one cyanobacterial
species have been observed to occur in the same water body (Dietrich et al., 2008). Thus, it is
common to find, in the same environment, different types of cyanotoxin (Graham et al., 2010).
In Brazil, it has been reported the presence, at same time, of species of genus Microcystis and
Anabaena both with the potential to produce, respectively, hepatotoxins and neurotoxins (Molica
et al., 2005; Dellamano-Oliveira et al., 2007; Moschini-Carlos et al., 2009; Sotero-Santos et al.,
2010).
In the literature, there is some information available on the toxicity of hepatotoxins to the
various components of aquatic ecosystems, especially in relation to the microcystins (DeMott et
al., 1991; LeBlanc et al., 2005; Babica et al., 2007; Martins and Vasconcelos, 2009; Pinheiro et al.,
2012). However, little is known on the possible effects of neurotoxins on freshwater organisms,
studies on anatoxin-a(s) being even rarer (Henriksen et al., 1997; Monserrat et al., 2001; Ferrão-
Filho and Kozlowsky-Suzuki, 2011). To date, there is no record in the literature of the effects of
mixtures of cyanotoxins on freshwater species.
Since the coexistence of different types of cyanotoxin in freshwater habitats is a common
phenomenon, studies on mixtures of these toxins are necessary. In this work, for the first time,
joint effects of the mixture of two cyanotoxins with distinct modes of action (hepatotoxic and
neurotoxic) on a species of zooplankton were studied. The species Daphnia magna was chosen as a
model organism, since first-order effects of cyanobacterial blooms are experienced by the
zooplankton, which is the community most closely linked to the phytoplankton communities in
aquatic systems (Haney, 1987; Ghadouani et al., 2004).
The mode of exposure (live cyanobacterial cells, extracts or purified toxins) is one of the
determining factors in the toxicity of cyanobacteria (Ferrão-Filho and Kozlowsky-Suzuki, 2011).
For zooplankton, the effects are generally more pronounced when the animals are exposed to the
live cells, even at low concentrations, than when exposed to the extracts or purified toxins. This
basically comes from the fact that the uptake of toxins via the digestive tract is much more
efficient than by the dermal route (Rohrlack et al., 2005), especially since zooplankton have a
chitinous carapace. Furthermore, given that the cyanotoxins are mostly endotoxins, it is common
for aquatic organisms to be exposed to low levels of dissolved cyanotoxins in the natural
environment. Therefore, the most important exposure route for aquatic species is via ingested
food (Wilson and Hay, 2007; Ibelings and Havens, 2008). However, when cyanobacterial blooms
become senescent, lysed cells release their toxins, so that zooplankton can be exposed to

Resultados e discussão 169
relatively high levels of dissolved cyanotoxins for a short time (Christoffersen, 1996). Thus, in
this specific case, the most important exposure route is the direct contact with cyanotoxins. In
this study, we chose to use cyanobacterial extracts, since these blooms are occurring increasingly
often and the release of large quantities of cyanotoxins in the event of senescence can have acute
and chronic effects on the aquatic community as a whole.
The method of extraction of intracellular cyanotoxins is another point that must be
considered carefully when extracts are used in ecotoxicological assays. The use of several
semipolar and nonpolar solvents during the sequential steps of the extraction procedure seems
not to be the most appropriate procedure, when the aim is to use it as naturally as possible in
order to be ecologically relevant. The most indicated is the use of direct extraction (using
sonication in water), since the samples are less manipulated (Becker et al., 2010), being the reason
why, in this study, we opted by this method for the release of cyanotoxins.
Overall, values of LC50 for the acute tests and EC50 for the feeding inhibition tests
performed on D. magna in the assessment of each cyanobacterial extract in single exposures
(Table 4.4.2) were in accordance with the few comparable studies available in the literature.
In relation to the acute toxicity tests, our results for hepatotoxic extract (M. aeruginosa;
NPLJ-4 strain) were consistent with those from Okumura et al. (2007). Those authors, using the
same NPLJ-4 strain, found a 48-h LC50 for Daphnia similis of 230 mg L-1 of the extract (or 1380 µg
MC-LR g-1 of freeze-dried cells). In this study, for D. magna, the 48-h LC50 ranged from 214.12 to
243.47 mg L-1 (or 1286.9–1463.3 µg MC-LR g-1). In vitro experiments have demonstrated that
microcystins, especially MC-LR, can cause production of reactive oxygen species (ROS) and
induce oxidative stress enzymes, inducing mortality on D. magna (Wiegand et al., 2002). DeMott
et al. (1991) also used pure toxins such as MC-LR and found 48-h LC50 values ranging from 9,600
to 21,400 µg MC-LR L-1 for several Daphnia species. These concentrations are about 7-17 times
higher than those found in this study for D. magna. However, such differences between extracts
and purified toxins can be expected, since the toxicity to zooplankton may be related to the other
compounds produced by cyanobacteria. Jungmann and Benndorf (1994) isolated a compound
from extracts of natural blooms that was more toxic to Daphnia than MC-LR and found no
correlation between the concentration of microcystins in various strains of cyanobacteria and
their toxicity to Daphnia. Thus, we recommended the use of both extracts and live cells and not
of purified toxins to be used in laboratory experiments in order to improve exposure realism.
To date, fewer studies have been performed on the effects of ANTX-a(s)-producer
strains on zooplanktonic organisms. In relation to acute toxicity, the 48-h LC50 values obtained in
this study for the neurotoxin extract (from A. spiroides; ITEP-024) ranged from 222.74 to 224.87

Resultados e discussão 170
mg L-1 for D. magna. Costa (2005) performed acute assays with the same ITEP-024 strain and
observed that extracts obtained from freeze-dried cells had little effect on the cladocerans
Daphnia gessneri, D. pulex and Moina micrura. These results were contradictory when compared to
ours. A possible reason for this was the use of different extraction procedures for the toxins.
Molica et al. (2005) also performed assays with an extract of ITEP-024, to assess the toxic effects
of this strain on mice. The symptoms observed were salivation, tremors, convulsions, respiratory
arrest and limb fasciculation, at an injected dose of 148.4 mg kg-1. All mice died in up to 12 min,
and a total inhibition of the enzyme acetylcholinesterase occurred. In addition, DeMott et al.
(1991) observed that live cells of an ANTX-a(s)-producer strain of Anabaena flos-aquae (NRC 525-
17 strain) had acute toxicity effects when they were offered to the cladoceran D. pulicaria. These
effects found were possibly due to the action of the ANTX-a(s) contained in this strain.
During the 24-h exposure period, feeding rates of D. magna were 50 percent inhibited by
the hepatotoxic and neurotoxic extracts at concentrations ranging from 126.29 to 131.27 mg L-1
(or 759.0–788.9 µg MC-LR g-1) for hepatotoxic extract and from 86.01 to 93.10 mg L-1 for
neurotoxic extract. DeMott et al. (1991) found that live cells of either the MC-LR-producer strain
of M. aeruginosa (PCC7820) or the ANTX-a(s)-producer strain of Anabaena flos-aquae (NRC 525-
17) provoked a rapid decline in clearance rates of two species of Daphnia. Ghadouani et al. (2004)
observed also a nonreversible decrease in the appendage beat rate and mandibular movement rate
and a stimulation of the labral rejection rate when organisms of D. pulicaria were exposed to the
MC-LR purified toxin and fed with a non-toxic alga.
For the 4-h post-exposure period (clean medium), a recovery was observed in the feeding
rates of D. magna for both hepatotoxic and neurotoxic extracts, since the EC50 values (218.83–
240.64 mg L-1 or 1315.2–1446.2 µg MC-LR g-1 for hepatotoxic extract and 95.84–100.16 mg L-1
for neurotoxic extract) were higher than those for the exposure period. However, this recovery
was not sufficient to normalize feeding rates in the three highest concentrations tested (62.5, 125
and 250 mg L-1) to the level found in the control. Ghadouani et al. (2004) observed that there was
a persistence in the feeding inhibition response of D. pulicaria, even after the complete removal of
the toxin, supporting the intoxication hypothesis. In our study, the same effect was observed,
since the feeding rates remained inhibited after the daphnids were transferred to the cyanotoxin-
free medium. At the concentration of 250 mg L-1 of the neurotoxic extract, besides the inhibition
of feeding rate, it was also observed, at the end of the 24-h exposure and 4-h post-exposure
periods, some daphnids lay on the bottom of vials. Costa (2005) also observed that daphnids
exposed to the ITEP-024 strain remained paralyzed on the bottom of the test tube. As they are
water column filter feeders this is a symptom which will lead to starvation or low feeding rates.

Resultados e discussão 171
Since there is no commercially available analytical standard for the quantitation of
ANTX-a(s), it was not possible to compare the results obtained in this study with concentrations
of ANTX-a(s) found in the environment. In this study, the concentration of MC-LR detected in
the freeze-dried cells of M. aeruginosa (NPLJ-4 strain) was 6010 µg g-1. Okumura et al. (2007)
found a value very close to this for the same cyanobacterial strain. In similar culture conditions,
these authors determined a concentration of 6000 µg MC-LR g-1 in the extracts obtained from
the lysis of freeze-dried cells. For MC-LR, our study revealed lethal and sublethal concentrations
that are considered ecologically relevant. Concentrations ranging from 1286.9 to 1463.3 µg MC-
LR g-1 reduced the survival of D. magna by 50% and sublethal concentrations above 62.5 mg L-1
or 375.6 µg MC-LR g-1 (LOEC value) decreased the feeding rate in relation to the control.
Takenaka et al. (2007) detected concentrations of MCs in crude extracts of bloom material from
Brazilian reservoirs ranging from 238.78 to 1420.70 µg L-1, whereas Okumura et al. (2007) found
concentrations of MC-LR ranging from 265 to 311 µg g-1 in the natural environment (Barra
Bonita and Ibitinga Reservoirs, São Paulo, Brazil).
Very little is known about the possible additive, synergistic or antagonistic effects of
exposure to multiple classes of cyanobacterial toxins (Fitzgeorge et al., 1994).
In this study, survival and feeding rates in the mixture toxicity tests had a good fit to the
Independent Action Model, i.e, the mixture of tested extracts acted within different modes of
action and they showed additive responses. Also, for acute and feeding inhibition assays (24-h
exposure period), there was no apparent interaction between the components of the hepatotoxic
and neurotoxic extracts, although a slight tendency to a synergistic deviation can be seen in the
feeding rates. Hence, both hepatotoxic and neurotoxic extracts acted on their specific sites of
action, without any interaction between their effects.
On the other hand, for the 4-h post-exposure period in feeding inhibition tests (i.e., the
effects reported to the exposure period), synergistic deviations were found for all mixture
concentrations tested (16.41 – 131.27 mg L-1 or 98.6 – 788.9 µg MC-LR g-1 for hepatotoxic
extract and 11.64 – 93.10 mg L-1 for neurotoxic extract). Apparently, both hepatotoxins and
neurotoxins have adverse effects on the neuromuscular communication in the cladocerans
(Ghadouani et al., 2004; Rohrlack et al., 2005; Ferrão-Filho et al., 2007), which also interfere
indirectly with feeding. Rohrlack et al. (2005) investigated the intestinal uptake and toxic effects
of MCs ingested with M. aeruginosa (PCC 7806 strain) on Daphnia galeata. These authors observed
that MCs were rapidly taken up from the digestive cavity into the blood. Once MCs entered the
blood, they affected the neuromuscular communication, causing a decrease in the beat rates of
the thoracic legs, mandibles and second antennae. Considering that cladocerans basically feed

Resultados e discussão 172
with the assistance of the movements of thoracic legs, mandibles and second antennae, it is likely
that ANTX-a(s) acted by the classic mechanism of action (i.e., inhibition of acetylcholinesterase
in the neuromuscular junction), impairing the normal activity of the nerve impulse in these
appendages. Therefore, possibly, synergism observed for combined concentrations of
hepatotoxic and neurotoxic extracts can be explained by the fact that, although acting at different
specific target sites, both extracts interfered with the neuromuscular communication, impairing
the feeding of D. magna.
From an evolutionary viewpoint, given the high costs of their production, it is believed
that cyanotoxins must have some ecological role (Leflaive and Ten-Hage, 2007). Several
hypotheses have been proposed to explain their production. One is that the cyanotoxins may
serve as defensive or deterrent agent against grazing (DeMott et al., 1991). Defense against
grazers and inhibition of competitors can confer strong competitive advantages on the producer,
which may have been sufficient for the selection of toxin-producing strains. Benndorf and
Henning (1989) found an inverse correlation between grazing pressure by Daphnia and the
specific toxicity of Microcystis-dominated blooms. This provides further evidence for the
hypothesis that cyanotoxins such as MCs and ANTX-a(s) have evolved as chemical defenses
against grazers. However, the possibility that the toxic strains produce other toxins in sufficient
quantity to contribute to the toxic effects on zooplankton cannot be excluded. Extracts
containing toxins are often more active than the purified toxin, suggesting that extracts contain a
mix of active toxins may act synergistically (Leflaive and Ten-Hage, 2007). Since the theoretical
models of toxic mixtures take into account the modes of action of the toxicants and that in our
study synergistic effects were only observed on the feeding, there is a possibility, although
speculative, that the cyanobacterial extracts studied here have a function against grazers.
4.4.5. Conclusions
The joint effects of hepatotoxic and neurotoxic cyanobacterial extracts on D. magna were
studied here for the first time. We can conclude from the results presented in this study that
extracts from MC-LR-producer and ANTX-a(s)-producer strains can represent environmental
risk to the zooplankton and that they should be evaluated not just as single risks but as mixtures.
We observed that ecologically relevant concentrations of hepatotoxic and neurotoxic extracts,
applied to D. magna as single toxicants, impaired its survival and feeding activity. When
hepatotoxic and neurotoxic extracts were used in combination, we observed both additivity and
synergism for feeding rates. Thus, sublethal concentrations of hepatotoxins and neurotoxins in

Resultados e discussão 173
mixtures caused significant feeding inhibition, which in turn could impair the growth,
reproduction and survival of Daphnia. Therefore, since different classes of cyanotoxins are found
in natural environments, risk assessments of these toxins should take into account their joint
effects in order to avoid under- or overestimation of their effects on the zooplanktonic
community.
Acknowledgements
The first author (Emanuela Cristina Freitas) acknowledges the National Council of
Scientific and Technological Development (CNPq) for the PhD scholarship (category sandwich
PhD in exterior, Science without Frontiers Program, number of process 201322/2012-9).

Resultados e discussão 174
References
Allen, Y., Calow, P., Baird, D.J., 1995. A mechanistic model of contaminant-induced feeding inhibition in Daphnia magna. Environ. Toxicol. Chem. 14, 1625-1630. ASTM, 2001. Standard guide for conducting acute toxicity testing on test materials with fishes, macroinvertebrates, and amphibians. American Society for Testing and Materials, West Conshohocken, PA, pp. E729-E796. Azevedo, S.M.F.O., Carmichael, W.W., Jochimsen, E.M., Rinehart, K.L., Lau, S., Shaw, G.R., Eaglesham, G.K., 2002. Human intoxication by microcystins during renal dialysis treatment in Caruaru-Brazil. Toxicology 181-182, 441-446. Babica, P., Hilscherova, K., Bartova, K., Blaha, L., Marsalek, B., 2007. Effects of dissolved microcystins on growth of planktonic photoautotrophs. Phycologia 46(2), 137-142. Baird, D.J., Soares, A.M.V.M., Girling, A., Barber, I., Bradley, M.C., Calow, P., 1989. The long-term maintenance of Daphnia magna Straus for use in ecotoxicity tests: problems and prospects. In: Lokke, H., Tyle, H., Bro-Rasmussen, F. (Eds.), Proceedings of the First European Conference on Ecotoxicology, Lyngby, pp. 144-148. Barros, L.P.C., Monserrat, J.M., Yunes, J.S., 2004. Determination of optimized protocols for the extraction of anticholinesterasic compounds in environmental samples containing cyanobacteria species. Environ. Toxicol. Chem. 23(4), 883-889. Becker, V., Ihara, P., Yunes, J.S., Huszar, V.L.M., 2010. Occurrence of anatoxin-a(s) during a bloom of Anabaena crassa in a water-supply reservoir in southern Brazil. J. Appl. Phycol. 22, 235-241. Benndorf, J., Henning, M., 1989. Daphnia and toxic blooms of Microcystis aeruginosa in Bautzen Reservoir (GDR). Int. Rev. Ges. Hydrobio. 74, 233-248. Bliss, C.I., 1939. The toxicity of poisons applied jointly. Ann. Appl. Biol. 26, 585-615. Carmichael, W.W., 1992. Cyanobacteria secondary metabolites – the cyanotoxins. J. Appl. Bacteriol. 72, 445-459. Carmichael, W., Azevedo, S., Na, J., Molica, R., Jochimsen, E., Lau, S., Rinehart, K., Shaw, G., Eaglesham, G., 2001. Human fatalities from cyanobacteria: chemical and biological evidences for cyanotoxins. Environ. Health Persp. 109, 663-668. Cassee, F.R., Groten, J.P., van Bladeren, P.J., Feron, V.J., 1998. Toxicological evaluation and risk assessment of chemical mixtures. Crit. Rev. Toxicol. 28, 73-101. Chen, W., Song, L., Ou, D., Ganl, N., 2005. Chronic toxicity and responses of several important enzymes in Daphnia magna on exposure to sublethal microcystin-LR. Environ. Toxicol. 20(3), 323-330. Chorus, I., Bartram, J., 1999. Toxic cyanobacteria in water. A guide to their public health consequences, monitoring and management. E & FN SPON, New York.

Resultados e discussão 175
Christoffersen, K., 1996. Ecological implications of cyanobacterial toxins in aquatic food webs. Phycologia 35, 42-50. Costa, S.M., 2005. Efeitos de saxitoxinas produzidas por Cylindrospermopsis raciborskii e de outras cianotoxinas sobre cladóceros (Branchiopoda). PhD Thesis, Programa de Pós-graduação em Ciências Biológicas, Universidade Federal do Rio de Janeiro, Rio de Janeiro, Brazil. Dellamano-Oliveira, M.J., Colombo-Corbi, V., Vieira, A.A.H., 2007. Carboidratos dissolvidos do reservatório de Barra Bonita (Estado de São Paulo, Brasil) e sua relação com as algas fitoplanctônicas abundantes. Biota Neotrop. 7, 59-66. DeMott, W.R., Zhang, Q.X., Carmichael, W.W., 1991. Effects of toxic cyanobcteria and purified toxins on the survival and feeding of a copepod and three species of Daphnia. Limnol. Oceanogr. 36(7), 1346-1357. Dietrich, D.R., Fisher, A., Michel, C., Hoeger, S.J., 2008. Toxin mixture in cyanobacterial blooms – a critical comparison of reality with current procedures employed in human health risk assessment. Adv. Exp. Med. Biol. 619, 885–912. Falconer, I.R., 1999. An overview of problems caused by toxic blue-green algae (cyanobacteria) in drinking and recreational water. Environ. Toxicol. 14, 5-12. Ferrão-Filho, A.S., Azevedo, S.M.F.O., DeMott, W.R., 2000. Effects of toxic and non-toxic cyanobacteria on the life history of tropical and temperate cladocerans. Freshwater Biol. 43, 1-19. Ferrão-Filho, A.S., Cunha, R., Magalhães, V.F., Soares, M.C.S., Baptista, D.F., 2007. Evaluation of sub-lethal toxicity of cyanobacteria on the swimming activity of aquatic organisms by image analysis. J. Braz. Soc. Ecotoxicol. 2, 93-100. Ferrão-Filho, A.S., Costa, S.M., Ribeiro, M.G.L., Azevedo, S.M.F.O., 2008. Effects of a saxitoxin producer strain of Cylindrospermopsis raciborskii (cyanobacteria) on the swimming movements of cladocerans. Environ. Toxicol. 23, 161-168. Ferrão-Filho, A.S., Kozlowsky-Suzuki, B., 2011. Cyanotoxins: bioaccumulation and effects on aquatic animals. Mar. Drugs 9, 2729-2772. Ferreira, A.L.G., Loureiro, S., Soares, A.M.V.M., 2008. Toxicity prediction of binary combinations of cadmium, carbendazim and low dissolved oxygen on Daphnia magna. Aquat. Toxicol. 89, 28-39. Fitzgeorge, R.B., Clark, S.A., Keevil, C.W., 1994. Routes of intoxication. In: Codd, G.A., Jefferies, T.M., Keevil, C.W., Potter, E. (Eds.), Detection methods for cyanobacterial toxins. The Royal Society of Chemistry, Cambridge, pp. 69-74. Ghadouani, A., Pinel-Alloul, B., Plath, K., Codd, G.A., Lampert, W., 2004. Effects of Microcystis aeruginosa and purified microcystin-LR on the feeding behavior of Daphnia pulicaria. Limnol. Oceanogr. 49, 666-679. Gorham, P.R., McLachlan, J., Hammer, U.T., Dim, W.K., 1964. Isolation and culture of toxic strain of Anabaena flos-aquae (Lyngb.) de Bréb. Verh. Internat. Verein Limnol. 15, 796-804.

Resultados e discussão 176
Graham, J.L., Loftin, K.A., Meyer, M.T., Ziegler, A.C., 2010. Cyanotoxin mixtures and taste-and-odor compounds in cyanobacterial blooms from the midwestern United States. Environ. Sci. Technol. 44, 7361-7368. Groten, J.P., 2000. Mixtures and interactions. Food Chem. Toxicol. 38, S65-S71. Haney, J.F., 1985. Regulation of cladoceran filtering rates in nature by body size, food concentration, and diel feeding patterns. Limnol. Oceanogr. 30, 397-411. Haney, J.F., 1987. Field studies on zooplankton-cyanobacteria interactions. N. Z. J. Mar. Freshwat. Res. 21, 467-475. Henriksen, P., Carmichael, W.W., Na, J., Moestrup, O., 1997. Detection of an anatoxin-a(s)-like anticholinesterase in natural blooms and cultures of cyanobacteria/blue-green algae from Danish lakes and in the stomach contents of poisoned birds. Toxicon 35, 901-913. Ibelings, B.W., Havens, K.E., 2008. Cyanobacterial toxins: a qualitative meta-analysis of concentrations, dosage and effects in freshwater, estuarine and marine biota. In: Hudnell, H.K. (Ed.), Cyanobacterial harmful algal blooms: state of the science and research needs. Springer Science, New York, pp. 675-732. Jochiminsen, E.M., Carmichael, W.W., An, J.S., Cardo, D.M., Cookson, S.T., Holmes, C.E., Antunes, M.B., De Mello Filho, D.A., Lyra, T.M., Barreto, V.S., Azevedo, S.M., Jarvis, W.R., 1998. Liver failure and death after exposure to microcystins at a hemodialysis center in Brazil. N. Engl. J. Med. 338(13), 873-878. Jonker, M.J., Piskiewicz, A.M., Castellà, N.I., Kammenga, J.E., 2004. Toxicity of binary mixtures of cadmium-copper and carbendazim-copper to the nematode Caenorhabditis elegans. Environ. Toxicol. Chem. 23, 1529-1537. Jonker, M.J., Svendsen, C., Bedaux, J.J.M., Bongers, M., Kammenga, J.E., 2005. Significance testing of synergistic/antagonistic, dose-level dependent, or dose ratio-dependent effects in mixture dose response analysis. Environ. Toxicol. Chem. 24, 2701-2713. Jungmann, D., Benndorf, J., 1994. Toxicity to Daphnia of a compound extracted from laboratory and natural Microcystis spp., and the role of microcystins. Freshwater Biol. 32, 13-20. Lampert, W., 1981. Toxicity of blue-green Microcystis aeruginosa: effective defense mechanism against grazing pressure by Daphnia. Verh. Int. Ver. Theor. Angew. Limnol. 21, 1436-1440. LeBlanc, S., Pick, F.R., Aranda-Rodriguez, R., 2005. Allelopathic effects of the toxic cyanobacterium Microcystis aeruginosa on Duckweed, Lemna gibba L. Environ. Toxicol. 20, 67-73. Leflaive, J., Ten-Hage, L., 2007. Algal and cyanobacterial secondary metabolites in freshwaters: a comparison of allelopathic compounds and toxins. Freshwater Biol. 52, 199-214. Loewe, S., Muischnek, H., 1926. Combinated effects I announcement – implements to the problem. Naunyn-Schmiedebergs Arch. Exp. Pathol. Pharmakol. 114, 313-326.

Resultados e discussão 177
Loureiro, S., Svendsen, C., Ferreira, A.L.G., Pinheiro, C., Ribeiro, F., Soares, A.M.V.M., 2010. Toxicity of three binary mixtures to Daphnia magna: comparing chemical modes of action and deviations from conceptual models. Environ. Toxicol. Chem. 29(8), 1716-1726. Mahmood, N.A., Carmichael, W.W., 1987. Anatoxin-a(s), an anticholinesterase from the cyanobacterium Anabaena flos-aquae NRC-525-17. Toxicon 25, 1221-1227. Martins, J.C., Vasconcelos, V.M., 2009. Microcystin dynamics in aquatic organisms. J. Toxicol. Environ. Health, Part B 12, 65-82. Matsumura-Tundisi, T., Tundisi, J.G., 2005. Plankton richness in a eutrophic reservoir (Barra Bonita Reservoir, SP, Brazil). Hydrobiologia 542, 367-378. McWilliam, R.A., Baird, D.J., 2002. Post-exposure feeding depression: a new toxicity endpoint for use in laboratory studies with Daphnia magna. Environ. Toxicol. Chem. 21, 1198-1205. Molica, R.J.R., Oliveira, E.J.A., Carvalho, P.V.V.C., Costa, A.N.S.F., Cunha, M.C.C., Melo, G.L., Azevedo, S.M.F.O., 2005. Occurrence of saxitoxins and anatoxin-a(s)-like anticholinesterase in a Brazilian drinking water supply. Harmful Algae 4, 743-753. Monserrat, J.M., Yunis, J.S., Bianchini, A., 2001. Effects of Anabaena spiroides (Cyanobacteria) aqueous extracts on the acetylcholinesterase activity of aquatic species. Environ. Toxicol. Chem. 20(6), 1228-1235. Moschini-Carlos, V., Bortoli, S., Pinto, E., Nishimura, P.Y., Freitas, L.G., Pompêo, M.L.M., Dörr, F., 2009. Cyanobacteria and cyanotoxin in the Billings Reservoir (São Paulo, SP, Brazil). Limnetica 28(2), 273-282. OECD, 2004. Guideline for Testing of Chemicals. Daphnia sp., Acute immobilisation test. OECD 202. Organization for Economic Cooperation and Development, Paris. Okumura, D.T., Sotero-Santos, R.B., Takenaka, R.A., Rocha, O., 2007. Evaluation of cyanobacteria toxicity in tropical reservoirs using crude extracts bioassay with cladocerans. Ecotoxicology 16, 263-270. Olmstead, A.W., LeBlanc, G.A., 2005. Toxicity assessment of environmentally relevant pollutant mixtures using a heuristic model. Integr. Environ. Assess. Manag. 1, 114-122. Pavlaki, M.D., Pereira, R., Loureiro, S., Soares, A.M.V.M., 2011. Effects of binary mixtures on the life traits of Daphnia magna. Ecotoxicol. Environ. Saf. 74, 99-110. Pinheiro, C., Azevedo, J., Campos, A., Loureiro, S., Vasconcelos, V., 2012. Absence of negative allelopathic effects of cylindrospermopsin and microcystin-LR on selected marine and freshwater phytoplankton species. Hydrobiologia doi 10.1007/s10750-012-1372-x Ressom, R., Soong, F., Fitzgerald, J., Turczynowicz, L., Saadi, O.E., Roder, D., Maynard, T., Falconer, I., 1994. Health effects of toxic cyanobacteria (blue-green algae). Australian Government Public Service, Canberra.

Resultados e discussão 178
Rohrlack, T., Christoffersen, K., Dittmann, E., Nogueira, I., Vasconcelos, V., Börner, T., 2005. Ingestion of microcystins by Daphnia: intestinal uptake and toxic effects. Limnol. Oceanogr. 50, 440-448. Soares, R.M., Magalhães, V.F., Azevedo, S.M.F.O., 2004. Accumulation and depuration of microcystins (cyanobacteria hepatotoxins) in Tilapia rendalli (Cichlidae) under laboratory conditions. Aquat. Toxicol. 70, 1-10. Sotero-Santos, R.B., Sousa e Silva, C.R., Verani, N.F., Nonaka, K.O., Rocha, O., 2006. Toxicity of a cyanobacteria bloom in Barra Bonita Reservoir (Middle Tietê River, São Paulo, Brazil). Ecotoxicol. Environ. Saf. 64, 163-170. Sotero-Santos, R.B., Carvalho, E.G., Dellamano-Oliveira, M.J., Rocha, O., 2008. Occurrence and toxicity of an Anabaena bloom in a tropical reservoir (Southeast Brazil). Harmful Algae 7, 590-598. Sotero-Santos, R.B., Dellamano-Oliveira, M.J., Carvalho, E.G., Minillo, A., Rocha, O., 2010. Phytoplanktonic structure and chemistry of the water in the Monjolinho Reservoir (SP, Brazil) during a cyanobacterial bloom episode. J. Braz. Soc. Ecotoxicol. 5(1), 63-70. Systat. 2006. Systat Software, Incorporation. SigmaPlot for Windows version 10.0. Takenaka, R.A., Dellamano-Oliveira, M.J., Rocha, O., 2007. Toxicidade de extratos de florações de cianobactérias de reservatórios do Rio Tietê, SP, aos dafinídeos Ceriodaphnia dubia e Ceriodaphnia silvestrii (Cladocera, Crustacea). J. Braz. Soc. Ecotoxicol. 2(2), 147-156. Wiegand, C., Pflugmacher, S., Oberemm, A., Meems, N., Beattie, K.A., Steinberg, C.E.W., Codd, G.A., 1999. Uptake and effects of microcystin-LR on detoxication enzymes of early life stages of the zebra fish (Danio rerio). Environ. Toxicol. 14, 89-95. Wiegand, C., Peuthert, A., Pflugmacher, S., Carmeli, S., 2002. Effects of microcyn SF608 and microcystin-LR, two cyanobacterial compounds produced by Microcystis sp., on aquatic organisms. Environ. Toxicol. 17, 400-406. Wiegand, C., Pflugmacher, S., 2005. Ecotoxicological effects of selected cyanobacterial secondary metabolites a short review. Toxicol. Appl. Pharmacol. 203, 201-218. Wilson, A.E., Hay, M.E., 2007. A direct test of cyanobacterial chemical defense: variable effects of microcystin-treated food on two Daphnia pulicaria clones. Limnol. Oceanogr. 52, 1467-1479.

Conclusões gerais 179
5. CONCLUSÕES GERAIS
Com este estudo, as seguintes conclusões gerais puderam ser obtidas:
� O ensaio de microplacas adaptado e otimizado neste estudo foi adequado para medir a
atividade de ChE no cladócero tropical P. ramosa, sendo possível estabelecer um
protocolo de leitura para esta espécie tropical (Apêndices A e B);
� As atividades de ChE de P. ramosa e de D. magna foram específicas para a anatoxina-a(s),
não sendo inibidas pelas microcistinas;
� As atividades de ChE de P. ramosa e de D. magna foram bons biomarcadores de exposição
à anatoxina-a(s);
� A atividade de ChE de P. ramosa foi um bom biomarcador de efeito, sendo que o mesmo
não pode ser dito para a D. magna;
� Nós recomendamos o uso de espécies nativas, especialmente da P. ramosa, nas avaliações
ecotoxicológicas da anatoxina-a(s), uma vez que as respostas em diferentes níveis de
organização biológica foram espécie-específicas;
� A escolha do organismo-teste pode interferir com a precisão da avaliação de risco da
anatoxina-a(s);
� Misturas de cianotoxinas com diferentes modos de ação podem representar um risco
ambiental para o zooplâncton;
� As cianotoxinas devem ser avaliadas não apenas como riscos individuais, mas também
como misturas.

Considerações finais e recomendações 180
6. CONSIDERAÇÕES FINAIS E RECOMENDAÇÕES
O ensaio de ChE foi adequado para detectar a presença de anatoxina-a(s). Tais ensaios
são de fácil execução e mais baratos que as análises químicas feitas por HPLC e também podem
substituir os bioensaios realizados com camundongos, trazendo vantagens relacionadas com
questões éticas. No entanto, deve-se considerar a possibilidade de que outras cianotoxinas podem
inibir a atividade de ChE. Por isso, recomenda-se que os efeitos de outras cianotoxinas, além da
anatoxina-a(s) e da microcistina, sejam analisados em trabalhos futuros.
Os ensaios de ChE da P. ramosa foram preditivos em relação aos efeitos do extrato de
anatoxina-a(s) observados nos parâmetros em níveis mais elevados de organização biológica
(individual e populacional), o que não foi obtido para D. magna. Entretanto, deve-se considerar
que os ensaios realizados neste estudo foram feitos em condições químicas, físicas e fisiológicas
ideais para os organismos-teste. Visto que as populações naturais nem sempre experimentam o
seu ótimo fisiológico (i.e., alimentação adequada) ou estão em condições abióticas favoráveis
(temperatura, oxigênio dissolvido, etc), recomenda-se que, em trabalhos futuros, essas variáveis
ambientais e fisiológicas sejam consideradas na interpretação dos resultados dos ensaios
enzimáticos. Assim, até que a influência destas variáveis sobre a atividade de ChE da P. ramosa
seja conhecida, o uso desta enzima como um biomarcador preditivo nas exposições à anatoxina-
a(s) deve ser feito com cuidado e sempre como uma ferramenta adicional aos ensaios
ecotoxicológicos convencionais.
Outra consideração a ser feita refere-se à caracterização das colinesterases da P. ramosa,
pela qual pode-se definir a real contribuição da acetilcolinesterase (AChE) e das
pseudocolinesterases (PChE) para a atividade de ChE desta espécie. Diferentes esterases do tipo
B podem ter diferentes afinidades aos tóxicos e isso pode gerar respostas diferenciadas na
toxicidade de um determinado composto para um organismo em específico. A AChE e as PChE
são diferenciadas por especificidades diferentes a distintos substratos e diferentes sensibilidades a
inibidores específicos. Desta forma, recomenda-se que a caracterização das ChE da P. ramosa seja
feita.
A fim de que as avaliações de risco ambiental das cianotoxinas presentes no ambiente
sejam mais acuradas, recomenda-se que em trabalhos futuros as misturas de outras cianotoxinas
além das misturas de anatoxina-a(s) e microcistinas sejam realizadas, inclusive com outras
substâncias químicas, tais como metais e pesticidas. Além disso, possíveis interações das
cianotoxinas com estressores naturais (temperatura, oxigênio dissolvido, radiação ultravioleta, etc)
também poderão ser consideradas em trabalhos futuros.

Apêndices 181
APÊNDICES

Apêndices 182
APÊNDICE A
Seção A. Protocolo para a leitura da atividade de colinesterases do cladócero tropical
Pseudosida ramosa
Emanuela C. Freitas, Liane B. Printes e Odete Rocha
* Nota importante:
O protocolo de medição da atividade de colinesterases desenvolvido para Pseudosida
ramosa, uma espécie nativa, foi baseado em um ensaio de microplacas para a leitura da atividade
de colinesterases (ChE) das larvas de Chironomus riparius desenvolvido por Fisher e Callaghan
(1999) e Fisher et al. (2000) e também baseado em um ensaio de microplacas para a leitura da
atividade de ChE de indivíduos de Daphnia magna desenvolvido por Printes (2003). Fisher e
Callaghan (1999), Fisher et al. (2000) e Printes (2003) adaptaram e otimizaram seus métodos a
partir de Ellman et al. (1961). No presente estudo foram feitas determinações específicas
referentes a Pseudosida ramosa (i.e., determinação do número de indivíduos da P. ramosa para cada
classe de idade e os respectivos volumes dos tampões, determinação da taxa de reação máxima
para P. ramosa e determinações da taxa de reação mínima e da taxa de reação para cada classe de
idade da P. ramosa), conforme apresentados em Freitas (2013) (esta tese) e Freitas et al. (Capítulo
4.1 desta tese).
1. Reagentes
� Tampão Fosfato (TF) de sódio a 0,02M com pH 8,0. O TF é preparado pela mistura de
uma solução de NaH2PO4 . 2H2O (0,02 M), preparada em água deionizada, com uma
solução de Na2HPO4 . 2 H2O (0,02 M), também preparada em água deionizada;
� Tampão de Homogeneização (TH). O TH é o tampão fosfato contendo Triton-X-100
(Sigma Aldrich) a 1% (v/v);
� Tampão Branco (TB). O TB é o tampão fosfato contendo Triton-X-100 (Sigma Aldrich)
a 0,1% (v/v);
� Solução de DTNB a 8 mM (5,5'-dithio bis-2-nitrobenzoato, D-8130, Sigma Aldrich). O
DTNB é preparado em TF contendo 0,75 mg mL-1 de NaHCO3 e é sensível à luz visível.
Ele deve ser estocado após o preparo a -20ºC por até três meses;

Apêndices 183
� Solução de ATCI a 16 mM (acetiltiocolina iodada, A-5751, Sigma Aldrich), preparada em
TF gelado, mantida em gelo. Também é sensível à luz visível e ao calor. Deve ser
estocada a -20ºC por até três meses.
OBS: as soluções de DTNB e ATCI devem ser estocadas imediatamente após o preparo e
mantidas em gelo. Também devem ser protegidas da luz durante e após a sua preparação.
2. Materiais
� Centrífuga refrigerada para tubos de microcentrífuga de 1,5 mL;
� Leitora de microplacas (DYNEX Technologies, USA);
� Vórtex;
� Microplacas com 96 poços limpas e livres de ranhuras na sua base;
� Pipeta multicanal e ponteiras para pipeta (50 a 250 µL). Checar a calibração a cada três
meses;
� Pipetas de 200 e 1000 µL e suas respectivas ponteiras. Checar a calibração a cada três
meses;
� Tubos Falcon de polipropileno de 15 mL de capacidade para os reagentes de ensaio;
� Tubos para microcentrífuga de 1,5 mL de capacidade;
� Pistão para tubos de microcentrífuga, o qual deve ser resfriado antes da homogeneização
dos indivíduos de P. ramosa;
� Isopor para armazenar gelo e gelo triturado;
� Béquer com capacidade de 200 mL para armazenar um pouco de água deionizada gelada
para a lavagem do pistão de homogeneização;
� Reservatório de reagentes para o carregamento da pipeta multicanal;
� Sala refrigerada;
� Caneta apropriada para anotações nos tubos de Falcon e nos tubos de microcentrífuga;
� Sacos plásticos para congelamento e papel alumínio para embalar os reagentes.
3. Preparo para o ensaio
� Rotule todos os tubos Falcon de 15 mL e complete-os com os tampões correspondentes
(TF, TH e TB);

Apêndices 184
� Colete os reagentes DTNB e ATCI congelados e descongele-os em gelo. Mais ou menos
três horas são necessárias para o total descongelamento. Embale os tubos em papel
alumínio para evitar exposição à luz;
� Mantenha o pistão de homogeneização em um tubo de microcentrífuga seco e sob o gelo;
� Coloque água deionizada gelada (4ºC) no béquer de 200 mL para lavagem do pistão de
homogeneização entre os usos;
� Programe a centrífuga a 2ºC por 4 minutos e uma velocidade de 14000 g. Ative a opção
de rápido resfriamento;
� Ligue a leitora de microplacas para que ela atinja a temperatura de leitura (30ºC);
� Monitore o descongelamento dos reagentes DTNB e ATCI e misture-os um pouco antes
da utilização para evitar a formação de precipitados;
� Colete os indivíduos de P. ramosa congelados em -80ºC e coloque-os no isopor sob o gelo
triturado.
4. Preparação dos homogeneizados
� Em uma sala refrigerada, rotule os tubos de microcentrífuga limpos para a coleta dos
sobrenadantes após a centrifugação e coloque-os sob o gelo triturado;
� Em cada tubo de microcentrífuga com os indivíduos congelados de P. ramosa acrescente o
TH. O número de indivíduos varia de acordo com a classe de idade com que se está
trabalhando, assim como o volume do TH;
� Após o acréscimo do TH, macere os indivíduos congelados por 10 s (cerca de 40 ciclos
de maceração), segurando os tubos pela extremidade superior para minimizar o efeito de
aquecimento. Após a maceração, acrescente o TF, lavando o pistão com o tampão para
que nenhum resto do processo de maceração permaneça nele. O volume de TF varia de
acordo com a classe de idade com que se esteja trabalhando;
OBS: A quantidade de indivíduos de P. ramosa para cada classe de idade e as respectivas
quantidades dos tampões de homogeneização e fosfato utilizados são:
1) Para a idade ≤ 72 h: 30 indivíduos para 25 µL de TH e 225 µL de TF;
2) Para a idade de 7 dias: 20 indivíduos para 25 µL de TH e 225 µL de TF;
3) Para a idade de 14 dias: 15 indivíduos para 30 µL de TH e 270 µL de TF;
4) Para a idade de 21 dias: 15 indivíduos para 30 µL de TH e 270 µL de TF.
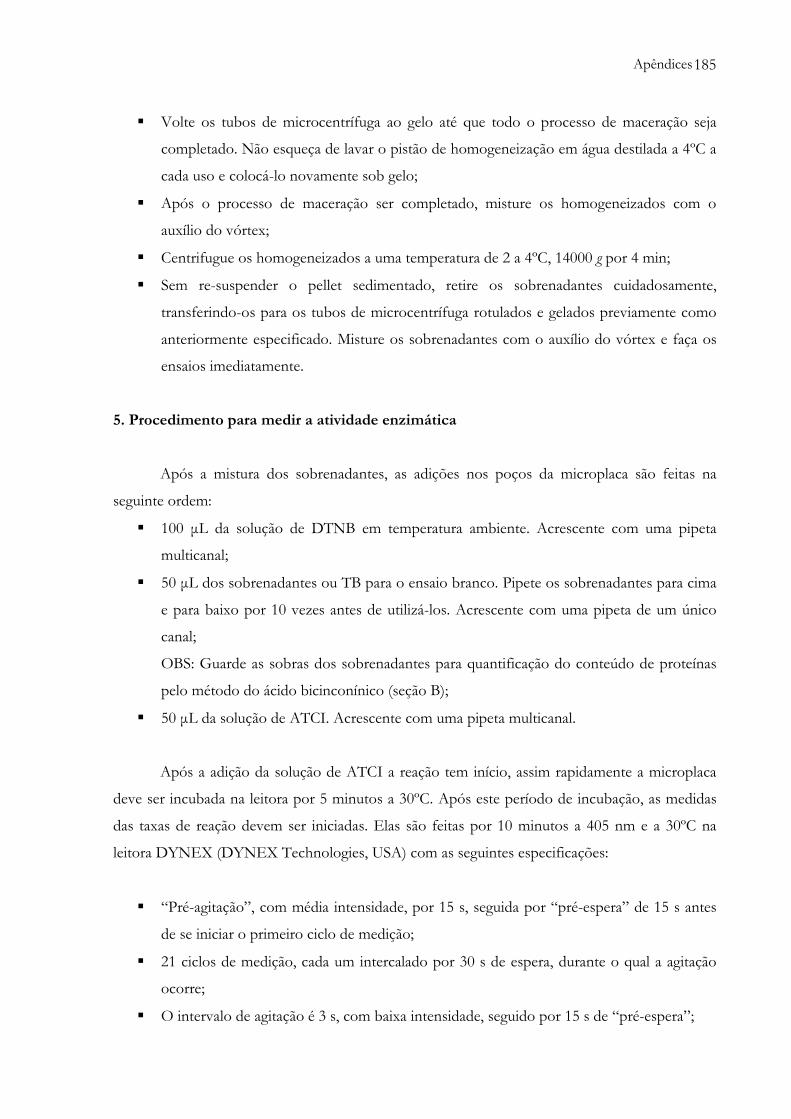
Apêndices 185
� Volte os tubos de microcentrífuga ao gelo até que todo o processo de maceração seja
completado. Não esqueça de lavar o pistão de homogeneização em água destilada a 4ºC a
cada uso e colocá-lo novamente sob gelo;
� Após o processo de maceração ser completado, misture os homogeneizados com o
auxílio do vórtex;
� Centrifugue os homogeneizados a uma temperatura de 2 a 4ºC, 14000 g por 4 min;
� Sem re-suspender o pellet sedimentado, retire os sobrenadantes cuidadosamente,
transferindo-os para os tubos de microcentrífuga rotulados e gelados previamente como
anteriormente especificado. Misture os sobrenadantes com o auxílio do vórtex e faça os
ensaios imediatamente.
5. Procedimento para medir a atividade enzimática
Após a mistura dos sobrenadantes, as adições nos poços da microplaca são feitas na
seguinte ordem:
� 100 µL da solução de DTNB em temperatura ambiente. Acrescente com uma pipeta
multicanal;
� 50 µL dos sobrenadantes ou TB para o ensaio branco. Pipete os sobrenadantes para cima
e para baixo por 10 vezes antes de utilizá-los. Acrescente com uma pipeta de um único
canal;
OBS: Guarde as sobras dos sobrenadantes para quantificação do conteúdo de proteínas
pelo método do ácido bicinconínico (seção B);
� 50 µL da solução de ATCI. Acrescente com uma pipeta multicanal.
Após a adição da solução de ATCI a reação tem início, assim rapidamente a microplaca
deve ser incubada na leitora por 5 minutos a 30ºC. Após este período de incubação, as medidas
das taxas de reação devem ser iniciadas. Elas são feitas por 10 minutos a 405 nm e a 30ºC na
leitora DYNEX (DYNEX Technologies, USA) com as seguintes especificações:
� “Pré-agitação”, com média intensidade, por 15 s, seguida por “pré-espera” de 15 s antes
de se iniciar o primeiro ciclo de medição;
� 21 ciclos de medição, cada um intercalado por 30 s de espera, durante o qual a agitação
ocorre;
� O intervalo de agitação é 3 s, com baixa intensidade, seguido por 15 s de “pré-espera”;

Apêndices 186
� Para a redução dos dados selecione a opção “average slope”.
O “average slope” é o resultado da taxa de reação média em ∆OD min-1, para um período
de 10 min de medição. O modo cinético calcula e registra a taxa de reação em mOD min-1, para
cada poço da microplaca.
Para calcular a atividade de ChE (µmol L-1 min-1 g-1 de proteína), a partir da taxa de
reação, utilize a seguinte fórmula:
Atividade de ChE = (∆ OD/min) / (MEC x C),
Onde ∆OD/min é a variação da densidade ótica no tempo; MEC é 8160, coeficiente de
extinção molar do produto colorido a 405 nm; e C é a concentração de proteína do
homogeneizado no ensaio (g L-1).
6. Dados de qualidade do ensaio de ChE
A taxa de reação do ensaio branco esperada é 0,0 a 3,0 mOD min-1.
6.1. Taxa de reação máxima
A taxa de reação máxima da P. ramosa para a qual as leituras cinéticas lineares são obtidas
em um ensaio contendo DTNB a 8 mM e ATCI a 16 mM é de 32 mOD min-1. Este valor
depende da solubilidade do DTNB e das especificidades descritas neste protocolo.
6.2. Taxa de reação mínima
As taxas de reação mínimas para a P. ramosa são:
� 1,42 mOD min-1 para a idade ≤ 72 h;
� 1,67 mOD min-1 para a idade de 7 dias
� 0,94 mOD min-1 para a idade de 14 dias;
� 0,79 mOD min-1 para a idade de 21 dias.
Estes valores foram experimentalmente determinados pelo Limite de Quantificação (LQ).
Qualquer valor abaixo do LQ deve ser omitido da análise.

Apêndices 187
6.3. Taxas de reação para P. ramosa
As taxas de reação de P. ramosa obtidas para as diferentes classes de idade nas condições
especificadas neste protocolo são:
� Para a idade ≤ 72 h: 11,14 a 15,52 mOD min-1;
� Para a idade de 7 dias: 12,34 a 16,78 mOD min-1;
� Para a idade de 14 dias: 10,59 a 14,97 mOD min-1;
� Para a idade de 21 dias: 13,37 a 18,19 mOD min-1.
7. Referências para consulta
Ellman, G.L., Courtney, K.D., Andres Jr., V.A., Featherstone, R.M., 1961. A new and rapid colorimetric determination of acetylcholinesterase activity. Biochem. Pharmacol. 7, 88-95. Fisher, T.C., Callaghan, A., 1999. Standard operating procedures of enzyme activity assays and protein assays for use with III and IV instar larvae of Chironomus riparius. Protocolos desenvolvidos como parte do Projeto: “In situ bioassays and biomarkers for the detection of ecologically relevant responses to contamination in lotic systems and to indicate casual agents (NERC/CA)”. Fisher, T.C., Crane, M., Callaghan, A., 2000. An optimized microtiterplate assay to detect acetylcholinesterase activity in individual Chironomus riparius Meigen. Environ. Toxicol. Chem. 19(7), 1749-1752. Freitas, E.C., 2013. Avaliação dos efeitos neurotóxicos de cianotoxinas em cladóceros com ênfase na utilização de um biomarcador bioquímico para sua detecção. Tese de doutorado, Universidade Federal de São Carlos. 194 p. Freitas, E.C., Printes, L.B., Fernandes, M.N., Rocha, O., (capítulo 4.1. nesta tese). Measurements of cholinesterase activity in the tropical freshwater cladoceran Pseudosida ramosa and its standardization as a biomarker. (artigo submetido). Printes, L.B., 2003. The value of acetylcholinesterase activity in Daphnia as a biomarker of environmental contamination. Thesis, University of Reading. pp. 237. Printes, L.B., Callaghan, A., 2003. Intraclonal variability in Daphnia acetylcholinesterase activity: the implications for its applicability as a biomarker. Environ. Toxicol. Chem. 22, 2042-2047. Printes, L.B., Callaghan, A., 2004. A comparative study on the relationship between acetylcholinesterase activity and acute toxicity in Daphnia magna exposed to anticholinesterase insecticides. Environ. Toxicol. Chem. 23(5), 1241-1247.

Apêndices 188
Printes, L.B., Fellowes, M.D.E., Callaghan, A., 2008. Clonal variation in acetylcholinesterase biomarkers and life history traits following OP exposure in Daphnia magna. Ecotox. Environ. Safe. 71, 519-526.

Apêndices 189
APÊNDICE B
Seção B. Protocolo para a quantificação de proteínas nos homogeneizados do cladócero
tropical Pseudosida ramosa
Emanuela C. Freitas, Liane B. Printes e Odete Rocha
* Nota importante:
O protocolo de quantificação do conteúdo de proteína nos homogeneizados, adaptado
para a espécie nativa Pseudosida ramosa, foi baseado em um ensaio de microplacas desenvolvido
para a quantificação do conteúdo de proteínas das larvas de Chironomus riparius, estabelecido por
Fisher e Callaghan (1999) e Fisher et al. (2000) e também baseado em um ensaio de microplacas
desenvolvido por Printes (2003) para quantificar o conteúdo de proteínas para a espécie Daphnia
magna, nativa do Hemisfério Norte. Fisher e Callaghan (1999), Fisher et al. (2000) e Printes (2003)
adaptaram e otimizaram seus métodos a partir do ensaio cinético do ácido bicinconínico (BCA)
(Pierce, Rockford, IL, USA) (Smith et al., 1985). No caso da determinação específica das faixas de
concentrações da albumina do soro bovino (BSA) utilizadas nos ensaios para as diferentes classes
de idade de P. ramosa, estes foram realizados por Freitas (2013) e Freitas et al. (Capítulo 4.1 desta
tese).
1. Informações sobre o ensaio
O método detalhado aqui é uma modificação feita por Fisher e Callaghan (1999), Fisher
et al. (2000) e Printes (2003) do ensaio espectrofotométrico desenvolvido e comercializado pela
Pierce. Nele, o Cu1+, produzido pela redução do Cu2+ pela proteína, combina-se com o ácido
bicinconínico para produzir um complexo que absorve fortemente a luz a 562 nm, permitindo
uma quantificação indireta do conteúdo de proteína.
O conteúdo de proteína é determinado por meio de uma curva-padrão estabelecida para
uma proteína, a albumina do soro bovino, na qual a taxa de redução do Cu1+ pode ser
correlacionada com as concentrações da albumina do soro bovino, por meio de uma regressão
linear, produzindo uma curva linearmente ajustada e a respectiva equação matemática.
Ao aplicar este ensaio aos homogeneizados, é necessário definir a faixa de concentrações
da albumina do soro bovino que será utilizada para a quantificação do conteúdo proteico de cada
Apêndices 190
homogeneizado. Para cada classe de idade na qual se trabalha, uma faixa específica de
concentrações deve ser utilizada.
2. Reagentes
� Tampão Fosfato (TF) de sódio a 0,02M com pH 8,0. O TF é preparado pela mistura de
uma solução de NaH2PO4 . 2H2O (0,02 M), preparada em água deionizada, com uma
solução de Na2HPO4 . 2 H2O (0,02 M), também preparada em água deionizada;
� Tampão Branco (TB). O TB é o tampão fosfato contendo Triton-X-100 (Sigma Aldrich)
a 0,1% (v/v);
� Albumina do soro bovino (BSA; A-2153, fração V, 96-99%, Sigma Aldrich);
� Curva-padrão de proteína da albumina do soro bovino (BSA) e o ensaio branco (apenas
TB). Para cada classe de idade com a qual se trabalha, uma faixa específica de
concentrações da albumina do soro bovino deve ser utilizada. As soluções de diferentes
concentrações devem ser estocadas em alíquotas de 10 mL em tubos Falcon de
polipropileno a -20ºC por até três meses ou mantidas a 4ºC por até um mês;
OBS: Prepare uma solução-estoque de BSA. A partir dela, prepare as concentrações da
curva-padrão por meio de diluições desta solução-estoque com o TB. As faixas de
concentrações da BSA a serem utilizadas nos ensaios com P. ramosa para as diferentes
classes de idade são:
1) 5, 25, 50, 125, 250 e 500 µg mL-1 para juvenis de P. ramosa com até 72 h de idade;
2) 5, 25, 50, 125, 250, 500, 750, 1000 e 2000 µg mL-1 para indivíduos de P. ramosa com 7
dias e 14 dias de idade;
3) 5, 25, 50, 125, 250, 500, 750, 1000, 1500, 2000, 2500, 3000, 3500, 4000, 4500 e 5000 µg
mL-1 para indivíduos de P. ramosa com 21 dias de idade.
� Reagente A do kit BCA, formulação do ácido bicinconínico (23223, Pierce);
� Reagente B do kit BCA, solução de CuSO4 a 4% (23224, Pierce).
3. Materiais
� Leitora de microplacas (DYNEX Technologies, USA);
� Banho-maria a 30oC;

Apêndices 191
� Vórtex;
� Microplacas com 96 poços, limpas e livres de ranhuras na sua base;
� Pipeta multicanal e ponteiras para pipeta (50 a 250 µL). Checar a calibração a cada três
meses;
� Pipetas de 200 e 1000 µL e suas respectivas ponteiras. Checar a calibração a cada três
meses;
� Tubos Falcon de polipropileno de 15 e 50 mL de capacidade para os reagentes de ensaio;
� Reservatório de reagentes para o carregamento da pipeta multicanal;
� Sala refrigerada;
� Caneta apropriada para anotações nos tubos Falcon;
� Sacos plásticos para congelamento e papel alumínio para embalar os reagentes.
4. Preparo para o ensaio
� Transfira os homogeneizados a 4ºC para o descongelamento, caso tenha congelado;
� Programe o banho-maria para 30ºC e confira a temperatura que ela atinge com o auxílio
de um termômetro. Assegure-se de que o nível da água exceda o nível da solução no tubo
do reagente de trabalho;
� Ligue a leitora de microplacas para que ela atinja a temperatura de leitura (30ºC).
5. Método do ensaio cinético do BCA
� Misture os padrões de proteína e a solução do ensaio branco, preparados conforme já
especificado anteriormente, por três vezes, com inversão e auxílio do vórtex;
� Colete os homogeneizados descongelados a 4ºC e deixe-os em temperatura ambiente;
� Carregue na microplaca 20 µL do ensaio branco e 20 µL dos padrões de proteína;
� Prepare o reagente de trabalho (RT) do BCA em um tudo Falcon de 50 mL adicionando
500 µL do reagente B (após ser misturado no vórtex) a 25 mL do reagente A. Misture o
RT com inversão e auxílio do vórtex. Coloque o RT no banho-maria a 30ºC;
� Imediatamente misture no vórtex (2 s) os homogeneizados descongelados e pipete-os
para cima e para baixo antes de transferir 20 µL para a microplaca;
� Misture o RT no vórtex com inversão e imediatamente adicione 200 µL rapidamente a
cada poço da microplaca utilizando a pipeta multicanal.
Apêndices 192
Após a adição do RT, a reação é iniciada. Assim, rapidamente a microplaca deve ser
levada para a leitora de microplacas. A leitura é feita por 10 minutos a 550 nm e a 30ºC na leitora
DYNEX (DYNEX Technologies, USA) com as seguintes especificações:
� “Pré-agitação”, com média intensidade, por 10 s, seguido por “pré-espera” de 15 s antes
de iniciar o primeiro ciclo de medição;
� 21 ciclos de medição, cada um intercalado por 30 s de espera, durante o qual a agitação é
realizada;
� O intervalo de agitação é de 3 s, com baixa intensidade, seguido por 15 s de “pré-espera”;
� Para a redução dos dados selecione a opção “average slope”;
� Método de ajuste da curva: regressão lienar;
� Eixo x: linear;
� Eixo y: linear;
� Fator (conc): 1.
O “average slope” é o resultado da taxa de reação média em ∆OD min-1, para um período
de 10 min de medição. O modo cinético calcula e registra a taxa de reação em mOD min-1, para
cada poço da microplaca.
A leitora de microplacas calcula e registra a concentração de proteína em relação à reta de
regressão obtida por meio da curva-padrão de proteína.
6. Dados de qualidade do ensaio BCA
A taxa de reação do ensaio branco esperada é 0,1 a 0,9 mOD min-1.
7. Referências para consulta
Informações obtidas na bula do ensaio de proteínas BCA (Pierce).
Fisher, T.C., Callaghan, A., 1999. Standard operating procedures of enzyme activity assays and protein assays for use with III and IV instar larvae of Chironomus riparius. Protocolos desenvolvidos como parte do Projeto: “In situ bioassays and biomarkers for the detection of ecologically relevant responses to contamination in lotic systems and to indicate casual agents (NERC/CA)”.

Apêndices 193
Fisher, T.C., Crane, M., Callaghan, A., 2000. An optimized microtiterplate assay to detect acetylcholinesterase activity in individual Chironomus riparius Meigen. Environ. Toxicol. Chem. 19(7), 1749-1752. Freitas, E.C., 2013. Avaliação dos efeitos neurotóxicos de cianotoxinas em cladóceros com ênfase na utilização de um biomarcador bioquímico para sua detecção. Tese de doutorado, Universidade Federal de São Carlos. 194 p. Freitas, E.C., Printes, L.B., Fernandes, M.N., Rocha, O., Measurements of cholinesterase activity in the tropical freshwater cladoceran Pseudosida ramosa and its standardization as a biomarker. (Artigo submetido) Printes, L.B., 2003. The value of acetylcholinesterase activity in Daphnia as a biomarker of environmental contamination. Thesis, University of Reading. pp. 237. Printes, L.B., Callaghan, A., 2003. Intraclonal variability in Daphnia acetylcholinesterase activity: the implications for its applicability as a biomarker. Environ. Toxicol. Chem. 22, 2042-2047. Printes, L.B., Callaghan, A., 2004. A comparative study on the relationship between acetylcholinesterase activity and acute toxicity in Daphnia magna exposed to anticholinesterase insecticides. Environ. Toxicol. Chem. 23(5), 1241-1247. Printes, L.B., Fellowes, M.D.E., Callaghan, A., 2008. Clonal variation in acetylcholinesterase biomarkers and life history traits following OP exposure in Daphnia magna. Ecotoxicol. Environ. Safe. 71, 519-526. Smith, P.K., Krohn, R.I., Hermanson, G.T., Mallia, A.K., Gartner, F.H., Provenzano, M.D., Fujimoto, E.K., Goeke, N.M., Olson, B.J., Klenk, D.C., 1985. Measurement of protein using bicinchoninic acid. Anal. Biochem. 150, 76-85.