autonomous vehicles: technologies, economics, and opportunities
TRANSCRIPT
National University of SingaporeKartikey Joshi
Dhivya Sampath KumarRahul Mehta
Shiva Muthuraj
Autonomous Vehicles (AVs)
Technology,Economics, andOpportunities
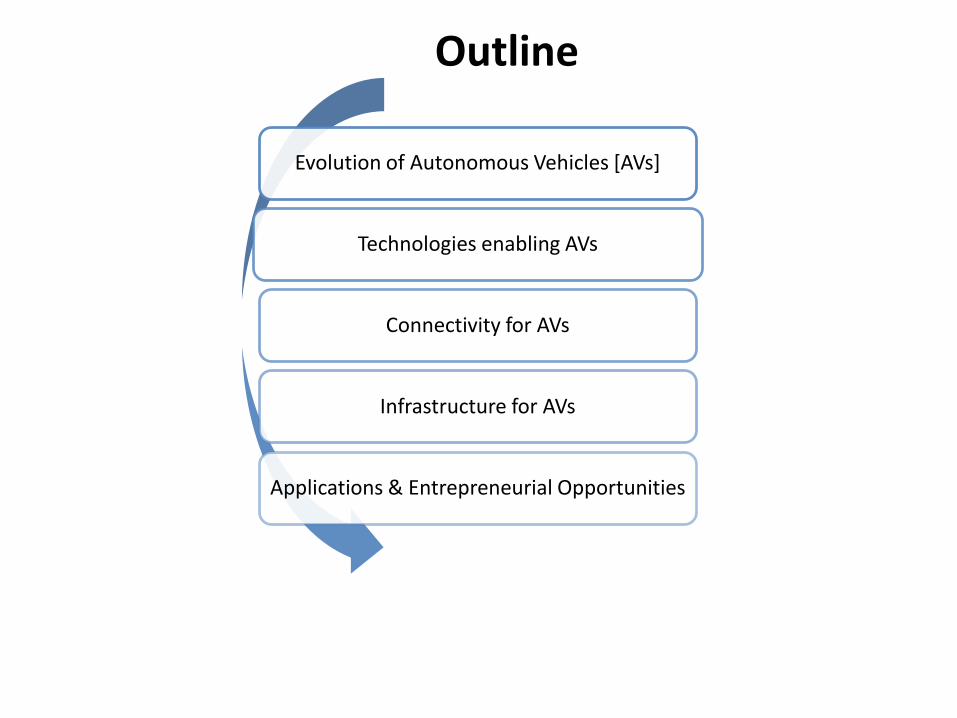
Evolution of Autonomous Vehicles [AVs]
Technologies enabling AVs
Connectivity for AVs
Infrastructure for AVs
Applications & Entrepreneurial Opportunities
Outline
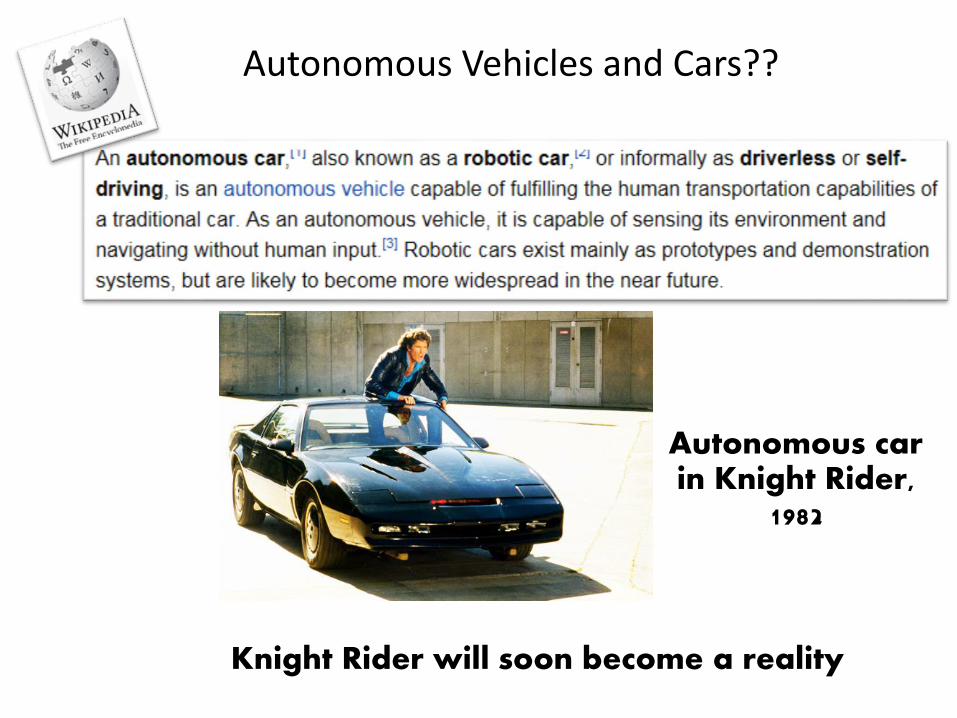
Knight Rider will soon become a reality
Autonomous car in Knight Rider,
1982
Autonomous Vehicles and Cars??
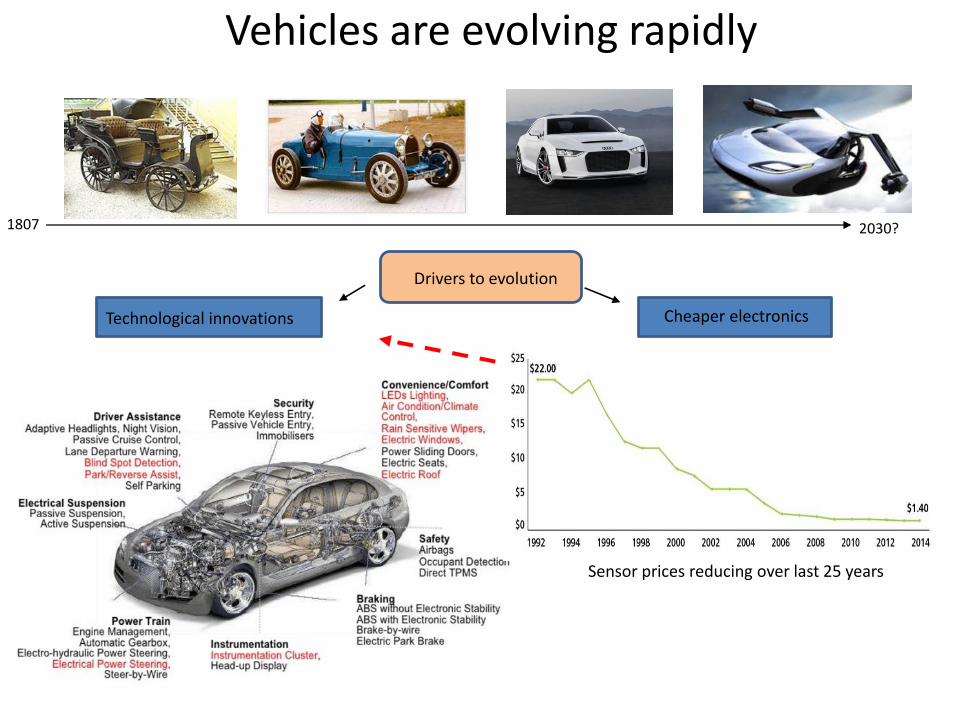
Vehicles are evolving rapidly
Cheaper electronicsTechnological innovations
Drivers to evolution
1807 2030?
Sensor prices reducing over last 25 years
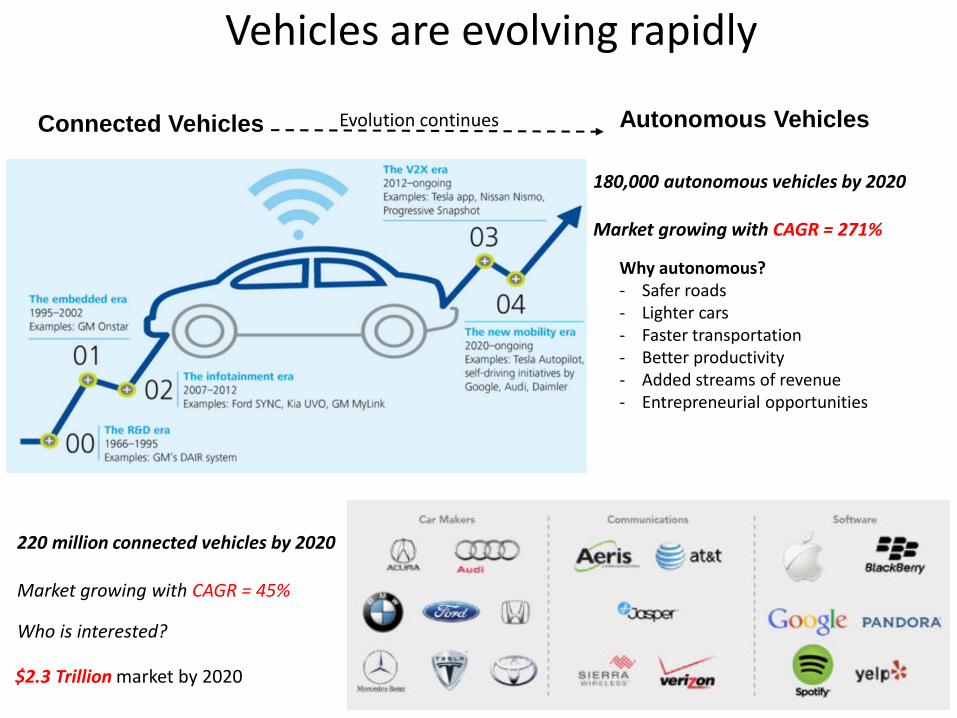
Connected Vehicles
220 million connected vehicles by 2020
Market growing with CAGR = 45%
Who is interested?
Autonomous VehiclesEvolution continues
$2.3 Trillion market by 2020
180,000 autonomous vehicles by 2020
Market growing with CAGR = 271%
Why autonomous?- Safer roads- Lighter cars- Faster transportation- Better productivity- Added streams of revenue- Entrepreneurial opportunities
Vehicles are evolving rapidly

How can we reduce the cost?
- Reduce number of vehicles
AV : With 90% AV penetration, number of cars on the road reduces by 42.6%
Passenger cars are idle for >90% of time
- Reduce congestion/increase throughputAV : eco driving to maximize vehicle flow
- Reduce accidents AV : eliminate human error
Why Autonomous Cars?per-mile extra costs per automobile
~1.2 billion cars in the world~20,000 miles average annual car usage
Range of potential fuel economy improvements for conventional, hybrid & autonomous cars
Human error causes 90-93% road accidents
Extra costs from car usage > 2Trillion USD!GDP of India ~ 2Trillion USD
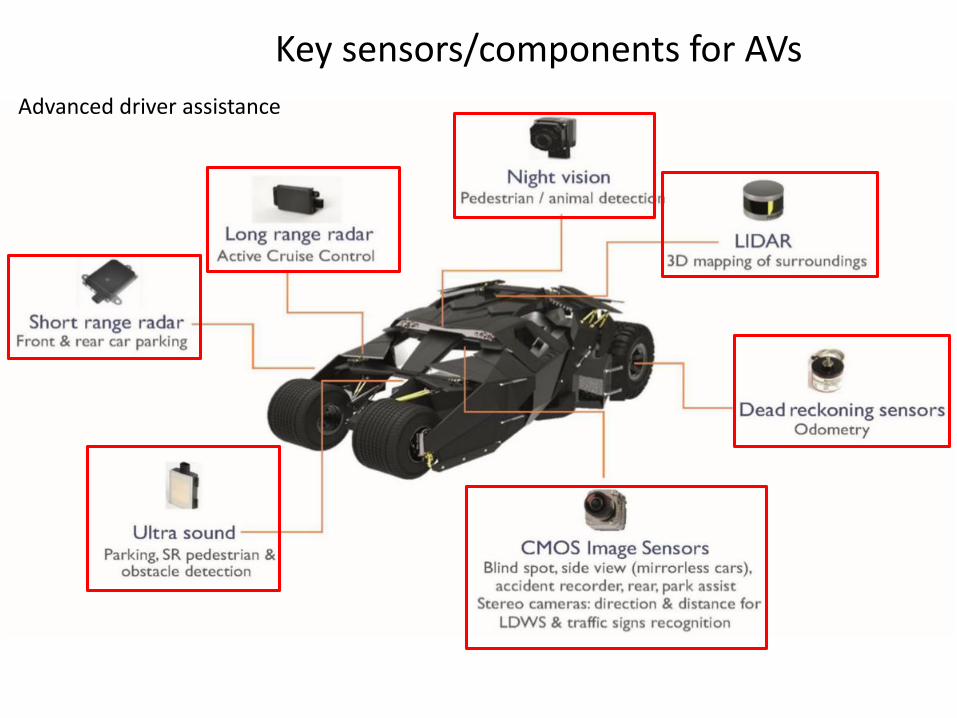
Key sensors/components for AVs
Advanced driver assistance
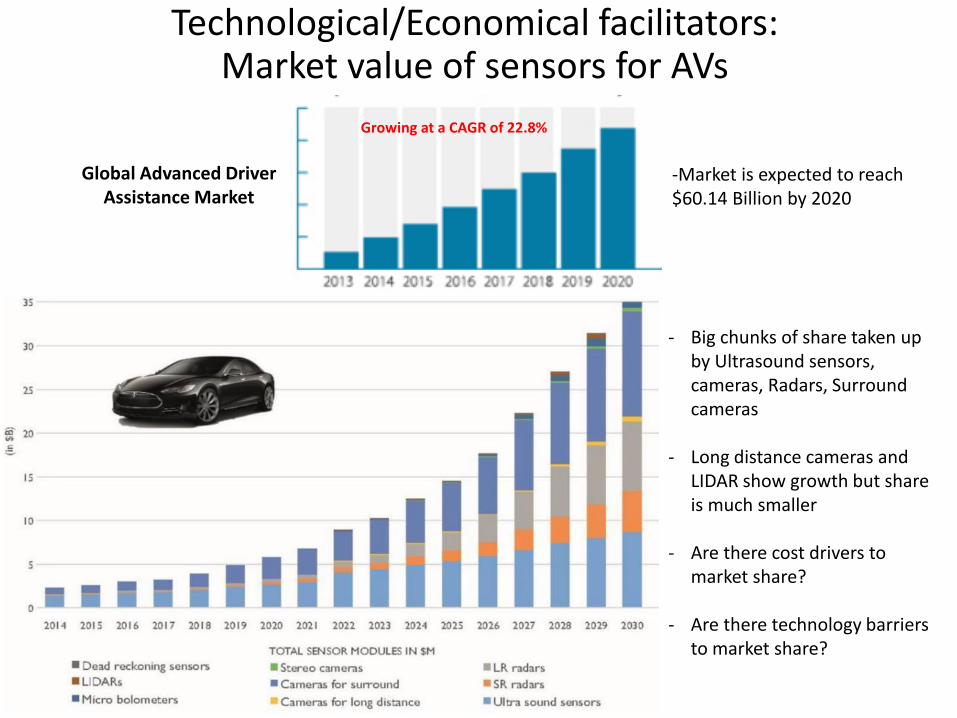
Technological/Economical facilitators: Market value of sensors for AVs
- Big chunks of share taken up by Ultrasound sensors, cameras, Radars, Surround cameras
- Long distance cameras and LIDAR show growth but share is much smaller
- Are there cost drivers to market share?
- Are there technology barriers to market share?
Global Advanced Driver Assistance Market
-Market is expected to reach $60.14 Billion by 2020
Growing at a CAGR of 22.8%
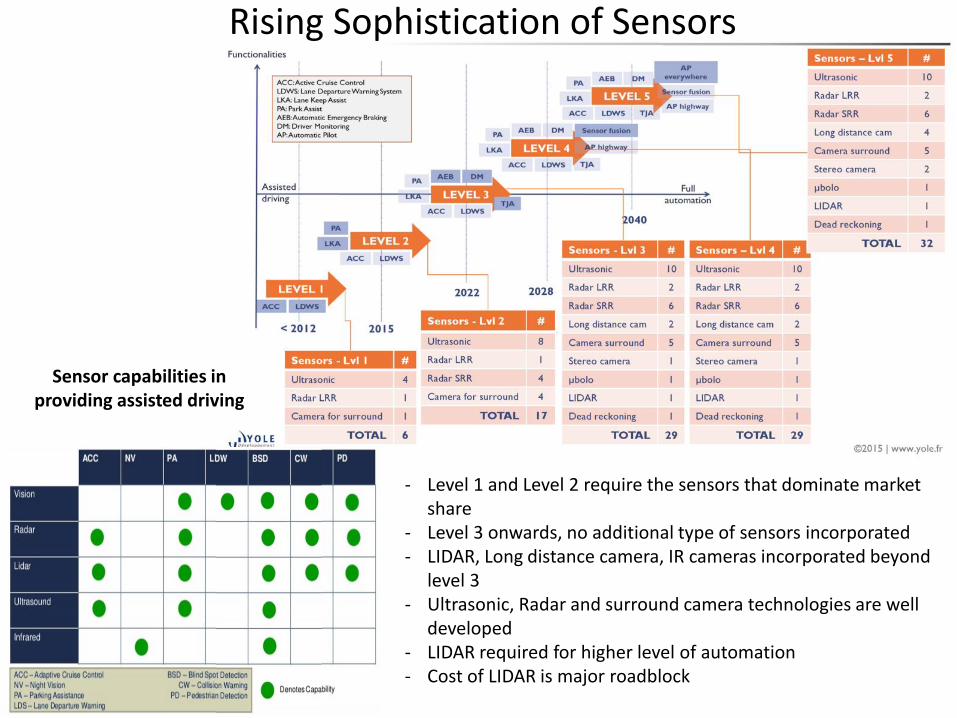
Rising Sophistication of Sensors
- Level 1 and Level 2 require the sensors that dominate market share
- Level 3 onwards, no additional type of sensors incorporated- LIDAR, Long distance camera, IR cameras incorporated beyond
level 3- Ultrasonic, Radar and surround camera technologies are well
developed- LIDAR required for higher level of automation- Cost of LIDAR is major roadblock
Sensor capabilities in providing assisted driving
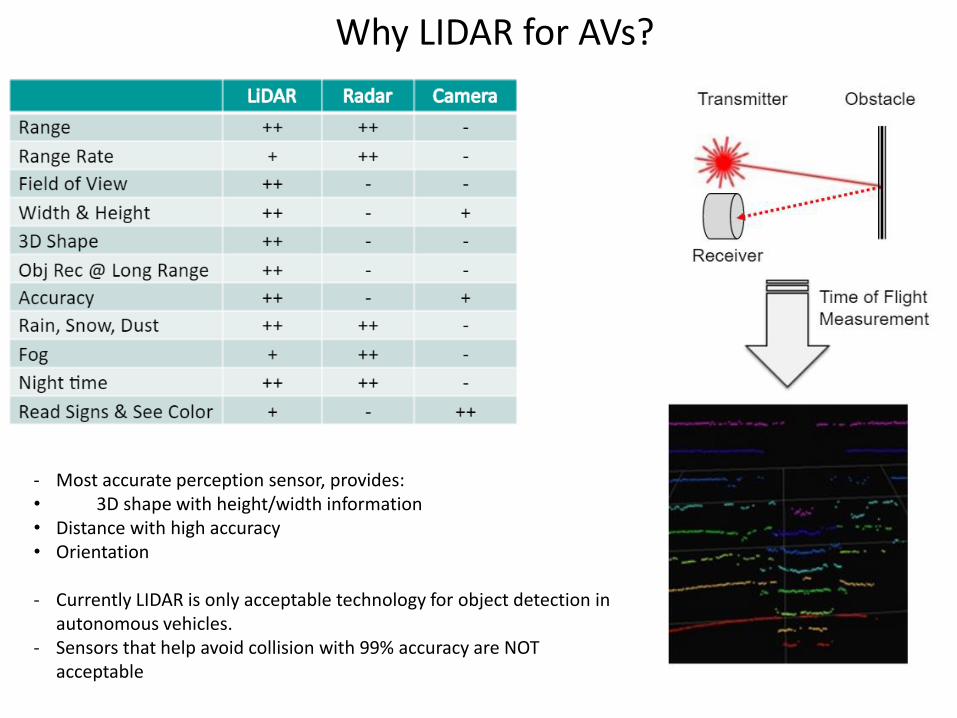
Why LIDAR for AVs?
- Most accurate perception sensor, provides:• 3D shape with height/width information• Distance with high accuracy• Orientation
- Currently LIDAR is only acceptable technology for object detection in autonomous vehicles.
- Sensors that help avoid collision with 99% accuracy are NOT acceptable
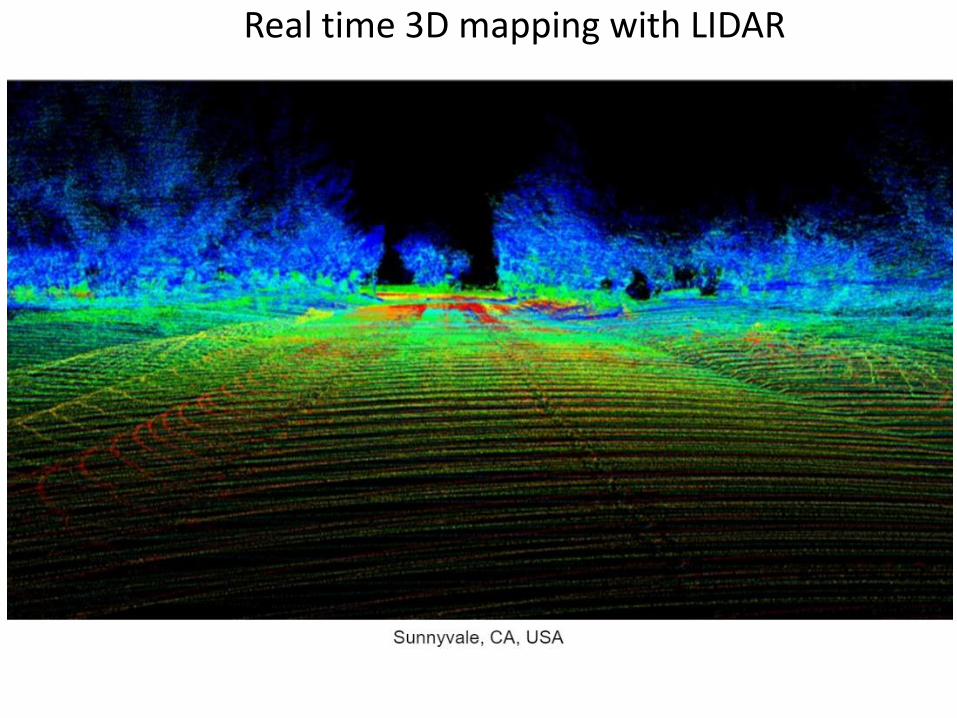
Real time 3D mapping with LIDAR
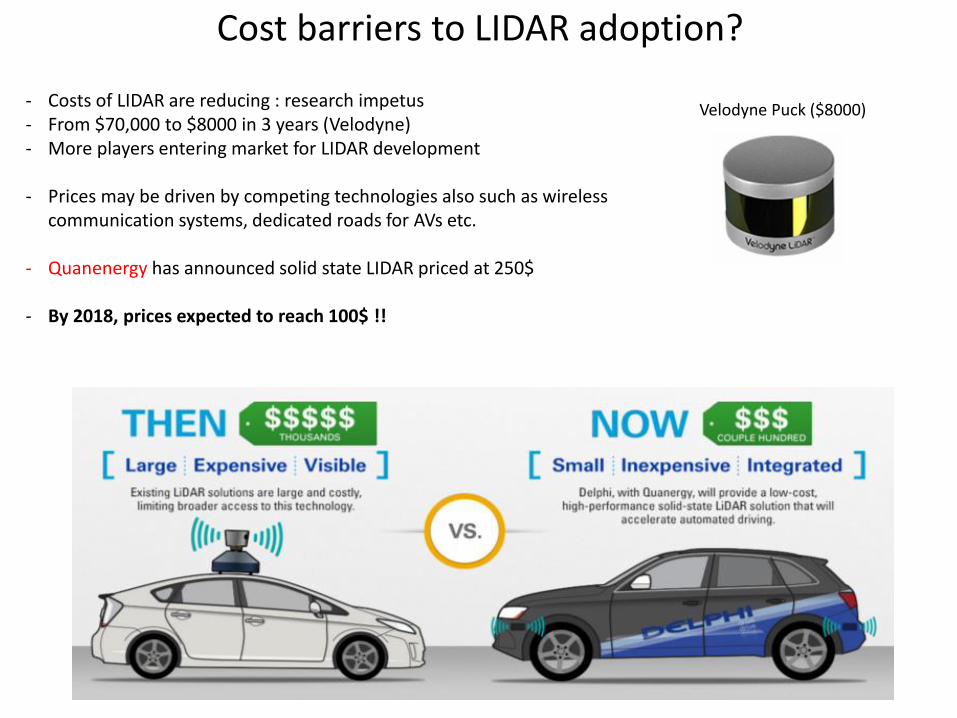
- Costs of LIDAR are reducing : research impetus- From $70,000 to $8000 in 3 years (Velodyne)- More players entering market for LIDAR development
- Prices may be driven by competing technologies also such as wireless communication systems, dedicated roads for AVs etc.
- Quanenergy has announced solid state LIDAR priced at 250$
- By 2018, prices expected to reach 100$ !!
Cost barriers to LIDAR adoption?
Velodyne Puck ($8000)
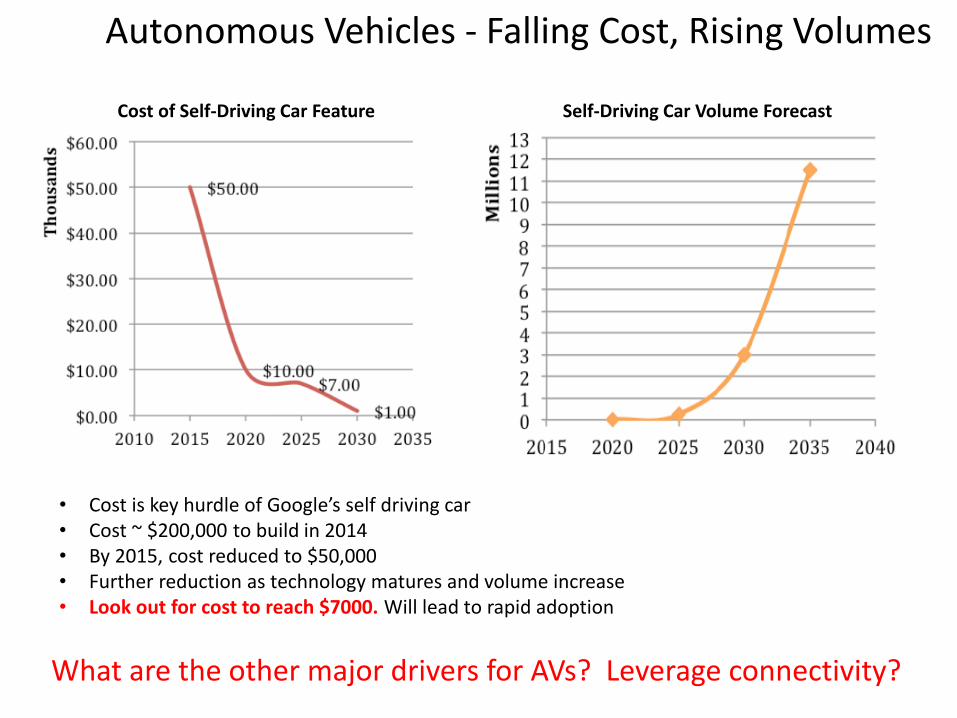
Cost of Self-Driving Car Feature Self-Driving Car Volume Forecast
Autonomous Vehicles - Falling Cost, Rising Volumes
• Cost is key hurdle of Google’s self driving car• Cost ~ $200,000 to build in 2014• By 2015, cost reduced to $50,000• Further reduction as technology matures and volume increase• Look out for cost to reach $7000. Will lead to rapid adoption
What are the other major drivers for AVs? Leverage connectivity?
Connectivity for Autonomous Vehicles
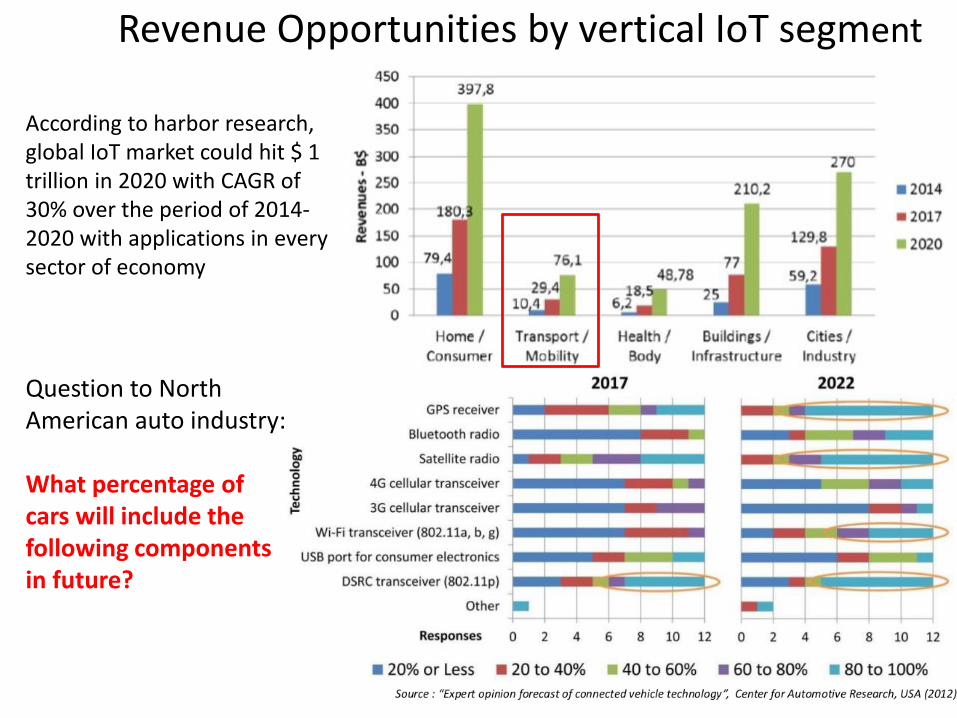
Revenue Opportunities by vertical IoT segment
According to harbor research, global IoT market could hit $ 1 trillion in 2020 with CAGR of 30% over the period of 2014-2020 with applications in every sector of economy
Question to North American auto industry:
What percentage of cars will include the following components in future?

Simplified Automated Vehicle Model
IoT sensor fabric for V2V
Everything in the mesh can see each’s sensor
data mesh across Cloud, 3G, DSRC, Wifi,
6LoWPAN
Intelligent Vehicles are a set of agents which integrate multi-sensor fusion-based environment perception, modeling, localization and map building, path planning, decision making & motion control
Connected Car is a big data Problem
• New cars produce 5GB/hrsensor data
• 60M cars manufactured each year
• If driven 4hrs a day then438 exabytes

Automotive: Big Data User on the IoT
• Cloud services reduce the time to market and simplify updates.
• Network rollouts of 5G have been very fast and are still accelerating.
• In ten years, everything will be Cloud.”
Connected car/AVs subscriptions forecast
Acceleration in connected car sales, from 10M subscriptions today to nearly 40M in less than 5 yrs
Car on the Cloud
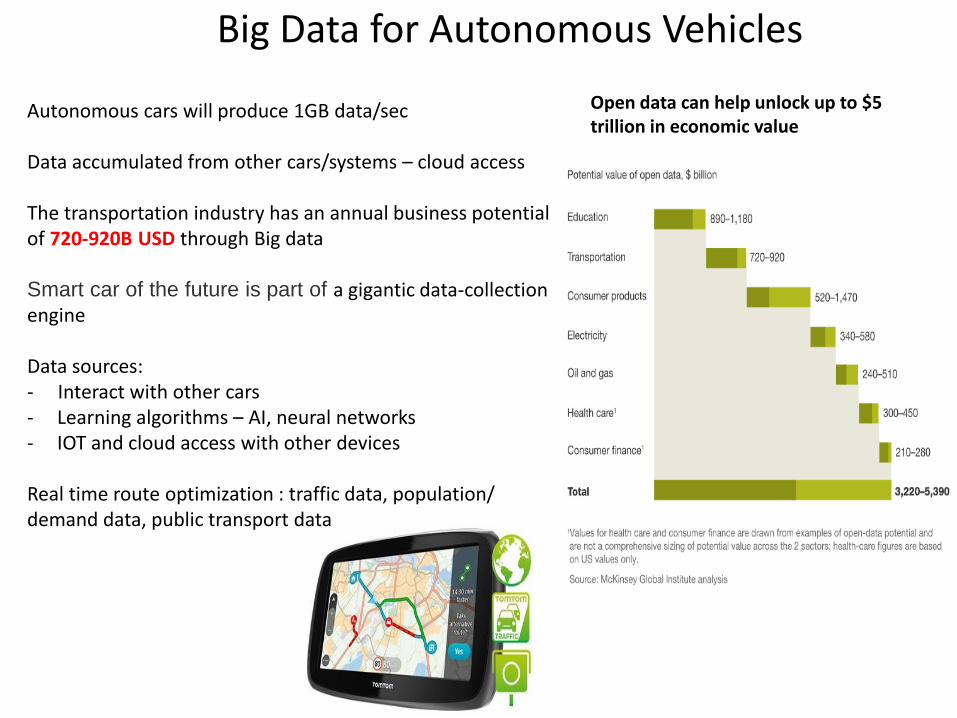
Autonomous cars will produce 1GB data/sec
Data accumulated from other cars/systems – cloud access
The transportation industry has an annual business potential of 720-920B USD through Big data
Smart car of the future is part of a gigantic data-collection engine
Data sources:- Interact with other cars - Learning algorithms – AI, neural networks- IOT and cloud access with other devices
Real time route optimization : traffic data, population/demand data, public transport data
Big Data for Autonomous Vehicles
Open data can help unlock up to $5 trillion in economic value
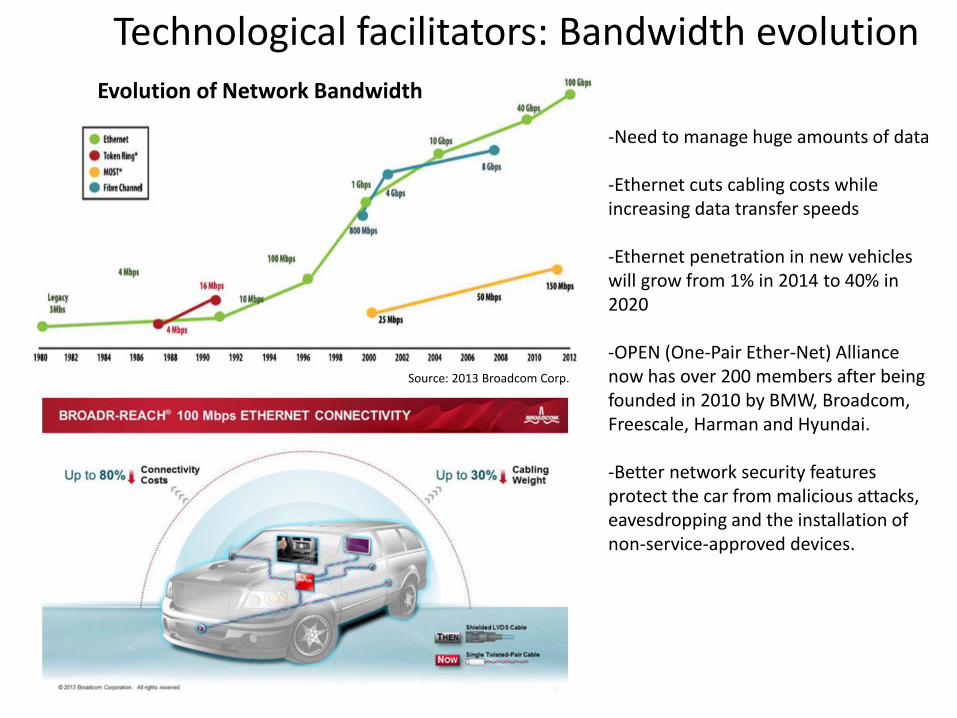
Technological facilitators: Bandwidth evolution
-Need to manage huge amounts of data
-Ethernet cuts cabling costs while increasing data transfer speeds
-Ethernet penetration in new vehicles will grow from 1% in 2014 to 40% in 2020
-OPEN (One-Pair Ether-Net) Alliance now has over 200 members after being founded in 2010 by BMW, Broadcom, Freescale, Harman and Hyundai.
-Better network security features protect the car from malicious attacks, eavesdropping and the installation of non-service-approved devices.
Evolution of Network Bandwidth
Source: 2013 Broadcom Corp.
Typical Mobile Bandwidth & Latency - Existing Networks (2013)
Theoretical Bandwidth & Latency
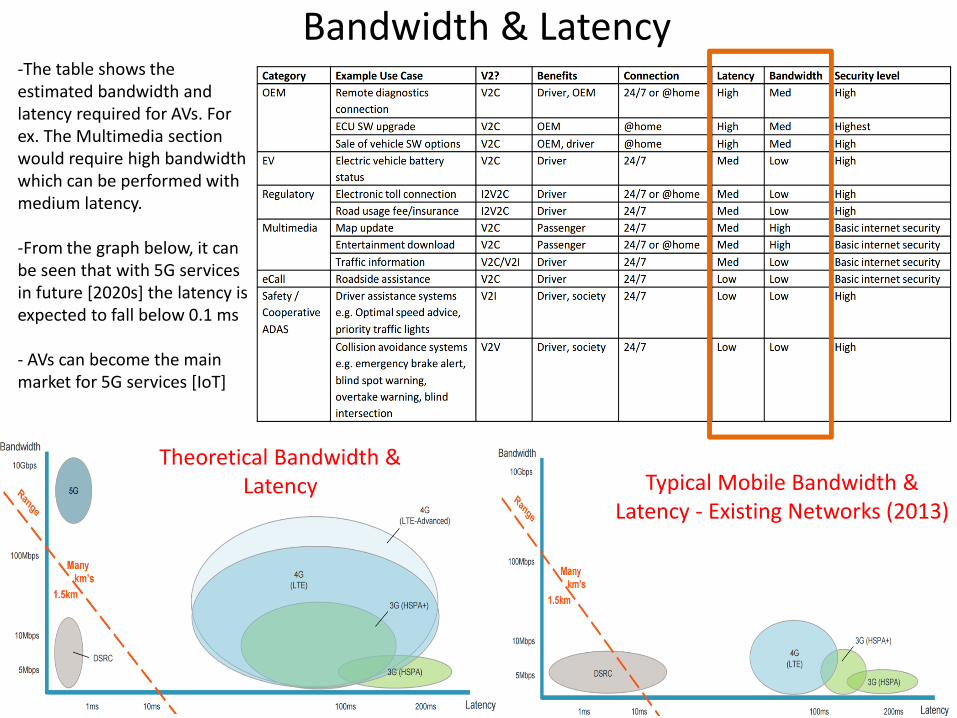
Bandwidth & Latency-The table shows the estimated bandwidth and latency required for AVs. For ex. The Multimedia section would require high bandwidth which can be performed with medium latency.
-From the graph below, it can be seen that with 5G services in future [2020s] the latency is expected to fall below 0.1 ms
- AVs can become the main market for 5G services [IoT]
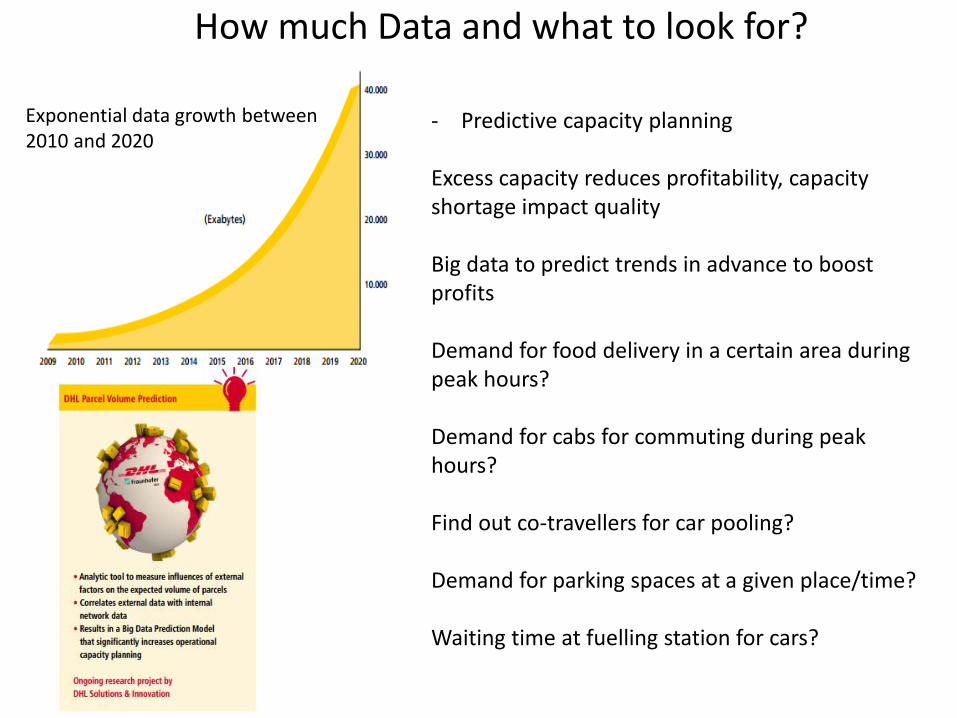
How much Data and what to look for?
Exponential data growth between 2010 and 2020
- Predictive capacity planning
Excess capacity reduces profitability, capacity shortage impact quality
Big data to predict trends in advance to boost profits
Demand for food delivery in a certain area during peak hours?
Demand for cabs for commuting during peak hours?
Find out co-travellers for car pooling?
Demand for parking spaces at a given place/time?
Waiting time at fuelling station for cars?
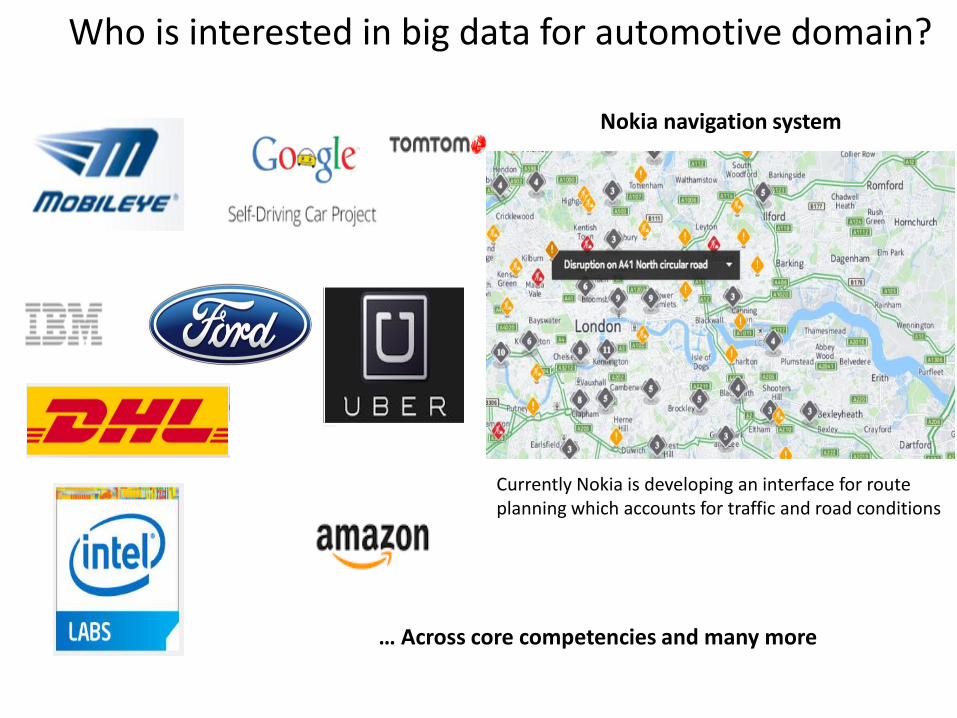
Who is interested in big data for automotive domain?
… Across core competencies and many more
Nokia navigation system
Currently Nokia is developing an interface for route planning which accounts for traffic and road conditions
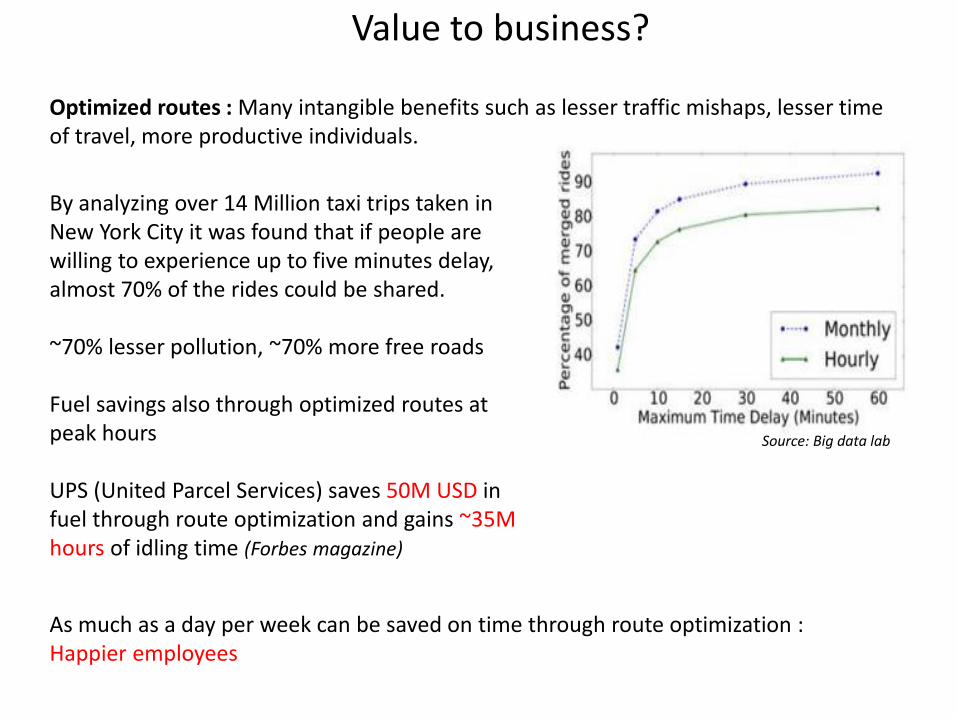
Optimized routes : Many intangible benefits such as lesser traffic mishaps, lesser time of travel, more productive individuals.
As much as a day per week can be saved on time through route optimization : Happier employees
Value to business?
By analyzing over 14 Million taxi trips taken in New York City it was found that if people are willing to experience up to five minutes delay, almost 70% of the rides could be shared.
~70% lesser pollution, ~70% more free roads
Fuel savings also through optimized routes at peak hours
UPS (United Parcel Services) saves 50M USD in fuel through route optimization and gains ~35M hours of idling time (Forbes magazine)
Source: Big data lab
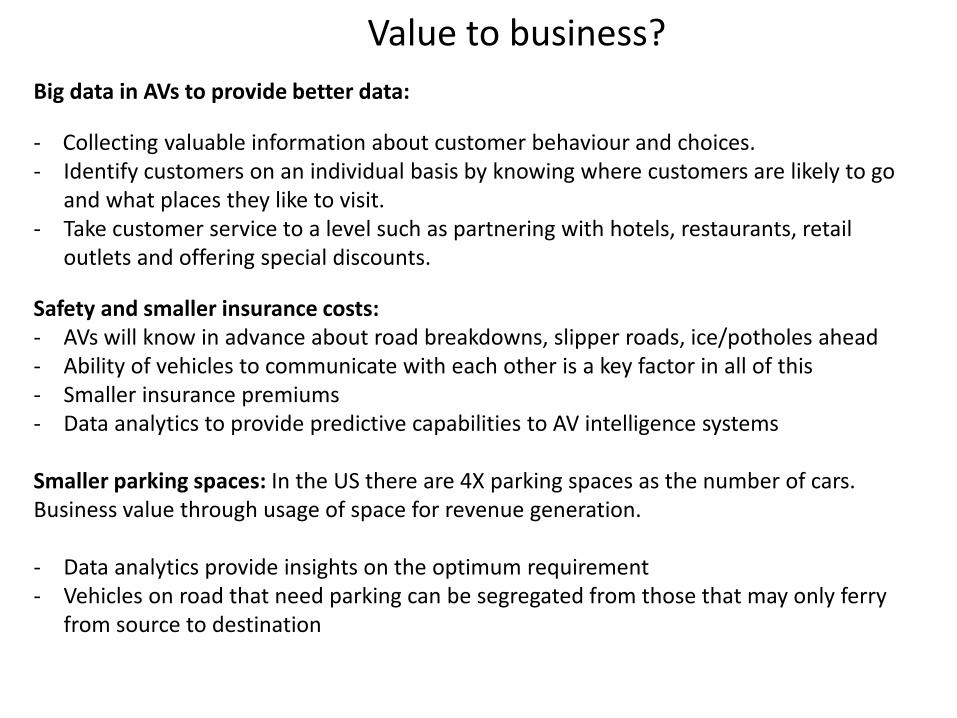
Big data in AVs to provide better data:
- Collecting valuable information about customer behaviour and choices. - Identify customers on an individual basis by knowing where customers are likely to go
and what places they like to visit.- Take customer service to a level such as partnering with hotels, restaurants, retail
outlets and offering special discounts.
Safety and smaller insurance costs:- AVs will know in advance about road breakdowns, slipper roads, ice/potholes ahead- Ability of vehicles to communicate with each other is a key factor in all of this- Smaller insurance premiums - Data analytics to provide predictive capabilities to AV intelligence systems
Smaller parking spaces: In the US there are 4X parking spaces as the number of cars.Business value through usage of space for revenue generation.
- Data analytics provide insights on the optimum requirement- Vehicles on road that need parking can be segregated from those that may only ferry
from source to destination
Value to business?

Why Publish/Subscribe for Sensor Networks
• Sensors and apps may be added/removed at any time
• Bridging of heterogeneous wireless networks
• Inherently multicast• Real-time delivery of data ex. Alarm events
IoT Protocols
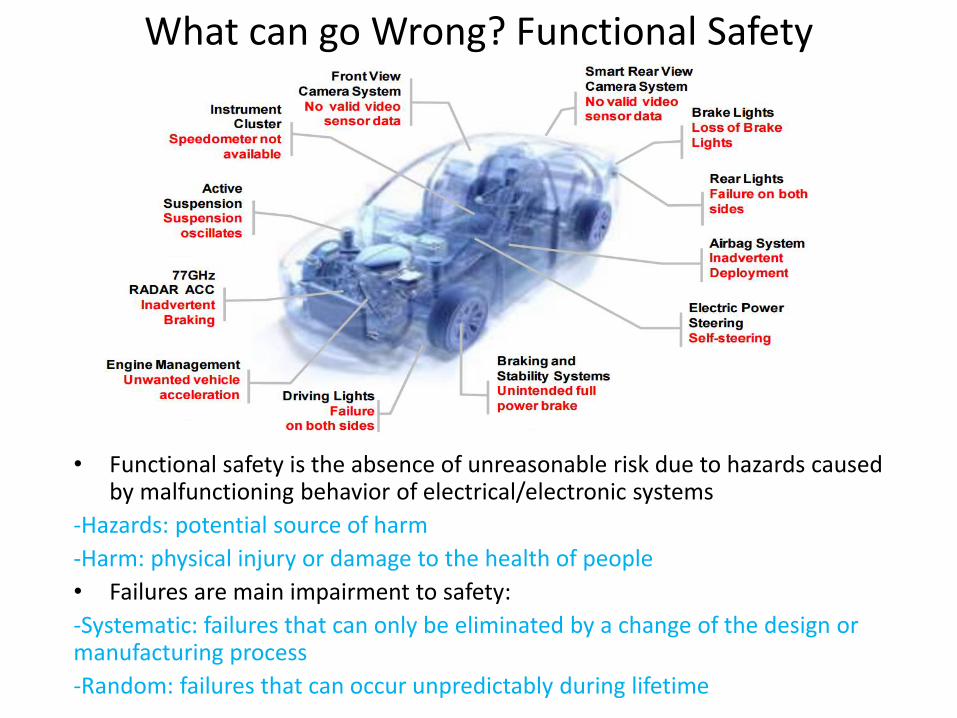
What can go Wrong? Functional Safety
• Functional safety is the absence of unreasonable risk due to hazards caused by malfunctioning behavior of electrical/electronic systems
-Hazards: potential source of harm
-Harm: physical injury or damage to the health of people
• Failures are main impairment to safety:
-Systematic: failures that can only be eliminated by a change of the design or manufacturing process
-Random: failures that can occur unpredictably during lifetime
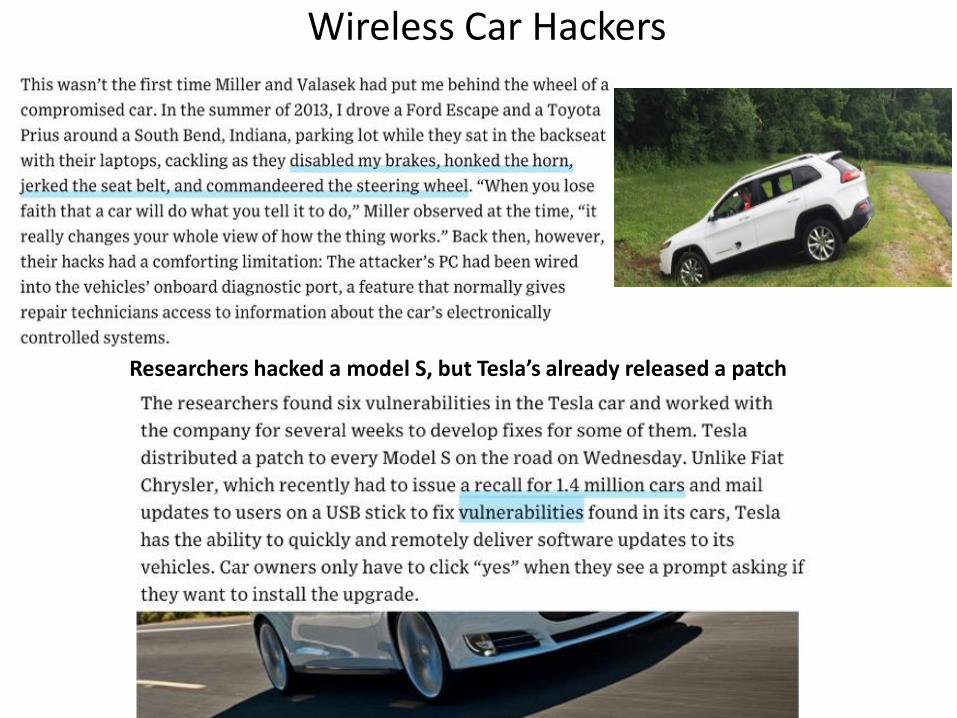
Researchers hacked a model S, but Tesla’s already released a patch
Wireless Car Hackers

Connected Car and Cyber Security
Remote reprogrammingIf the car makers can do remotely reprogram computers, so could hackers. With public signals, such as for “smart” traffic lights that communicate with cars, on the horizon, the public cloud will be a major source of vulnerabilities
Vulnerabilities of diagnostic interface
Vulnerabilities of Onboard networks,
devices & Apps
Vulnerabilities over V2I communications
Malware attacks thro Communication
channels
Vulnerabilities of V2V
Communications
Vulnerabilities of local
communications
Possible security approaches• With fixed designs, heavy onboard processing
and large database is required that raise trustworthiness issues if downloaded from the cloud. With a heuristic protection approach, there is even heavier processing needed.
• With cloud-based system there could be a communications overload imposed on the in-car hardware, with long delays for file execution.
• A continuous connection from the car to the cloud would be impractical. The software still would have to determine the trustworthiness of threat messages and decide which malware it sees is relevant to the car.
• Virtual private networks (VPNs) provide good security and can be turned on, on a needed basis.
Long life for vehicle modules necessaryReplacement parts pose problem. There might have to be configuration keys that would allow parts to interact with the rest of the system, and the parts would have to be programmed to the same level of security, a how-to-do question for aftermarket manufacturers.
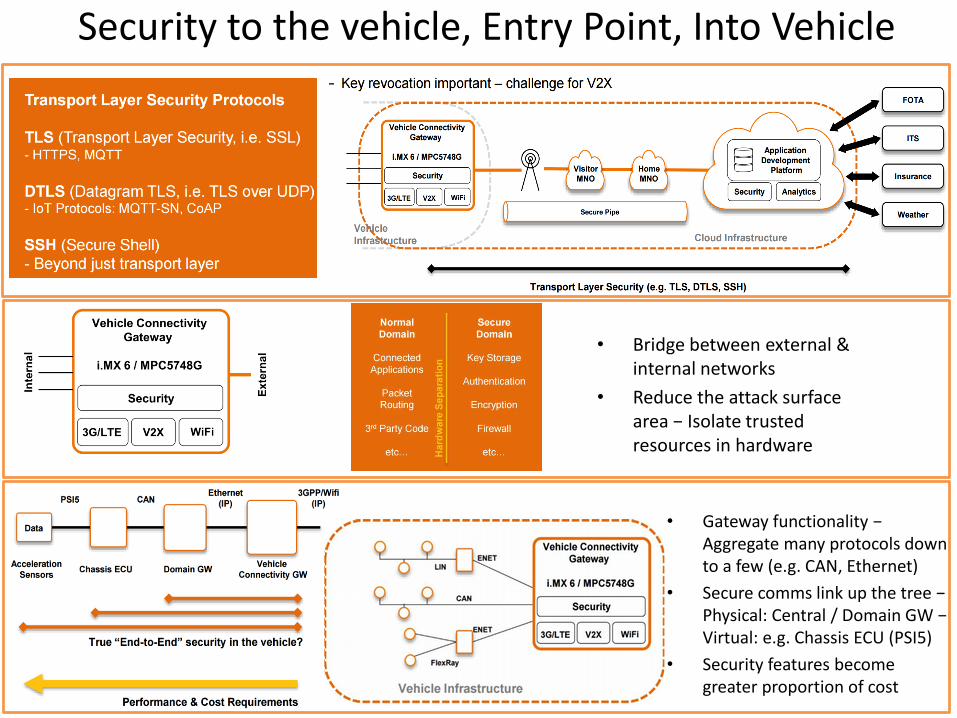
Security to the vehicle, Entry Point, Into Vehicle
• Bridge between external & internal networks
• Reduce the attack surface area − Isolate trusted resources in hardware
• Gateway functionality − Aggregate many protocols down to a few (e.g. CAN, Ethernet)
• Secure comms link up the tree − Physical: Central / Domain GW − Virtual: e.g. Chassis ECU (PSI5)
• Security features become greater proportion of cost

• An integrated network of driverless vehicles could include self-driving taxis and autonomous car sharing.
• A network of autonomous vehicles could make it viable to introduce smart expressway lanes, on which thevehicles move in platoons to increase throughput of the roads.
• Smart parking systems could also be implemented, whereby driverless vehicles drop their passengers off,go find a parking space themselves and park closely to each other.
• This saves space while potentially rendering parking offences a thing of the past. Other applications mayinclude driverless commercial vehicles that ply in the middle of the night to optimize road space.
• This would save manpower on drivers and minimize traffic congestion.
Singapore's Next Step to dedicated Highway lanes for AVs
Roads for AVs
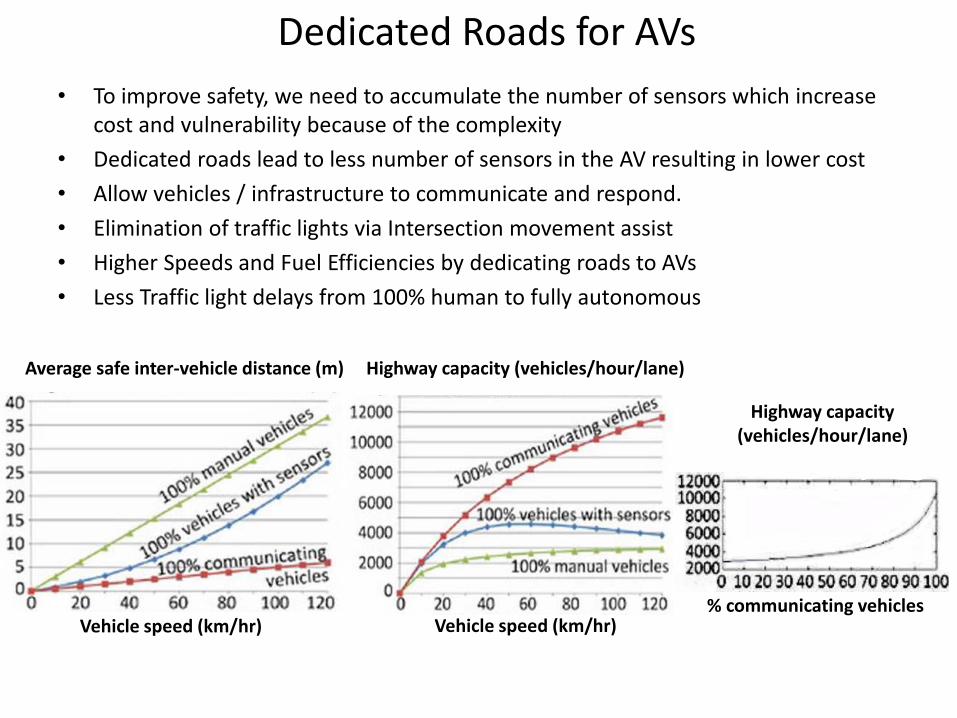
Dedicated Roads for AVs
• To improve safety, we need to accumulate the number of sensors which increase cost and vulnerability because of the complexity
• Dedicated roads lead to less number of sensors in the AV resulting in lower cost
• Allow vehicles / infrastructure to communicate and respond.
• Elimination of traffic lights via Intersection movement assist
• Higher Speeds and Fuel Efficiencies by dedicating roads to AVs
• Less Traffic light delays from 100% human to fully autonomous
Average safe inter-vehicle distance (m)
Vehicle speed (km/hr)
Highway capacity (vehicles/hour/lane)
Vehicle speed (km/hr)
Highway capacity (vehicles/hour/lane)
% communicating vehicles
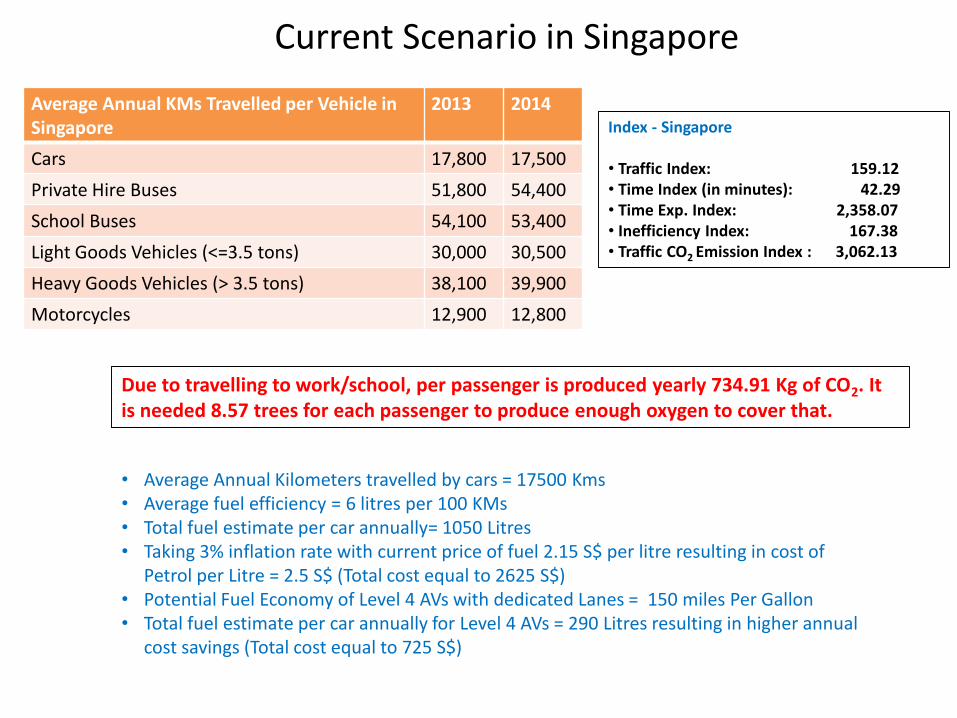
• Average Annual Kilometers travelled by cars = 17500 Kms• Average fuel efficiency = 6 litres per 100 KMs • Total fuel estimate per car annually= 1050 Litres• Taking 3% inflation rate with current price of fuel 2.15 S$ per litre resulting in cost of
Petrol per Litre = 2.5 S$ (Total cost equal to 2625 S$)• Potential Fuel Economy of Level 4 AVs with dedicated Lanes = 150 miles Per Gallon• Total fuel estimate per car annually for Level 4 AVs = 290 Litres resulting in higher annual
cost savings (Total cost equal to 725 S$)
Average Annual KMs Travelled per Vehicle in Singapore
2013 2014
Cars 17,800 17,500
Private Hire Buses 51,800 54,400
School Buses 54,100 53,400
Light Goods Vehicles (<=3.5 tons) 30,000 30,500
Heavy Goods Vehicles (> 3.5 tons) 38,100 39,900
Motorcycles 12,900 12,800
Current Scenario in Singapore
Index - Singapore
• Traffic Index: 159.12• Time Index (in minutes): 42.29• Time Exp. Index: 2,358.07• Inefficiency Index: 167.38• Traffic CO2 Emission Index : 3,062.13
Due to travelling to work/school, per passenger is produced yearly 734.91 Kg of CO2. It is needed 8.57 trees for each passenger to produce enough oxygen to cover that.

Cost of Road Accidents • 160 Fatalities = 4394880 USD• 9800 Injuries = 68600000 USD
Fatal Serious Injury
Slight Injury
Property Damage
Per Casualty
Lost Output 902,362 47,578 5,468
Medical Costs 12,760 30,668 4,656
Pain, Grief, Sufferings 358,124 87,069 1,779
Total 1,273,246 165,315 11,903 0
Per Accident
Administrative Cost 22,044 3,425 2,278 445
Property Damage 5,424 5,424 5,424 5,424
Total 27,468 8,849 7,702 5,869
Summary of costs per casualty or per accident ($)
Road Accident Casualties in Singapore
2013 2014
Fatalities 160 154
Injuries 9,751 9,835
• Cost of Car Insurance - quite variable over the lifetime of your policy as driving experience, policy amendments and accidents have an effect on your premiums.
• For a safe driver, the insurer gives 10% No-Claim Discount (NCD) after every year - without incident (up to the maximum 50%).
• Based on an initial car insurance annual premium of S$3,600 (excess S$1,000) for a comprehensive policy, overall insurance premiums over 10 years will be…Overall cost of your auto insurance = S$24,520 (factoring NCD)
• Morgan Stanley indicate that human error has been the main determinant in over 90 percent of these accidents which will be eliminated for AVs with dedicated lanes
• Insurance cost going down to 90 percent – resulting in 245 S$ roughly
Accidents and Insurance statistics for Singapore
Transactions on the Built Environment vol 64, © 2003 WIT Press, www.witpress.com, ISSN 1743-3509

You will spend more time doing the things you love, not driving
What else, if not driving?
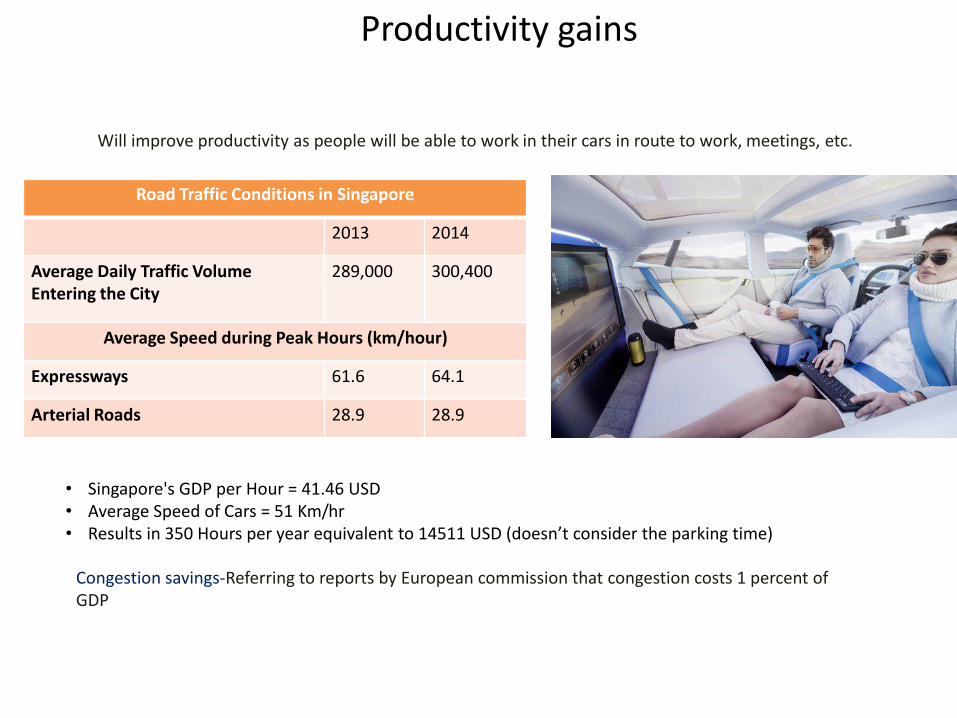
Productivity gains
Will improve productivity as people will be able to work in their cars in route to work, meetings, etc.
• Singapore's GDP per Hour = 41.46 USD• Average Speed of Cars = 51 Km/hr• Results in 350 Hours per year equivalent to 14511 USD (doesn’t consider the parking time)
Congestion savings-Referring to reports by European commission that congestion costs 1 percent of GDP
Road Traffic Conditions in Singapore
2013 2014
Average Daily Traffic Volume Entering the City
289,000 300,400
Average Speed during Peak Hours (km/hour)
Expressways 61.6 64.1
Arterial Roads 28.9 28.9

Mercedes-
Benz E300
Hybrid (Cat
B, hybrid)
Taxes in Singapore
• If a car's engine capacity is 1,600cc, the Road Tax is S$ 600 per year while the same which is roughly 3500 Pounds.
• AVs with dedicated roads will dramatically reduce the number of accidents leading to go for even pod like cars weighing just 250 pounds and requiring much lower engine cc requirements.
• Also carbon emission will be much lower comparatively in the range of A1. • The poor traffic index of Singapore will be improved drastically
Engine Capacity (EC) in cc
From 1 July 2008 to 31 July 2015, and from 1 August 2016
From 1 August 2015 to 31 July 2016 (with 20% rebate
EC <= 600 S$ 200 X 0.782 S$ 200 X 0.6256
600 < EC <= 1000 [S$ 200 + S$ 0.125 (EC –600)] X 0.782
[S$ 200 + S$ 0.125 (EC –600)] X 0.6256
1000 < EC <= 1600 [S$ 250 + S$ 0.375 (EC –1000)] X 0.782
[S$ 250 + S$ 0.375 (EC –1000)] X 0.6256
1600 < EC <= 3000 [S$ 475 + S$ 0.75 (EC –1600)] X 0.782
[S$ 475 + S$ 0.75 (EC –1600)] X 0.6256
EC > 3000 [S$ 1525 + S$ 1(EC –3000)] X 0.782
[S$ 1525 + S$ 1(EC –3000)] X 0.6256
Road Tax in Singapore
CEV Tax in Singapore
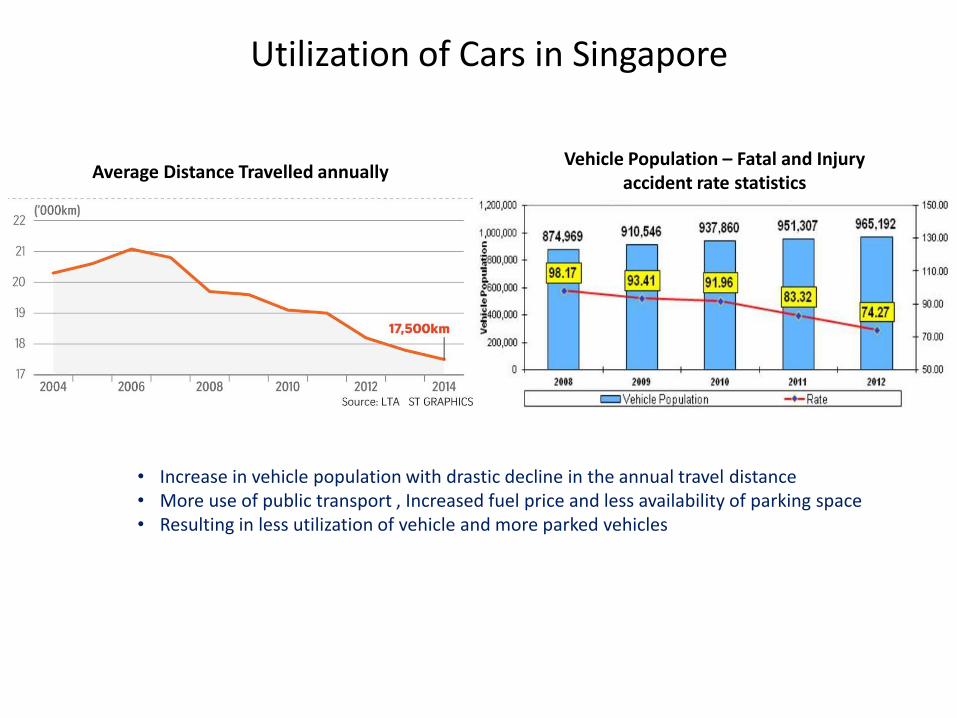
• Increase in vehicle population with drastic decline in the annual travel distance• More use of public transport , Increased fuel price and less availability of parking space• Resulting in less utilization of vehicle and more parked vehicles
Utilization of Cars in Singapore
Average Distance Travelled annuallyVehicle Population – Fatal and Injury
accident rate statistics
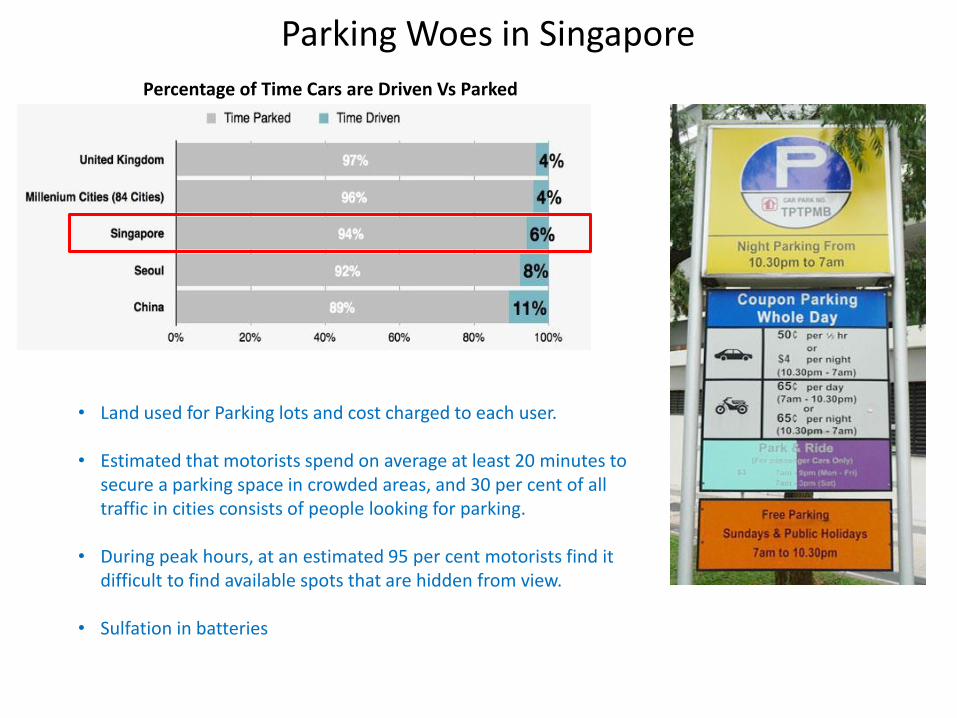
• Land used for Parking lots and cost charged to each user.
• Estimated that motorists spend on average at least 20 minutes to secure a parking space in crowded areas, and 30 per cent of all traffic in cities consists of people looking for parking.
• During peak hours, at an estimated 95 per cent motorists find it difficult to find available spots that are hidden from view.
• Sulfation in batteries
Parking Woes in Singapore
Percentage of Time Cars are Driven Vs Parked

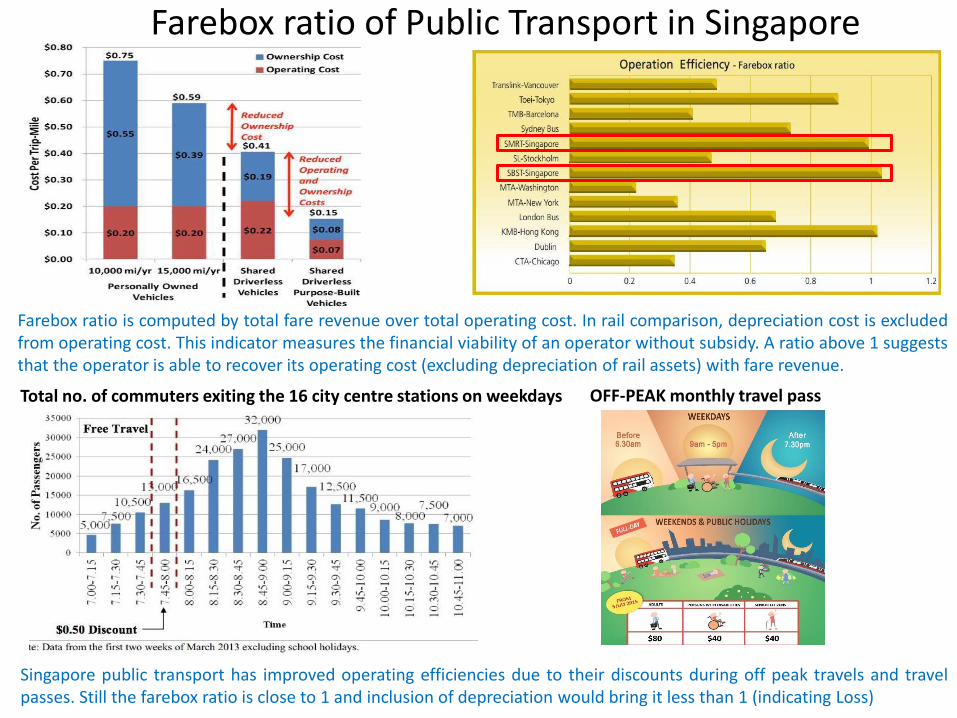
Farebox ratio is computed by total fare revenue over total operating cost. In rail comparison, depreciation cost is excludedfrom operating cost. This indicator measures the financial viability of an operator without subsidy. A ratio above 1 suggeststhat the operator is able to recover its operating cost (excluding depreciation of rail assets) with fare revenue.
Farebox ratio of Public Transport in Singapore
Singapore public transport has improved operating efficiencies due to their discounts during off peak travels and travelpasses. Still the farebox ratio is close to 1 and inclusion of depreciation would bring it less than 1 (indicating Loss)
Total no. of commuters exiting the 16 city centre stations on weekdays OFF-PEAK monthly travel pass
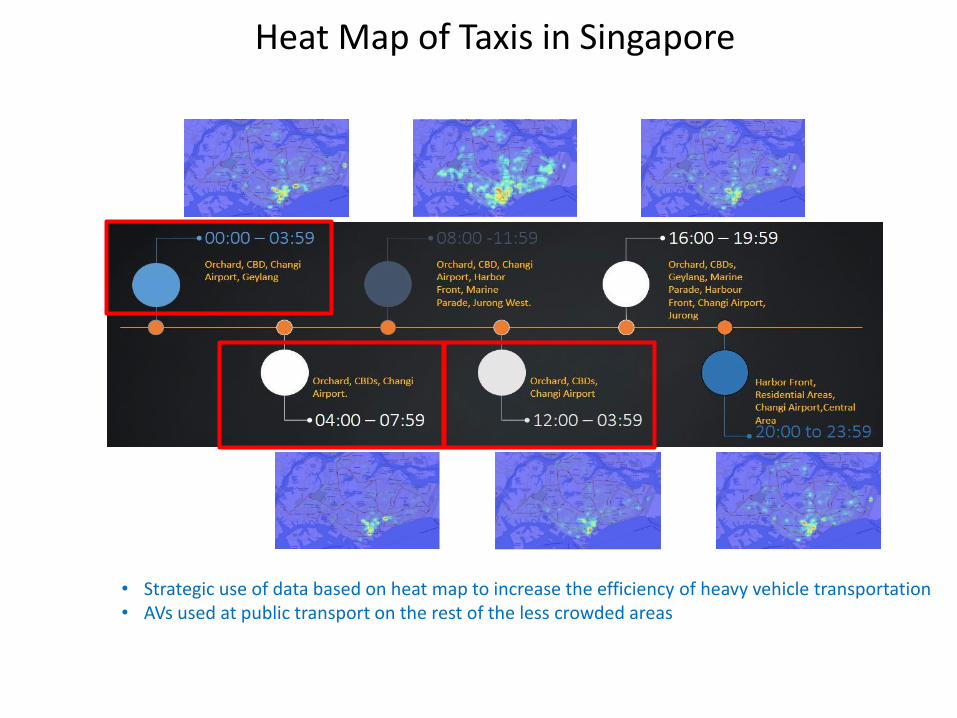
Heat Map of Taxis in Singapore
• Strategic use of data based on heat map to increase the efficiency of heavy vehicle transportation• AVs used at public transport on the rest of the less crowded areas
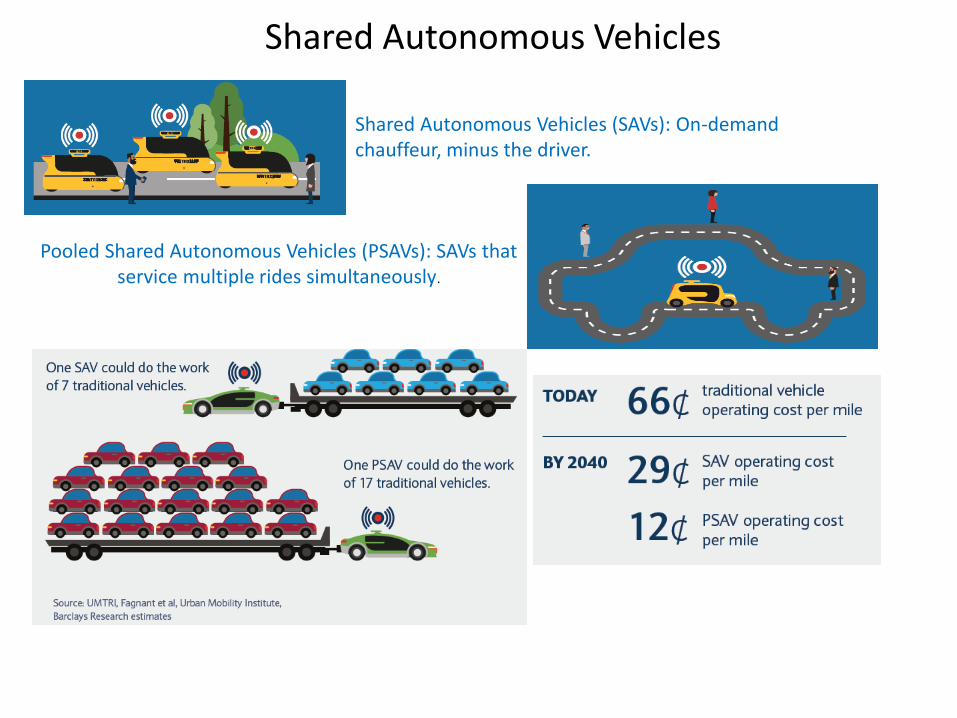
Shared Autonomous Vehicles
Shared Autonomous Vehicles (SAVs): On-demand chauffeur, minus the driver.
Pooled Shared Autonomous Vehicles (PSAVs): SAVs that service multiple rides simultaneously.
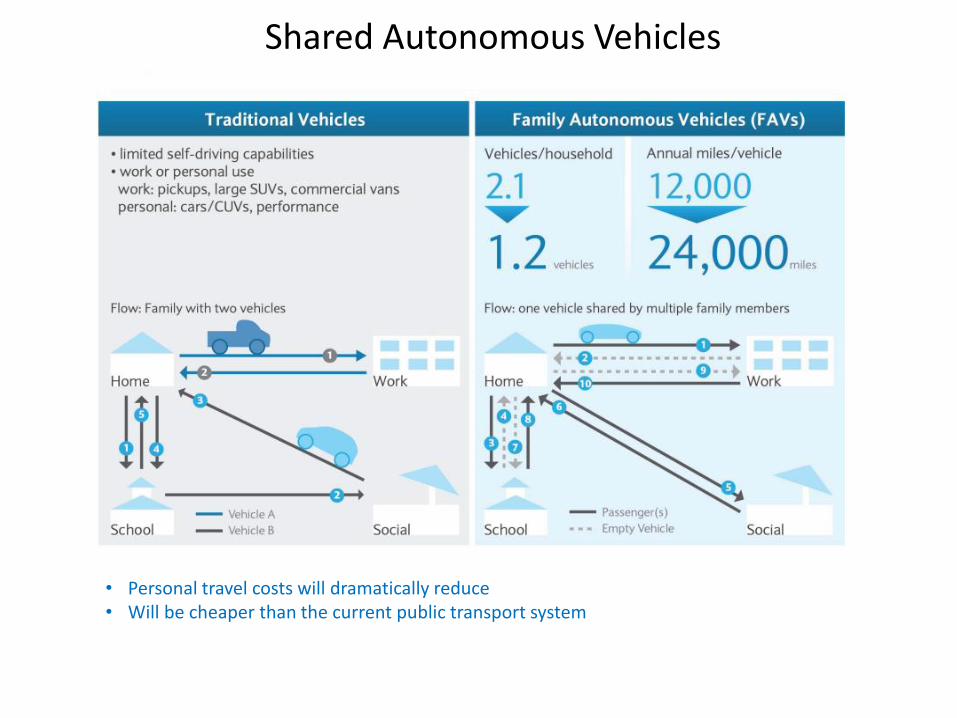
• Personal travel costs will dramatically reduce• Will be cheaper than the current public transport system
Shared Autonomous Vehicles
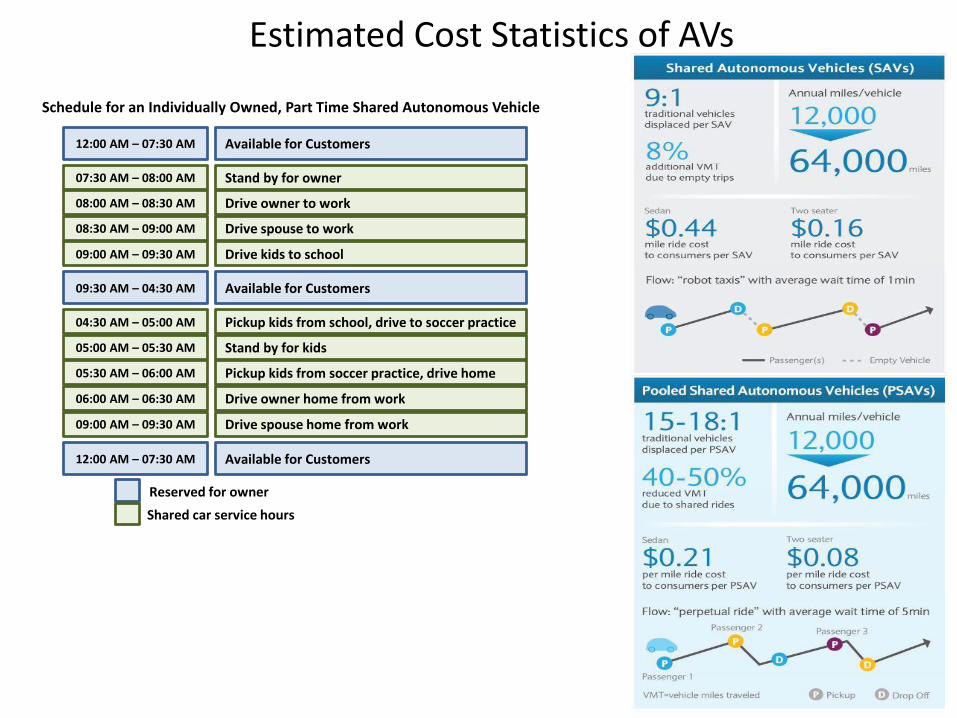
Estimated Cost Statistics of AVs
12:00 AM – 07:30 AM Available for Customers
07:30 AM – 08:00 AM Stand by for owner
08:00 AM – 08:30 AM Drive owner to work
08:30 AM – 09:00 AM Drive spouse to work
09:00 AM – 09:30 AM Drive kids to school
09:30 AM – 04:30 AM Available for Customers
04:30 AM – 05:00 AM Pickup kids from school, drive to soccer practice
05:00 AM – 05:30 AM Stand by for kids
05:30 AM – 06:00 AM Pickup kids from soccer practice, drive home
06:00 AM – 06:30 AM Drive owner home from work
09:00 AM – 09:30 AM Drive spouse home from work
12:00 AM – 07:30 AM Available for Customers
Reserved for owner
Shared car service hours
Schedule for an Individually Owned, Part Time Shared Autonomous Vehicle
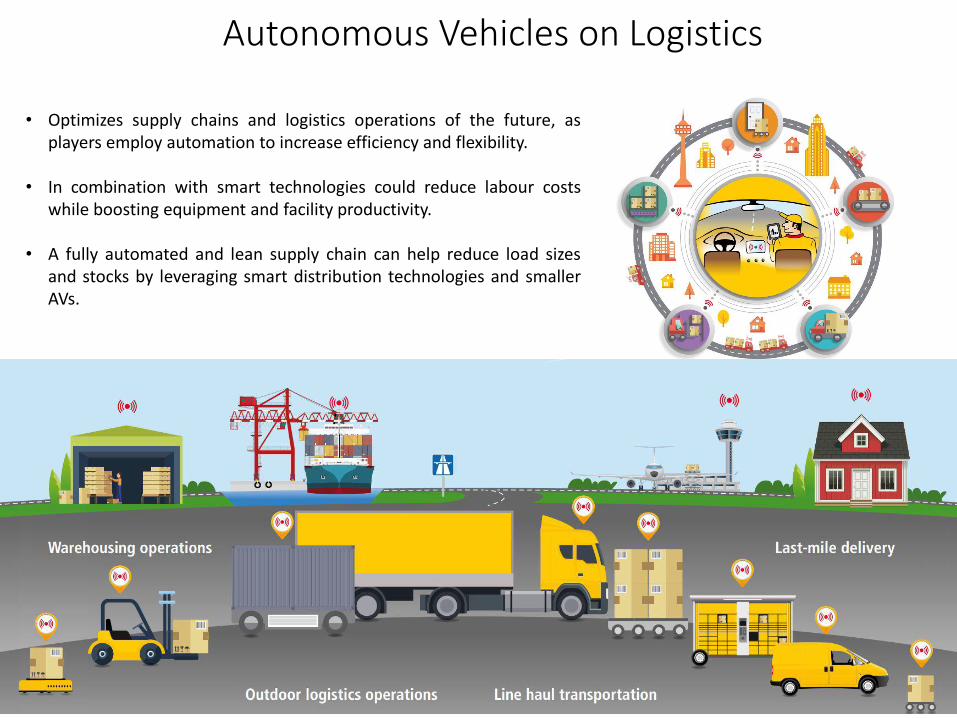
• Optimizes supply chains and logistics operations of the future, asplayers employ automation to increase efficiency and flexibility.
• In combination with smart technologies could reduce labour costswhile boosting equipment and facility productivity.
• A fully automated and lean supply chain can help reduce load sizesand stocks by leveraging smart distribution technologies and smallerAVs.
Autonomous Vehicles on Logistics
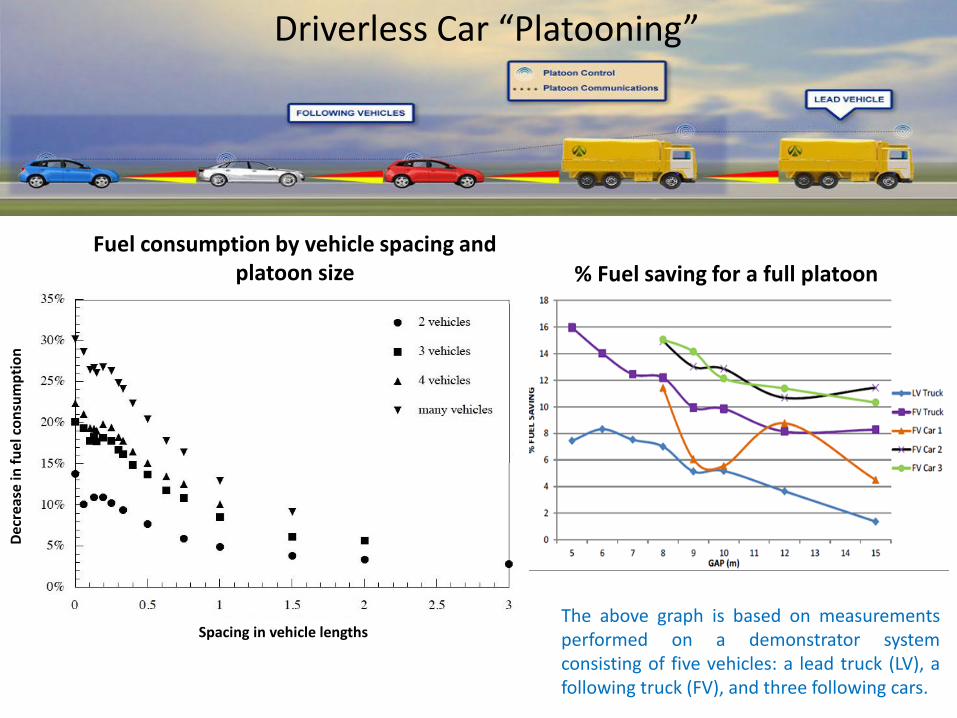
Driverless Car “Platooning”
The above graph is based on measurementsperformed on a demonstrator systemconsisting of five vehicles: a lead truck (LV), afollowing truck (FV), and three following cars.
Fuel consumption by vehicle spacing and platoon size % Fuel saving for a full platoon
Dec
reas
e in
fu
el c
on
sum
pti
on
Spacing in vehicle lengths
Driverless Logistics
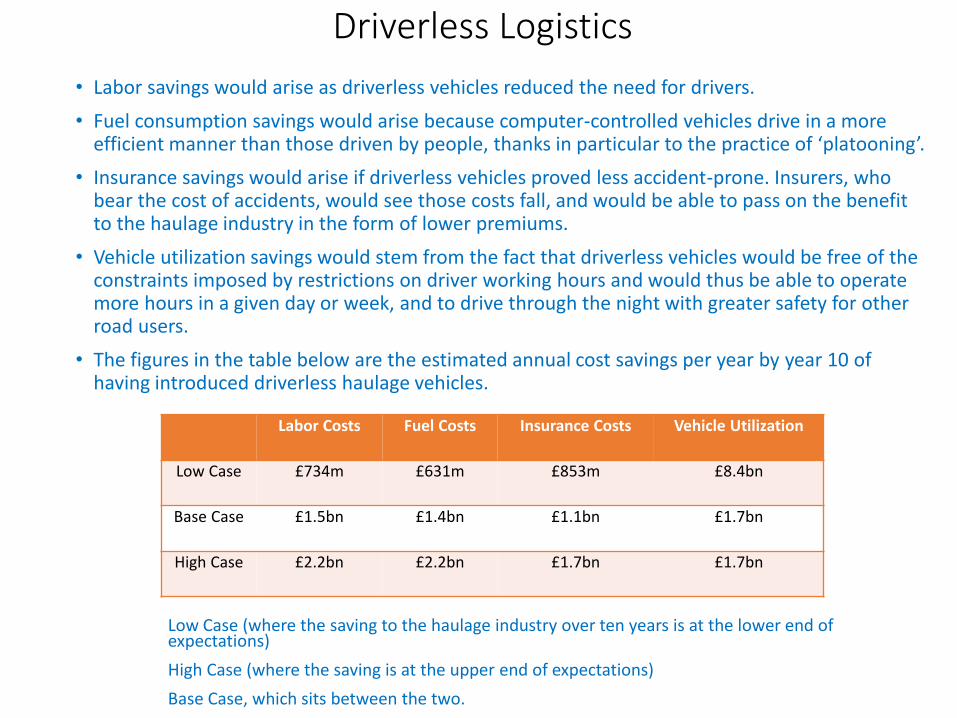
• Labor savings would arise as driverless vehicles reduced the need for drivers.
• Fuel consumption savings would arise because computer-controlled vehicles drive in a more efficient manner than those driven by people, thanks in particular to the practice of ‘platooning’.
• Insurance savings would arise if driverless vehicles proved less accident-prone. Insurers, who bear the cost of accidents, would see those costs fall, and would be able to pass on the benefit to the haulage industry in the form of lower premiums.
• Vehicle utilization savings would stem from the fact that driverless vehicles would be free of the constraints imposed by restrictions on driver working hours and would thus be able to operate more hours in a given day or week, and to drive through the night with greater safety for other road users.
• The figures in the table below are the estimated annual cost savings per year by year 10 of having introduced driverless haulage vehicles.
Low Case (where the saving to the haulage industry over ten years is at the lower end of expectations)
High Case (where the saving is at the upper end of expectations)
Base Case, which sits between the two.
Labor Costs Fuel Costs Insurance Costs Vehicle Utilization
Low Case £734m £631m £853m £8.4bn
Base Case £1.5bn £1.4bn £1.1bn £1.7bn
High Case £2.2bn £2.2bn £1.7bn £1.7bn
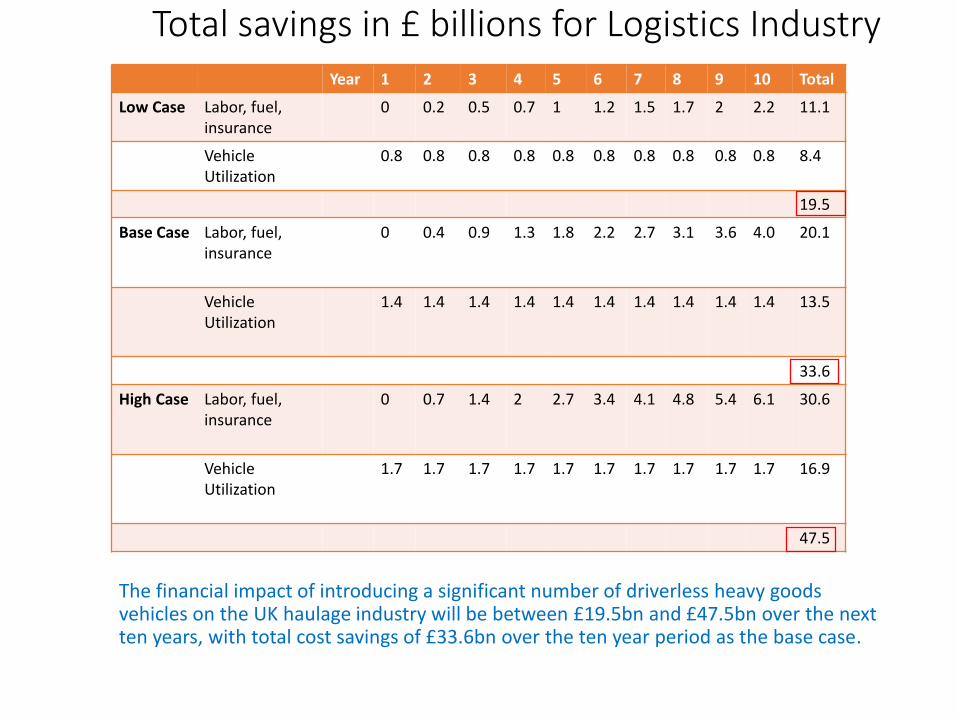
Total savings in £ billions for Logistics IndustryYear 1 2 3 4 5 6 7 8 9 10 Total
Low Case Labor, fuel,insurance
0 0.2 0.5 0.7 1 1.2 1.5 1.7 2 2.2 11.1
VehicleUtilization
0.8 0.8 0.8 0.8 0.8 0.8 0.8 0.8 0.8 0.8 8.4
19.5
Base Case Labor, fuel,insurance
0 0.4 0.9 1.3 1.8 2.2 2.7 3.1 3.6 4.0 20.1
VehicleUtilization
1.4 1.4 1.4 1.4 1.4 1.4 1.4 1.4 1.4 1.4 13.5
33.6
High Case Labor, fuel,insurance
0 0.7 1.4 2 2.7 3.4 4.1 4.8 5.4 6.1 30.6
VehicleUtilization
1.7 1.7 1.7 1.7 1.7 1.7 1.7 1.7 1.7 1.7 16.9
47.5
The financial impact of introducing a significant number of driverless heavy goods vehicles on the UK haulage industry will be between £19.5bn and £47.5bn over the next ten years, with total cost savings of £33.6bn over the ten year period as the base case.

How the Financial Impact of Driverless TechnologyCould Affect The Consumer
• The annual savings from lower fuel, insurance and labor costs (base case) would amount to over half of a person’s weekly retail expenditure or almost one and a half weeks’ worth of groceries.
• In a High Case scenario, the savings roughly equate to a week’s total retail expenditure or two week’s food shopping.
All items Food only
UK retail sales - £bn
Per annum 373.5 151.8
Per week 7.2 2.9
Annual Savings by scenario - £bn
Low Case 2.2 2.2
Base Case 4 4
High Case 6.1 6.1
Annual savings by scenario – as multiple of weekly totals above
Low Case 0.3x 0.8x
Base Case 0.6x 1.4x
High Case 0.9x 2.1x

Opportunities just ahead
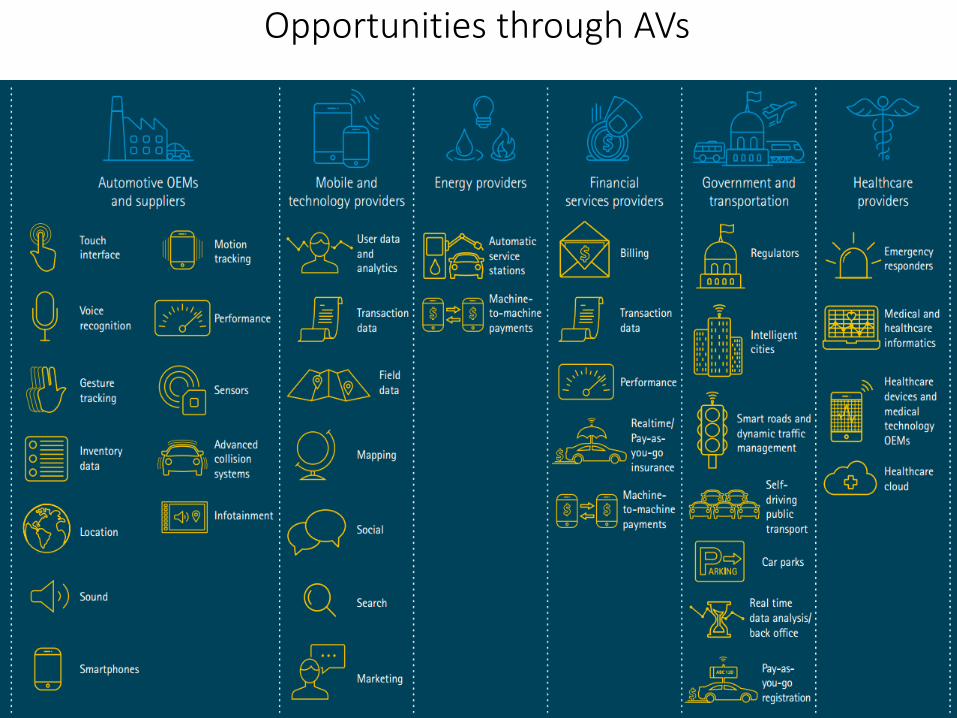
Opportunities through AVs
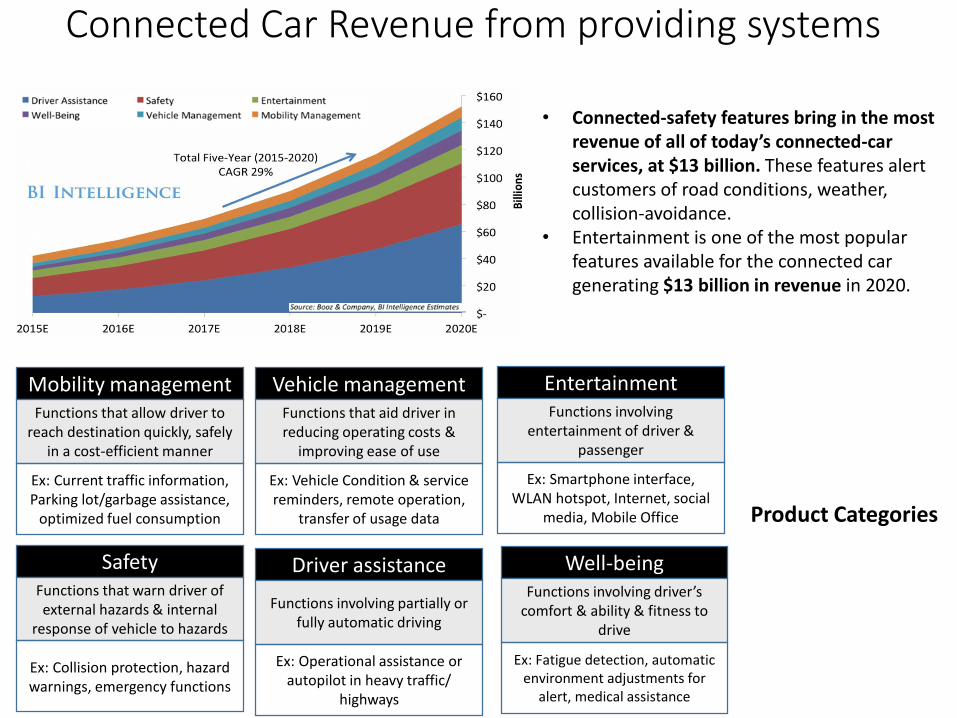
• Connected-safety features bring in the most revenue of all of today’s connected-car services, at $13 billion. These features alert customers of road conditions, weather, collision-avoidance.
• Entertainment is one of the most popular features available for the connected car generating $13 billion in revenue in 2020.
Connected Car Revenue from providing systems
Mobility managementFunctions that allow driver to
reach destination quickly, safely in a cost-efficient manner
Ex: Current traffic information, Parking lot/garbage assistance,
optimized fuel consumption
Vehicle managementFunctions that aid driver in reducing operating costs &
improving ease of use
Ex: Vehicle Condition & service reminders, remote operation,
transfer of usage data
EntertainmentFunctions involving
entertainment of driver & passenger
Ex: Smartphone interface, WLAN hotspot, Internet, social
media, Mobile Office
SafetyFunctions that warn driver of external hazards & internal
response of vehicle to hazards
Ex: Collision protection, hazard warnings, emergency functions
Driver assistance
Functions involving partially or fully automatic driving
Ex: Operational assistance or autopilot in heavy traffic/
highways
Well-beingFunctions involving driver’s
comfort & ability & fitness to drive
Ex: Fatigue detection, automatic environment adjustments for
alert, medical assistance
Product Categories
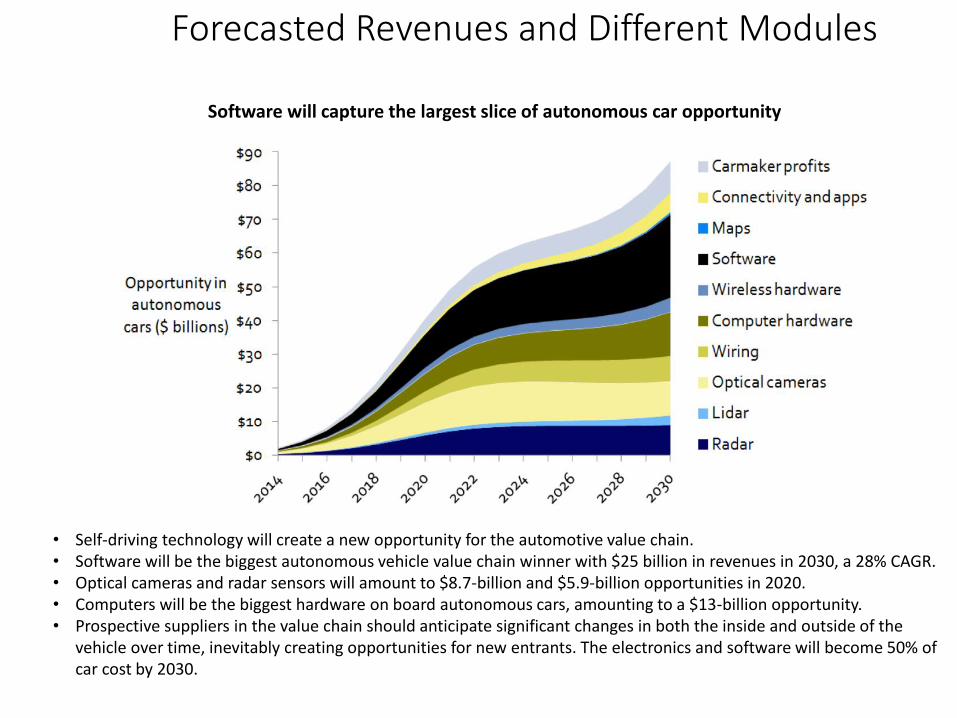
• Self-driving technology will create a new opportunity for the automotive value chain. • Software will be the biggest autonomous vehicle value chain winner with $25 billion in revenues in 2030, a 28% CAGR. • Optical cameras and radar sensors will amount to $8.7-billion and $5.9-billion opportunities in 2020. • Computers will be the biggest hardware on board autonomous cars, amounting to a $13-billion opportunity. • Prospective suppliers in the value chain should anticipate significant changes in both the inside and outside of the
vehicle over time, inevitably creating opportunities for new entrants. The electronics and software will become 50% of car cost by 2030.
Software will capture the largest slice of autonomous car opportunity
Forecasted Revenues and Different Modules
Val
ue
Val
ue
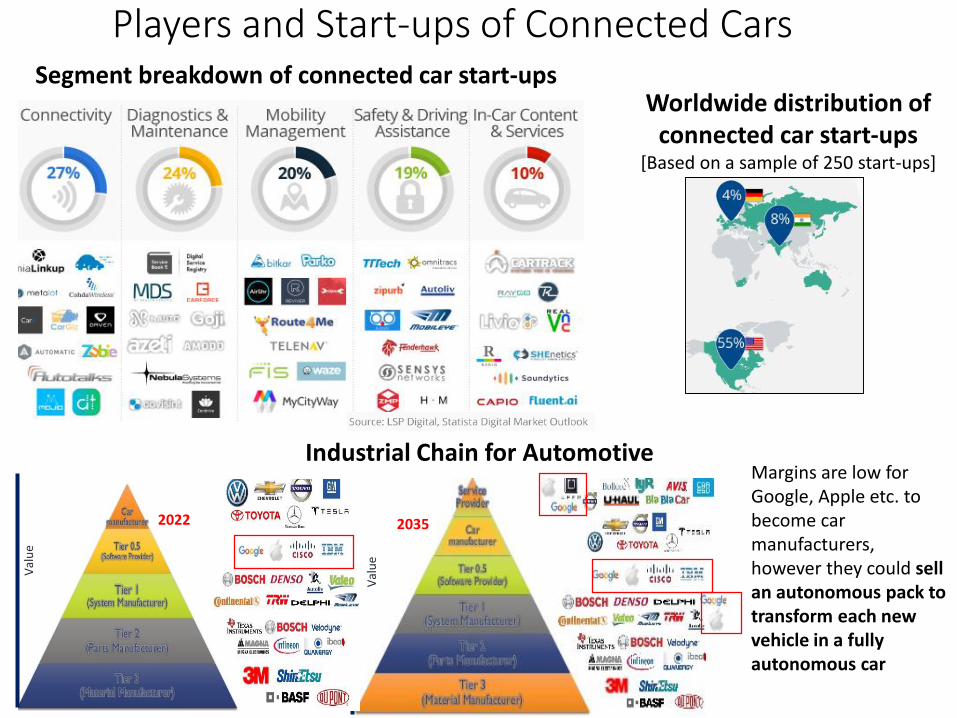
Players and Start-ups of Connected Cars
Worldwide distribution of connected car start-ups
[Based on a sample of 250 start-ups]
Segment breakdown of connected car start-ups
Industrial Chain for Automotive
2022 2035
Margins are low for Google, Apple etc. to become car manufacturers, however they could sell an autonomous pack to transform each new vehicle in a fully autonomous car
References1. M. Gerla; E. K. Lee; G. Pau; U. Lee, “Internet of vehicles: From intelligent grid to autonomous cars and vehicular clouds”,
IEEE World Forum on Internet of Things (WF-IoT), 2014, On page(s): 241– 246
2. Falchetti, Angelo; Azurdia-Meza, Cesar; Cespedes, Sandra "Vehicular cloud computing in the dawn of 5G", Electrical, Electronics Engineering, Information and Communication Technologies (CHILECON), 2015 CHILEAN Conference on, On page(s): 301 – 305
3. De Felice, M.; Calcagni, I.V.; Pesci, F.; Cuomo, F.; Baiocchi, A. "Self-Healing Infotainment and Safety Application for VANET dissemination", Communication Workshop (ICCW), 2015 IEEE International Conference on, On page(s): 2495 - 2500
4. Cogill, R.; Gallay, O.; Griggs, W.; Chungmok Lee; Nabi, Z.; Ordonez, R.; Rufli, M.; Shorten, R.; Tchrakian, T.; Verago, R.; Wirth, F.; Zhuk, S. "Parked cars as a service delivery platform", Connected Vehicles and Expo (ICCVE), 2014 International Conference on, On page(s): 138 - 143
5. http://www.strategyand.pwc.com/reports/connected-car-2015-study
6. http://zackkanter.com/2015/01/23/how-ubers-autonomous-cars-will-destroy-10-million-jobs-by-2025/
7. http://www.cbronline.com/news/internet-of-things/m2m/autonomous-driverless-connected-cars-where-are-smart-iot-cars-taking-us-4759452
8. http://blog.bosch-si.com/categories/mobility/2013/06/connected-cars-whats-in-store/
9. http://articles.sae.org/13081/
10. http://www.infinitumstore.com/articles/cars-are-parked-95-of-the-time-how-this-affects-you
11. http://robotenomics.com/2014/02/26/morgan-stanley-the-economic-benefits-of-driverless-cars/
12. http://ec.europa.eu/transport/themes/strategies/doc/2011_white_paper/white_paper_2011_ia_full_en.pdf
13. A Report by AXA, “The Future of Driverless Haulage, ” September 2015 [Online]. Available: http://www.axa.co.uk/uploadedFiles/Content/Newsroom/Media_Resources/Reports_and_Publications/PDF_files/The%20Future%20of%20Driverless%20Haulage(1).pdf.
14. https://wiki.smu.edu.sg/1213t2is415g1/IS415_201213_Term2_Assign2_Anthony_Sugiarto
15. http://www.smarteranalyst.com/2015/05/28/barclays-and-goldman-sachs-weigh-in-will-tesla-motors-inc-tsla-or-google-inc-goog-win-the-self-driving-car-race/
16. http://www.lta.gov.sg/ltaacademy/doc/J14Nov_p05Tan_AVnextStepSingapore.pdf